

Abstract
Methamphetamine (METH), an addictive stimulant of neurotransmitters, is associated with cardiovascular and neurological diseases. METH-induced ophthalmic complications are also present but have been insufficiently investigated. The purpose of this study is to investigate the retinal effects of METH. C57BL/6 mice were administrated progressively increasing doses of METH (0 to 6 mg/kg) by repetitive intraperitoneal injections for 5 days (4 times per day). Retinal degeneration was examined by morphological changes and terminal deoxynucleotidyl transferase deoxyuridine triphosphate nick end labeling (TUNEL) assay. Norepinephrine levels were measured by ELISA, protein expression levels were determined by immunoblot and immunostaining, and gelatinase activity was examined by zymography. The thickness of the retina and the number of nuclei in the inner and outer nuclear layers were decreased by METH. Retinal cell death and astrocyte activation by METH treatment were confirmed by TUNEL assay and glial fibrillary acidic protein expression, respectively. Increased tumor necrosis factor-α protein in the retina and elevated norepinephrine levels in plasma were found in METH-treated mice. Platelet endothelial cell adhesion molecule-1 (PECAM-1) protein expression level was decreased in the retina and central retinal artery (CRA) by METH treatment, along with the endothelial proteoglycans glypican-1 and syndecan-1. Moreover, a regulator of the extracellular matrix, matrix metalloproteinase-14 (MMP-14) in the retina, and MMP-2 and MMP-9 in plasma, were increased by METH treatment. In conclusion, METH administration is involved in retinal degeneration with a vascular loss of PECAM-1 and the glycocalyx in the CRA and retina, and an increase of MMPs.
Keywords: Methamphetamine, endothelium, glycocalyx, matrix metalloproteinases
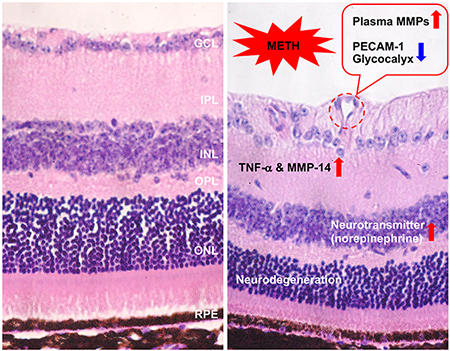
Graphical Abstract
1. Introduction
Methamphetamine (N-methyl-1-phenylpropan-2-amine, METH) is a potent stimulant of the central nervous system (CNS) with a release of high concentrations of neurotransmitters including dopamine, serotonin, norepinephrine, gamma-aminobutyric acid, and glutamate (Kuczenski et al., 1995; Rothrock et al., 1988; Sulzer et al., 2005). Desoxyn®, the commercial drug name for METH, was approved for use in the treatment of attention-deficit hyperactivity disorder and obesity in 2014; however, increased neurotransmitters with METH administration are associated with an induction of euphoria leading to addiction (Kiyatkin and Sharma, 2016; Riddle et al., 2006). This powerful and often abused psychostimulant is produced and distributed in the US illicitly (Ahrnsbrak et al., 2017). In 2016, 0.7 million people aged 12 and older in the US were estimated to be current users of METH, and 684,000 people aged 12 and older had METH-induced disorders (Ahrnsbrak et al., 2017) involving neurodegenerative diseases, believed to be via neuronal cell death induced by excessive neurotransmitters (Cadet, 2002; Kiyatkin and Sharma, 2016; Riddle et al., 2006; Sajja et al., 2016).
Blood barriers, such as the blood-brain barrier, blood-spinal cord barrier, and blood-retinal barrier play an important role in the protection of these tissues from potential toxic substances by regulation of permeability from blood plasma into tissues. METH intoxication in vivo and administration in vitro has shown blood-brain barrier disruption, and METH-induced leakage of barriers has been documented in the structural damage of brain and spinal cord cells (Kiyatkin and Sharma, 2016). The endothelial cells in blood vessels form a blood barrier through proteins including platelet endothelial cell adhesion molecule-1 (PECAM-1) (Privratsky and Newman, 2014), occludin and ZO-1 (Ballabh et al., 2004; Sajja et al., 2016), and the glycocalyx (Becker et al., 2010). Breakdown of the blood barrier induced by various stressful conditions such as hypoxia in smoking, hyperglycemia in diabetes, and damage in ischemia increases permeability resulting in leakage and altered regulation of metabolic substances (Sajja et al., 2016; Xu and Le, 2011). Thus, damage of endothelial surface molecules by METH could contribute to METH-induced neurodegenerative disease.
METH-induced ophthalmic complications including corneal ulceration (Chuck et al., 1996), keratitis (Poulsen et al., 1996), retinal vasculitis (Shaw et al., 1985), and retinopathy (Lai et al., 2009; Rodrigues et al., 2004; Yang et al., 2018) have been insufficiently investigated. We hypothesized that METH administration to C57BL/6 mice would develop pathologies, similar to those in humans, in the retina and in the feeding central retinal artery (CRA). Among the pathologies investigated were endothelial surface degradation, elevations in matrix metalloproteinases (MMPs), neuronal degeneration, and glial cell activation. If these pathologies occur in the mouse, this model may provide utility in future investigations of mechanisms responsible for METH-induced retinal injury that can be translated into potential treatment strategies.
2. Materials and methods
2.1. Animals and drug treatment
C57BL/6 male mice (8 weeks old, Jackson Laboratory, Raleigh, NC) were used. All animals were treated in accordance with the Association for Research in Vision and Ophthalmology Statement for the Use of Animals in Ophthalmic and Vision Research. The animal protocol was approved by the Animal Care and Use Committee at LSU Health Sciences Center in Shreveport (S-19-004). The animals were housed in cages with free access to food and water. Temperature and humidity in the animal facility were controlled at 23±1°C and 53±15%, respectively. The mice received repetitive intraperitoneal doses (4 times per day) with progressively increasing doses of METH (0-6 mg/kg) or bacteriostatic saline as a vehicle in a similar method to that described previously to model human use patterns: day 1: 0 mg/kg; day 2: 1-2 mg/kg; day 3: 3-4 mg/kg; day 4: 5 mg/kg; and day 5: 6 mg/kg (Kesby et al., 2018). The mice were anesthetized by pentobarbital (50 mg/kg) and ketamine (50 mg/kg) within 30 min after the last METH injection. After the final injection of METH, total body weights of mice in both saline- and METH-treated groups were slightly decreased, but not significantly (Table 1). No mice died during the experimental protocol.
Table 1.
Animal information
| Group | Body weight (g) | Number | ||
|---|---|---|---|---|
| Day 0 | Day 5 | Day 0 | Day 5 | |
| Saline | 27.7±1.8 | 26.9±1.8 | 10 | 10 |
| METH | 28.1±1.5 | 26.8±1.9 | 10 | 10 |
2.2. Electroretinogram (ERG)
For dark-adapted ERG measurements, mice were placed in a light-proof dark room overnight. Prior to the measurement, the mice were anesthetized by intraperitoneal injection of ketamine hydrochloride (30 mg/kg) and xylazine hydrochloride (15 mg/kg) and pupils were dilated with eyedrop solutions of 1% atropine sulfate, 2.5% phenylephrine hydrochloride, and 0.5% proparacaine hydrochloride. The eyes were hydrated by Hypromellose (2.5%). Body temperature was maintained at 37°C with a heated pad during the recording, with the ERG protocol performed in the dark room with a dim red light. Visual function was tested by the International Society for Clinical Electrophysiology of Vision standard protocol with a full-field flash ERG system (OcuScience HMsERG, Henderson, NV), according to the manufacturer’s protocol. The amplitudes of the b-wave were defined as the trough of the a-wave to the peak of the b-wave.
2.3. Tissue preparation
Before the mice were sacrificed, blood was collected in a heparin-coated syringe, and the eye was immediately enucleated. Plasma was separated by centrifugation at 5,000 rpm for 10 min at 4°C, and kept at −80°C until used. One eye was washed by phosphate-buffered saline and the retina and optic nerve were collected separately. Each tissue was lysed by RIPA buffer (Thermo Fisher Scientific, Waltham, MA) for preparation of whole protein lysates. After incubation on ice for 20 min, and centrifugation at 10,000g for 20 min, the supernatant was collected and kept at −80°C until used. The other eye was fixed in 4% formalin (v/v) and embedded in paraffin. The optic nerve including CRA from the level of the sclera was fixed in 4% formalin (v/v) and embedded in paraffin. The tissue blocks were cut vertically at 6 μm with a microtome (Leica, Buffalo Grove, IL).
2.4. Hematoxylin & eosin stain
After deparaffinization and rehydration, tissue sections were incubated with hematoxylin solution (Thermo Fisher Scientific) for 3 min. After washing in running water, the sections were stained in eosin (Thermo Fisher Scientific) for 3 min and then dehydrated by ethanol. The stained tissue was mounted using mounting solution (Thermo Fisher Scientific) and observed with a Nikon light microscope (Nikon, Tokyo, Japan). For analysis of retinal thickness, central sagittal retinal sections that transected the optic nerve were selected from 5 mice of each group.
2.5. Terminal deoxynucleotidyl transferase deoxyuridine triphosphate (dUTP) nick end labeling (TUNEL) assay
Retinal cell death was detected by TUNEL assay using Click-iT™ Plus TUNEL Assay kit (Thermo Fisher Scientific), according to the manufacturer’s protocol. Briefly, retinal tissue was permeabilized with Proteinase K solution after deparaffinization, and incubated with terminal deoxynucleotidyl transferase for one hour at 37°C for modification of fragmented DNA with ethynyl dUTP including bio-orthogonal alkyne moieties. Then, the modified DNA break was detected by reaction of a copper catalyzed covalent reaction between an Alexa Fluor™ picolyl azide dye and an alkyne under fluorescent microscopy (Nikon).
2.6. Norepinephrine measurement
The levels of norepinephrine in plasma were measured using an ELISA kit (Abnova, Walnut, CA), according to the manufacturer’s protocol. Two hundred microliters of plasma were used for the extraction step, and then the extract was incubated in a coated 96-well plate for 2 h. Following incubation with norepinephrine anti-serum for 1 h, the plate was incubated with substrate for 30 min. The reaction was stopped by 25 mM hydrochloric acid and the absorbance was detected using a microplate reader at 450 nm.
2.7. Immunoblot analysis
Protein concentrations in the supernatants were determined by bicinchoninic acid assay (Thermo Fisher Scientific), and aliquots of protein were separated by sodium dodecyl sulfate-polyacrylamide gel electrophoresis (SDS-PAGE) and transferred onto a nitrocellulose membrane. Total protein in the membrane was stained with REVERT Total Protein Stain Kit (LI-COR Biosciences, Lincoln, NE) and detected by a ChemiDoc Image acquisition system (Bio-Rad, Hercules, CA). The membrane was then blocked with protein free T20 blocking solution (Thermo Fisher Scientific) for 1 h. The membranes were incubated with primary antibodies (Table 2). The blots were treated with horseradish peroxidase-conjugated anti-rabbit IgG or anti-mouse IgG secondary antibody for 2 h, and immune complexes were detected using Clarity western enhanced chemiluminescence substrate (Bio-Rad). Densitometric analysis of the data obtained from at least three independent experiments was performed using a ChemiDoc Image acquisition system and ImageJ (v1.51, NIH, Bethesda, MD). Relative levels of protein expression were normalized with loading controls, β-actin or total protein level, as provided in figure legends. Tumor necrosis factor (TNF)-α, PECAM-1, glypican-1, and MMPs were normalized with β-actin, which was detected from the same membrane after stripping and reblotting. Glial fibrillary acidic protein (GFAP), α-smooth muscle actin (SMA), and syndecan-1 were normalized to total protein levels, which were detected the from same membrane before incubation with blocking solution. Retinal GFAP, α-SMA, syndecan-1, and MMP-2 and MMP-14 were detected from the same membrane.
Table 2.
List of antibodies
| Antibody | Host | Company | Dilution |
|---|---|---|---|
| TNF-α | Rabbit | Bioss Antibodies | 1:500 |
| 1:200* | |||
| GFAP | Mouse | Cell signaling | 1:1,000 |
| PECAM-1 | Rabbit | Santa cruz | 1:500 |
| α-SMA | Mouse | Sigma-Aldrich | 1:1,000 |
| Glypican-1 | Mouse | Santa cruz | 1:500 |
| 1:200* | |||
| Syndecan-1 | Rabbit | Abcam | 1:1,000 |
| 1:500* | |||
| MMP-2 | Rabbit | Abcam | 1:1,000 |
| 1:500* | |||
| MMP-9 | Rabbit | Abcam | 1:1,000 |
| 1:500* | |||
| MMP-14 | Rabbit | Millipore | 1:500 |
| 1:200* | |||
| β-actin | Mouse/Rabbit | Sigma-Aldrich | 1:5,000 |
| Lectin | N/A | Vector Laboratories | 1:500* |
Dilution factor for immunostain
2.8. Immunofluorescence analysis
After deparaffinization and rehydration, tissue sections were permeabilized by 0.5% Triton X-100 in phosphate-buffered saline for 10 min and blocked with 5% goat serum and 0.3% bovine serum albumin in Tris-buffered saline with Tween 20 (TBST) for 1 h. The sections were then incubated in primary antibody (Table 2) for 16 h at 4°C, and in secondary antibody for 1 h at room temperature, sequentially. After washing three times in TBST, sections were mounted with Fluoromount-G (SouthernBiotech, Birmingham, AL) mounting solution containing 4’-6’-diamidino-2-phenylinodole (DAPI), and fluorescent signals were captured with a Nikon fluorescent microscope (Nikon).
2.9. Gelatin zymography
MMP activities in the plasma were assessed using a gelatin zymography assay described previously (Eshaq and Harris, 2019). Briefly, equal amounts of plasma samples prepared in Zymogram Sample Buffer (Bio-Rad) were separated by SDS-PAGE with 1% gelatin-containing gel. The gel was incubated with Zymogram Renaturation Buffer (Bio-Rad) for 2 h at room temperature and then further incubated in Zymogram Development Buffer (Bio-Rad) overnight at 37°C. The gel was stained with Coomassie Brilliant Blue R-250 (Sigma-Aldrich). After destaining, the digested substrate area in the gel was captured and quantified using Image acquisition system and ImageJ, respectively.
2.10. Statistics
Statistical analyses were performed using GraphPad Prism (GraphPad, La Jolla, CA) software. Student t-tests were used compare the group means. All data are presented as mean ± standard error, with *P < 0.05 considered statistically significant.
3. Results
3.1. The effect of METH on retinal neurodegeneration
After METH administration for 4 days, retinal function in METH-treated mice (N=4) and in vehicle controls (saline; N=5) was tested in an ERG protocol in both dark- and light-adapted conditions. As shown in Figure 1, amplitudes of a and b waves in dark-adapted (Fig 1A, C, and D) and light-adapted (Fig 1B, E, and F) mice were not statistically significant between groups, despite a tendency towards a METH-induced decrease in light-adapted conditions. However, following 4 days of METH administration, H&E staining of retinal tissue revealed a decreased thickness of the retina (Fig 2A). We measured the thickness of the whole retina from the outer segment (OS) to the ganglion cell layer (GCL), including the outer nuclear layer (ONL), outer plexiform layer (OPL), inner nuclear layer (INL), and inner plexiform layer (IPL), every 500 µm from the optic nerve head, and compared METH-treated mice with controls. The thicknesses of the whole retina (Fig 2B), ONL (Fig 2C), OPL (Fig 2D), INL (Fig 2E), and IPL (Fig 2F) were significantly decreased by METH treatment, indicating retinal degeneration by METH treatment. Plasma levels of norepinephrine, which is a neurotransmitter converted from dopamine by β-monooxygenase (Musacchio, 1975), was measured by ELISA. Compared with saline controls, plasma norepinephrine levels (Table 3) were increased by METH administration (P < 0.001, n=5).
Figure 1.
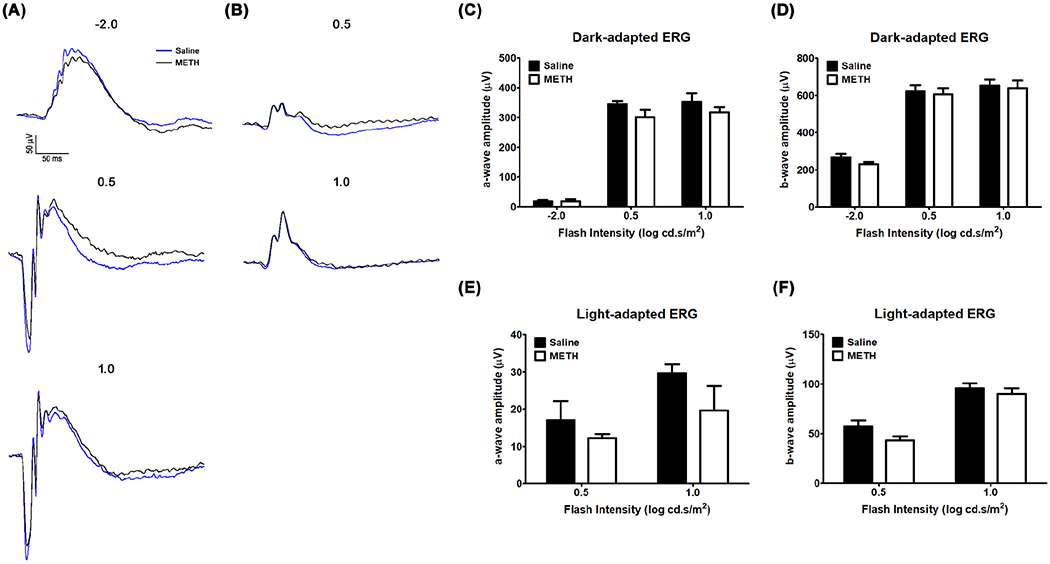
The effect of METH on the retina. Visual function was recorded by dark-adapted (A) and light-adapted (B) ERG protocols with light intensity values given in log candela second per square meter (cd.s/m2). The amplitudes of a and b waves for dark-adapted and light-adapted protocols are provided in panels (C) and (D), respectively. N=5 (Saline) and N=4 (METH).
Figure 2.
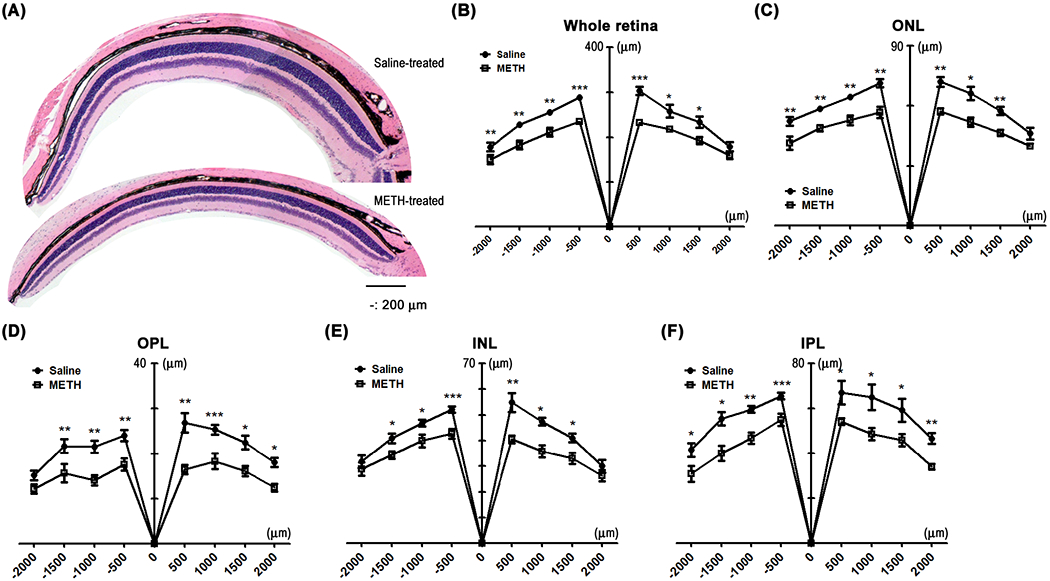
The effect of 4-day administration of METH on the retina. The fixed eyes were stained with hematoxylin and counterstained with eosin (A, scale bar = 200 μm). The thickness of whole retina (B), ONL (C), OPL (D), INL (E), and IPL (F) were measured by ImageJ. Numbers on the x-axis indicate distance from the optic nerve head. *P < 0.05, **P < 0.01, and ***P < 0.001 vs saline; N = 5.
Table 3.
Plasma level of norepinephrine
| Group | Norepinephrine (ng/mL) |
|---|---|
| Saline (n=5) | 1.15±0.58 |
| METH (n=5) | 4.83±1.10*** |
P<0.001
To further identify whether the decrease of retinal thickness is caused by retinal cell death, we counted the number of retinal nuclei in a vertical line through the ONL and INL, and examined cell death using a TUNEL assay. The average number of nuclei in a line through the ONL (21±3) and INL (10±2) were significantly reduced by METH treatment (13±2 in ONL and 7±1 in INL, P < 0.05, Fig 3A and B). TUNEL-positive cells (green in Fig 3C) were detectable in the retinal pigment epithelium (RPE), ONL, INL, and GCL of the METH-treated retinas, indicating that the retinal thickness changes with METH treatment is caused by cell death.
Figure 3.
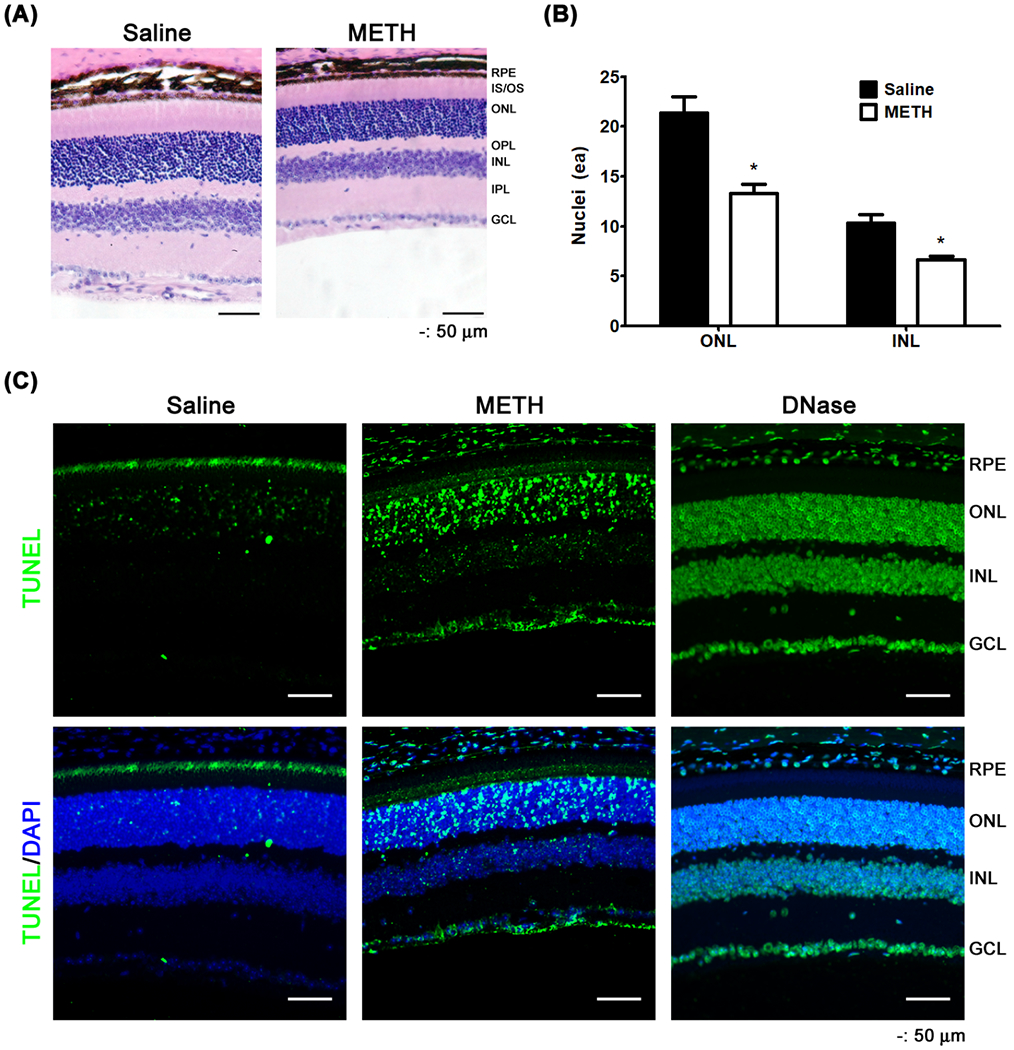
The effect of METH on retinal cell death. Nuclei in the ONL and INL of the retina were counted by ImageJ (A and B, scale bar = 50 μm). *P < 0.05 vs saline; N = 5. Cell death was detected by TUNEL assay (C, scale bar = 50 μm).
An initiator of cell death signaling in the retina is TNF-α. Using an immunoblot assay, the protein expression of the membrane form of TNF-α (26 kDa) was found to be elevated in the METH-treated retina (Fig 4A and B, P < 0.01, n=3). Immunostaining for TNF-α in the retina demonstrated increased immunoreactivity (red in Fig 4C) of TNF-α in the plexiform layers, specifically with strong signals in retinal cell bodies. The immunoreactivity of TNF-α in the retina was also detectable in the vascular wall counterstained with griffonia simplicifolia lectin-1 (GSL-1; Fig 4D).
Figure 4.
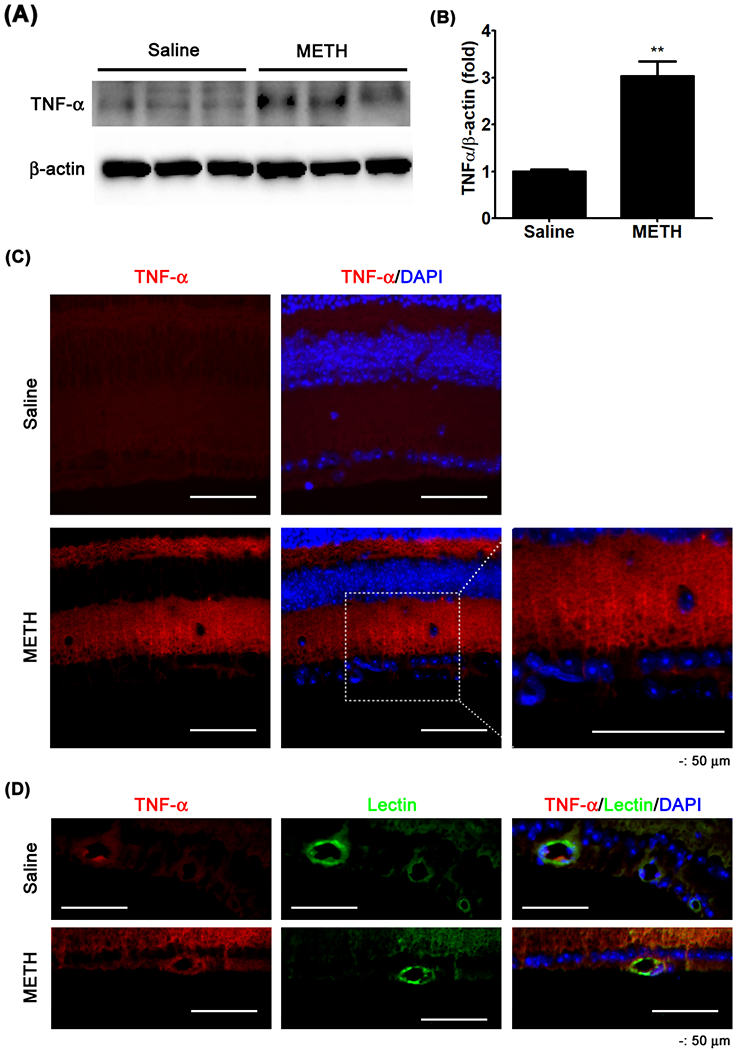
The effect of METH on protein expression of TNF-α in the retina. The membrane form of TNF-α expression in the retina was examined by immunoblot (A). The relative protein expression levels of TNF-α were normalized to β-actin expression using ImageJ (B). **P < 0.01 vs saline; N = 3. Cross-sections (C and D) of the retina were immunostained for TNF-α. GSL-1 lectin and DAPI were used for counter-staining of the vessel wall and cell nuclei, respectively. Scale bar, 50 μm.
3.2. Activation of astrocytes in the retina
Upon injury to a neuronal network, astrocytes, a subtype of glial cells, are activated and contribute to neuronal repair. This activation is often assayed by an increase in the expression of GFAP. To assess the extent of this activation induced by METH, we performed immunoblotting and immunostaining of GFAP in the retina. In METH-treated mice, the relative GFAP protein expression was not changed in the optic nerve compared to controls (Fig 5A and C, n=5); however, METH significantly increased the relative GFAP protein expression in the retina (Fig 5B and C, P < 0.001, n=5). The increased GFAP induced by METH was detected in the GCL of retinal flatmounts (Fig 5D) and cross-sections (Fig 5E), without an increase in the optic nerve (Fig 5F).
Figure 5.
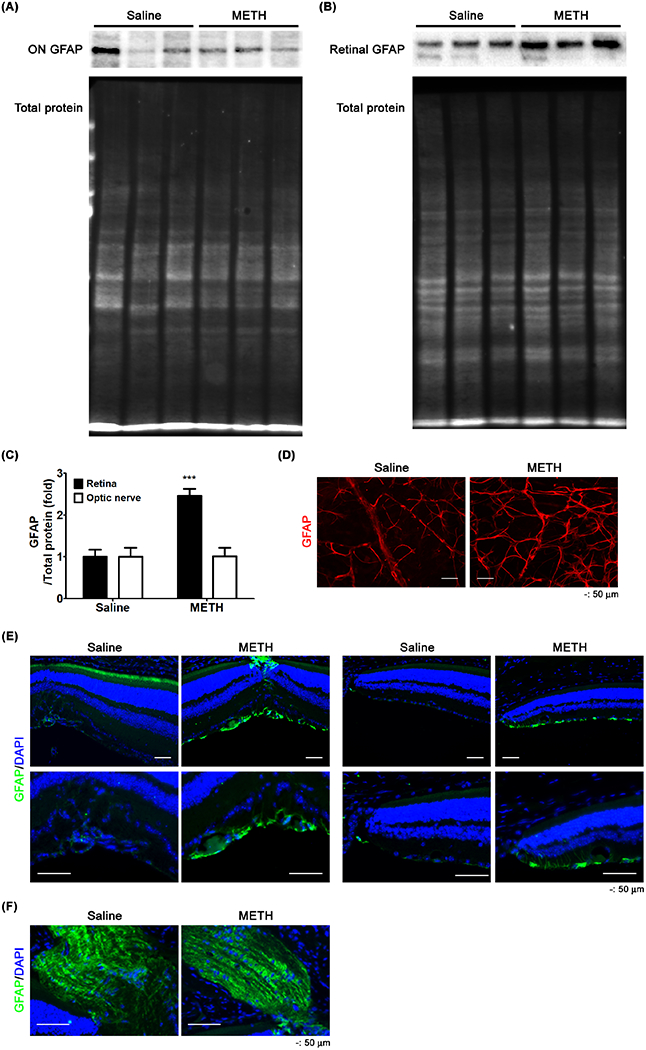
The effect of METH on the expression of GFAP. GFAP protein expression in the optic nerve (ON, A) and retina (B) were examined by immunoblot. The relative protein expression levels of GFAP were normalized to total protein level using ImageJ (C). ***P < 0.001 vs saline; N = 5. Retinal whole flatmounts (D) and cross-sections of the retina (E) and optic nerve (F) were immunostained for GFAP. DAPI was used for counter-staining of cell nuclei. Scale bar, 50 μm.
3.3. The effect of METH on the retinal vascular endothelial proteins
To identify the effect of METH on the retinal vasculature, we examined the expression of endothelial PECAM-1 and α-SMA by immunoblot analysis. METH treatment did not show any effect on the relative protein expression of α-SMA in the retina (Fig 6A and B). However, the relative protein expression level of PECAM-1 (Fig 6A and C) was significantly decreased by >60% in METH-treated mice, compared with control mice (P < 0.001, n=5). To identify the locations of PECAM-1 loss in the retina, retinal tissues were immunostained. The whole retinal flatmount (Fig 6D) showed that PECAM-1 immunoreactivity (red) in the blood vessels counter-stained with GSL-1 lectin (green) was reduced by METH treatment. In retinal cross-sections (Fig 6E), we found a decrease of immunoreactivity for endothelial PECAM-1 (green) in the retinal blood vessels counter-immunostained for α-SMA (red). We further examined the loss of endothelial PECAM-1 in the CRA by immunostaining. H&E-stained tissue showed the location of the CRA beside the optic nerve (Fig 6F, arrow). Decreased immunoreactivity staining for endothelial PECAM-1 (green, Fig 6G) was found in the CRA of METH-treated mice with counter-immunostaining for α-SMA (red). These data indicate the loss of endothelial PECAM-1 in the retina caused by METH.
Figure 6.
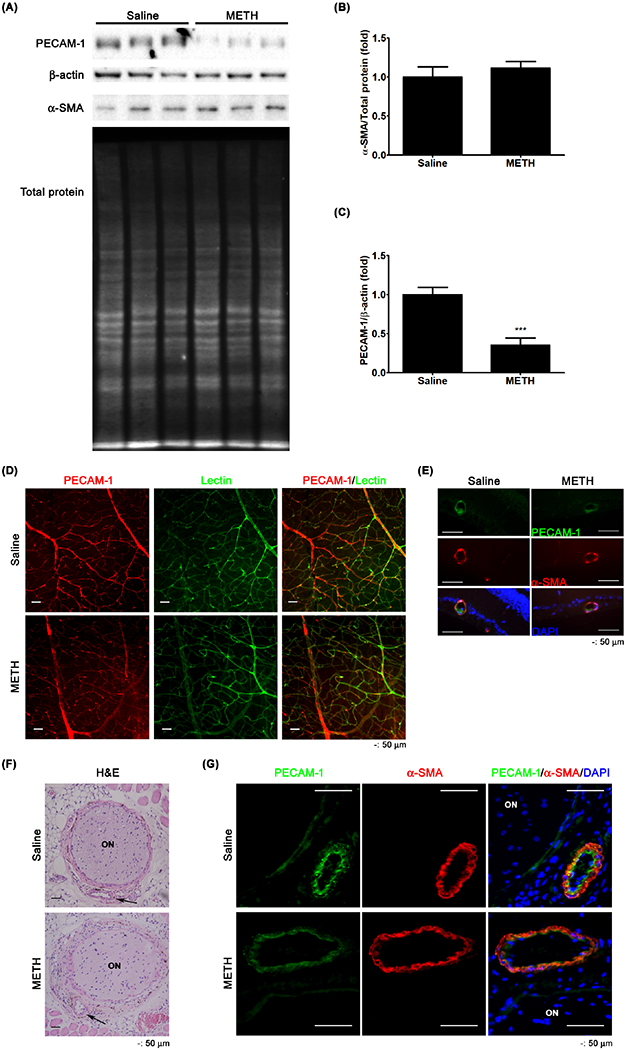
The effect of METH on the loss of PECAM-1 in the retina. PECAM-1 and α-SMA protein expressions of retina were examined by immunoblot (A). The relative protein expression levels of α-SMA (B) and PECAM-1 (C) were normalized to total protein level and β-actin expression, respectively, by ImageJ. ***P < 0.001 vs saline; N = 5. The fixed tissue of retina prepared for whole flatmount was immunostained for PECAM-1. GSL-1 lectin and DAPI were used for counterstaining of vessels and nuclei, respectively. (D) Retinal cross-sections (E) were immunostained for PECAM-1. α-SMA and DAPI were used for counterstaining of vessels and nuclei, respectively. Scale bar, 50 μm. The fixed tissue of optic nerve (ON) and CRA (arrows) were stained with H&E (F) and immunostained for PECAM-1 and α-SMA (G). DAPI was used for counterstaining of cell nuclei. Scale bar, 50 μm.
We further examined the METH-induced changes of endothelial surface proteins by examining the expression of glycocalyx proteoglycans on the apical surface of the retinal circulation. In Fig 7A–C, the relative protein expression levels of glypican-1 (P < 0.05, n=5) and syndecan-1 (P < 0.05, n=5) were significantly decreased in the retinas of the METH-treated mice. The retinal immunoreactivities of glypican-1 (red, Fig 7D) and syndecan-1 (red, Fig 7E) in vascular cells counter-stained with GSL-1 lectin (green) were reduced with METH administration, compared with saline controls. Moreover, we also found that the immunoreactivities of glypican-1 (green) and syndecan-1 (red) were reduced by METH in the CRA (Fig 7F), suggesting the loss of the endothelial glycocalyx.
Figure 7.
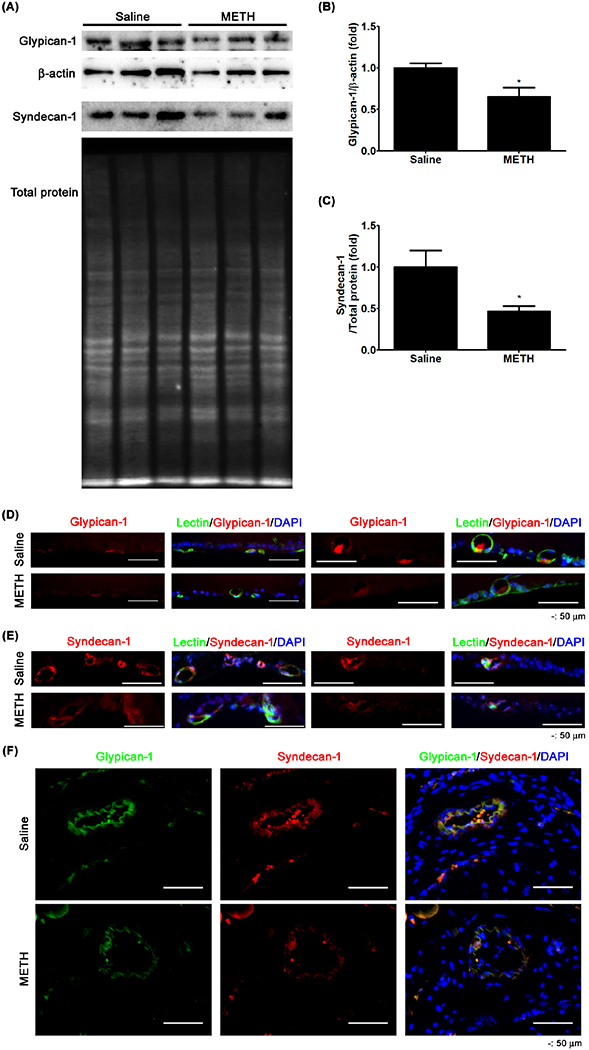
The effect of METH on the loss of glycocalyx in retina and CRA. Glypican-1 and syndecan-1 protein expressions in the retina were examined by immunoblot (A). The relative protein expression levels of glypican-1 (B) and syndecan-1 (C) were normalized with β-actin expression and total protein level, respectively, by ImageJ. *P < 0.05 vs saline; N = 5. The fixed tissues of retina (D and E) and CRA (F) were immunostained with antibodies to glypican-1 and syndecan-1. GSL-1 lectin and DAPI were used for counterstaining of vessels and cell nuclei, respectively. Scale bar, 50 μm.
3.4. Induction of MMPs
MMPs regulate the extracellular matrix (ECM) of various types of cells including that of the endothelial surface layer. As shown in Figure 8, the whole-retina relative protein expression levels of MMP-2 and MMP-9 were not changed in METH-treated mice compared with saline-treated controls; however, the relative protein expression level of MMP-14 (P < 0.01, n=5) was increased by METH treatment (Fig 8A and B). Using immunostaining (Fig 8C), MMP-14 immunoreactivity (red) was observed to be increased in the retina and its blood vessels in METH-treated mice, compared with saline-treated controls.
Figure 8.
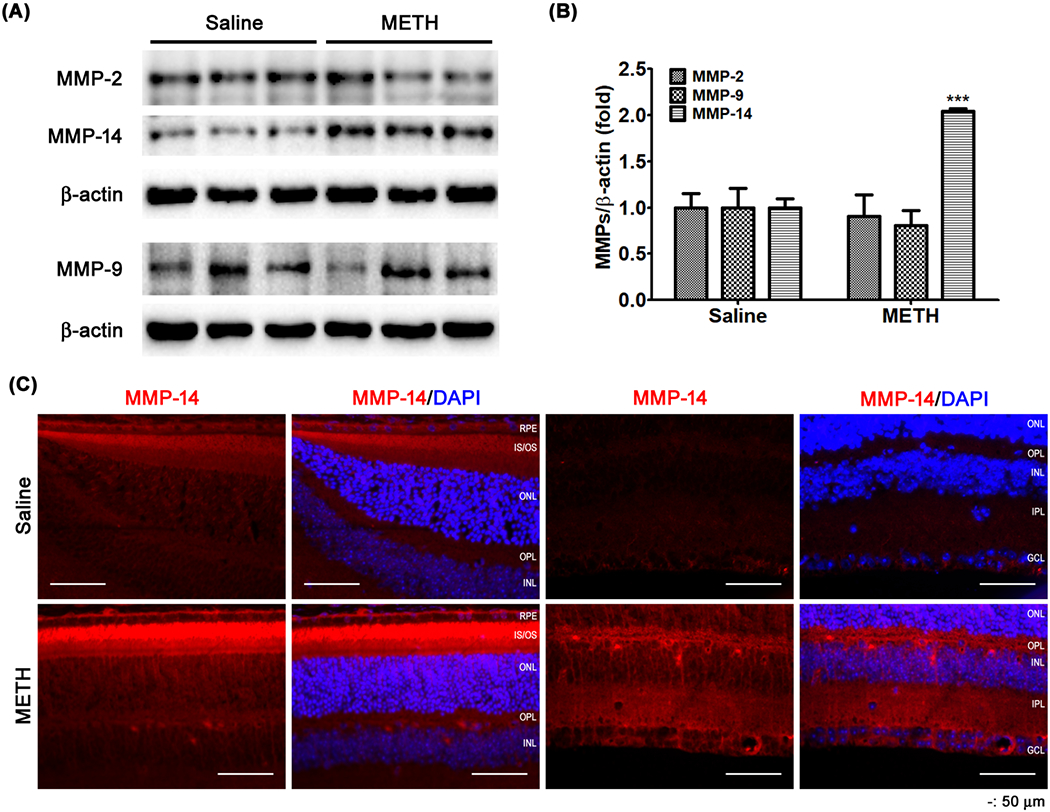
The effect of METH on the protein expression of MMPs in the retina. MMP-2, -9, and -14 protein expressions of retina were examined by immunoblot (A). The relative protein expression levels of MMP-2, -9, and -14 were normalized to β-actin expression using ImageJ (B). ***P < 0.001 vs saline; N = 5. Fixed retinal tissues (C) were immunostained for MMP-14. DAPI was used for counterstaining of cell nuclei. Scale bar, 50 μm.
MMP-14 regulates the release and the activation of the gelatinases MMP-2 and -9. Therefore, we further examined protein expression levels of MMP-2 and -9 in plasma. As shown in Fig 8, METH administration increased the relative protein expression level of MMP-2 and -9 in plasma (P < 0.001), compared with saline controls (Fig 9A and B). We further examined whether the gelatinase activity of plasma MMP-2 and -9 is increased, using zymography with gelatin-containing polyacrylamide gel. After staining with coomassie blue, the area of digested bands in the stained gel was increased by the plasma from the METH-treated group (MMP-2, P < 0.01; MMP-9, P < 0.001), compared with controls (Fig 9C and D), indicating that the gelatinase activities of plasma MMP-2 and MMP-9 are increased by METH treatment. We also found that the immunoreactivities of MMP-2 (red, Fig 9E) and -9 (red, Fig 9E) were increased by METH administration in the endothelial layer of the CRA. These data suggest that vascular MMP-2 and -9 are activated by METH.
Figure 9.
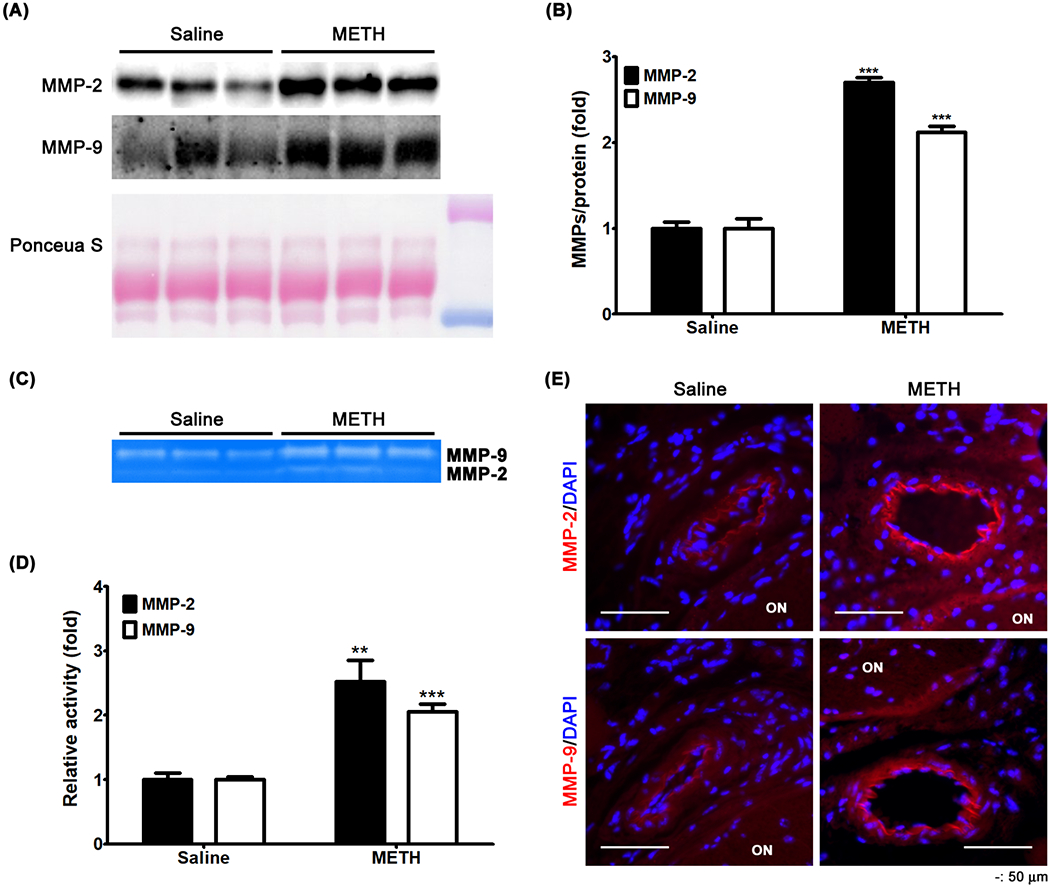
The effect of METH on plasma levels of MMP-2 and -9. MMP-2 and -9 protein expressions in plasma were examined by immunoblot (A). The relative protein expression levels of MMP-2 and -9 were normalized to total loading protein levels (Ponceau S) using ImageJ (B). ***P < 0.001 vs saline; N = 5. Plasma activities of MMP-2 and -9 were determined by zymography (C). The enzymatically digested area was measured using ImageJ (D). **P < 0.01 and ***P < 0.001 vs saline; N = 5. Fixed tissues including the CRA were immunostained for MMP-2 and MMP-9 (E). DAPI was used for counterstaining of cell nuclei. Scale bar, 50 μm.
4. DISCUSSION
METH and its metabolites and derivatives, e.g., amphetamine, 4-hydroxymethamphetamine, and 3,4-methylenedioxy-methamphetamine, have deleterious consequences throughout much of the body, especially the cardiovascular system and CNS, with the retina a part of the latter. Ocular manifestations of METH include retinal vasculitis, emboli, vasoconstriction, ischemia, edema, scleritis, episcleritis, corneal ulcerations, intraretinal hemorrhages, occlusion of the CRA, and transient vision losses (Anderson and Sung, 2003; Guo et al., 2019; Hazin et al., 2009; Kumar et al., 2006; Shaw et al., 1985; Wallace et al., 1992; Wijaya et al., 1999). Mouse models of METH administration have shown activation of astrocytes and microglia by a single high dose (40 mg/kg) of METH (Lai et al., 2009) and induction of apoptotic retinal cell death by a longer 2-month term of a lower dose of METH (0.5 and 1.0 mg/kg/day) (Yang et al., 2018). In the current study, we used a dosing regimen of METH that has been developed in mice (Kesby et al., 2018) to more closely mimic the human pattern of increasing the dosage (6-24 mg/kg/day) over a period of several days. In this report, we describe a number of changes in the retina following a 4-day METH administration, including (1) thinning of the retina due to death of retinal neurons, (2) astrocyte activation, (3) increased plasma levels of norepinephrine, MMP-2, and MMP-9, (4) increased retinal levels of TNF-α and MMP-14, (5) a loss of PECAM-1, syndecan-1, and glypican-1 from the retinal vasculature, and (6) an increase in vascular MMP-2 and MMP-9 in the plasma and CRA. With METH-induced increases in plasma levels of norepinephrine, MMPs, and likely other potentially inflammatory mediators, we cannot state whether the retinal effects are direct or indirect. Although these findings are phenomenological, they form a basis upon which mechanistic studies can be designed.
METH induces the release of neurotransmitters such as catecholamines and glutamate, with neurotransmitters capable of increasing ERG signals (Kim and Jung, 2012; Skrandies and Wassle, 1988). In contrast, ERG signals can be decreased with retinal degeneration and the loss of neurons (Chang et al., 2002; Creel, 1995). Therefore, the effects of METH on the ERG signal could be mixed. A previous study has demonstrated normal ERG levels in rats after intravitreal injection of METH (Rodrigues et al., 2004), and in our study, we did not find a statistically significant change in ERG signals despite the significant loss of neurons.
At physiological concentrations, neurotransmitters do not exhibit toxicity, but excessive levels can cause excitotoxicity and activation of cell death signaling in neurons. For example, dopamine treatment in vitro has been shown to induce neurotoxicity in cortical, striatal, and mesencephalic cells (Hoyt et al., 1997; Rosenberg, 1988; Tanaka et al., 1991). Additionally, increased retinal levels of glutamate induce oxidative stress and is associated with damage of retinal neurons in glaucoma (Tezel, 2006) and diabetic retinopathy (Kowluru et al., 2001). In our current study, we found a >4-fold increase in the plasma concentration of norepinephrine, which is derived from dopamine.
The increase in norepinephrine may contribute to more than one mechanism responsible for various consequences of METH usage, especially with regard to the cardiovascular manifestations. The catecholamine constricts the systemic circulation, and may contribute to the elevations in blood pressure (which in itself may be harmful to the retina) seen with METH administration. In addition, several studies have demonstrated the extent to which norepinephrine increases the release of MMPs (Briest et al., 2001; Rassler et al., 2012; Shen et al., 2006), which include a number of proteinases categorized according to enzymatic action, e.g., stromelysins, matrilysins, collagenases, gelatinases, etc. In particular, the gelatinases MMP-2 and MMP-9 have been found to have roles in retinopathy (Giebel et al., 2005; Jin et al., 2001; Kowluru, 2010; Noda et al., 2003) and have been shown to be able to digest components of the endothelial surface layer (Lipowsky, 2011). The loss of several such endothelial surface molecules (PECAM-1, syndecan-1, and glypican-1) were found in our investigation of METH administration.
In this study, we found that METH increased protein expression levels of MMP-14, but not MMP-2 and MMP-9, in the retina as a whole, with the measurement including all cells of the retinal homogenate. (Further measurements indicated more localized increases in MMP-2 and MMP-9 in the walls of the CRA.) The membrane type 1 MMP, MMP-14, is tethered to the plasma membrane through a transmembrane domain (Itoh, 2006), thus it acts at the cell surface. The potential effect of MMP-14 on retinal endothelial surface molecules will need to be addressed in future studies, but several molecules such as aggrecan, perlecan, dermatan sulfate proteoglycan, and syndecan-1 have been demonstrated to be substrates of MMP-14 (Endo et al., 2003; Newby, 2006). MMP-14 not only acts on these extracellular substrates, but also activates the gelatinases MMP-2 and MMP-9 by cleavage of pro-MMP-2 (Newby, 2006) and pro-MMP-9 (Seomun et al., 2008). This may explain our data of the increases in MMP-2 and MMP-9 in the plasma and CRA induced by METH, with the activation of the gelatinases by METH possibly responsible for the loss of endothelial surface molecules including PECAM-1, syndecan-1, and glypican-1. We have recently found that MMP-2 elevations in the diabetic retina may be responsible for a loss of retinal PECAM-1 (Eshaq and Harris, 2019). Moreover, METH-induced increases in MMPs may play a role in behavioral stimulation (Mizoguchi et al., 2007) and nerve system remodeling (Liu et al., 2008), and activation of MMPs by norepinephrine contributes to hypertrophy (Briest et al., 2001) and hypothalamic neuroplasticity (Maolood et al., 2008) through remodeling of the vascular and neuronal extracellular matrix.
In response to METH administration, we found increases in TNF-α and GFAP in the retina, indicative of a proinflammatory and activated state. TNF-α is a stimulator of cell death signaling pathways, and GFAP is a glial cell activation marker. Both TNF-α and GFAP have been reported to be involved in the pathophysiological mechanisms of METH-induced neuronal and vascular dysfunctions including cell death, inflammation, and permeability (Coelho-Santos et al., 2015; Flora et al., 2002; Lai et al., 2009; Lee et al., 2001). Interestingly, two recent in vitro studies have shown that METH-induced inflammatory responses in macrophages causes photoreceptor cell death (Zhang et al., 2017), and that norepinephrine promotes TNF-α secretion in inflamed macrophages (Huang et al., 2012); therefore, it is possible that an increase of TNF-α production by METH in the retina may induce retinal neurodegeneration.
Much of our study focused on the retina, but we additionally found several METH-induced changes in the CRA, such as increased MMP-2 and MMP-9 in the vessel wall and decreased expression of the endothelial surface molecules PECAM-1, syndecan-1, and glypican-1. Several studies have demonstrated the proteolytic function of MMPs on endothelial PECAM-1 (Ilan et al., 2001; Kato et al., 2014) and as mentioned earlier, we recently have identified MMP-2 as a possible mediator of the loss of PECAM-1 from the retinal microcirculation in diabetes (Eshaq and Harris, 2019). The vascular changes in the CRA with METH administration may have significant consequences, with severe visual impairment due to CRA occlusion after intranasal inhalation of METH (Anderson and Sung, 2003). Occlusion of the CRA may induce ischemic neuronal damage in the retina (Anderson and Sung, 2003), as cerebrovascular occlusion does in the brain. In association with METH-induced neurodegeneration, cerebrovascular complications including hemorrhagic and ischemic stroke have been reported in METH users (Darke et al., 2018; Ho et al., 2009; Lappin et al., 2018).
In conclusion, we found a severe loss of retinal neurons following METH administration to mice, with an increase of plasma norepinephrine and MMPs (both in plasma and the CRA for the latter), increased retinal levels of TNF-α and MMP-14, and decreased levels of retinal vascular endothelial surface molecules that in part comprise the glycocalyx. Subsequent studies will address the mechanisms of these phenomena, for example, whether the increases in MMPs are responsible for the loss of the endothelial surface molecules, and whether the neural loss is either dependent or independent of the vascular changes.
Supplementary Material
Highlights.
Methamphetamine induces retinal neurodegeneration in mice.
PECAM-1 and the glycocalyx are lost from vessels in the retina and the central retinal artery following methamphetamine administration.
Methamphetamine increases MMP-14 levels in the retina and MMP-2 and MMP-9 levels in plasma.
Acknowledgements
We would like to thank Dr. Christopher Pattillo and his lab members for providing the ChemiDoc XRS gel imaging system, and for guidance with the system.
Funding: This work was supported by funding from the National Institute of Health (NIH) EY025632.
Abbreviations
- cd.s/m2
Candela second per meter squared
- CNS
Central nervous system
- CRA
central retinal artery
- dUTP
deoxyuridine triphosphate
- DAPI
4’-6’-diamidino-2-phenylinodole
- ECM
extracellular matrix
- ERG
ganglion cell layer
- GCL
electroretinogram
- GFAP
glial fibrillary acidic protein
- INL
inner nuclear layer
- IPL
inner plexiform layer
- MMP
matrix metalloproteinase
- METH
methamphetamine
- ONL
outer nuclear layer
- OPL
outer plexiform layer
- OS
outer segment
- PECAM-1
platelet endothelial cell adhesion molecule-1
- SDS-PAGE
sodium dodecyl sulfate-polyacrylamide gel electrophoresis
- SMA
smooth muscle actin
- TUNEL
terminal deoxynucleotidyl transferase deoxyuridine triphosphate nick end labeling
- TBST
Tris-buffered saline with Tween 20
- TNF
tumor necrosis factor
Footnotes
Publisher's Disclaimer: This is a PDF file of an unedited manuscript that has been accepted for publication. As a service to our customers we are providing this early version of the manuscript. The manuscript will undergo copyediting, typesetting, and review of the resulting proof before it is published in its final form. Please note that during the production process errors may be discovered which could affect the content, and all legal disclaimers that apply to the journal pertain.
Competing interests: The author(s) declare no competing interests
References
- Ahrnsbrak R, Bose J, Hedden S, Lipari R, Park-Lee E, 2017. Key substance use and mental health indicators in the United States: Results from the 2016 National Survey on Drug Use and Health, Center for Behavioral Health Statistics and Quality, Substance Abuse and Mental Health Services Administration: Rockville, MD, USA: Substance Abuse and Mental Health Services Administration, Rockville, MD. [Google Scholar]
- Anderson CA, Sung GY, 2003. Central retinal artery occlusion associated with intranasal methamphetamine use. J. Stroke Cerebrovasc. Dis 12, 207–208. [DOI] [PubMed] [Google Scholar]
- Ballabh P, Braun A, Nedergaard M, 2004. The blood-brain barrier: an overview: structure, regulation, and clinical implications. Neurobiol. Dis 16, 1–13. [DOI] [PubMed] [Google Scholar]
- Becker BF, Chappell D, Bruegger D, Annecke T, Jacob M, 2010. Therapeutic strategies targeting the endothelial glycocalyx: acute deficits, but great potential. Cardiovasc. Res 87, 300–310. [DOI] [PubMed] [Google Scholar]
- Briest W, Holzl A, Rassler B, Deten A, Leicht M, Baba HA, Zimmer HG, 2001. Cardiac remodeling after long term norepinephrine treatment in rats. Cardiovasc. Res 52, 265–273. [DOI] [PubMed] [Google Scholar]
- Cadet JL, 2002. Roles of Glutamate, Nitric Oxide, Oxidative Stress, and Apoptosis in the Neurotoxicity of Methamphetamine, in: Herman BH, Frankenheim J, Fitten RZ, Sheridan PH, Weight FF, Zukin SR (Eds.), Glutamate and Addiction. Humana Press, Totowa, NJ, pp. 201–210. [Google Scholar]
- Chang B, Hawes NF, Hurd RE, Davisson MT, Nusinowitz S, Heckenlively JR, 2002. Retinal degeneration mutants in the mouse. Vision. Res 42, 517–525. [DOI] [PubMed] [Google Scholar]
- Chuck RS, Williams JM, Goldberg MA, Fubniewski AJ, 1996. Recurrent corneal ulcerations associated with smokeable methamphetamine abuse. Am. J. Ophthalmol 121, 571 –572. [DOI] [PubMed] [Google Scholar]
- Coelho-Santos V, Feitao RA, Cardoso FF, Palmela I, Rito M, Barbosa M, Brito MA, Fontes-Ribeiro CA, Silva AP, 2015. The TNF-alpha/NF-kappaB signaling pathway has a key role in methamphetamine-induced blood-brain barrier dysfunction. J. Cereb. Blood Flow Metab 35, 1260–1271. [DOI] [PMC free article] [PubMed] [Google Scholar]
- Creel DJ, 1995. Clinical Electrophysiology, in: Kolb H, Fernandez E, Nelson R (Eds.), Webvision: The Organization of the Retina and Visual System. University of Utah Health Sciences Center; Copyright: (c) 2019 Webvision., Salt Lake City: (UT). [PubMed] [Google Scholar]
- Darke S, Lappin I, Kaye S, Duflou, 2018. Clinical characteristics of fatal methamphetamine-related stroke: a national study. J. Forensic. Sci 63, 735–739. [DOI] [PubMed] [Google Scholar]
- Endo K, Takino T, Miyamori H, Kinsen H, Yoshizaki T, Furukawa M, Sato H, 2003. Cleavage of syndecan-1 by membrane type matrix metalloproteinase-1 stimulates cell migration. J. Biol. Chem 278, 40764–40770. [DOI] [PubMed] [Google Scholar]
- Eshaq RS, Harris NR, 2019. Loss of platelet endothelial cell adhesion molecule-1 (PECAM-1) in the diabetic retina: role of matrix metalloproteinases. Invest. Ophthalmol. Vis. Sci 60, 748–760. [DOI] [PMC free article] [PubMed] [Google Scholar]
- Flora G, Lee YW, Nath A, Maragos W, Hennig B, Toborek M, 2002. Methamphetamine-induced TNF-alpha gene expression and activation of AP-1 in discrete regions of mouse brain: potential role of reactive oxygen intermediates and lipid peroxidation. Neuromolecular Med. 2, 71–85. [DOI] [PubMed] [Google Scholar]
- Giebel SJ, Menicucci G, McGuire PG, Das A, 2005. Matrix metalloproteinases in early diabetic retinopathy and their role in alteration of the blood-retinal barrier. Lab. Invest 85, 597–607. [DOI] [PubMed] [Google Scholar]
- Guo J, Tang W, Liu W, Zhang Y, Wang L, Wang W, 2019. Bilateral methamphetamine-induced ischemic retinopathy. Am. J. Ophthalmol. Case Rep 15, 100473. [DOI] [PMC free article] [PubMed] [Google Scholar]
- Hazin R, Cadet JL, Kahook MY, Saed D, 2009. Ocular manifestations of crystal methamphetamine use. Neurotox. Res 15, 187–191. [DOI] [PubMed] [Google Scholar]
- Ho EL, Josephson SA, Lee HS, Smith WS, 2009. Cerebrovascular complications of methamphetamine abuse. Neurocrit. Care 10, 295–305. [DOI] [PubMed] [Google Scholar]
- Huang JL, Zhang YL, Wang CC, Zhou JR, Ma Q, Wang X, Shen XH, Jiang CL, 2012. Enhanced phosphorylation of MAPKs by NE promotes TNF-alpha production by macrophage through alpha adrenergic receptor. Inflammation 35, 527–534. [DOI] [PubMed] [Google Scholar]
- Ilan N, Mohsenin A, Cheung L, Madri JA, 2001. PEC AM-1 shedding during apoptosis generates a membrane-anchored truncated molecule with unique signaling characteristics. FASEB journal : official publication of the Federation of American Societies for Experimental Biology 15, 362–372. [DOI] [PubMed] [Google Scholar]
- Itoh Y, 2006. MT1-MMP: a key regulator of cell migration in tissue. IUBMB Life 58, 589–596. [DOI] [PubMed] [Google Scholar]
- Jin M, Kashiwagi K, Iizuka Y, Tanaka Y, Imai M, Tsukahara S, 2001. Matrix metalloproteinases in human diabetic and nondiabetic vitreous. Retina 21, 28–33. [DOI] [PubMed] [Google Scholar]
- Kato H, Kuriyama N, Duarte S, Clavien PA, Busuttil RW, Coito AJ, 2014. MMP-9 deficiency shelters endothelial PECAM-1 expression and enhances regeneration of steatotic livers after ischemia and reperfusion injury. J. Hepatol 60, 1032–1039. [DOI] [PMC free article] [PubMed] [Google Scholar]
- Kesby JP, Chang A, Markou A, Semenova S, 2018. Modeling human methamphetamine use patterns in mice: chronic and binge methamphetamine exposure, reward function and neurochemistry. Addict. Biol 23, 206–218. [DOI] [PMC free article] [PubMed] [Google Scholar]
- Kim DY, Jung CS, 2012. Gap junction contributions to the goldfish electroretinogram at the photopic illumination level. Korean J. Physiol. Pharmacol 16, 219–224. [DOI] [PMC free article] [PubMed] [Google Scholar]
- Kiyatkin EA, Sharma HS, 2016. Breakdown of Blood-Brain and Blood-Spinal Cord Barriers During Acute Methamphetamine Intoxication: Role of Brain Temperature. CNS Neurol. Disord. Drug Targets 15, 1129–1138. [DOI] [PMC free article] [PubMed] [Google Scholar]
- Kowluru RA, 2010. Role of matrix metalloproteinase-9 in the development of diabetic retinopathy and its regulation by H-Ras. Invest. Ophthalmol. Vis. Sci 51, 4320–4326. [DOI] [PMC free article] [PubMed] [Google Scholar]
- Kuczenski R, Segal DS, Cho AK, Melega W, 1995. Hippocampus norepinephrine, caudate dopamine and serotonin, and behavioral responses to the stereoisomers of amphetamine and methamphetamine. J. Neurosci 15, 1308–1317. [DOI] [PMC free article] [PubMed] [Google Scholar]
- Kumar RL, Kaiser PK, Lee MS, 2006. Crystalline retinopathy from nasal ingestion of methamphetamine. Retina 26, 823–824. [DOI] [PubMed] [Google Scholar]
- Lai H, Zeng H, Zhang C, Wang L, Tso MO, Lai S, 2009. Toxic effect of methamphetamine on the retina of CD1 mice. Curr. Eye. Res 34, 785–790. [DOI] [PMC free article] [PubMed] [Google Scholar]
- Lappin JM, Darke S, Larrell M, 2018. Methamphetamine use and future risk for Parkinson’s disease: Evidence and clinical implications. Drug Alcohol Depend. 187, 134–140. [DOI] [PubMed] [Google Scholar]
- Lee YW, Hennig B, Yao J, Toborek M, 2001. Methamphetamine induces AP-1 and NF-κB binding and transactivation in human brain endothelial cells. J. Neurosci. Res 66, 583–591. [DOI] [PubMed] [Google Scholar]
- Lipowsky HH, 2011. Protease Activity and the Role of the Endothelial Glycocalyx in Inflammation. Drug discovery today. Dis. Models 8, 57–62. [DOI] [PMC free article] [PubMed] [Google Scholar]
- Liu Y, Brown S, Shaikh J, Fishback JA, Matsumoto RR, 2008. Relationship between methamphetamine exposure and matrix metalloproteinase 9 expression. Neuroreport 19, 1407–1409. [DOI] [PMC free article] [PubMed] [Google Scholar]
- Maolood N, Hardin-Pouzet H, Grange-Messent V, 2008. Matrix metalloproteinases MMP2 and MMP9 are upregulated by noradrenaline in the mouse neuroendocrine hypothalamus. Eur. J. Neurosci 27, 1143–1152. [DOI] [PubMed] [Google Scholar]
- Mizoguchi H, Yamada K, Mouri A, Niwa M, Mizuno T, Noda Y, Nitta A, Itohara S, Banno Y, Nabeshima T, 2007. Role of matrix metalloproteinase and tissue inhibitor of MMP in methamphetamine-induced behavioral sensitization and reward: implications for dopamine receptor down-regulation and dopamine release. J. Neurochem 102, 1548–1560. [DOI] [PubMed] [Google Scholar]
- Newby AC, 2006. Matrix metalloproteinases regulate migration, proliferation, and death of vascular smooth muscle cells by degrading matrix and non-matrix substrates. Cardiovasc. Res 69, 614–624. [DOI] [PubMed] [Google Scholar]
- Noda K, Ishida S, Inoue M, Obata K, Oguchi Y, Okada Y, Ikeda E, 2003. Production and activation of matrix metalloproteinase-2 in proliferative diabetic retinopathy. Invest. Ophthalmol. Vis. Sci 44, 2163–2170. [DOI] [PubMed] [Google Scholar]
- Poulsen EJ, Mannis MJ, Chang SD, 1996. Keratitis in methamphetamine abusers. Cornea 15, 477–482. [PubMed] [Google Scholar]
- Privratsky JR, Newman PJ, 2014. PECAM-1: regulator of endothelial junctional integrity. Cell Tissue Res. 355, 607–619. [DOI] [PMC free article] [PubMed] [Google Scholar]
- Rassler B, Marx G, Schierle K, Zimmer HG, 2012. Catecholamines can induce pulmonary remodeling in rats. Cell. Physiol. Biochem 30, 1134–1147. [DOI] [PubMed] [Google Scholar]
- Riddle EL, Fleckenstein AE, Hanson GR, 2006. Mechanisms of methamphetamine-induced dopaminergic neurotoxicity. AAPS J 8, E413–418. [DOI] [PMC free article] [PubMed] [Google Scholar]
- Rodrigues LG, Tavares MA, Wood JP, Schmidt KG, Osborne NN, 2004. Methamphetamine exacerbates the toxic effect of kainic acid in the adult rat retina. Neurochem. Int 45, 1133–1141. [DOI] [PubMed] [Google Scholar]
- Rothrock JF, Rubenstein R, Lyden PD, 1988. Ischemic stroke associated with methamphetamine inhalation. Neurology 38, 589–592. [DOI] [PubMed] [Google Scholar]
- Sajja RK, Rahman S, Cucullo L, 2016. Drugs of abuse and blood-brain barrier endothelial dysfunction: A focus on the role of oxidative stress. J. Cereb. Blood Flow Metab 36, 539–554. [DOI] [PMC free article] [PubMed] [Google Scholar]
- Seomun Y, Kim JT, Joo CK, 2008. MMP-14 mediated MMP-9 expression is involved in TGF-betal-induced keratinocyte migration. J. Cell. Biochem 104, 934–941. [DOI] [PubMed] [Google Scholar]
- Shaw HE Jr., Fawson JG, Stulting RD, 1985. Amaurosis fugax and retinal vasculitis associated with methamphetamine inhalation. J. Clin. Neuroophthalmol 5, 169–176. [DOI] [PubMed] [Google Scholar]
- Shen XC, Fu Y, Qian ZY, 2006. Effects of crocetin on the matrix metalloproteinases in cardiac hypertrophy induced by norepinephrine in rats. J. Asian Nat. Prod. Res 8, 201–208. [DOI] [PubMed] [Google Scholar]
- Skrandies W, Wassle H, 1988. Dopamine and serotonin in cat retina: electroretinography and histology. Exp. Brain Res 71, 231–240. [DOI] [PubMed] [Google Scholar]
- Sulzer D, Sonders MS, Poulsen NW, Galli A, 2005. Mechanisms of neurotransmitter release by amphetamines: a review. Prog. Neurobiol 75, 406–433. [DOI] [PubMed] [Google Scholar]
- Wallace RT, Brown GC, Benson W, Sivalingham A, 1992. Sudden retinal manifestations of intranasal cocaine and methamphetamine abuse. Am. J. Ophthalmol 114, 158–160. [DOI] [PubMed] [Google Scholar]
- Wijaya J, Salu P, Leblanc A, Bervoets S, 1999. Acute unilateral visual loss due to a single intranasal methamphetamine abuse. Bull. Soc. Beige. Ophtalmol 271, 19–25. [PubMed] [Google Scholar]
- Xu HZ, Le YZ, 2011. Significance of outer blood-retina barrier breakdown in diabetes and ischemia. Invest. Ophthalmol. Vis. Sci 52, 2160–2164. [DOI] [PMC free article] [PubMed] [Google Scholar]
- Yang H, Tao L, Li L, 2018. Long-Term Systemic Treatment With Methamphetamine Causes Retinal Damage in CD1 Mice. Int. J. Toxicol 37, 448–456. [DOI] [PubMed] [Google Scholar]
- Zhang A, Wu L, Chen Z, Huang G, Lu X, 2017. Methamphetamine Causes Photoreceptor Cell Damage Through Promoting Polarization of Macrophages and Inducing Inflammatory Response. Int. J. Toxicol 36, 403–409. [DOI] [PubMed] [Google Scholar]
Associated Data
This section collects any data citations, data availability statements, or supplementary materials included in this article.