Abstract
PURPOSE
To create a risk prediction model that identifies patients at high risk for a potentially preventable acute care visit (PPACV).
PATIENTS AND METHODS
We developed a risk model that used electronic medical record data from initial visit to first antineoplastic administration for new patients at Memorial Sloan Kettering Cancer Center from January 2014 to September 2018. The final time-weighted least absolute shrinkage and selection operator model was chosen on the basis of clinical and statistical significance. The model was refined to predict risk on the basis of 270 clinically relevant data features spanning sociodemographics, malignancy and treatment characteristics, laboratory results, medical and social history, medications, and prior acute care encounters. The binary dependent variable was occurrence of a PPACV within the first 6 months of treatment. There were 8,067 observations for new-start antineoplastic therapy in our training set, 1,211 in the validation set, and 1,294 in the testing set.
RESULTS
A total of 3,727 patients experienced a PPACV within 6 months of treatment start. Specific features that determined risk were surfaced in a web application, riskExplorer, to enable clinician review of patient-specific risk. The positive predictive value of a PPACV among patients in the top quartile of model risk was 42%. This quartile accounted for 35% of patients with PPACVs and 51% of potentially preventable inpatient bed days. The model C-statistic was 0.65.
CONCLUSION
Our clinically relevant model identified the patients responsible for 35% of PPACVs and more than half of the inpatient beds used by the cohort. Additional research is needed to determine whether targeting these high-risk patients with symptom management interventions could improve care delivery by reducing PPACVs.
INTRODUCTION
Patients with cancer who receive chemotherapy average two emergency department (ED) visits and one hospitalization per year.1 Several studies have quantified the fraction of these hospitalizations that may be avoidable, with estimates between 19% and 50%.2-5 Avoidance of these hospitalizations has significant clinical implications because there is high morbidity and mortality associated with acute care visits while on antineoplastic treatment.6,9 The Department of Health and Human Services (DHHS) has identified avoidable ED visits and hospitalizations as a gap in care for patients with cancer and plans to measure cancer hospital performance, in part, on the basis of the frequency of these visits.7,8
New strategies are needed to reduce these potentially preventable acute care visits (PPACVs). Despite improvements in supportive care medications and a better understanding of the toxicities associated with antineoplastics, ED visits and admissions for preventable conditions have grown.6,9 Handley et al10 found that a key strategy for reducing PPACVs is to identify and provide targeted interventions to patients at particularly high risk for these episodes. They argued that risk stratification models can focus time, resources, and effort on those most in need but that current modeling techniques are in their infancy and have not been used to improve patient care. Prior models have assessed risk in specific populations, such as geriatric oncology,11-13 phase I trials,14 advanced cancers,15,16 and patients receiving chemoradiation,17 or have predicted a specific complication, such as neutropenic fever,18 and thus lack widespread applicability. Other models have predicted poor prognosis,19 in-hospital mortality,20 or all-cause hospitalizations15,16,21 and thus have overlooked the opportunity to intervene meaningfully early in the course of a patient’s treatment to prevent adverse outcomes. Although they effectively mine certain sociodemographics and clinical data, many of these models do not incorporate the wealth of information retrievable from the electronic medical record (EMR) through advances in machine learning. Furthermore, recent models have not been integrated into clinical operations.
CONTEXT
Key Objective
Is it possible to develop a clinically relevant risk model that will predict which patients who initiate antineoplastic therapy will present to the emergency department within 6 months for a potentially preventable condition?
Knowledge Generated
We developed and implemented a risk model that was refined to predict risk for a potentially preventable acute care visit (PPACV) on the basis of 270 clinically relevant data features from the electronic medical record spanning sociodemographic and clinical characteristics. The top quartile of patients by risk accounted for 35% of PPACVs and 51% of potentially preventable inpatient bed days with a positive predictive value of 42%.
Relevance
By flagging at-risk patients before the start of treatment through a prediction model integrated into clinical operations that has a transparent, easy-to-understand clinician interface, we hope to be able to marshal resources to those patients most in need of intensive symptom monitoring.
To begin to improve care for high-risk medical oncology patients, we have developed a predictive analytic framework with attention to the four barriers to useful clinical risk prediction described by Shah et al22: thoughtful identification of risk-sensitive decisions; model calibration; user trust, transparency, and commercial interests; and data quality and heterogeneity. Our aim was to predict PPACVs so that these patients can be identified to receive earlier clinical intervention and avoid the ED.
PATIENTS AND METHODS
This study received a waiver of informed consent from the Memorial Sloan Kettering (MSK) Cancer Center institutional review board.
Study Population and Outcome
The population used to develop this model included all medical oncology patients who initiated antineoplastic therapy at MSK from January 2014 to September 2018, which encompassed new patients and those who were off treatment for at least 6 months. Antineoplastic therapy included receipt of any intravenous or oral cytotoxic, immunotherapeutic, or biologic agent. Consistent with the Centers for Medicare & Medicaid Services quality measure, we excluded pediatric patients and patients with leukemia.7,8 To reduce the likelihood that patients sought acute care through a non-MSK–affiliated center and, therefore, were not captured in our analysis, we excluded observations of patients who lived a driving distance > 30 minutes to the MSK Urgent Care Center (UCC). In total, we excluded 47,448 of our observations (81.7%) on the basis of these criteria.
We defined a PPACV as a UCC visit for a potentially preventable symptom; a list of potentially preventable symptoms has been published and defined elsewhere as a symptom that could be managed safely in the outpatient setting if the clinical team identified said symptom early and managed it proactively.19 A visit with any nonpreventable symptoms was labeled as negative. For example, if a patient presented with nausea (preventable) and a stroke (not preventable), the visit would not count as a PPACV. Staffed 24 hours a day, 7 days a week, the UCC is meant for acute medical issues and is the central point of entry for unplanned hospital admissions.23 The UCC acts like an ED, and patients are admitted or discharged dependent on symptom severity. To determine the UCC presenting symptom, we extracted the EMR clinician-entered data fields for chief complaint and primary diagnoses. We previously determined that 66% of patients initiating treatment who presented for a PPACV did so within the first 6 months of treatment. Therefore, the dependent variable of our model was the occurrence of a PPACV within the first 6 months of treatment.
Model Design
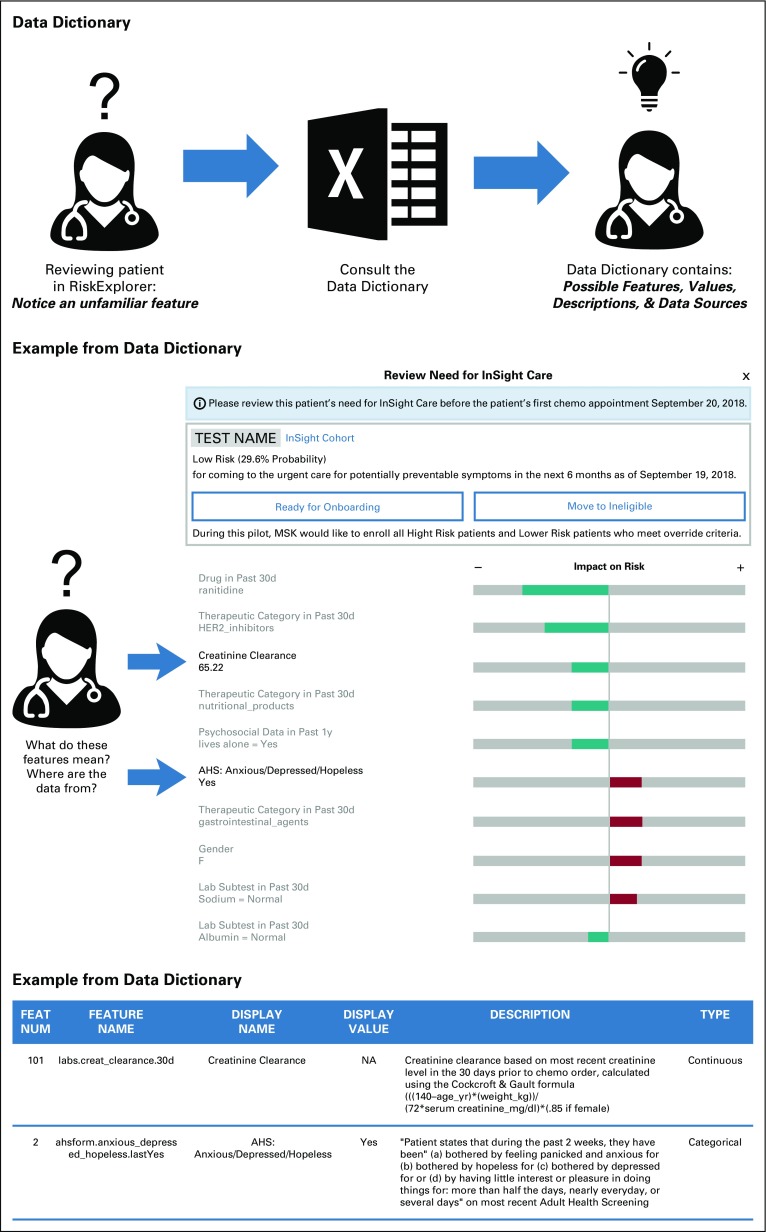
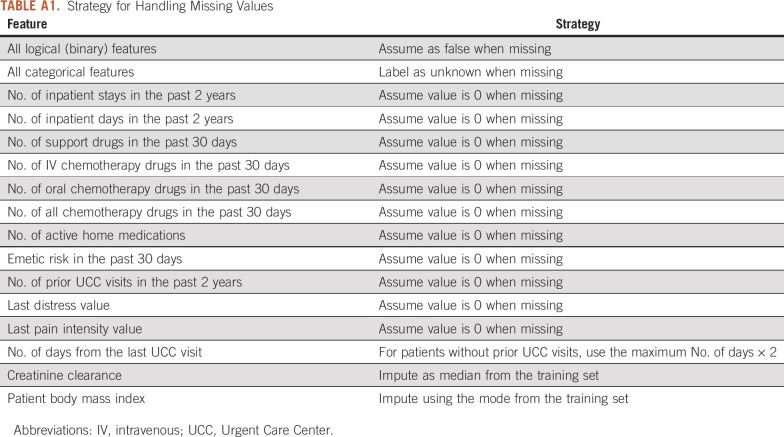
The model was built using 270 observation-level features from EMR data collected from the initial visit to first antineoplastic order. Features were grouped into categories that included sociodemographics, malignancy and treatment characteristics, laboratory results, medical and social history, medications, and prior MSK acute care encounters. With respect to antineoplastic agents, we also created variables for emetogenic risk on the basis of MSK antiemetic guidelines24 and for combination therapies, such as regimens with chemotherapy and immunotherapy. The EMR data for these features were imported from the institutional data warehouse, which is updated daily. We extracted structured data through database queries and unstructured data using natural language processing. Numerical features, such as laboratory values, were assessed as threshold or continuous variables. Threshold variables, such as sodium, were dichotomized by the relevant upper and lower limits of the normal range. Continuous laboratory variables included creatinine clearance. To account for nonlinear relationships, continuous features were discretized into quantile-based bins. The strategy for imputing missing values was feature dependent (Appendix Table A1). These features were then reviewed by a panel of clinicians, including oncologists, oncology practice nurses, and oncology nurse practitioners, at monthly intervals over 2 years to evaluate their clinical interpretability. Features that lacked clinical interpretability, defined as the feature being transparent and understandable to a clinician at the point of care, were removed. Clinician feedback benefited the model by providing improved feature accuracy, revising feature look-back windows, incorporating new features that were not considered by the data analytics team (eg, falls risk), and ensuring clarity of feature names and definitions. A data dictionary was built to enable clinicians to access the definition and source of each feature within the EMR (Appendix Fig A1).
Model Building
A time-weighted least absolute shrinkage and selection operator (LASSO) model was selected for the transparency it provides when reviewing both global and patient-level model performance25 (Appendix). Observations were weighted using the following equation: wi = e(–x/T), where x is the number of days elapsed from the most recent date in the training data. The scaling parameter T was tuned along with the LASSO regularization parameter λ using the validation set. We also tuned and trained an XGBoost, an implementation of a gradient boosted model, and a non–time-weighted LASSO model for performance comparison.26 To ensure generalizability of the model, the data were split temporally, with the most recent 6 months of observations used for the test partition and the previous 6 months used for the validate partition. Training data were collected from January 2014 to September 2017. Given operational constraints with regard to staffing and planned use of the model for identification of patients for enrollment in an intensive symptom monitoring pilot, the model targeted the quartile of highest-risk patients. Thus, both model tuning and final performance were evaluated by the positive predictive value for the top 25% highest output probabilities rather than for the more traditional metric of area under the receiver operator characteristic curve. To explain patient-specific risk assessment, we created a clinician-facing web application called riskExplorer, which displays the top 10 features that contribute to the predicted PPACV probability for that patient. The ranking of features is generated using the absolute value of the model’s feature coefficient multiplied by the feature value, thereby highlighting the features with the greatest influence on a patient’s likelihood to seek a PPACV.
RESULTS
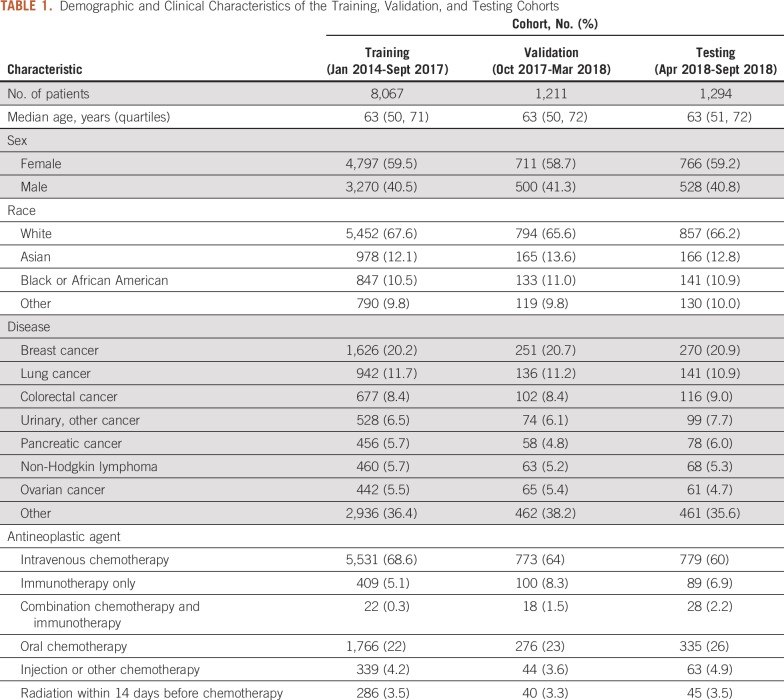
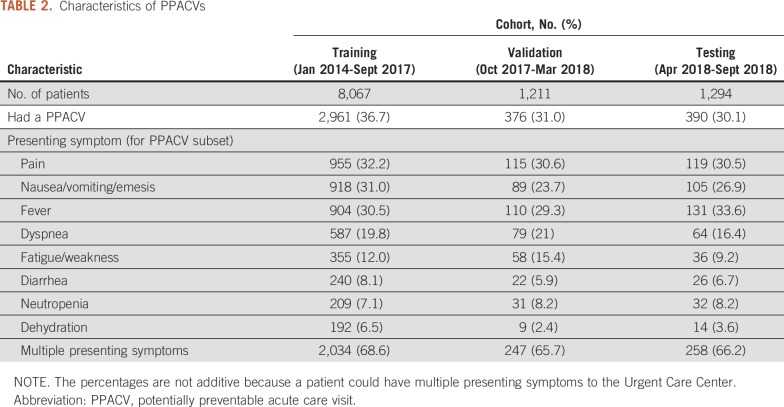
Between January 2014 and September 2018, 10,572 new antineoplastic therapy treatment starts were identified. The cohort was divided among training (8,067 patients; 76%), validation (1,211 patients; 12%), and testing (1,294 patients; 12%) sets. The demographics and clinical characteristics of the overall population and the training and testing sets are listed in Table 1. Median age was 63 years and 59% (6,274 patients) were female. The most common cancer diagnoses were breast (2,147 patients; 20%), lung (1,219 patients; 12%), and colorectal (895 patients; 8%). The most common symptoms that led to a PPACV in the first 6 months after treatment initiation were pain (1,189 visits; 32%), fever (1,145 visits; 31%), and nausea/vomiting (1,112 visits; 30%). Sixty-eight percent of PPACVs had multiple potentially preventable symptoms. Symptom data are listed in Table 2.
TABLE 1.
Demographic and Clinical Characteristics of the Training, Validation, and Testing Cohorts
TABLE 2.
Characteristics of PPACVs
After clinician feedback and review, 270 features were determined to be clinically relevant (Table 3). The categories with the most clinically relevant features with respect to helping oncology teams to understand risk for a PPACV included malignancy and treatment characteristics (77 features), medications (101 features), and laboratory values (45 features). Elimination of features that were not clinically interpretable did not decrease model performance. The positive predictive value of the validation set was 0.48 using all features compared with 0.49 using only clinically relevant ones.
TABLE 3.
Variables Used to Train Predictive Model

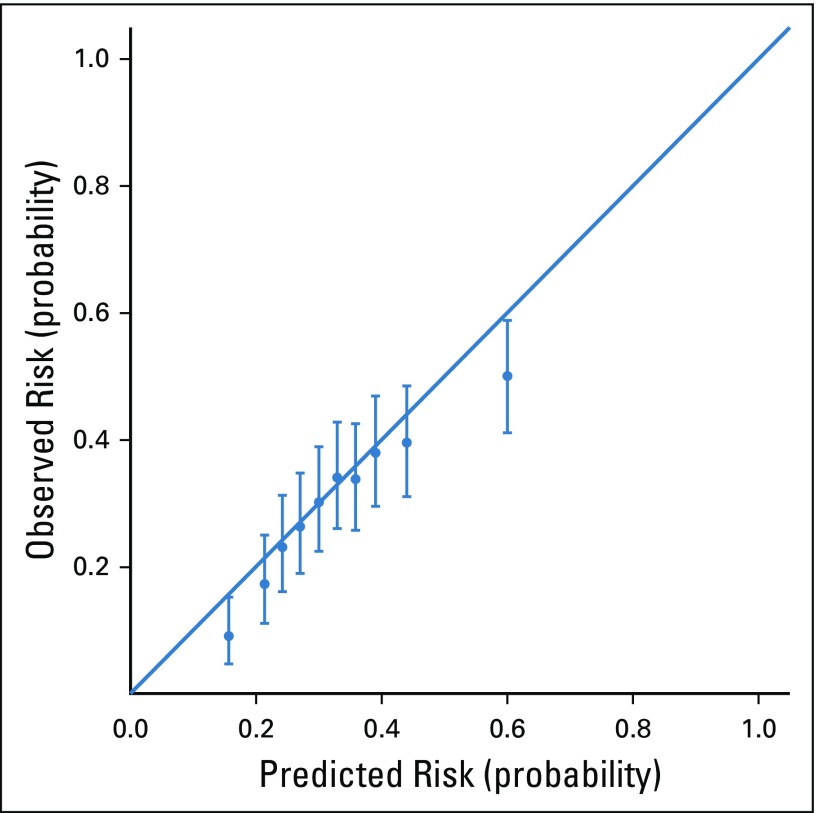
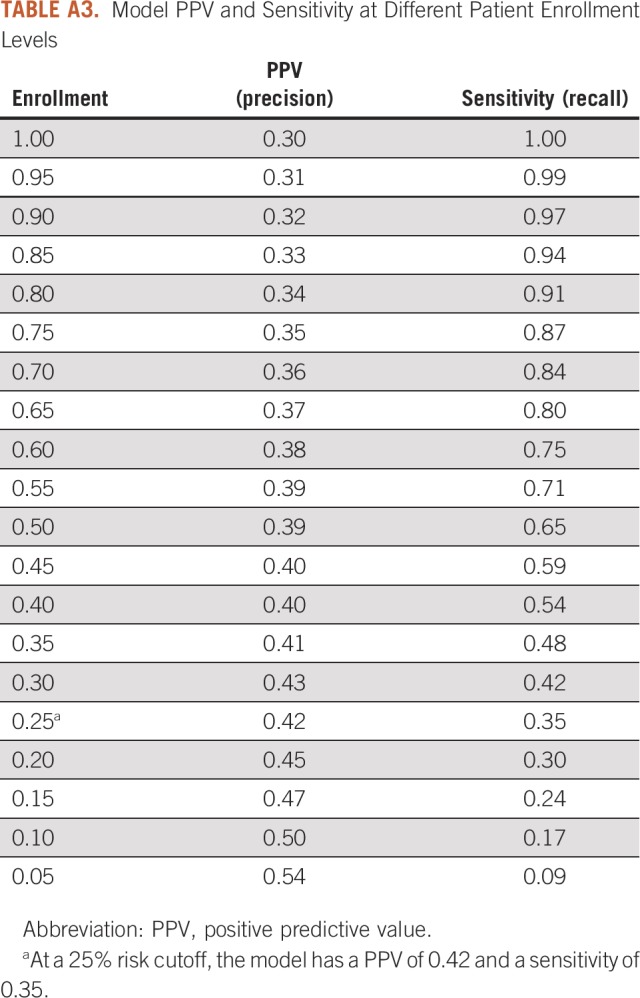
The C-statistic of the time-weighted LASSO model was 0.65. The validation performance of our time-weighted model was compared with XGBoost (positive predictive value, 0.50; C-statistic, 0.65) and a non–time-weighted LASSO model26 (positive predictive value, 0.46; C-statistic, 0.64; Appendix Table A2). For the testing set, the positive predictive value of this model for new-start antineoplastic patients at highest risk (top quartile) for seeking a PPACV was 0.42 (baseline risk, 0.30). The model had a lift of 39% over chance alone at identifying those patients who will present with a PPACV. The top 25% of patients in the testing set accounted for 35% of patients with a PPACV and 51% of potentially preventable inpatient bed days in the first 6 months of treatment. To assist with operational considerations, a sensitivity analysis was conducted to evaluate model performance at different patient enrollment levels (Appendix Table A3). The model was well calibrated as assessed visually and suggested no evidence of poor calibration (Fig 1).
FIG 1.
Probability calibration plot. The predicted risk for patients seeking a potentially preventable acute care visit was binned and evaluated using 10 evenly populated bins (deciles). Observed risk is shown with 95% confidence. The solid line indicates perfect correlation between predicted and observed risk.
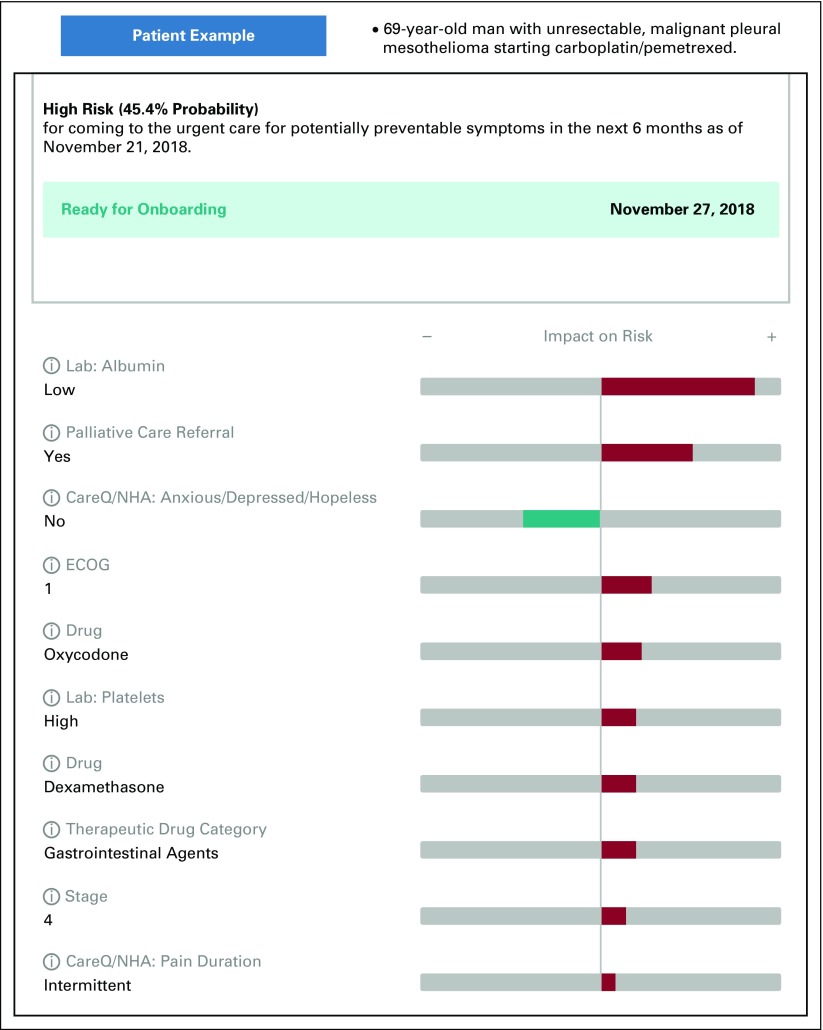
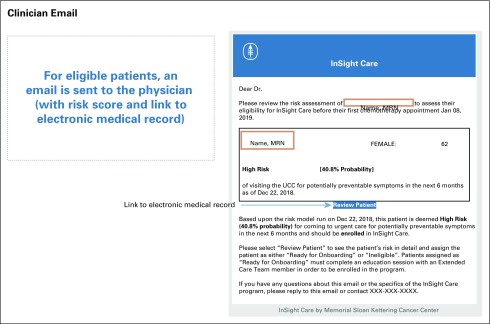
At the patient level, riskExplorer was integrated into the EMR and generated an e-mail to the clinical team (Appendix Fig A2) that surfaced specific features for determining a patient’s risk for a PPACV within the next 6 months (Fig 2). This clinician-facing application provided the individual risk score for the patient as well as for their quartile of risk relative to the population of patients starting antineoplastic treatment.
FIG 2.
The riskExplorer web application. riskExplorer provides the model explanation of the predicted patient-specific probability of a potentially preventable acute care visit (PPACV) within 6 months of starting antineoplastic therapy. The top 10 features that contribute most to risk are displayed. A green bar indicates a coefficient that reduces risk. A red bar indicates a coefficient that increases risk. The bar length indicates the strength of the prediction. CareQ/NHA, patient-reported nursing clinical assessment completed at the patient’s initial visit; ECOG, Eastern Cooperative Oncology Group.
DISCUSSION
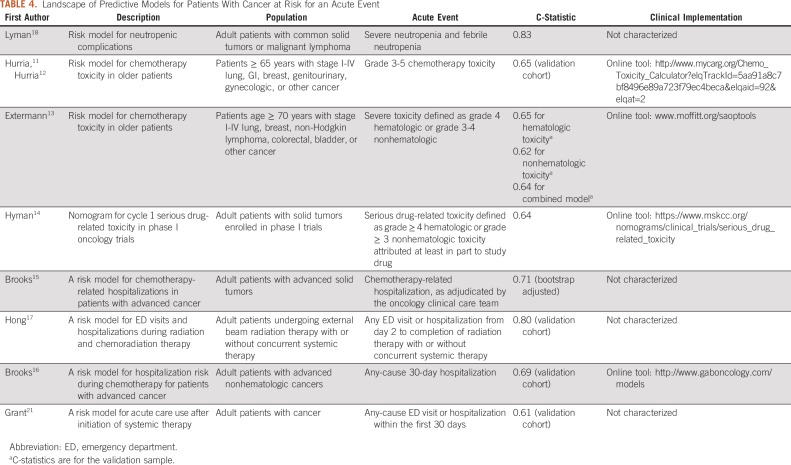
To our knowledge, this report is the first of an operationally implemented, clinically relevant risk prediction model that identifies patients initiating antineoplastic treatment who are most likely to require a PPACV. Compared with other models that have identified patients at risk for toxicity during cancer treatment (Table 4), our model differs in significant ways with respect to the methodology, the target patient population, the acute event of interest, and the clinical implementation.11-18,21 The model described here is bespoke to our institution, which enables it to access the richness of data in the EMR, including common elements used in other risk models (eg, laboratory values like albumin), and more unique features that were found to be predictive, including referrals (eg, social work, palliative care, referral for assistance with transportation), home medications (eg, opioids), and patient-reported outcomes (eg, feeling like pain relief not acceptable). Another difference is that we targeted all adult patients regardless of age or intent of treatment and included patients receiving therapies beyond chemotherapy, such as those treated with immunotherapy and targeted agents. Our model also serves a need expressly called for in the literature to identify patients at risk for preventable acute care and not all-cause acute care because these PPACVs might be more readily avoided with intensive monitoring and management.21
TABLE 4.
Landscape of Predictive Models for Patients With Cancer at Risk for an Acute Event
Finally, a key strength of our model is that it was designed to be clinically relevant and operationally implemented. We were able to achieve this because we addressed the four barriers to useful clinical risk prediction specified by Shah et al22 and discussed here.
The first barrier is thoughtful identification of risk-sensitive decisions. Prior research has established that PPACVs are prevalent among patients with cancer, suggesting that judging risk and marshalling resources to mitigate that risk could be improved with better tools.8 At MSK, 1,154 (62.5%) of the 1,845 UCC visits in 2016 by patients initiating active treatment were for symptoms that could potentially be safely managed on an outpatient basis if identified early and addressed proactively.19 This is a risk-sensitive decision given the costs and clinician/patient burden of intensive monitoring on one side and the poor outcomes associated with acute care on the other side. The EMR provides little insight to guide decision making in this context, and current care delivery models could benefit from improved risk prediction for PPACVs.
The second barrier is importance of model calibration. The building of our model for a clinical program, with known resource constraints, allowed us to a priori train, tune, and evaluate our model. We emphasized positive predictive value at the upper quartile over the C-statistic to tailor the model for the needs of a clinical program focused on high-risk patients. Like Shah et al,22 we understood that poor calibration can lead to harmful decisions and that model assessment must consider constraints of the care environment.27 At a 25% cutoff, our model succeeded in identifying those patients who contributed 35% of PPACVs and more than half of potentially preventable inpatient bed days and did so with a precision of 42%. This allows us to make decisions about how best to use resources for those most in need to prevent suffering.
The third barrier is user trust, transparency, and commercial interests. We needed to build trust because clinicians were enrolling high-risk patients identified by the model into a new program of intensive monitoring. We built this trust by including physicians and nurses throughout the model-building process. In addition, by implementing the riskExplorer, we provided clinicians with a view of the drivers of each patient’s risk, which allowed us to further engage providers. On the machine learning continuum, we moved away from the black box approach, such as an XGBoost model that provides a minor performance gain but little insight, to an algorithm that produced a transparent output that was easy for clinicians to understand and use in practice.28,29 For example, in Figure 2, the features that surfaced (referral to palliative care, oxycodone use, patient-reported outcome of intermittent pain on presentation) highlight that pain was an issue to be intensely monitored in this patient. Clinicians were asked to review the model for each patient, which allowed them to oversee and monitor the model as a partner in patient care.29
This process of building trust in risk prediction models has been used in other high-risk industries like child protective services (CPS).30,31 Some CPS agencies use a predictive analytics algorithm to identify the families most in need of an intervention. The model is used to determine which calls to investigate but not in the decision to remove a child from the home. By introducing the model in this measured way, the developers built trust with social workers. Like CPS, we used artificial intelligence to screen for the patients most likely to benefit from supportive services but not for dictating treatment. We also avoided commercial vendors to maintain the integrity and ownership of the data for our patients and physicians.32
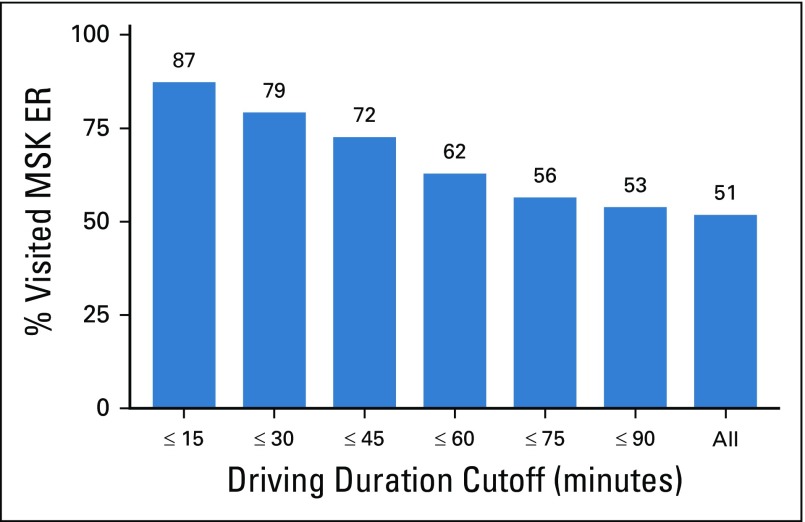
The fourth barrier is data quality and heterogeneity. To limit bias and the effect of incomplete data on the model, we had to understand and address issues associated with data quality and heterogeneity inherent in an EMR-driven model. An example was the effect of driving distance on UCC visits. We analyzed a limited set of Medicare data as a proxy and found that the distance a patient lives from our UCC was proportional to his or her probability of using that facility (Appendix Fig A3). By limiting inclusion to patients with no more than a 30-minute driving duration, we minimized the potential impact of this bias. Furthermore, because of the ever-changing nature of hospital data, we know that heterogeneity is also a function of time. This is clearly demonstrated by the drop in baseline risk of a PPACV from 37% to 30% between our training and testing sets. To account for this, we used two strategies. First, we used a time-based data split to ensure that we evaluated the performance and calibration of our model using current data. Second, we used a time-weighting strategy to tune and build our final model, which enabled us to improve generalizability.
Our model has been piloted for > 1 year in 18 practices as part of MSK’s InSight Care program.33 A goal of the InSight Care program is to reduce PPACVs by using this predictive model to identify high-risk patients and enroll them in a cohort program that provides intensive symptom monitoring at home through a digital platform. Future studies will examine the effectiveness of the InSight Care approach.
Our model has several limitations. Similar to other models using EMR data, the risk prediction model we developed is bespoke, meaning that it was trained specifically to fit the data at MSK and, therefore, may not be generalizable to other institutions.34 However, the learnings on how to develop and implement a machine learning model that is clinically relevant have generalizability in oncology and in health care more broadly. Another limitation is that our risk model is only predictive at the onset of antineoplastic treatment. A dynamic prediction of risk throughout the treatment course that incorporates patient-reported outcomes might be valuable to providers. While this could be a future iteration, we designed the model for our current program needs. Finally, we lack an understanding of how clinicians use and interpret the risk model in the clinic. Additional qualitative research will be undertaken to probe how oncologists perceive machine learning can be integrated into the workflow to assist them in risk-sensitive decision making.
In conclusion, the DHHS has stated that improving patients’ quality of life by keeping patients out of the hospital is a main goal of cancer care. Our risk prediction model is intended to help us to achieve that goal by flagging at-risk patients before the start of their treatment; providing a transparent, easy-to-understand clinician interface; and integrating the model into clinical operations to present this information at the point of care.
Appendix
Building the Predictive Model
Split the data into three sets: training, validation, testing. The testing set consists of the past 6 months of data (April 2018-September 2018). The validation set consists of the 6 months before that (October 2017-March 2018). The training set uses the remainder of the data (January 2014-September 2017).
Select the best combination of the model hyperparameters T (time-scaling parameter) and λ (least absolute shrinkage and selection operator regularization parameter) by training the model using the training set and evaluating using the validation set.
Build final model using the training set with the best-performing hyperparameters and calculate performance using the testing set.
FIG A1.
Data dictionary. AHS, Adult Health Screening; MSK, Memorial Sloan Kettering; NA, not applicable.
FIG A2.
Clinician e-mail. UCC, Urgent Care Center.
FIG A3.
Driving distance to Memorial Sloan Kettering (MSK) and probability of visiting the MSK Urgent Care Center (UCC). When we investigated whether MSK patients were more likely to go to MSK or an outside hospital emergency department (ED) or urgent care on the basis of driving duration, we found that patients who lived within 30 minutes came to MSK approximately 79% of the time, compared with using all patients where only 51% visited the MSK UCC. Driving duration was based on patients’ addresses and Google Maps (Google, Mountain View, CA)–estimated average driving duration on a weekday.
TABLE A1.
Strategy for Handling Missing Values
TABLE A2.
Comparison of Performance Among Models
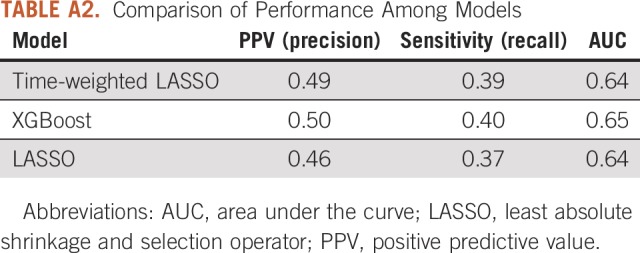
TABLE A3.
Model PPV and Sensitivity at Different Patient Enrollment Levels
Footnotes
Presented at the American Society of Clinical Oncology 2019 Annual Meeting, Chicago, IL, May 31-June 4, 2019.
B.D. and D.G. are co-first authors.
Supported in part through National Cancer Institute Cancer Center Support grant P30 CA008748. The funder had no role in study design; in the collection, analysis, and interpretation of data; in the writing of the report; and in the decision to submit the article for publication.
AUTHOR CONTRIBUTIONS
Conception and design: Bobby Daly, Dmitriy Gorenshteyn, Kevin J. Nicholas, Alice Zervoudakis, Stefania Sokolowski, Lynn Adams, Han Xiao, Yeneat O. Chiu, Lauren Katzen, Margarita Rozenshteyn, Diane L. Reidy-Lagunes, Brett A. Simon, Wendy Perchick, Isaac Wagner
Administrative support: Abigail Baldwin-Medsker, Han Xiao, Wendy Perchick
Provision of study material or patients: Alice Zervoudakis, Han Xiao, Diane L. Reidy-Lagunes
Collection and assembly of data: Bobby Daly, Dmitriy Gorenshteyn, Kevin J. Nicholas, Stefania Sokolowski, Claire E. Perry, Lior Gazit, Han Xiao, Margarita Rozenshteyn, Diane L. Reidy-Lagunes
Data analysis and interpretation: Bobby Daly, Dmitriy Gorenshteyn, Kevin J. Nicholas, Alice Zervoudakis, Stefania Sokolowski, Lior Gazit, Abigail Baldwin-Medsker, Rori Salvaggio, Han Xiao, Margarita Rozenshteyn, Diane L. Reidy-Lagunes
Manuscript writing: All authors
Final approval of manuscript: All authors
Accountable for all aspects of the work: All authors
AUTHORS' DISCLOSURES OF POTENTIAL CONFLICTS OF INTEREST
The following represents disclosure information provided by authors of this manuscript. All relationships are considered compensated unless otherwise noted. Relationships are self-held unless noted. I = Immediate Family Member, Inst = My Institution. Relationships may not relate to the subject matter of this manuscript. For more information about ASCO's conflict of interest policy, please refer to www.asco.org/rwc or ascopubs.org/cci/author-center.
Open Payments is a public database containing information reported by companies about payments made to US-licensed physicians (Open Payments).
Bobby Daly
Leadership: Quadrant Holdings
Stock and Other Ownership Interests: Quadrant Holdings (I), CVS Health, Johnson & Johnson, McKesson, Walgreens Boots Alliance, Eli Lilly (I), Walgreens Boots Alliance (I), IBM Corporation, Roche (I)
Other Relationship: AstraZeneca
Diane L. Reidy-Lagunes
Honoraria: Novartis
Consulting or Advisory Role: Ipsen, Novartis, Lexicon, AAA
Research Funding: Novartis, Ipsen
Brett A. Simon
Patents, Royalties, Other Intellectual Property: Patent application US2015/0290418, patent application US13/118109
Isaac Wagner
Consulting or Advisory Role: Nan Fung Life Sciences
No other potential conflicts of interest were reported.
REFERENCES
- 1.Kolodziej M, Hoverman JR, Garey JS, et al. Benchmarks for value in cancer care: An analysis of a large commercial population. J Oncol Pract. 2011;7:301–306. doi: 10.1200/JOP.2011.000394. [DOI] [PMC free article] [PubMed] [Google Scholar]
- 2.Brooks GA, Abrams TA, Meyerhardt JA, et al. Identification of potentially avoidable hospitalizations in patients with GI cancer. J Clin Oncol. 2014;32:496–503. doi: 10.1200/JCO.2013.52.4330. [DOI] [PMC free article] [PubMed] [Google Scholar]
- 3.El-Jawahri A, Keenan T, Abel GA, et al. Potentially avoidable hospital admissions in older patients with acute myeloid leukaemia in the USA: A retrospective analysis. Lancet Haematol. 2016;3:e276–e283. doi: 10.1016/S2352-3026(16)30024-2. [DOI] [PubMed] [Google Scholar]
- 4.Johnson PC, Xiao Y, Wong RL, et al. Potentially avoidable hospital readmissions in patients with advanced cancer. J Oncol Pract. 2019;15:e420–e427. doi: 10.1200/JOP.18.00595. [DOI] [PMC free article] [PubMed] [Google Scholar]
- 5.Panattoni L, Fedorenko C, Greenwood-Hickman MA, et al. Characterizing potentially preventable cancer- and chronic disease-related emergency department use in the year after treatment initiation: A regional study. J Oncol Pract. 2018;14:e176–e185. doi: 10.1200/JOP.2017.028191. [DOI] [PubMed] [Google Scholar]
- 6.Jairam V, Lee V, Park HS, et al. Treatment-related complications of systemic therapy and radiotherapy. JAMA Oncol. 2019;5:1028–1035. doi: 10.1001/jamaoncol.2019.0086. [DOI] [PMC free article] [PubMed] [Google Scholar]
- 7. Mathematica Policy Research: Admissions and emergency department visits for patients receiving outpatient chemotherapy measure technical report. 2016. https://www.cms.gov/Medicare/Quality-Initiatives-Patient-Assessment-Instruments/HospitalQualityInits/Measure-Methodology.
- 8. Department of Health and Human Services; Centers for Medicare & Medicaid Services: Medicare program; hospital inpatient prospective payment systems for acute care hospitals and the long-term care hospital prospective payment system and policy changes and fiscal year 2017 rates; quality reporting requirements for specific providers; graduate medical education; hospital notification procedures applicable to beneficiaries receiving observation services; technical changes relating to costs to organizations and Medicare cost reports; finalization of interim final rules with comment period on LTCH PPS payments for severe wounds, modifications of limitations on redesignation by the Medicare Geographic Classification Review Board, and extensions of payments to MDHs and low-volume hospitals, 2016. https://www.gpo.gov/fdsys/pkg/FR-2016-08-22/pdf/2016-18476.pdf. [PubMed]
- 9. Daly RM, Abougergi MS: National trends in admissions for potentially preventable conditions among patients with metastatic solid tumors, 2004-2014. J Clin Oncol 36, 2018 (suppl; abstr 1) [Google Scholar]
- 10.Handley NR, Schuchter LM, Bekelman JE. Best practices for reducing unplanned acute care for patients with cancer. J Oncol Pract. 2018;14:306–313. doi: 10.1200/JOP.17.00081. [DOI] [PMC free article] [PubMed] [Google Scholar]
- 11.Hurria A, Togawa K, Mohile SG, et al. Predicting chemotherapy toxicity in older adults with cancer: A prospective multicenter study. J Clin Oncol. 2011;29:3457–3465. doi: 10.1200/JCO.2011.34.7625. [DOI] [PMC free article] [PubMed] [Google Scholar]
- 12.Hurria A, Mohile S, Gajra A, et al. Validation of a prediction tool for chemotherapy toxicity in older adults with cancer. J Clin Oncol. 2016;34:2366–2371. doi: 10.1200/JCO.2015.65.4327. [DOI] [PMC free article] [PubMed] [Google Scholar]
- 13.Extermann M, Boler I, Reich RR, et al. Predicting the risk of chemotherapy toxicity in older patients: The Chemotherapy Risk Assessment Scale for High-Age Patients (CRASH) score. Cancer. 2012;118:3377–3386. doi: 10.1002/cncr.26646. [DOI] [PubMed] [Google Scholar]
- 14.Hyman DM, Eaton AA, Gounder MM, et al. Nomogram to predict cycle-one serious drug-related toxicity in phase I oncology trials. J Clin Oncol. 2014;32:519–526. doi: 10.1200/JCO.2013.49.8808. [DOI] [PMC free article] [PubMed] [Google Scholar]
- 15.Brooks GA, Kansagra AJ, Rao SR, et al. A Clinical prediction model to assess risk for chemotherapy-related hospitalization in patients initiating palliative chemotherapy. JAMA Oncol. 2015;1:441–447. doi: 10.1001/jamaoncol.2015.0828. [DOI] [PMC free article] [PubMed] [Google Scholar]
- 16. doi: 10.1200/CCI.18.00147. Brooks GA, Uno H, Aiello Bowles EJ, et al: Hospitalization risk during chemotherapy for advanced cancer: Development and validation of risk stratification models using real-world data. JCO Clin Cancer Inform 10.1200/CCI.18.00147. [DOI] [PMC free article] [PubMed] [Google Scholar]
- 17. doi: 10.1200/CCI.18.00037. Hong JC, Niedzwiecki D, Palta M, et al: Predicting emergency visits and hospital admissions during radiation and chemoradiation: An internally validated pretreatment machine learning algorithm. JCO Clin Cancer Inform 10.1200/CCI.18.00037. [DOI] [PubMed] [Google Scholar]
- 18.Lyman GH, Kuderer NM, Crawford J, et al. Predicting individual risk of neutropenic complications in patients receiving cancer chemotherapy. Cancer. 2011;117:1917–1927. doi: 10.1002/cncr.25691. [DOI] [PMC free article] [PubMed] [Google Scholar]
- 19.Daly B, Nicholas K, Gorenshteyn D, et al. Misery loves company: Presenting symptom clusters to urgent care by patients receiving antineoplastic therapy. J Oncol Pract. 2018;14:e484–e495. doi: 10.1200/JOP.18.00199. [DOI] [PMC free article] [PubMed] [Google Scholar]
- 20. Rajkomar A, Oren E, Chen K, et al: Scalable and accurate deep learning with electronic health records. npj Digital Med 1:18, 2018. [DOI] [PMC free article] [PubMed]
- 21.Grant RC, Moineddin R, Yao Z, et al. Development and validation of a score to predict acute care use after initiation of systemic therapy for cancer. JAMA Netw Open. 2019;2:e1912823. doi: 10.1001/jamanetworkopen.2019.12823. [DOI] [PMC free article] [PubMed] [Google Scholar]
- 22.Shah ND, Steyerberg EW, Kent DM. Big data and predictive analytics: Recalibrating expectations. JAMA. 2018;320:27–28. doi: 10.1001/jama.2018.5602. [DOI] [PubMed] [Google Scholar]
- 23.Memorial Sloan Kettering Cancer Center The Urgent Care Unit at MSK. https://www.mskcc.org/cancer-care/patient-education/urgent-care-center
- 24. Memorial Sloan Kettering Pharmacy and Therapeutics Committee: Memorial Sloan-Kettering Cancer Center Antiemetic Guidelines for Adults: Version 9.0. New York, NY, Memorial Sloan Kettering, 2017.
- 25.Friedman J, Hastie T, Tibshirani R. Regularization paths for generalized linear models via coordinate descent. J Stat Softw. 2010;33:1–22. [PMC free article] [PubMed] [Google Scholar]
- 26. Chen T, Guestrin C: XGBoost: A scalable tree boosting system. Proc 22nd ACM SIGKDD Int Conf Knowl Discov Data Mining 785-794, 2016. [Google Scholar]
- 27. doi: 10.1001/jama.2019.10306. Shah NH, Milstein A, Bagley SC: Making machine learning models clinically useful. JAMA . [epub ahead of print on August 8, 2019] [DOI] [PubMed] [Google Scholar]
- 28.Beam AL, Kohane IS. Big data and machine learning in health care. JAMA. 2018;319:1317–1318. doi: 10.1001/jama.2017.18391. [DOI] [PubMed] [Google Scholar]
- 29.Verghese A, Shah NH, Harrington RA. What this computer needs is a physician: Humanism and artificial intelligence. JAMA. 2018;319:19–20. doi: 10.1001/jama.2017.19198. [DOI] [PubMed] [Google Scholar]
- 30. Hurley D: Can an algorithm tell when kids are in danger? The New York Times Magazine, 2018. https://www.nytimes.com/2018/01/02/magazine/can-an-algorithm-tell-when-kids-are-in-danger.html.
- 31. Chouldechova A, Benavides-Prado D, Fialko O, et al: A case study of algorithm-assisted decision making in child maltreatment hotline screening decisions. Proc Machine Learn Res, 81:1-15, 2018. [Google Scholar]
- 32.Darcy AM, Louie AK, Roberts LW. Machine learning and the profession of medicine. JAMA. 2016;315:551–552. doi: 10.1001/jama.2015.18421. [DOI] [PubMed] [Google Scholar]
- 33. Daly B, Baldwin-Medsker A, Perchick W: Using remote monitoring to reduce hospital visits for cancer patients, 2019 https://hbr.org/2019/11/using-remote-monitoring-to-reduce-hospital-visits-for-cancer-patients. [Google Scholar]
- 34.Morgan DJ, Bame B, Zimand P, et al. Assessment of machine learning vs standard prediction rules for predicting hospital readmissions. JAMA Netw Open. 2019;2:e190348. doi: 10.1001/jamanetworkopen.2019.0348. [DOI] [PMC free article] [PubMed] [Google Scholar]


