

Abstract
Phaseolus vulgaris, commonly known as French bean is a vital leguminous crop worldwide and India stood 1st rank in dry bean and 4th rank in green bean production worldwide (FAOSTAT 2017). However, this production is severely affected by Mungbean yellow mosaic India virus (MYMIV) infection. Hence it is very important to identify MYMIV tolerant P. vulgaris cultivars. MYMIV infection results in the production of reactive oxygen species and plant cells have evolved complex defense mechanisms at different levels to overcome the damage. Our study for the first time focused on the changes at the morphological and biochemical level, as well as on the relative quantification of MYMIV genes in nine cultivars of P. vulgaris after MYMIV infection. Highest growth and the highest accumulation of four antioxidants of cv. ‘Anupam’ after MYMIV infection, established that cv. ‘Anupam’ was less affected by MYMIV infection amongst all nine cultivars. Relative quantification studies also correlated well with these results. Additionally, there is a consistent level of photosynthetic pigments content in mock- and MYMIV-treated seedlings of cv. ‘Anupam’ over early infection period. Combining all the results we conclude that cv. ‘Anupam’ is a MYMIV tolerant cultivar.
Electronic supplementary material
The online version of this article (10.1007/s12298-019-00741-w) contains supplementary material, which is available to authorized users.
Keywords: MYMIV, Antioxidants, MYMIV titer, Phaseolus vulgaris, RT-qPCR, MYMIV tolerance
Introduction
Plants like other lives on this earth always has been facing a great risk of getting infection from pathogens like bacteria, viruses and fungi. Four distinct begomoviruses have been identified across Southern Asia responsible for yellow mosaic disease (YMD) namely, Mungbean yellow mosaic virus (MYMV), Mungbean yellow mosaic India virus (MYMIV), Horsegram yellow mosaic virus (HgYMV) and Dolichos yellow mosaic virus (DoYMV) (Qazi et al. 2007; Reddy et al. 2015). Among them, MYMIV is a major constraint to the production of most of the major legume crops, French bean (Phaseolus vulgaris), Mungbean (Vigna mungo), Cluster bean (Cyamopsis tetragonoloba), Groundnut (Arachis hypogaea), Horsegram (Macrotylo mauniflorum), Hyacinth bean (Lablab purpureus), Moth bean (Vigna aconitifolia), Lima bean, Pigeonpea (Cajanus cajan) and Soybean (Glycine max) and is the subject of immense concern worldwide (Varma and Malathi 2003; Basak et al. 2004). MYMIV causes yellow mosaic disease (YMD) and is easily transmitted by white fly, Bemisia tabaci (Clarke et al. 2002; Kundu et al. 2015).YMD is characterized by stunt growth, curling, yellowing and yellow mosaic symptoms on leaves, and deformed fruits with small malformed fewer seeds in the pods in infected plants (Nariani 1960; Nene 1973; Naimuddin et al. 2011; Obaiah et al. 2014). Many reports have established the degradation of photosynthetic pigments with the development of yellow mosaic symptoms caused by MYMIV infection and positively correlated with the susceptibility of infection (Kundu et al. 2015; Chakraborty and Basak 2018; Kundu et al. 2019). MYMIV is the prevalent strain that causes YMD in leguminous crops in northern, central and eastern part of India (Reddy et al. 2015). YMD causes enormous fall in productivity of beans not only in India, but also in Pakistan, Bangladesh, Sri Lanka and adjacent areas of South East Asia (Varma and Malathi 2003; Basak et al. 2004; Qazi et al. 2007; Biswas et al. 2008, 2009). YMD also causes deformed and non-viable seeds (Kothandaraman et al. 2016). Intensive cropping and abuse of pesticides are some of the factors aiding vector multiplication and spread (Varma et al. 2011). MYMIV has single stranded circular bipartite genome consisting of two genomic components known as DNA-A and DNA-B. Each component is 2.6–2.8 kb in length. DNA-A encodes coat protein and proteins associated with replication and transcription activation. Both DNA-A and DNA-B are essential for viral pathogenicity (Singh et al. 2006; Yadav et al. 2009). DNA-A has two open reading frames (ORFs) in the viral sense strand namely AV1 (coat protein, CP) and AV2 (pre coat protein) and five ORFs in the complementary sense strand namely AC1 (replication associated protein, Rep), AC2 (transcription activator protein, TrAP), AC3 (replication enhancer protein, REn), AC4 (symptom determinant) and AC5 (pathogenicity determinant). In DNA-B, one ORF named BV1 (nuclear shuttle protein, NSP) is in viral sense strand, while the other ORF BC1 (movement protein, MP) is in complementary sense strand (Usharani et al. 2004; Li et al. 2015). MYMIV replicates by rolling circle replication (RCR) mechanism with the help of few viral and several host factors. AC1, an early expressed gene essential for RCR, exhibits feedback inhibition of its own synthesis by binding to its own transcription start site. AC2 activates transcription and also transactivates the late expressed genes, AV1, BC1 and BV1. AC2 is also a pathogenicity factor that suppresses multiple host defense pathways. AC1 and AC2 synergistically activate the transcription of AV1 gene (Shivaprasad et al. 2005; Fondong 2013). AC4 and AC5 suppresses RNA silencing, a major antiviral response developed by the host, and thereby help in symptom development and virus movement (Singh et al. 2007; Fondong 2013; Li et al. 2015). AV1 is a late responsive multifunctional protein that is required for various functions associated with encapsidation, accumulation of viral ssDNA via RCR, insect transmission and intra as well as inter-cellular viral movement. AV2 also suppresses host mediated RNA silencing. BV1shuttles the nascent viral DNA from nucleus to cytoplasm where it interacts with BC1and this interaction helps in the intra as well as inter-cellular movement of the virus within the plant (Fondong 2013). So, for disease development and its progression, both DNA-A and DNA-B are interdependent on each other.
It is already established that viral infection imbalances cellular redox state and leads to the formation of superoxide anion (O.−2), hydrogen peroxide (H2O2) or the hydroxyl radical (OH.) and its generation has been studied in geminivirus infected Capsicum annuum, Gossypium arboretum and Vigna mungo during transcriptome analysis (Clarke et al. 2002; Góngora-Castillo et al. 2012; Kundu et al. 2015; Naqvi et al. 2017; Chakraborty and Basak 2018). These partially reduced forms are referred to as reactive oxygen species (ROS). ROS damages DNA, proteins and unsaturated lipids surrounding infection court that lead to cellular dysfunctions and eventually cell dies, thereby restricting the growth and limiting the systemic spread of the infection further, known as hypersensitive response (O’Brien et al. 2012; Baxter et al. 2014; Etalo et al. 2013). ROS is detoxified by the synthesis and accumulation of various compounds of which important are antioxidants, carotenoids, flavonoids, vitamin C and E (Noctor and Foyer 1998; Pignocchi and Foyer 2003; Apel and Hirt 2004; Sharma and Dietz 2006). Generation of antioxidants are the prompt effective response of plant host that not only prevent the systemic spread of disease but also enable plants limiting oxidative damage for its survival and are directly correlated with the stress tolerance in plants (Hakmaoui et al. 2012; Das and Roychoudhury 2014; Chakraborty and Basak 2018). Better the antioxidant competence against oxidative damage, more will be the survival rate that eventually leads to sound growth and development of the host plant. Additionally, antioxidants are also reported to affect expression of genes related to stress (Foyer and Noctor 2005; Jaleel et al. 2009; Kasote et al. 2015).
Geminivirus causes severe devastation in economically important crops worldwide. Efficient methods to control diseases caused by these viruses are still lacking. Hence, breeding for resistance, which is also cheap and eco-friendly, is an important alternative for seed producers and breeders (Lapidot and Friedmann 2002; Shepherd et al. 2009; García-Neria and Rivera-Bustamante 2011). Till date, several efforts have been made to identify resistant crops for capsicum, tomato, cotton, bean, and cassava (Wang et al. 1999; Lapidot and Friedmann 2002; Anaya-López et al. 2003; Seo et al. 2004; Ji et al. 2007; Vidavski et al. 2008; Garrido-Ramirez et al. 2000). The only report on P. vulgaris was carried out by Clarke et al. (2002) where the antioxidant accumulation and viral titer quantification were studied after white clover mosaic potexvirus infection and hormone treatment. The correlation has already been established between the changes in leaf morphology of P. vulgaris and Bean Rugose Mosaic Virus infection by Flores and Marin (1980). The changes in plant growth and development upon virus infection are a well-known fact (Broadbent 1964; Fraser and Matthews 1981; Mofunanya et al. 2015). Keeping in mind the economic importance of P. vulgaris worldwide and its enormous use as food and fodder in India, we made an attempt to identify P. vulgaris cultivar that can tolerate MYMIV infection. In the present study, nine cultivars of P. vulgaris were assessed at morphological and biochemical level as well as on the relative quantification of MYMIV genes following MYMIV infection. Root length, shoot length, fresh weight and dry weight of these nine cultivars during MYMIV infection were studied as morphological parameters. For biochemical parameters, several antioxidant enzymes namely Superoxide dismutase (SOD), Guaiacol peroxidase (Guaiacol POD), catalase (CAT), stress marker proline and photosynthetic pigments were assayed. For relative quantification studies, expressions of few early and late expressed genes of MYMIV were quantitated through Real time quantitative Polymerase Chain Reaction (RT-qPCR) to understand the nature of viral infection in the host plant. From the results of the morphological, biochemical and relative quantification studies, we compared the differential response of the nine P. vulgaris cultivars during MYMIV infection and identified the cv. ‘Anupam’ as a MYMIV tolerant cultivar. This MYMIV tolerant cv. ‘Anupam’ will aid in the agricultural economy of our country.
Materials and methods
Plant material and stress treatment
Nine P. vulgaris cultivars namely ‘Anupam’, ‘Seville’, ‘Arkasuvidha’, ‘Falguni’, ‘Arjun’, ‘Seletion-9’(S-9), ‘LAP-1’, ‘LAP-2’ and ‘Malgudi’ were studied. MYMIV is the prevalent strain that causes YMD in the leguminous crops in northern, central and eastern part of India (Reddy et al. 2015). Hence, we were restricted to use P. vulgaris cultivars only from northern, central and eastern part of India. Except ‘LAP-1’ and ‘LAP-2’, all the remaining cultivars were obtained from Bidhan Chandra Krishi Viswavidyalaya, West Bengal, India. ‘LAP-1’ and ‘LAP-2’ were obtained from Liebigs Agro Chem. Pvt. Ltd, Kolkata, India. All nine cultivars were authentic and collected from the genuine sources. Healthy seeds were surface sterilized with 0.5% Sodium hypochlorite and germinated in the dark at 28 °C for 2 days. The germinated seeds were allowed to grow in the plant growth chamber (Lab Tech) for 10 days with a light and dark cycle of 16 h and 8 h, respectively, at 24 °C. Ten days old healthy seedlings were agroinoculated with 20 μl of Agrobacterium tumefaciens strain EHA 105 already transformed with pCAMBIA-A2B2 (pCAMBIA is the plasmid vector harbouring double dimer of MYMIV DNA-A and DNA-B) of MYMIV by stem-agroinoculation method around the growing nodal region of the stem by pricking with 30 gaze needle (pCAMBIA-A2B2 plasmid constructs were received from Dr. Debasis Chattopadhyay, National Institute of Plant Genome research, New-Delhi) (Yadav et al. 2009). For mock inoculation, Agrobacterium empty vector pCAMBIA 1305.1 was used.
For all subsequent morphological, biochemical, and relative quantification studies, at every experimental day, three seedlings of similar growth were considered as one biological replicate. For each biological replicate, three technical replicates of stress- and mock-treated seedlings were analyzed for each day post infection (dpi).
Incidence of yellow mosaic disease
After stem-agroinoculation, all seedlings of nine cultivars were maintained in plant growth chamber at 24 °C and with a light and dark cycle of 16 h and 8 h, respectively. Yellow mosaic disease (YMD) symptoms were observed up to 15 dpi and were recorded based on visual symptom.
Morphological parameters
Four morphological parameters namely root length, shoot length, fresh weight and dry weight were measured at day 1, day 2 and day 3 post inoculation from the stress- and mock-treated plants. The early time points were chosen to understand the manifestation of YMD in early phase of plant-pathogen interaction related to MYMIV-resistance or susceptibility as within this time period major changes in morphology and biochemistry of the host plant occurs to defend the onset of infection (Kundu et al. 2015). Many reports also has been published showing the effects of stress on morphology and enzyme activity of plants (Clarke et al. 2002; Dinneny et al. 2008; Hafez et al. 2012; Jaiswal et al. 2013; Ghosh and Xu. 2014; Kundu et al. 2015; Karimi et al. 2016; Koevoets et al. 2016; Pandey et al. 2017; Gimenez et al. 2018). Root length and shoot length were measured graphically. Fresh weight was measured on weighing machine. The whole plant was allowed to dry in an incubator at 70 °C overnight and then dry weight was weighed in weighing machine.
Biochemical assays
Biochemical assays were carried out for three antioxidant enzymes namely SOD, Guaiacol POD and CAT and for one non-enzymatic antioxidant Proline at day 1, day 2 and day 3 post inoculation from the stress- and mock-treated plants.
Antioxidant enzyme assays
For enzyme extraction, ~ 100 mg healthy leaves were ground with 0.1 M Tris-HCl buffer (pH 7.5) containing 5% (w/v) sucrose and 0.1% 2-mercaptoethanol (3:1 buffer volume/Fresh weight) and centrifuged at 10,000 g for 20 min (Abedi and Pakniyat 2010). The supernatant was used for spectrophotometric analysis of enzyme activity thereafter. All the steps were carried out at 4 °C.
SOD assay
SOD assay was based on the method of Dhindsa et al. (1981). One unit of SOD activity is defined as the amount of enzyme required to inhibit 50% of the reduction of Nitroblue tetrazolium (NBT). The reaction mixture contained 50 mM K-phosphate buffer (pH 7.8), 13 mM methionine, 4 μM riboflavin, 0.1 μM EDTA and the requisite amount of enzyme extract. The reaction was started by adding 75 μM NBT to the reaction mixture. After 15 min, the absorbance of reduced NBT was measured at 560 nm in the spectrophotometer (UV-1800 Spectrophotometer, Shimadzo).
Guaiacol POD assay
Guaiacol POD was measured by monitoring the formation of tetra guaiacol at 436 nm (ε = 26.6 mM−1 cm−1) using H2O2 as substrate according to the method of Polle et al. 1994. One unit of guaiacol POD activity is defined as the amount of enzyme required for the formation of 1 mM of tetra-guaiacol per minute. The tetra guaiacol formation started on adding 10 mM H2O2 to the reaction mixture containing 100 mM K-phosphate buffer (pH 7.0) and 20.1 mM guaiacol and enzyme extract. The increase in absorbance was recorded at 436 nm for 5 min in the spectrophotometer.
Catalase assay
Catalase assay was done according to the method of Aebi. 1984. One unit of CAT activity is defined as the amount of enzyme needed to reduce 1 µM H2O2 per min. The reaction was started by adding 33 mM H2O2 (ε = 40 mM−1 cm−1) in a reaction mixture containing enzyme extract in 50 mM sodium phosphate buffer (pH 7.0) and decrease in absorbance was recorded for 2 min at 240 nm.
Proline estimation
Proline estimation was done according to the method of Claussen 2005. The blue coloured proline-ninhydrin chromophore absorbance was measured in spectrophotomer at 546 nm (Claussen 2005). Proline concentration of the experimental sample was expressed in μg ml−1.
Quantification of viral genes by RT-qPCR
The expressions of seven MYMIV genes, AC1, AC2, AC3, AC4, AC5, AV1 and BC1 were quantified through RT-qPCR.
Genomic DNA isolation
Genomic DNAs were isolated from stress- and mock-treated leaf samples at 1, 2, 3, 6, 9 and 15 dpi according to the method of Swarnalatha et al. 2013. Isolated DNA samples were quantified on Nanodrop (JENWAY).
Primer designing
RT-qPCR primers were designed using Primer3 from the published sequences {GenBank accession nos.: EU523045, EU523046 (Yadav et al. 2009)} of AC1, AC2, AC3, AC4, AC5, AV1 and BC1 and were listed in Table 1. Insulin degrading enzyme gene (IDE) was used as an internal control (Borges et al. 2012).
Table 1.
RT-qPCR primer list for seven MYMIV genes and the internal control
| Gene name | Primer (5′–3′ direction) | Amplicon size (nt) |
|---|---|---|
| AC1 |
Forward primer: TGTGTTGACCTGCATCTGGA Reverse primer: AGGAGGACGCTCTTGAACAA |
184 |
| AC2 |
Forward primer: AGTCGCCGTCAAATAGTGGA Reverse primer: AGGTGCAAAATCCCCTCTCT |
170 |
| AC3 |
Forward primer: AGTCGCCGTCAAATAGTGGA Reverse primer: AGGTGCAAAATCCCCTCTCT |
170 |
| AC4 |
Forward primer: GGCCTCCAACTTTGATCCAG Reverse primer: CCATCCGAACATTCAGGCAG |
178 |
| AC5 |
Forward primer: GACAACGAGCCAAGTACAGC Reverse primer: GGTTCTCATACTTCGCTGCC |
187 |
| AV1 |
Forward primer: TGACAACGAGCCAAGTACAG Reverse primer: TGGTTCTCATACTTCGCTGC |
189 |
| BC1 |
Forward primer: TCTGTTGAGTGTTTTGCGGA Reverse primer: CTGCCTTCACCTTCCCAATT |
187 |
| IDE |
Forward primer: GCAACCAACCTTTCATCAGC Reverse primer: AGAAATGCCTCAACCCTTTG |
156 |
Quantification of viral gene expression
Expressions of seven MYMIV genes were quantified in a Bio-Rad CFX96 Real-Time PCR system at 1, 2, 3, 6, 9 and 15 dpi using Bio-Rad iQ SYBR green supermix. The standard curve was generated in order to evaluate the efficiency of the reactions. The Ct value was lowest at 100 ng gDNA concentration, and thus this concentration was selected for subsequent reactions. The reaction mixture contained 1X SYBR green supermix, 3.2 μM of each gene specific forward and reverse primers and 100 ng of gDNA. It was then incubated at 95 °C for 2 min, followed by 40 cycles of 95 °C for 10 s and 60 °C for 20 s. Melting curve analysis was carried out to verify the specificity of amplicons and primers. Each amplification reaction was done in triplicate and the specificity of primers and amplicons were confirmed by the presence of a single peak in the melt curve.
Statistical analysis
The data obtained are presented as mean ± SD (standard deviation). One-way analysis of variance (ANOVA) was done to analyze the data considering each variable among different dpi of a particular cultivar. A post hoc Duncan’s multiple range test was done at the 5% level of significance.
Photosynthetic pigment assay
According to Metzner et al. 1965 the chlorophyll pigments chlorophyll a, chlorophyll b and total carotenoid content were determined spectrophotometrically. Briefly, 100 mg of mock- and MYMIV-treated leaf tissues of cv. ‘Anupam’ were extracted in 85% (v/v) aqueous acetone. The homogenate was centrifuged at 4000 rpm for 10 min. and the supernatant was diluted to 10 ml by 85% aqueous acetone. The absorbance (E) was measured at three different wavelengths of 452.5, 644 and 663 nm.
Photosynthetic pigments were calculated as follows and expressed in mg gm−1 fresh weight.
Chlorophyll a = 10.3 * E663 − 0.98 * E644 = μg ml−1
Chlorophyll b = 19.7 * E644 − 3.87 * E663 = μg ml−1
Total Carotenoid Content = 4.2 * E452.5 − {(0.0264 * chlorophyll a) + (0.426 * chlorophyll b)} = μg ml−1
Results
Incidence of yellow mosaic disease
Incidence of YMD was studied till 15 dpi and it varied from cultivar to cultivars. The severity of yellow mosaic varied from mild to severe depending on the P. vulgaris cultivars. After 4 days of agro-inoculation experiments, symptoms like backward curling of the leaves started appearing on all of the cultivars except cv. ‘Anupam’. With the progression of the YMD, severe yellowing and yellow mosaic symptoms along with the backward curling of the leaves and chlorotic lesions were visible in all the cultivars except cv. ‘Anupam’ (Fig. 1e–f). In cv. ‘Anupam’, very few restricted yellow spots appeared on the leaves that ultimately led to hypersensitive response (HR), however no backward curling of the leaves were visible (Fig. 1a–c). After 15 dpi, except cv. ‘Anupam’, necrosis in all cultivars led to complete death whereas cv. ‘Anupam’ sustained the healthy growth with mild yellow spot symptoms. These observations indicated that cv. ‘Anupam’ can tolerate the MYMIV infection while other cultivars were susceptible to the infection.
Fig. 1.

Disease symptoms of YMD by MYMIV infection in P. vulgaris: a healthy seedling of cv. ‘Anupam’. b Leaf with few yellow spot in cv. ‘Anupam’. c Few Necrotised spot on leaf of cv. ‘Anupam’. d Healthy seedlings of all eight cultivars. e Leaves with yellow mosaic patches. f Curled deformed leaves along with necrotised leaf with chlorotic lesions
Morphological screening
Root length, shoot length, fresh weight and dry weight of the stressed plants were represented in terms of percent of increase with respect to the mock- treated plants. In all the nine cultivars, the increase in root length, shoot length, fresh weight and dry weight in stressed plants were less compare to mock ones (Fig. 2). The variations in shoot length, fresh weight and dry weight were much prominent than the root length variation throughout the infection period (p ≤ 0.05). Under MYMIV infection, cv. ‘Anupam’ showed the maximum growth of 98.5% and 98.6% in root length and shoot length, respectively, as well as maximum increase of 91.3% and 99% in fresh weight and dry weight, respectively, at 3 dpi. Cultivar ‘Seville’ showed the minimum values for all the four morphological parameters; 95.3%, 94.4%, 62.4% and 29.9% for root length, shoot length, fresh weight and dry weight, respectively, at 3 dpi. The response of the other cultivars lied in between. Thus, from the morphological analysis we can conclude that cv. ‘Anupam’ is less affected by MYMIV infection amongst all the nine cultivars.
Fig. 2.

Graph showing percentage of increase of stress treated plants with respect to the mock at 1, 2, 3 dpi. a root length, b shoot length, c fresh weight, d dry weight. Each column is the average of the three independent measure ± SD. Small alphabets notation on each error bars indicated significant differences and same alphabet notation indicated no significant differences at the 5% level of significance in between dpi of a particular variable
Biochemical screening
Assays of antioxidant enzyme SOD, guaiacol POD and CAT and estimation of proline were represented in terms of percent of increase with respect to mock sample (Fig. 3). Antioxidant enzyme activities as well as the proline content gradually increased in the stressed plants compared to the mock ones. Both the SOD and catalase activity were highest in cv. ‘Anupam’ (1305.9% and 946.5% respectively) at 3 dpi, while ‘LAP-2’ showed a significant high level (p ≤ 0.05). The SOD and catalase content showed the minimum accumulation in cv. ‘Seville’ throughout the infection period. The remaining cultivars showed a moderate activity of both the enzymes. Guaiacol POD activity was also found to be highest in cv. ‘Anupam’ (391.7%) and lowest in cv. ‘Seville’ (129.5%) at 3 dpi, while remaining cultivars showed a moderate accumulation of guaiacol POD from 1-3 dpi. The non-enzymatic proline content was highest in cv. ‘Anupam’ (493.6%) at 3 dpi whereas cultivars ‘Arjun’, ‘LAP-1’, ‘Malgudi’ and ‘Seville’ showed no significant variation from 1 to 3 dpi (p ≤ 0.05).
Fig. 3.

Graph showing percentage of increase of the stressed sample with stress treated plants with respect to the mock at 1, 2, 3 dpi. a superoxide dismutase, b guaiacol peroxidase, c catalase, d proline. Each column is the average of the three independent measure ± SD. Small alphabets notation on each error bars indicated significant differences and same alphabet notation indicated no significant differences at the 5% level of significance in between dpi of a particular variable
Biochemical studies revealed the highest accumulation of three antioxidant enzymes, SOD, Guaiacol POD and CAT and of one non-enzymatic antioxidant proline in the cv. ‘Anupam’ throughout the infection period. Thus from the biochemical assays, we can conclude that cv. ‘Anupam’ is the most tolerant of all the nine cultivars against MYMIV infection.
Quantification of viral gene expression
Quantification of seven MYMIV genes, AC1–AC5, AV1 and BC1 were carried out at 1, 2, 3, 6, 9, and 15 dpi in stressed plants. The IDE standard curve had the E value of 102.9%, R2 value of 0.829 and the slope value of − 3.255 (Supplementary file 1 Fig. 4). Melt curve showed a single peak (Supplementary file 2 Fig. 5). The nine cultivars of P. vulgaris, showed differential expression of AC1, AC2, AC3, AC4, AC5, AV1 and BC1genes at 1, 2, 3, 6, 9, and 15 dpi (Figs. 4, 5). The fold change of each gene in stressed plants were expressed using the formula 2-ΔCt (Schmittgen and Livak 2008) and represented as log base 10 values to show the highest and the lowest fold change of all the seven genes in all cultivars throughout the infection period. The AC1, AC2, AC3, AC4, AC5, AV1 and BC1 gene expressions were down-regulated in ‘Anupam’, ‘Arjun’, ‘Arkasuvidha’, ‘LAP-1’, ‘LAP-2’, ‘Malgudi’ and ‘S-9’ cultivars whereas in cv. ‘Falguni’ and ‘Seville’, their expressions were followed by a significant up-regulation at 6 and 9 dpi following infection, respectively (p ≤ 0.05). The most significant expression of AC1 was observed in cv. ‘Arjun’ (95.7 fold up-regulation) at 1 dpi and cv. ‘Falguni’ (0.19 fold up-regulation) at 15 dpi respectively, compared to 0 dpi (p ≤ 0.05). The expression of AC2 (194.01 fold change at 1 dpi; 12.13 fold change at 15 dpi), AC3 (24.25 fold change at 1 dpi; 6.06 fold change at 15 dpi), AC4 (3.03 fold change at 1 dpi; 1.52 fold change at 15 dpi), AC5 (139.19 fold change at 15 dpi), AV1 (4.27 fold change at 1 dpi; 0.76 fold change at 15 dpi) and BC1 (2.10 fold change at 1 dpi; 0.76 fold change at 15 dpi) were highest in cv. ‘Falguni’. The cv. ‘Arkasuvidha’ showed the minimum expression of AC1 (0.05 fold change at 1 dpi), AC2 (0.02 fold change at 1 dpi), AC3 (0.19 fold change at 1 dpi), AC4 (0.02 fold change at 1 dpi), AC5 (0.02 fold change at 1 dpi) and BC1 (0.01 fold change at 1 dpi) genes. In contrast, cv. ‘Anupam’ showed not much differential expression throughout infection period from 1 dpi to 15 dpi of AC1 (0.54 fold change at 1 dpi; 0.16 fold change at 15 dpi), AC2 (1.07 fold change at 1 dpi; 0.28 fold change at 15 dpi), AC3 (0.71 fold change at 1 dpi; 0.10 fold change at 15 dpi), AC4 (0.13 fold change at 1 dpi; 0.05 fold change at 15 dpi), AC5 (0.27 fold change at 1 dpi; 0.12 fold change at 15 dpi) and BC1 (0.20 fold change at 1 dpi; 0.05 fold change at 15 dpi) genes. The AV1 gene showed the minimum expression of 0.003 fold change at 1 dpi and 0.001 fold change at 15 dpi in cv. ‘Anupam’ amongst the nine cultivars (Figs. 4, 5).
Fig. 4.

Graph showing fold change expressed in log base 10 of stress treated at 1, 2, 3, 6, 9 and 15 dpi. aAC1, bAC2, cAC3, dAC4, eAC5, fBC1. Each column is the average of the three independent measure ± SD. Small alphabets notation on each error bars indicated significant differences and same alphabet notation indicated no significant differences at the 5% level of significance in between dpi of a particular variable
Fig. 5.
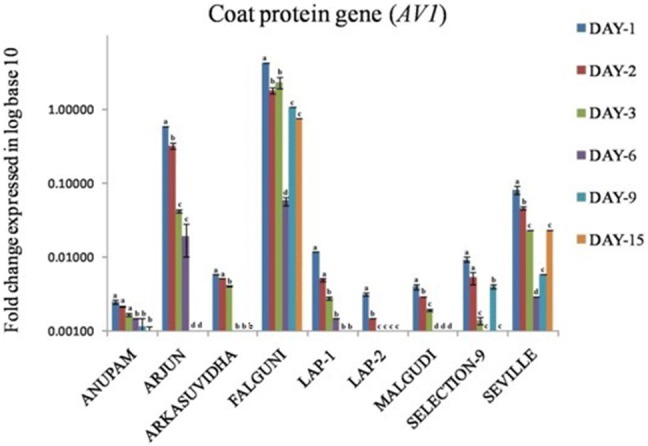
Graph showing fold change of AV1gene of the stressed sample at 1, 2, 3, 6, 9 and 15 dpi. Each column is the average of the three independent measure ± SD. Small alphabets notation on each error bars indicated significant differences and same alphabet notation indicated no significant differences at the 5% level of significance in between dpi of a particular variable
Photosynthetic pigment assay
Chlorophyll a, b and carotenoid pigments were determined at 1, 2 and 3 dpi in mock- and MYMIV-treated leaves of cv. ‘Anupam’ (Fig. 6). The Chlorophyll a content is far more than chlorophyll b and carotenoid. The consistent level of pigments has been found at 2 and 3 dpi over infection period. Additionally, there is no significant difference in chlorophyll a content between mock- and MYMIV-treated leaves at 1 dpi and 3 dpi (p ≤ 0.05). Chlorophyll b and carotenoid also showed no significant difference between mock- and MYMIV-treated leaves at 1 and 2 dpi, and 2 and 3 dpi respectively.
Fig. 6.
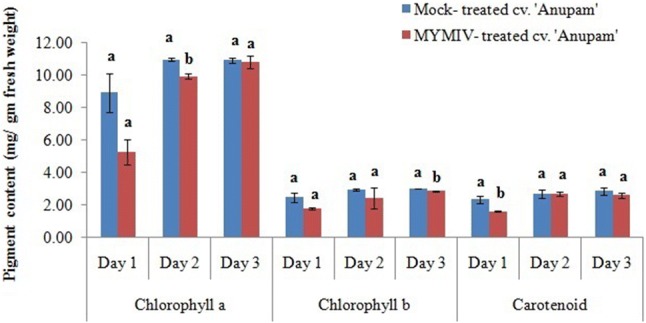
Graph showing the photosynthetic pigments, Chlorophyll a, b and carotenoid content. Each column is the average of the three independent measure ± SD. Small alphabets notation on each error bars indicated significant differences and same alphabet notation indicated no significant differences at the 5% level of significance in between dpi of a particular variable
Discussion
The results obtained from our study provided information on several aspects of tolerance, such as the manifestation of infection, the vigor of the host plants, and variation in host antioxidant levels that are involved in combating the MYMIV infection. More the antioxidants in host after infection, stronger will be the defense against pathogen because excess ROS generation than needed to combat infection in the host itself is toxic to the host plant growth and development (Hakmaoui et al. 2012; Das and Roychoudhury. 2014; Chakraborty and Basak. 2018). The morphological and biochemical parameters of the P. vulgaris were correlated with the viral titer after MYMIV infection. Less growth in root length in the stressed cultivars during MYMIV infection was due to the necrotization of the root tip, while less growth in shoot length in the stressed cultivars was due to the inhibitory effect of the MYMIV infection on the growth of the stressed plants. The adverse effect of stress on root growth has already been reported (Dinneny et al. 2008; Ghosh and Xu. 2014; Koevoets et al. 2016; Pandey et al. 2017; Gimenez et al. 2018). Similarly, the fresh weight and dry weight increase in stressed plants was also low due to the retarded growth during MYMIV infection. The cv. ‘Anupam’ showed the highest growth in terms of root length, shoot length, fresh weight and dry weight, amongst all nine cultivars of P. vulgaris during MYMIV infection. Results of morphological assays established that cv. ‘Anupam’ was less affected by MYMIV infection amongst all nine cultivars. It is already well-known that viral infection causes oxidative damage due to production of ROS (Clarke et al. 2002; Kundu et al. 2015). To resist oxidative damage in plants, the accumulation of antioxidant enzymes and certain metabolites increases, that ultimately helps to survive the plants during periods of stress (Clarke et al. 2002; Jaiswal et al. 2013; Kundu et al. 2015; Karimi et al. 2016; Hafez et al. 2012). In our study, we observed increased accumulation of SOD, guaiacol POD, CAT as well as proline, following MYMIV infection. Increase in enzymatic antioxidants are also being supported by earlier report where substantial increase in activity was noticed in SOD, guaiacol POD, CAT after infection of tomato leaf curl Palampur virus in pumpkin (Jaiswal et al. 2013). The stress marker proline has a role in scavenging hydroxyl radicals in stressed tissues (Claussen 2005). Our result correlated with the findings in tomato plants where proline was increased after treatment with tomato yellow leaf curl virus (Bassiouny et al. 2015). Proline is a stress marker that helps to resist stress in plants subjected under environmental stress (Claussen 2005). Thus the highest accumulation of SOD, guaiacol POD, CAT and proline signifies cv. ‘Anupam’ to be the most tolerant one.
Expressions of MYMIV genes were quantified and the results were correlated with the results obtained from morphological and biochemical studies. During the progression of the infection, the expression of the five early expressed genes, AC1–AC5, and two late expressed genes, AV1 and BC1 gradually decreased in most of the cultivars. A previous study conducted on MYMIV infection on soybean showed the degradation of these genes as a PTGS mechanism of the host (Yadav et al. 2009). In this study, cv. ‘Anupam’ showed a constant expression of AC1–AC5, as well as BC1. Regarding AV1 gene expression, cv. ‘Anupam’ showed the lowest amongst all nine cultivars. AV1 is a multifunctional structural protein that plays a vital role in the spreading of infection, particularly responsible for virus capsid assembly, systemic spread and insect transmission (Fondong 2013). Low expression of coat protein reflects the strong plant defense against pathogen (Zrachya et al. 2007; Yadav et al. 2009). The low expression of AV1 in cv. ‘Anupam’ signifies that it restricts the multiplication and progression of the MYMIV infection, thereby establishing that cv. ‘Anupam’ can well tolerate MYMIV infection. The low viral titer in LAP-2, Malgudi and Arkasuvidha was probably due to the hypersensitive response by the host plant, however at the end of the 15 dpi experimental period LAP-2, Malgudi and Arkasuvidha were totally necrotized with severe appearance of symptoms. Additionally the findings of consistent level of pigments between days and no significant difference of chlorophyll a, b and carotenoid content over early infection period between mock- and MYMIV-treated leaves in relation to mosaic symptoms development also proves the tolerance of MYMIV infection in cv. ‘Anupam’. Combining all the results from the morphological, biochemical and relative quantification studies, we compared the differential response of the nine P. vulgaris cultivars during MYMIV infection and identified the cv. ‘Anupam’ as a MYMIV tolerant cultivar. Incidentally, this is the first report to show the differential response of P. vulgaris cultivars following MYMIV infection.
Conclusion
From the results of the biochemical experiments we can conclude that the gradual increase in antioxidants level in cv. ‘Anupam’ is linked with the progression of the MYMIV infection. In addition, the low titer of AV1 gene in cv. ‘Anupam’ enhances the tolerance in host plant. The maximum growth of cv. ‘Anupam’ as well as gradual increase in antioxidants level during MYMIV infection leads to the conclusion that cv. ‘Anupam’ can well tolerate MYMIV. The low titer of AV1gene in cv. ‘Anupam’ substantiates this conclusion. No compromise in photosynthetic efficiency in terms of no change in photosynthetic pigments contents over early infection period also suffice for the tolerance in developing yellow mosaic symptoms. The MYMIV tolerant cv. ‘Anupam’ identified in this study will improve the agricultural economy of India. More in-depth genetic engineering studies in future are required to elucidate this MYMIV tolerance mechanism of cv. ‘Anupam’.
Electronic supplementary material
Below is the link to the electronic supplementary material.
Supplementary file 1: Fig. 4: Standard curve of Insulin degrading enzyme gene (IDE). (PDF 162 kb)
Supplementary file 2: Fig. 5: Melt curve of IDE gene showing single peak. (PDF 206 kb)
Acknowledgements
JB acknowledges Department of Biotechnology, Govt. of India.
Abbreviations
- YMD
Yellow mosaic disease
- MYMIV
Mungbean yellow mosaic India virus
- CP
Coat protein
- Rep
Replication associated protein
- TrAP
Transcription activator protein
- REn
Replication enhancer protein
- NSP
Nuclear shuttle protein
- MP
Movement protein
- RCR
Rolling circle replication
- H2O2
Hydrogen peroxide
- ROS
Reactive oxygen species
- SOD
Superoxide dismutase
- CAT
Catalase
- RT-qPCR
Real time quantitative polymerase chain reaction
- ANOVA
One-way analysis of variance
Authors contribution
NP, CC and JB envisioned the study and participated in its design and coordination. NP and CC carried out experimental work, statistical analysis of the data and wrote the final manuscript.
Funding
The funding was provided by Department of Biotechnology, Government of India.
Compliance with ethical standards
Conflict of interest
The authors declare that they have no conflict of interest.
Footnotes
Publisher's Note
Springer Nature remains neutral with regard to jurisdictional claims in published maps and institutional affiliations.
References
- Abedi T, Pakniyat H. Antioxidant enzyme changes in response to drought stress in ten cultivars of oilseed rape (Brassica napus L.) J Genet Plant Breed. 2010;46:27–34. [Google Scholar]
- Aebi H. Catalase in vitro. Methods Enzymol. 1984;105:121–126. doi: 10.1016/s0076-6879(84)05016-3. [DOI] [PubMed] [Google Scholar]
- Anaya-López JL, Torres-Pacheco I, González-Chavira M, Garzón-TiznadoJA Pons-Hernández JL. Resistance to geminivirus mixed infections in Mexican wild peppers. Hort Sci. 2003;38:251–255. [Google Scholar]
- Apel K, Hirt H. Reactive oxygen species: metabolism, signal transduction and stress. Annu Rev Plant Biol. 2004;55:373–399. doi: 10.1146/annurev.arplant.55.031903.141701. [DOI] [PubMed] [Google Scholar]
- Basak J, Kundagrami S, GhoseTK Pal A. Development of Yellow Mosaic Virus (YMV) resistance linked DNA marker in Vigna mungo from populations segregating for YMV-reaction. Mol Breed. 2004;14:375–383. [Google Scholar]
- Bassiouny FM, Khalil RR, El-Dougdo KA, Abo-Elmaty S, Yousef MS. Geminivirus antioxidant system and proline accumulation in tomato plant. J Funct Environ Bot. 2015;5:31–40. [Google Scholar]
- Baxter A, Ron M, Nobuhiro S. ROS as key players in plant stress signaling. J Exp Bot. 2014;65(5):1229–1240. doi: 10.1093/jxb/ert375. [DOI] [PubMed] [Google Scholar]
- Biswas KK, Malathi VG, Varma A. Diagnosis of symptomless Yellow mosaic begomovirus infection in pigeonpea by using cloned Mungbean yellow mosaic India virus as probe. J Plant Biochem Biotechnol. 2008;17(1):9–14. [Google Scholar]
- Biswas KK, Tarafdar A, Kumar A, Dikshit HK, Malathi VG. Multiple infection in urdbean (Vigna mungo) in natural condition by begomovirus, tospovirus and urdbean leaf crinkle virus complex. Indian Phytopath. 2009;62(1):75–82. [Google Scholar]
- Borges A, Tsai SM, Caldas DGG. Validation of reference genes for RT-qPCR normalization in common bean during biotic and abiotic stresses. Plant Cell Rep. 2012;31:827–838. doi: 10.1007/s00299-011-1204-x. [DOI] [PubMed] [Google Scholar]
- Broadbent L. The epidemiology of tomato mosaic virus VII. The effect of TMV on tomato fruit yield and quality under glass. Ann Appl Biol. 1964;54:209–224. [Google Scholar]
- Chakraborty N, Basak J. Comparative transcriptome profiling of a resistant vs. susceptible Vigna mungo cultivar in response to Mungbean yellow mosaic India virus infection reveals new insight into MYMIV resistance. Curr Plant Biol. 2018;15:8–24. [Google Scholar]
- Clarke SF, Guya PL, Burritta DJ, Jameson PE. Changes in the activities of antioxidant enzymes in response to virus infection and hormone treatment. Physiol Plant. 2002;114:157–164. doi: 10.1034/j.1399-3054.2002.1140201.x. [DOI] [PubMed] [Google Scholar]
- Claussen W. Proline as a measure of stress in tomato plants. Plant Sci. 2005;168:241–248. [Google Scholar]
- Das K, Roychoudhury A. Reactive oxygen species (ROS) and response of antioxidants as ROS-scavengers during environmental stress in plants. Front Environ. 2014;2(53):1–13. [Google Scholar]
- Dhindsa RS, Dhindsa P, Thorpe TA. Leaf senescence correlated with increased levels of membrane permeability and lipid-peroxidation and decreased levels of superoxide dismutase and catalase. J Exp Bot. 1981;32:93–101. [Google Scholar]
- Dinneny JR, Long TA, Wang JY, Jung JW, Mace D, Pointer S, Barron C, Brady SM, Schiefelbein J, Benfey PN. Cell identity mediates the response of Arabidopsis roots to abiotic stress. Science. 2008;320(5878):942–945. doi: 10.1126/science.1153795. [DOI] [PubMed] [Google Scholar]
- Etalo DW, Stulemeijer Iris JE, Esse HP, VosRic CH, Bouwmeester HJ, Joosten MHAJ. System-wide hypersensitive response-associated transcriptome and metabolome reprogramming in tomato. Plant Physiol. 2013;162:1599–1617. doi: 10.1104/pp.113.217471. [DOI] [PMC free article] [PubMed] [Google Scholar]
- Flores EM, Marin WA. Morphological changes in bean leave (Phaseolus vulgaris L.) induced by rugose mosaic virus infection. Rev Biol Trop. 1980;28(1):121–133. [Google Scholar]
- Fondong VN. Geminivirus protein structure and function. Mol Plant Pathol. 2013;14:635–649. doi: 10.1111/mpp.12032. [DOI] [PMC free article] [PubMed] [Google Scholar]
- Foyer CH, Noctor G. Oxidant and antioxidant signaling in plants: a re-evaluation of the concept of oxidative stress in a physiological context. Plant Cell Environ. 2005;28:1056–1071. [Google Scholar]
- Fraser L, Matthews REF. A rapid transient inhibition of leaf initiation induced by turnip yellow mosaic virus infection. Physiol Plant Pathol. 1981;19:325–336. [Google Scholar]
- García-Neria MA, Rivera-Bustamante RF. Characterization of Geminivirus resistance in an accession of Capsicum chinense Jacq. Mol Plant Microbe Interact. 2011;24:172–182. doi: 10.1094/MPMI-06-10-0126. [DOI] [PubMed] [Google Scholar]
- Garrido-Ramirez ER, Sudarshana MR, Lucas WJ, Gilbertson RL. Bean dwarf mosaic virus BV1 protein is a determinant of the hypersensitive response and avirulence in Phaseolus vulgaris. Mol Plant-Microbe Interact. 2000;13(11):1184–1194. doi: 10.1094/MPMI.2000.13.11.1184. [DOI] [PubMed] [Google Scholar]
- Ghosh D, Xu J. Abiotic stress responses in plant roots: a proteomics perspective. Front Plant Sci. 2014;5(6):1–13. doi: 10.3389/fpls.2014.00006. [DOI] [PMC free article] [PubMed] [Google Scholar]
- Gimenez E, Salinas M, Manzano-Agugliaro F. Worldwide research on plant defense against biotic stresses as improvement for sustainable agriculture. Sustainability. 2018;10(391):1–19. [Google Scholar]
- Góngora-Castillo E, Ibarra-Laclette E, Trejo-Saavedra DL, Rivera-Bustamante RF. Transcriptome analysis of symptomatic and recovered leaves of geminivirus-infected pepper (Capsicum annuum) Virol J. 2012;9:295. doi: 10.1186/1743-422X-9-295. [DOI] [PMC free article] [PubMed] [Google Scholar]
- Hafez MY, Bacso R, Kiraly Z, Kunstler A, Kiraly L. Up-regulation of antioxidants in tobacco by low concentrations of H2O2 suppresses necrotic disease symptoms. Phytopathology. 2012;102:848–856. doi: 10.1094/PHYTO-01-12-0012-R. [DOI] [PubMed] [Google Scholar]
- Hakmaoui A, Perez-Bueno ML, Garcia-Fontana B, Camejo D, Jimenez A, Sevilla F, Baron M. Analysis of the antioxidant response of Nicotiana benthamiana to infection with two strains of Pepper mild mottle virus. J Exp Bot. 2012;63(15):5487–5496. doi: 10.1093/jxb/ers212. [DOI] [PMC free article] [PubMed] [Google Scholar]
- FAOSTAT (2017). http://www.fao.org
- Jaiswal N, Singh M, Dubey RS, Venkataramanappa V, Datta D. Phytochemicals and antioxidative enzymes defense mechanism on occurrence of yellow vein mosaic disease of pumpkin (Cucurbita moschata) Biotech. 2013;3:287–295. doi: 10.1007/s13205-012-0100-6. [DOI] [PMC free article] [PubMed] [Google Scholar]
- Jaleel CA, Riadh K, Gopi R, Manivannan P, Ines J, Al-Juburi HJ, Chang-Xing Z, Hong-Bo S, Panneerselvam R. Antioxidant defense responses: physiological plasticity in higherplants under abiotic constraints. Acta Physiol Plant. 2009;31:427–436. [Google Scholar]
- Ji Y, Scott JW, Hanson P, Graham E, Maxwell DP. Sources of resistance, inheritance, and location of genetic loci conferring resistance to members of the tomato-infecting begomoviruses. In: Czosnek H, editor. Tomato yellow leaf curl virus disease. Dordrecht: Springer; 2007. pp. 343–362. [Google Scholar]
- Karimi A, Mohammadi-Kamalabadi M, Rafieian-Kopaei M, AmjadL Salimzadeh L. Determination of antioxidant activity, phenolic contents and antiviral potential of methanol extract of Euphorbia spinidens Bornm (Euphorbiaceae) Trop J Pharm Res. 2016;15:759–764. [Google Scholar]
- Kasote DM, Katyare SS, Hegde MV, Bae H. Significance of antioxidant potential of plants and its relevance to therapeutic applications. Int J Biol Sci. 2015;11(8):982–991. doi: 10.7150/ijbs.12096. [DOI] [PMC free article] [PubMed] [Google Scholar]
- Koevoets IT, Venema JH, Elzenga JTM, Testerink C. Roots withstanding their environment: exploiting root system architecture responses to abiotic stress to improve crop tolerance. Front Plant Sci. 2016;7:1335. doi: 10.3389/fpls.2016.01335. [DOI] [PMC free article] [PubMed] [Google Scholar]
- Kothandaraman S, Devadason A, Ganesan M. Seed-borne nature of a begomovirus, Mung bean yellow mosaic virus in black gram. Appl Microbiol Biotechnol. 2016;100(4):1925–1933. doi: 10.1007/s00253-015-7188-7. [DOI] [PubMed] [Google Scholar]
- Kundu A, Patel A, Paul S, Pal A. Transcript dynamics at early stages of molecular interactions of MYMIV with resistant and susceptible genotypes of the leguminous host, Vigna mungo. PLoS ONE. 2015;10(4):e0124687. doi: 10.1371/journal.pone.0124687. [DOI] [PMC free article] [PubMed] [Google Scholar]
- Kundu A, Singh PK, Dey A, Ganguli S, Pal A. Complex molecular mechanisms underlying MYMIV-resistance in Vigna mungo revealed by comparative transcriptome profling. Sci Rep. 2019;9:8858. doi: 10.1038/s41598-019-45383-w. [DOI] [PMC free article] [PubMed] [Google Scholar]
- Lapidot M, Friedmann M. Breeding for resistance to whitefly-transmitted geminiviruses. Ann Appl Biol. 2002;140:109–127. [Google Scholar]
- Li F, Xu X, Huang C, Gu Z, Cao L, Hu T, Ding M, Li Z, Zhou X. The AC5 protein encoded by Mungbean yellow mosaic India is a pathogenicity determinant that suppresses RNA silencing-based antiviral defenses. New Phytol. 2015;208:555–569. doi: 10.1111/nph.13473. [DOI] [PubMed] [Google Scholar]
- Metzner H, Rau H, Senger H. Studies on the synchronizability of individual pigment deficient mutants of Chlorella. Planta. 1965;65:186. [Google Scholar]
- Mofunanya AAJ, Towolabi A, Nkang A. Comparative study of the effect of Telfairia Mosaic Virus (TEMV) on the growth characteristics of two ecotypes of Telfairia occidentalis (Hooker Fil) Int J Virol. 2015;11(2):54–65. [Google Scholar]
- Naimuddin K, Mohammad A, Gupta S. Identification of Mungbean yellow mosaic India virus infecting Vigna mungovar. silvestris L. Phytopathol Mediterr. 2011;50:94–100. [Google Scholar]
- Naqvi RZ, Zaidi SS, Akhtar KP, Strickler S, Woldemariam M, Mishra B, Mukhtar MS, Scheffler BE, Scheffler JA, Jander G, Mueller LA, Asif M, Mansoor S. Transcriptomics reveals multiple resistance mechanisms against cotton leaf curl disease in a naturally immune cotton species, Gossypium arboretum. Sci Rep. 2017;7:15880. doi: 10.1038/s41598-017-15963-9. [DOI] [PMC free article] [PubMed] [Google Scholar]
- Nariani TK. Yellow mosaic of mung (Phaseolus aureus) Indian Phytopathol. 1960;13:24–29. [Google Scholar]
- Nene YL. Viral diseases of some warm weather pulse crops in India. Plant Dis Rep. 1973;57:463–467. [Google Scholar]
- Noctor G, Foyer CH. Ascorbate and glutathione: keeping active oxygen under control. Annu Rev Plant Physiol Plant Biol. 1998;49:249–279. doi: 10.1146/annurev.arplant.49.1.249. [DOI] [PubMed] [Google Scholar]
- O’Brien JA, Daudi A, Butt VS, Bolwell GP. Reactive oxygen species and their role in plant defense and cell wall metabolism. Planta. 2012;236:765. doi: 10.1007/s00425-012-1696-9. [DOI] [PubMed] [Google Scholar]
- Obaiah S, Reddy BVB, Reddy NPE, Prasad YS. Molecular detection of yellow mosaic virus infecting blackgram (Vigna mungo (L.) Hepper) in Andhra Pradesh. Int J Plant Animal Environ Sci. 2014;4(1):16–18. [Google Scholar]
- Pandey P, Irulappan V, Bagavathiannan MV, Senthil-Kumar M. Impact of combined abiotic and biotic stresses on plant growth and avenues for crop improvement by exploiting physio-morphological traits. Front Plant Sci. 2017;8:537. doi: 10.3389/fpls.2017.00537. [DOI] [PMC free article] [PubMed] [Google Scholar]
- Pignocchi C, Foyer CH. Apoplastic ascorbate metabolism and its role in the regulation of cell signaling. Curr Opin Plant Biol. 2003;6:379–389. doi: 10.1016/s1369-5266(03)00069-4. [DOI] [PubMed] [Google Scholar]
- Polle A, Otter T, Seifert F. Apoplastic peroxidases and lignification in needles of Norway Spruce (Picea abies L.) Plant Physiol. 1994;106:53–60. doi: 10.1104/pp.106.1.53. [DOI] [PMC free article] [PubMed] [Google Scholar]
- Qazi J, Ilyas M, Mansoor S, Briddon RW. Legume yellow mosaic viruses: genetically isolated begomoviruses. Mol Plant Pathol. 2007;8(4):343–348. doi: 10.1111/j.1364-3703.2007.00402.x. [DOI] [PubMed] [Google Scholar]
- Reddy BVB, Obaiah S, Prasanthi L, Sivaprasad Y, Sujitha A, Krishna TG. Mungbean yellow mosaic India virus is associated with yellow mosaic disease of blackgram (Vigna mungo L.) in Andhra Pradesh, India. Arch Phytopathol Plant Protect. 2015;48(4):345–353. [Google Scholar]
- Schmittgen TD, Livak KJ. Analyzing real-time PCR data by the comparative C (T) method. Nat Protocols. 2008;3(6):1101–1108. doi: 10.1038/nprot.2008.73. [DOI] [PubMed] [Google Scholar]
- Seo YS, Gepts P, Gilbertson RL. Genetics of resistance to the geminivirus, Bean dwarf mosaic virus, and the role of the hypersensitive response in common bean. Theor Appl Genet. 2004;108:786–793. doi: 10.1007/s00122-003-1504-9. [DOI] [PubMed] [Google Scholar]
- Sharma SS, Dietz K-J. The significance of amino acids and amino acid-derived molecules in plant responses and adaptation to heavy metal stress. J Exp Bot. 2006;57:711–726. doi: 10.1093/jxb/erj073. [DOI] [PubMed] [Google Scholar]
- Shepherd DN, Darren PM, Jennifer AT. Transgenic strategies for developing crops resistant to geminiviruses. Plant Sci. 2009;176:1–11. [Google Scholar]
- Shivaprasad PV, Akbergenov R, Trinks D, Rajeswaran R, Veluthambi K, Hohn T, Pooggin MM. Promoters, transcripts, and regulatory proteins of Mungbean yellow mosaic geminivirus. J Virol. 2005;79:8149–8163. doi: 10.1128/JVI.79.13.8149-8163.2005. [DOI] [PMC free article] [PubMed] [Google Scholar]
- Singh SK, Chakraborty S, Singh AK, Pandey PK. Cloning, restriction mapping and phylogenetic relationship of genomic components of MYMIV from Lablab purpureus. BioresourTechnol. 2006;97:1807–1814. doi: 10.1016/j.biortech.2005.09.004. [DOI] [PubMed] [Google Scholar]
- Singh DK, Sumona K, Punjab SM, Nurul I, Sunil KM (2007) DNA replication and pathogenecity of MYMIV. In: Méndez-Vilas A (ed) Communicating current research and educational topics and trends in applied microbiology. pp 155–162
- Swarnalatha PS, Kanakala M, Manasa S, Jalali Reddy MK. Molecular characterization of tobacco curly shoots virus infecting tomato (Solanum lycopersicum L.) in India. Pest Manag Hort Ecosyst. 2013;19:73–84. [Google Scholar]
- Usharani KS, Surendranath B, Haq QMR, Malathi VG. Yellow mosaic virus infecting soyabean in northern India is distinct from the species infecting soyabean in southern and western India. Curr Sci. 2004;86:845–850. [Google Scholar]
- Varma A, Malathi VG. Emerging geminivirus problems: a serious threat to crop production. Ann Appl Biol. 2003;142:145–164. [Google Scholar]
- Varma A, Mandal B, Singh MK. Global emergence and spread of whitefly (Bemisia tabaci) transmitted geminiviruses. In: Thompson WMO, editor. The whitefly, Bemisia tabaci (Homoptera: Aleyrodidae) interaction with geminivirus-infected host plants. Dordrecht: Springer; 2011. pp. 205–292. [Google Scholar]
- Vidavski F, Czosnek H, Gazit S, Levy D, Lapidot M. Pyramiding of genes conferring resistance to Tomato yellow leaf curl virus from different wild tomato species. Plant Breed. 2008;127:625–631. [Google Scholar]
- Wang HL, Sudarshana MR, Gilbertson RL, Lucas WJ. Analysis of cell-to-cell and long-distance movement of a bean dwarf mosaic geminivirus-green fluorescent protein reporter in host and nonhost species: identification of sites of resistance. Mol Plant Microbe Interact. 1999;12:345–355. [Google Scholar]
- Yadav RK, Shukla RK, Chattopadhyay D. Soybean cultivar resistant to Mungbean Yellow Mosaic India Virus infection induces viral RNA degradation earlier than the susceptible cultivar. Virus Res. 2009;144:89–95. doi: 10.1016/j.virusres.2009.04.011. [DOI] [PubMed] [Google Scholar]
- Zrachya A, Kumar PP, Ramakrishnan U, Levy Y, Loyter A, Arazi T, Lapidot M, Gafni Y. Production of siRNA targeted against TYLCV coat protein transcripts leads to silencing of its expression and resistance to the virus. Transgenic Res. 2007;16:385–398. doi: 10.1007/s11248-006-9042-2. [DOI] [PubMed] [Google Scholar]
Associated Data
This section collects any data citations, data availability statements, or supplementary materials included in this article.
Supplementary Materials
Supplementary file 1: Fig. 4: Standard curve of Insulin degrading enzyme gene (IDE). (PDF 162 kb)
Supplementary file 2: Fig. 5: Melt curve of IDE gene showing single peak. (PDF 206 kb)