

Abstract
Background
Cachexia, a common manifestation of malignant cancer, is associated with wasting of skeletal muscle and fat tissue. In this study, we investigated the effects of a new first in class anabolic catabolic transforming agent on skeletal muscle in a rat model of cancer cachexia.
Methods
Young male Wistar Han rats were intraperitoneally inoculated with 108 Yoshida hepatoma AH‐130 cells and once daily treated with 0.3 mg kg−1, 3 mg kg−1 MT‐102, or placebo by gavage.
Results
Three mg kg−1d−1 MT‐102 not only prevented progressive loss of fat mass (−6 ± 2 g vs ‐12 ± 1 g; P < 0.001); lean mass (+1 ± 10 g vs. −37 ± 2 g; P < 0.001) and body weight (+1 ± 13 g vs. −60 ± 2 g; P < 0.001) were remained. Quality of life was also improved as indicated by a higher food intake 12.9 ± 3.1 g and 4.3 ± 0.5 g, 3 mg kg−1d−1 MT‐102 vs. placebo, respectively, P < 0.001) and a higher spontaneous activity (52 369 ± 6521 counts/24 h and 29 509 ± 1775 counts/24 h, 3 mg·kg‐1d‐1 MT‐102 vs. placebo, respectively, P < 0.01) on Day 11. Most importantly, survival was improved (HR = 0.29; 95% CI: 0.16–0.51, P < 0.001). The molecular mechanisms behind these effects involve reduction of overall protein degradation and activation of protein synthesis, assessed by measurement of proteasome and caspase‐6 activity or Western blot analysis, respectively.
Conclusions
The present study shows that 3 mg kg−1 MT‐102 reduces catabolism, while inducing anabolism in skeletal muscle leading to an improved survival.
Keywords: Cancer cachexia, Animal model, Drug development, Muscle wasting
1. Introduction
Over the last 20 years, cancer cachexia has been widely recognized as being a common manifestation of malignant cancer in its advanced stages.1 An important characteristic of cancer cachexia is a general loss of body weight, which may be accompanied by anaemia, alterations in carbohydrate and lipid metabolism, and a variety of hormonal immune disturbances. The loss of (skeletal) muscle mass and subsequently muscle strength in cachexia is thought to be because of protein mobilization mainly resulting from increased proteolysis.2 As a result, cancer cachexia is associated with high morbidity and mortality rates.3, 4 So far, no widely approved therapeutic agents are available to treat or even prevent the onset of cancer cachexia.5
Several studies suggest ß‐adrenergic agonists as new therapeutic targets to treat muscle wasting and muscle weakness through hypertrophic (controlling protein synthesis) and anti‐atrophic effects (controlling protein degradation) on skeletal muscle.6, 7 Chronic administration of ß2‐adrenergic agonists was shown to reverse muscle wasting processes through activation of muscle protein synthesis and/or inhibition of proteolysis by increasing the myofibrillar protein content.8, 9 Busquets et al. observed a ß2‐adrenergic agonist to reduce the mRNA content of ubiquitin and proteasome subunits in gastrocnemius muscle (GAS), thus contributing to the observed anti‐wasting effects.10, 11
The new first class anabolic catabolic transforming agent MT‐102 is a small molecule that combines an anabolic and anti‐catabolic pharmacological profile though a nonspecific ß1‐ and ß2‐adrenergic antagonism and an intrinsic sympathomimetic activity on ß2‐adrenergic receptors. An antagonistic effect on 5‐HT1A‐receptor in the brain reduces fatigue, a main symptom of cancer‐associated cachexia.5 We have previously shown that MT‐102 reversed the effects of sarcopenia by increasing muscle mass and decreasing fat mass in old healthy rats.12 Moreover, MT‐102 has shown efficacy in a cancer cachexia trial where lean mass and handgrip strength were significantly improved.13
The aim of the present study was to investigate the effects of MT‐102 in a rat model of severe cancer cachexia using the Yoshida hepatoma AH‐130 model14, 15 in order to analyse survival, quality of life, and impact on skeletal muscle atrophy.
2. Material and methods
2.1. Animals and tumor inoculation
Cancer cachexia was induced by intraperitoneally injection of 108 Yoshida Hepatoma AH‐130 cells to male Wistar Han rats, weight 205 ± 1 g (Charles River, Sulzfeld, Germany) as described before.15, 16 Animals were kept in a specific pathogen free animal facility, at 22°C with a 12 h day–night rhythm at the Center for Cardiovascular Research, Berlin, Germany. Animals had free access to water and food. Rats were randomized to sham (no tumor, n = 26) or tumor hosts. Rats were further randomized to treatment; sham: placebo (sterilized water, n = 16), 0.3 mg kg−1 (n = 5), or 3 mg kg−1 MT‐102 (n = 5) and tumor‐hosts placebo (sterilized water, n = 78), 0.3 mg kg−1 (n = 14), or 3 mg kg−1 MT‐102 (n = 24) per gavage once daily. The high dose MT‐102 group combines two separate experiments (n = 15 and n = 9, respectively). Treatment was started one day post‐tumor inoculation and was continued until the end of the study (Day 16) or until rats had to be euthanized because of reaching prospectively chosen ethical endpoints. These were hypotherima, apathy, persisting staggering, bleeding, persisting diarrhoea, laboured breathing, cyanosis, complete lack of food intake, dehydration, body weight loss of more than 30%, and loss of lean body mass of more than 25%. All procedures were approved by local animal ethics committee (LaGeSo Berlin). All study personnel were blinded to treatment allocation.
2.2. Body composition and quality of life indicators
Body composition, i.e. lean and fat mass, was assessed per nuclear magnetic resonance‐spectroscopy (Echo‐MRI 700 TM, Echo Medical Systems, Houston, Texas) 1 day before tumor cell inoculation and on day of euthanasia, as described before.17 Quality of life parameters, i.e. spontaneous activity and food intake, were measured over a time period of 24 h 2 days before tumor inoculation and on Day 11, as also previously described.15, 18
2.3. Assay to determine enzyme activities of the 20S proteasome
A total of 150 μg protein samples from GAS were used to measure three enzyme activities of the 20S proteasome (ZLLE‐AMC for Peptidyl‐glutamyl protein‐hydrolyzing (PGPH)‐activity, Bz‐Val‐G‐A‐AMV for Trypsin‐like activity, and Suc‐LLVY‐AMC for Chymotrypsin‐like activity).19, 20 Sample preparation and determining of fluorescence intensity were performed as previously described.21
2.4. Caspase activity assay
Samples from GAS were used to determine enzymatic activity of caspase‐3 and caspase‐6 by fluorogenic turnover as previously described for proteasome measurement. After homogenization and centrifugation (30 min, 14 000 rpm, 4°C), protein lysates were briefly snap frozen in liquid nitrogen and heated to 37°C for three cycles. We used 200 μg of protein lysate to measure caspase activities over a time period of 60 min, using 50 μM DEVD‐AMC as the working standard for caspase‐3 or VEID‐AMC as the accordingly standard for caspase‐6, respectively.
2.5. Western blot analysis
Protein lysates from GAS were homogenized in 20 mM Tris pH 7.5, 150 mM NaCl, 1 mM EDTA, 1 mM EGTA, 1% Triton‐X 100, 25 mM Na4PO2O7, 20 mM NaF, 1 mM DTT, 1 mM Na3VO4, 1 mM ß‐Glycerophosphat, protease‐ and phosphatase‐inhibitor (Sigma‐Aldrich, Germany) and centrifuged (20 min, 14 000 rpm, 4°C); 25 μg protein was used to perform Western blots according to standard protocols, followed by semi‐dry transfer to a polyvinylidene fluoride or polyvinylidene difluoride membrane (GE Healthcare Life Science) by electroblotting overnight. Following primary antibodies were utilized: ADRB1 (12271), ADRB2 (8513), (AKT (9272), Phospho‐AKT (Ser473) (4051S), ATGL (2439), FoxO1 (2488), Phospho‐FoxO1 (Ser318) (2486), FoxO3a (2497), Phospho‐FoxO3a (Ser253) (9466), GSK3α (9338), Phospho‐GSK3α (Ser21) (9316), HSL (4107), Phospho‐HSL (4139), MuRF‐1 (4305), NFĸB p65 (4764), Phospho‐NFĸB p65 (Ser546) (3033), PI3K p85 (4257), Phospho‐PI3K p85 (Tyr458) (4228), 4E‐BP1 (9644), Phospho‐4E‐BP1 (Thr37/46) (9459), pSmad2 (Ser465/467) (3101), UCP1 (14670) all from Cell Signaling; ADRB3 (MBS8509391) MyBioSource, LC3 (NB100‐2220) from Novus, Myostatin (AF788) from R&D Systems; MAFbx (Sc‐27644) from Santa Cruz; GAPDH (G9545) from Sigma‐Aldrich as a loading control, as well as appropriate alkaline phosphatase‐conjugated secondary antibodies (anti‐mouse polyvalent immunoglobulins (0162; Sigma‐Aldrich), polyclonal goat anti‐rabbit immunoglobulins/AP (D 0487; DakoCytomation), or goat IgG‐heavy and light chain antibody (A50‐100AP; BETHYL). Immunoblots were detected using chemoluminescence (CDP‐Star Reagent, New England BioLabs Inc. US), and signal intensities were quantified by image j software.
2.6. Statistical analysis
Results, represented as mean ± standard error of the mean, were analysed using graphpad prism 8.0 (GraphPad Software, Inc., La Jolla, California, USA). All data have been tested for normal distribution using Kolmogorov–Smirnov test. Group comparisons were performed for data being normal distributed with analysis of variance followed by Tuckey's test, for those showing skewed distribution with Kruskal–Wallis and Dunn's test. Survival proportions were analysed using Kaplan‐Maier‐Curve and Cox proportional hazard analysis. A P‐value <0.05 was considered to be significant.
3. Results
The cell numbers of the tumor showed no significant differences between the groups (placebo: 2.99 ± 0.27 × 10⁹ cells, 0.3 mg kg−1 MT‐102: 3.03 ± 0.35 × 10⁹ cells, 3 mg kg−1 MT‐102: 2.36 ± 0.38 × 10⁹ cells). The volume of ascites also showed no significant differences (placebo: 119.1 ± 2.6 mL, 0.3 mg kg−1 MT‐102:114.4 ± 7.3, 3 mg kg−1 MT‐102: 106.6 ± 12.3). As expected, placebo‐treated rats showed a poor prognosis; 87% of the animals had to be euthanized because of reaching ethical endpoints21 before the end of the study at Day 16. Treatment with MT‐102 improved survival; a daily dose of 3 mg kg−1 MT‐102 significantly decreased mortality to 33% (HR = 0.29, 95% CI: 0.16–0.51, P < 0.001), 0.3 mg kg−1d−1 MT‐102 to 59% (HR = 0.51, 95% CI: 0.26–1.00, P = 0.051) (Figure 1).
Figure 1.
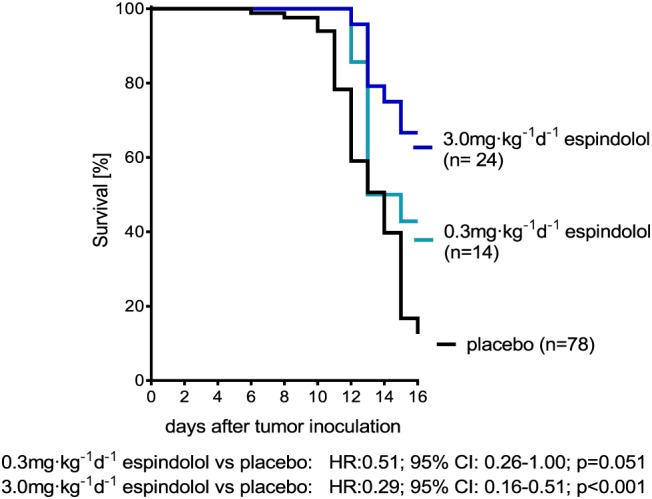
Kaplan‐Meier survival curves, hazard‐ratio (HR) and 95% confidence interval (CI) of animals treated with placebo, 0.3 mg kg−1d−1 MT‐102 or 3 mg kg−1d−1 MT‐102. Treatment significantly improved survival and showed dose‐dependent effects.
3.1. Body weight and body composition
No differences in body weight, lean mass, or fat mass were observed at baseline (Figure 2A,2C, and 2E). As depicted in Figure 2B, 2D, and 2F, placebo‐treated rats showed a progressive loss of body weight (−25.0 ± 1.1%), lean mass (−23.1 ± 1.2%), and fat mass (−63.8 ± 2.1%). Animals treated with 3 mg kg−1d−1 MT‐102 only lost −3.2 ± 6.2% of initial body weight, while lean mass was unaltered (0.9 ± 2.1%). The loss of fat mass was partially prevented with animals losing −35.6 ± 12.4% (P < 0.001) (Figure 2B, 2D, and 2F). Treatment with 0.3 mg kg−1 MT‐102 showed beneficial effects on body weight and lean mass as well, although not to the same extent of such 3 mg kg−1d−1 MT‐102 (Figure 2B, 2D, and 2F). In nontumor‐bearing rats, treatment with MT‐102 significantly increased body weight and lean mass compared with the untreated control group (Figure 3B and 3D). When calculating the average daily change in body weight, lean and fat mass, a similar data pattern and similar significances were found (Figure 2B, 2D, and 2F).
Figure 2.
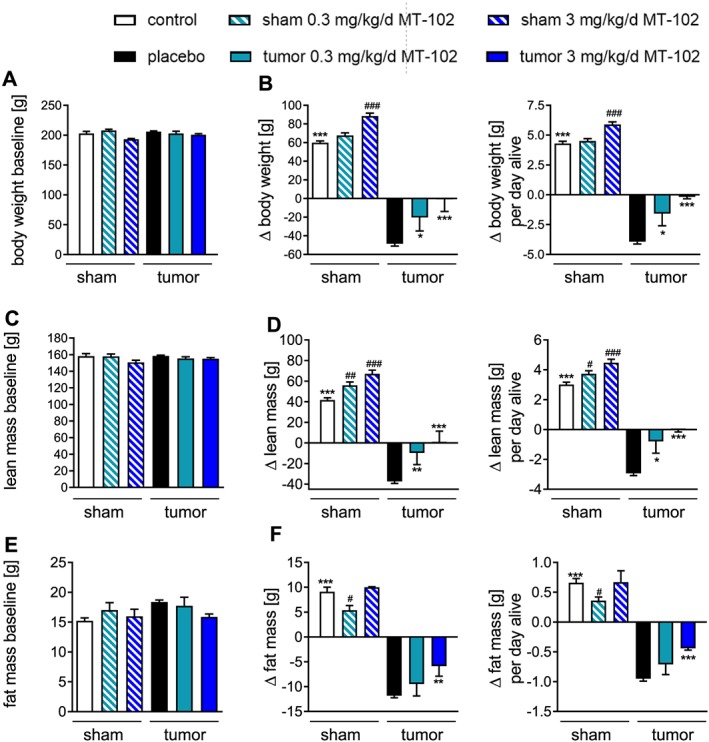
Body weight (A,B) and body composition (C–F) from control (sham), placebo or MT‐102‐treated tumor‐bearing rats at baseline and changes of these parameters at the end of the study. Placebo‐treated animals showed strong wasting of lean (D) and fat mass (F); consequently, body weight was reduced (B). Treatment with 0.3 mg kg−1d−1 MT‐102 reduced loss of body weight and lean mass but had no effect on fat mass, while 3 mg kg−1d−1 MT‐102 resulted in no loss of body weight and lean mass, while loss of fat mass was attenuated. *P < 0.05, **P < 0.01, ***P < 0.001 vs. placebo, # P < 0.05, ## P < 0.01, ### P < 0.001 vs. control.
Figure 3.
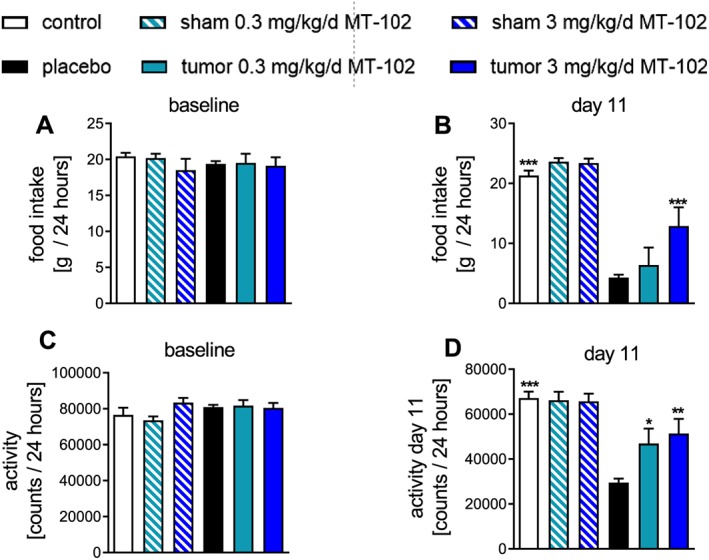
Baseline and Day 11 values for food intake (A,B) and spontaneous activity (C,D) on Day 11 compared with baseline in control (sham), placebo, or MT‐102‐treated tumor‐bearing rats. Placebo‐treated rats showed both a reduction in food intake and spontaneous activity. Treating animals with 3 mg kg−1d−1 MT‐102 significantly improved both quality of life indicators. *P < 0.05, **P < 0.01, ***P < 0.001 vs. placebo.
As shown in Table 1, atrophy of individual tissues confirmed profound wasting in placebo‐treated rats, with a prominent loss of brown adipose tissue (BAT) and white adipose tissue (WAT). In accordance with body composition analysis, treatment with MT‐102 reduced the atrophy is all muscles assessed as well as the heart.
Table 1.
Organ and tissue weight of control (sham), untreated (placebo), and treated tumor‐bearing rats on Day 16 or day of euthanasia
| Sham | Sham 0.3 mg/kg/d MT‐102 | Sham 3.0 mg/kg/d MT‐102 | TB placebo | TB 0.3 mg/kg/d MT‐102 | TB 3.0 mg/kg/d MT‐102 | |
|---|---|---|---|---|---|---|
| n | 16 | 5 | 5 | 78 | 14 | 24 |
| Heart (mg) | 770 ± 12*** | 844 ± 28 | 854 ± 22# | 513 ± 8 | 548 ± 27 | 573 ± 32 *** |
| WAT (mg) | 1298 ± 101*** | 1296 ± 214 | 1241 ± 33 | 126 ± 21 | 234 ± 97 * | 349 ± 95 *** |
| BAT (mg) | 257 ± 18++*** | 203 ± 22 | 237 ± 26 | 92 ± 3 | 100 ± 14 | 144 ± 21 *** |
| GAS (mg) | 1234 ± 30*** | 1419 ± 35## | 1491 ± 37## | 749 ± 14 | 924 ± 71 *** | 1029 ± 68 *** |
| TIB (mg) | 448 ± 9*** | 526 ± 15## | 534 ± 22# | 273 ± 5 | 337 ± 25 *** | 373 ± 28 *** |
| SOL (mg) | 97 ± 2*** | 107 ± 4 | 103 ± 7 | 71 ± 1 | 82 ± 4* | 87 ± 4** |
| EDL (mg) | 104 ± 3*** | 124 ± 14 | 126 ± 8# | 65 ± 1 | 82 ± 7*** | 91 ± 1*** |
Abbreviations: BAT, brown adipose tissue; EDL, extensor digitorum longus; GAS, gastrocnemius; SOL, soleus; TB, tumor bearing; TIB, tibialis; WAT, white adipose tissue.
P < 0.05,
P < 0.01,
P < 0.001 vs. placebo.
P < 0.05, ## P < 0.01 vs. sham.
3.2. MT‐102 improved quality of life indicators
Food intake and spontaneous activity, two important quality of life indicators, did not differ at baseline (Figure 3A and 3C). Placebo‐treated rats showed a progressive reduction in food intake (−74.0 ± 3.0%), while spontaneous activity was reduced by 57.3 ± 2.5%. Data recorded on Day 11 for 24 h show that rats treated with 3 mg kg−1d−1 MT‐102 had a significantly better food intake and higher spontaneous activity compared with placebo (Figure 3B and 3D), while 0.3 mg kg−1d−1 MT‐102 treated rats only had an improved food intake.
3.3. MT‐102 reduces extent of protein degradation
High dose MT‐102 reduced two of three enzyme activities of the ubiquitin‐proteasome system (UPS) in GAS; enzyme levels of trypsin‐like and chymotrypsin‐like activity reached levels of control rats, while PGPH‐activity was not affected (Figure 4A–4C). Caspase‐3 activity in treated groups was not significantly different from placebo, while caspase‐6 activity was significantly reduced in the high dose group (Figure 4D and 4E).
Figure 4.
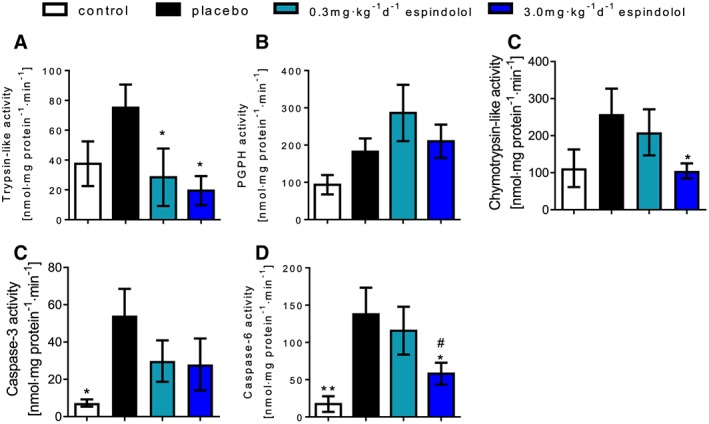
Enzyme activities of the ATP‐dependent ubiquitin‐proteasome‐system, trypsin‐like activity (A), peptidyl‐glutamyl protein‐hydrolyzing activity (B), and chymotrypsin‐like activity (C), as well as enzyme activities of caspase‐3 (D) and caspase‐6 (E) measured in gastrocnemius. Proteasome and caspase activities were increased in tumor‐bearing rats. Treatment reduced these enzyme activities, significantly the trypsin‐like activity as well as caspase‐6 activity. *P < 0.05, **P < 0.01, ***P < 0.001 vs. placebo, #0.3mg·kg−1d−1 MT‐102 vs. 3.0 mg kg−1d−1 MT‐102.
3.4. MT‐102 shows anabolic and anti‐catabolic effects in skeletal muscle
MT‐102 in a daily dose of 3 mg kg−1 showed a prominent activation of the PI3K/AKT/mTOR pathway, as shown by increasing phosphorylation of PI3K at Tyr458 (P < 0.001) and AKT at Ser473 (P < 0.05), resulting in activation of these proteins, or by phosphorylation but therefore inactivation of GSK3α (P = 0.0527) (Figure 5) leading to induced protein synthesis. However, 3 mg kg−1d−1 MT‐102 failed to inactivate 4E‐BP1 because expression was upregulated (P < 0.01), and ratio was significantly lowered (P < 0.05) (Figure 5). Treatment with 0.3 mg kg−1d−1 MT‐102 also showed an increased phosphorylation of AKT and 4E‐BP1 (Figure 5).
Figure 5.
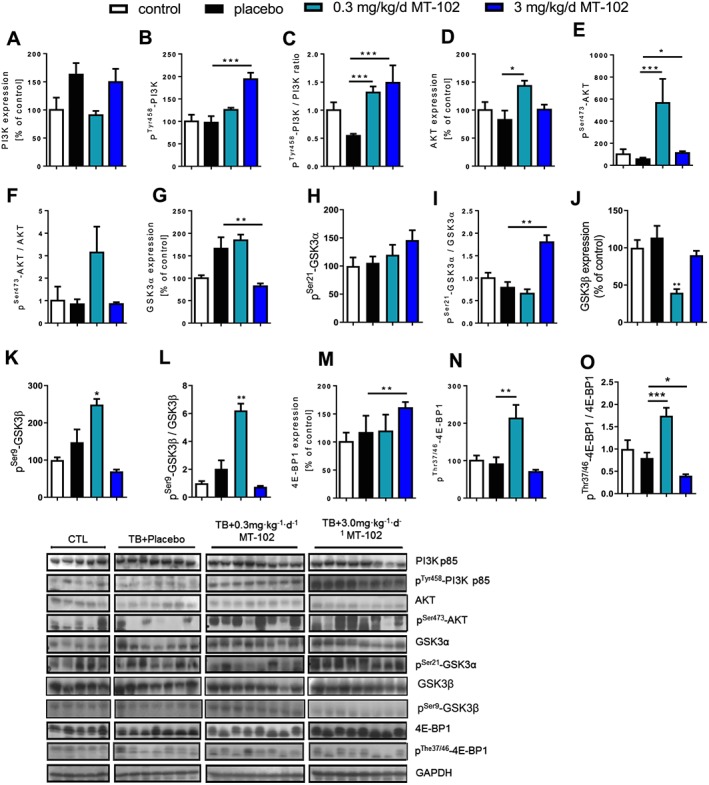
Anabolic signaling of placebo‐treated and MT‐102‐treated tumor‐bearing rats compared with control (sham), measured in gastrocnemius. Each graph represents the relative densitometric analysis of each band normalized to GAPDH. MT‐102 induced expression and activation of PI3K, Akt, while inhibiting GSK3α and 4E‐BP1. *P < 0.05, **P < 0.01, ***P < 0.001 vs. placebo.
While expression of Forkhead‐transcription factors (FoxOs) was increased in GAS of placebo‐treated rats, treatment with 3 mg kg−1d−1 MT‐102 downregulated expression of FoxO3a (P < 0.01) and FoxO1 (P < 0.05), FoxO3a was additionally inactivated through increased phosphorylation at Ser253 (P = 0.0815) (Figure 6). While expression of MuRF‐1 was not affected by treatment with MT‐102, MAFbx expression was somewhat higher in the 3 mg kg−1d−1 MT‐102 group (P < 0.05) (Figure 6). In addition, 3 mg kg−1d−1 MT‐102 not only downregulated expression (P = 0.0518) of NFκB or decreased phosphorylation of NFκB (P < 0.01) and Smad2 (P < 0.001), expression of myostatin was decreased as well, with regard to initial upregulation of the uncleaved preform (P < 0.01) (Figure 6). LC3, a marker for autophagy, was only affected in its expression by treatment with 3 mg kg−1d−1 MT‐102, as downregulation and decreased LC3‐I/LC3‐II ratio shows (P < 0.01) (Figure 6).
Figure 6.
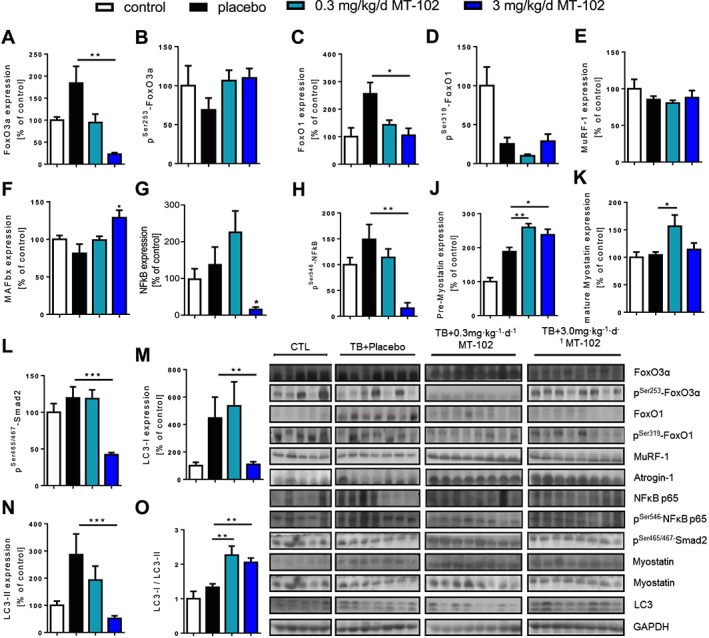
Catabolic signaling of placebo and MT‐102 treated tumor‐bearing rats compared with control (sham), determined in gastrocnemius. Each graph represents the relative densitometric analysis of each band normalized to GAPDH. Foxo3a and FoxO1 were upregulated by tumor burden, which was reversed by MT‐102‐treatment. Expression of MuRF‐1 and MAFbx was unchanged, even though NFκB expression was reduced. Uncleaved myostatin was upregulated, while there was no change in the mature protein, with the exception of an upregulation by 0.3 mg kg−1d−1 MT‐102. The phosphorylation of the downstream mediator Smad2 was significantly reduced by 3 mg kg−1d−1 MT‐102. The autophagy marker LC3 was reduced compared with placebo. *P < 0.05, **P < 0.01, ***P < 0.001 vs. placebo.
3.5. MT‐102 effects on WAT and BAT
The protein expression of adrenoreceptors β1–β3 (ADRB1–3) is downregulated by cancer cachexia in WAT, and treatment with MT‐102 had no effects on the expression levels with the exception of 0.3 mg/kg/d MT‐102 that induces expression of the ADRB3 (P < 0.05 vs. placebo) (Figure 7). Uncoupling Protein 1 (UCP1) is downregulated by cachexia, and its expression levels are normalized by 3 mg/kg/d MT‐102 (P < 0.05 vs. placebo). Expression of adipose triglyceride lipase (ATGL) and hormone‐sensitive lipase (HSL) as well as phospho‐HSL are reduced in tumor‐bearing animals and unchanged by treatment with MT‐102 in WAT (Figure 7).
Figure 7.
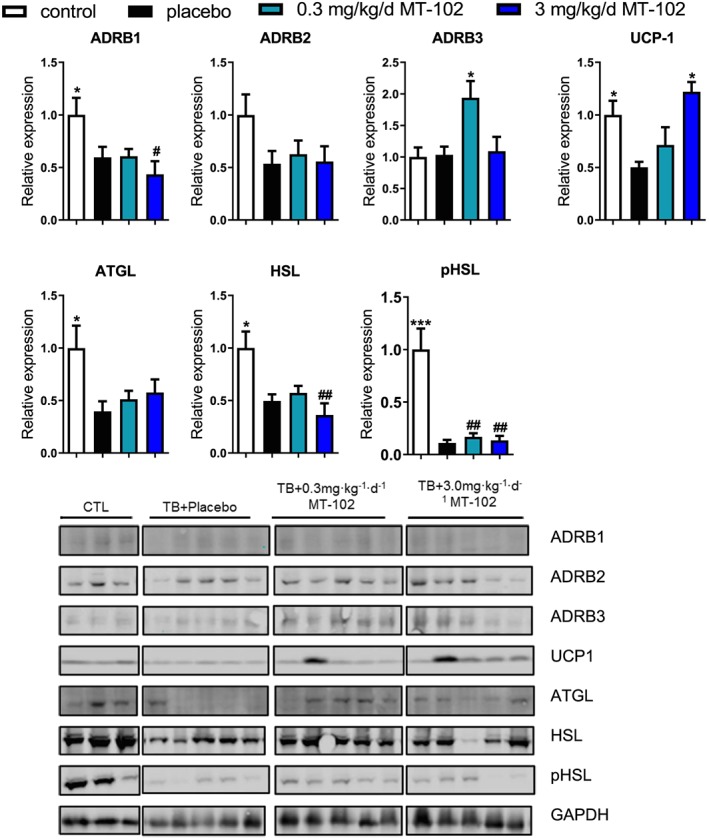
Expression of ADRB1–2 is reduced in white adipose tissue of tumor‐bearing animals, while ADRB3 expression is unchanged or induced by 0.3 mg/kg/d MT‐102. UCP1 is reduced in the placebo group and normalized by 3 mg/kg/d MT‐102. Expression of ATGL and HSL is lower in tumor‐bearing rats irrespective of treatment allocation. Phosphorylation of HSL is also reduced in all groups. *P < 0.05, ***P < 0.001 vs. placebo, # P < 0.05, ## P < 0.01 vs. sham. ATGL, adipose triglyceride lipase; HSL, hormone‐sensitive lipase; pHSL, phospho‐hormone‐sensitive lipase; UCP1, Uncoupling Protein 1.
In BAT, the expression of ADRB1 and ADRDB2 are unchanged in tumor‐bearing animals, showing a trend for an induction in ADRB2, while the ADRB3 is downregulated. MT‐102 has no effect on expression of ABRD1‐3 (Figure 8). In contrast to WAT, UCP1 expression in BAT is induced approximately three‐fold in tumor‐bearing animals compared with sham (P < 0.001). ATGL is induced in the placebo group (P < 0.01), and MT‐102 normalized its levels (P < 0.05 and P < 001 for low and high dose MT‐102 vs. placebo, respectively) (Figure 8). HSL expression is unaffected in the placebo group and reduced by MT‐102, while phospho‐HSL is induced in the placebo group and normalized by MT‐102 (Figure 8).
Figure 8.
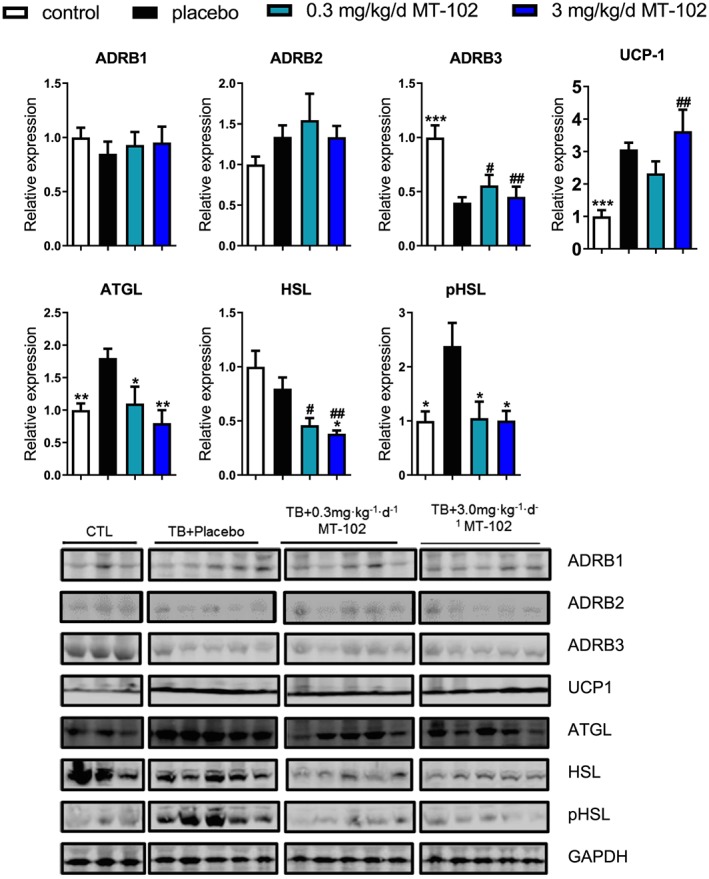
Expression of ADRB1‐2 is unchanged in brown adipose tissue of tumor‐bearing animals, while ADRB3 expression is reduced in all tumor‐bearing groups. UCP1 is induced irrespective of treatment allocation. Expression of ATGL is induced in the placebo group and normalized by MT‐102. HSL is unchanged in the placebo group and reduced by MT‐102. Phosphorylation of HSL is induced in the placebo group and normalized by MT‐102. *P < 0.05, **P < 0.01, ***P < 0.001 vs. placebo, # P < 0.05, ## P < 0.01 vs. sham. ATGL, adipose triglyceride lipase; HSL, hormone‐sensitive lipase; pHSL, phospho‐hormone‐sensitive lipase; UCP1, Uncoupling Protein 1.
4. Discussion
This study investigated the effects of the anabolic catabolic transforming agent MT‐102 on survival, body weight and body composition, quality of life, cardiac function, as well as assessing anabolic and catabolic signaling pathways using GAS as representative tissue for skeletal muscle. Our study confirmed these results as mortality rate in placebo‐treated rats was 87%, followed by a decline in body weight by 25.0 ± 1.1% (53.7 ± 0.9 g). On the other hand, treatment with 3.0 mg kg−1d−1 MT‐102 improved survival by reducing mortality rate to 33%, whereby body weight was only slightly altered.
The Yoshida hepatoma cell line is a commonly used rat model for cancer cachexia as it induces a well reproducible rapid and progressive tissue wasting that consequently triggers loss of body weight.22, 23, 24 Tessitore et al. not only showed animals to lose 130 ± 14 g body weight within the first 10 days post‐tumor cell inoculation in average but also that a loss of 30% of body weight caused death after 14–16 days.14 Cancer cachexia is accompanied with a high morbidity and mortality rate as it causes up to 22% of cancer‐related deaths in humans.25, 26
Analysis of body composition is an important parameter in cancer cachexia.27 The decline in food intake by 74.0 ± 3.0% confirmed the prominent feature of cancer cachexia‐associated anorexia.
Particularly, with regard to loss of skeletal muscle, fast‐twitch (extensor digitorum longus) or mixed fibre muscles (GAS, tibialis) are even more affected by cancer cachexia‐associated atrophy than slow‐twitch muscles (soleus).28 Furthermore, we observed general wasting of all organs, particularly a large reduction of BAT and WAT, which is consistent with the overall loss of fat mass shown by nuclear magnetic resonance scans. Beta‐adrenoreceptors have been shown to induce lipolysis in adipose tissue upon stimulation.29 Interestingly, we see differential changes in the expression of ADRB1‐3, UCP1, ATGL, and HSL in WAT vs. BAT, suggesting a reduced adrenergic influence on lipolysis in or a shutdown of lipolysis WAT, while the expression of the proteins with the exception of ADRB3 in BAT is either unchanged or induced compared with sham. This suggests that BAT stays metabolically on a higher level compared with WAT in this severe cancer cachexia model.
Cancer cachexia also leads to an upregulation of the expression of catabolic proteins, while proteins involved in anabolic signaling are downregulated, and this anabolic/catabolic imbalance contributes to wasting of muscle tissue. The UPS is one of the main pathways of protein degradation. Protein degradation by the UPS is carrying out in an ordered, cyclical manner in which PGPH‐activity first needs to be activated by the chymotrypsin‐like activity. Accordingly, an increase in cleavage of protein fragments is measurable, while chymotrypsin‐like activity is temporally inhibited.19, 20 This might explain the decline in chymotrypsin‐like activity in placebo‐treated rats. Treatment with 0.3 mg kg−1d−1 MT‐102 reduced proteasome and caspase‐6 activity, while only a slight reduction in caspase‐3 activity was seen, whereas 3 mg kg−1d−1 MT‐102 again showed beneficial effects by reducing caspase‐6 activity as well. Caspase activity also influences three specific subunits of the 19S regulatory complex of the proteasome in order to reduce proteolytic activation of the UPS during apoptosis,30 which is also consistent with decreased proteasome activity, whereas caspase‐3 activity was not changed in the placebo‐treated group. While anabolic signaling was impaired in placebo‐treated rats, treatment with 3 mg kg−1d−1 MT‐102 was effective in maintaining or even upregulating expression of key proteins in anabolic signaling like AKT. Moreover, the phosphorylation (=activation) of PI3K and AKT was significantly increased by treatment with 3 mg kg−1d−1 MT‐102, while expression of GSK3α was downregulated, and its phosphorylation (=inhibition) was increased. Furthermore, treatment reduced the expression of FoxO transcription factors while increasing their phosphorylation and hence their inhibition. This would be expected to reduce the expression of MuRF‐1.31 Expression of MAFbx predominantly regulated by NFκB and to a lesser extent by FoxO or myostatin32, 33 was significantly increased by treatment with 3 mg kg−1d−1 MT‐102, even though NFκB was significantly attenuated. This suggests a regulation of MAFbx by other factors. Under wasting conditions, both MuRF‐1 and MAFbx are usually upregulated and considered to be the rate‐limiting step of the enhanced UPS activity.34, 35, 36
Myostatin negatively regulates muscle growth37 by inhibiting muscle growth through modulation of cyclin‐dependent kinase 2 and stimulation of FoxO1‐expression.38 The expression of the uncleaved form of myostatin was upregulated by treatment with 3 mg kg−1d−1 MT‐102, which might explain the elevated level of MAFbx. Decline in expression and phosphorylation of NFĸB by treatment with 3 mg kg−1d−1 MT‐102 is consistent with reduction of MuRF‐1 expression.39 NFĸB, another transcription factor that mediates muscle wasting by affecting TNF‐α induced inflammatory response, resulting in apoptosis and mechanisms, which inhibit IGF‐1 induced anabolism was downregulated as well.40 Finally, 3 mg kg−1 MT‐102 reduced autophagy by limiting conversion of LC3‐I to LC3‐II, an important indicator for the extent of autophagy.41, 42 Because expression of LC‐3 is driven by FoxO3a,43 the observed downregulation of FoxO3a supports these results.
In summary, the present study shows that 3.0 mg kg−1 MT‐102 prevents loss of body weight in severe experimental cancer cachexia by inducing anabolic pathways while inhibiting catabolic pathways in skeletal muscle. A similar effect has been observed in a clinical trial using MT‐102.13 Moreover, in the rat model, MT‐102 had strong positive effects on quality of life indicators and resulted in a significantly improved outcome.
Conflict of interests
This research work was supported by grants from PsiOxus Therapeutics Ltd. SDA is a shareholder in Actimed Therapeutics Ltd. SDA reports frees for consultancy and/or speaking from Boehringer Ingelheim, Bayer, Novartis, Vifor, Stealth Peptides, and Servier.
Acknowledgements
This study was supported by PsiOxus Therapeutics Ltd. The authors of this manuscript certify that they comply with the ethical guidelines for authorship and publishing in the Journal of Cachexia, Sarcopenia and Muscle44.
Pötsch M. S., Ishida J., Palus S., Tschirner A., von Haehling S., Döhner W., Anker S. D., and Springer J. (2020) MT‐102 prevents tissue wasting and improves survival in a rat model of severe cancer cachexia, Journal of Cachexia, Sarcopenia and Muscle, 11, 594–605. 10.1002/jcsm.12537.
References
- 1. Farkas J, von Haehling S, Kalantar‐Zadeh K, et al. Cachexia as a major public health problem: frequent, costly, and deadly. J Cachexia Sarcopenia Muscle. 2013. Sep;4:173–178. [DOI] [PMC free article] [PubMed] [Google Scholar]
- 2. Argiles JM, Alvarez B, Lopez‐Soriano FJ. The metabolic basis of cancer cachexia. Med Res Rev. 1997. Sep;17:477–498. [DOI] [PubMed] [Google Scholar]
- 3. Evans WJ, Morley JE, Argiles J, Bales C., Baracos V., Guttridge D., et al. Cachexia: a new definition. Clin Nutr. 2008. Dec;27:793–799. [DOI] [PubMed] [Google Scholar]
- 4. Muscaritoli M, Anker SD, Argiles J, Aversa Z, Bauer JM, Biolo G, et al. Consensus definition of sarcopenia, cachexia and pre‐cachexia: joint document elaborated by Special Interest Groups (SIG) "cachexia‐anorexia in chronic wasting diseases" and "nutrition in geriatrics". Clin Nutr. 2010. Apr;29:154–159. [DOI] [PubMed] [Google Scholar]
- 5. Stewart Coats AJ, Srinivasan V, Surendran J, Chiramana H, Vangipuram SR, Bhatt NN, et al. The ACT‐ONE trial, a multicentre, randomised, double‐blind, placebo‐controlled, dose‐finding study of the anabolic/catabolic transforming agent, MT‐102 in subjects with cachexia related to stage III and IV non‐small cell lung cancer and colorectal cancer: study design. J Cachexia Sarcopenia Muscle. 2011. Dec;2:201–207. [DOI] [PMC free article] [PubMed] [Google Scholar]
- 6. Hinkle RT, Hodge KM, Cody DB, et al. Skeletal muscle hypertrophy and anti‐atrophy effects of clenbuterol are mediated by the beta2‐adrenergic receptor. Muscle Nerve. 2002. May;25:729–734. [DOI] [PubMed] [Google Scholar]
- 7. Ryall JG, Lynch GS. The potential and the pitfalls of beta‐adrenoceptor agonists for the management of skeletal muscle wasting. Pharmacol Ther. 2008. Dec;120:219–232. [DOI] [PubMed] [Google Scholar]
- 8. Dodd SL, Powers SK, Vrabas IS, et al. Effects of clenbuterol on contractile and biochemical properties of skeletal muscle. Med Sci Sports Exerc. 1996. Jun;28:669–676. [DOI] [PubMed] [Google Scholar]
- 9. Agbenyega ET, Wareham AC. Effect of clenbuterol on normal and denervated muscle growth and contractility. Muscle Nerve. 1990. Mar;13:199–203. [DOI] [PubMed] [Google Scholar]
- 10. Busquets S, Figueras MT, Fuster G, Almendro V, Moore‐Carrasco R, Ametller E, et al. Anticachectic effects of formoterol: a drug for potential treatment of muscle wasting. Cancer Res. 2004. Sep 15;64:6725–6731. [DOI] [PubMed] [Google Scholar]
- 11. Salazar‐Degracia A, Busquets S, Argiles JM, et al. Effects of the beta2 agonist formoterol on atrophy signaling, autophagy, and muscle phenotype in respiratory and limb muscles of rats with cancer‐induced cachexia. Biochimie. 2018. Jun;149:79–91. [DOI] [PubMed] [Google Scholar]
- 12. Potsch MS, Tschirner A, Palus S, von Haehling S, Doehner W, Beadle J, et al. The anabolic catabolic transforming agent (ACTA) espindolol increases muscle mass and decreases fat mass in old rats. J Cachexia Sarcopenia Muscle. 2014. Jun;5:149–158. [DOI] [PMC free article] [PubMed] [Google Scholar]
- 13. Stewart Coats AJ, Ho GF, Prabhash K, von Haehling S, Tilson J, Brown R, et al. Espindolol for the treatment and prevention of cachexia in patients with stage III/IV non‐small cell lung cancer or colorectal cancer: a randomized, double‐blind, placebo‐controlled, international multicentre phase II study (the ACT‐ONE trial). J Cachexia Sarcopenia Muscle. 2016. Jun;7:355–365. [DOI] [PMC free article] [PubMed] [Google Scholar]
- 14. Tessitore L, Bonelli G, Baccino FM. Early development of protein metabolic perturbations in the liver and skeletal muscle of tumour‐bearing rats. A model system for cancer cachexia. Biochem J. 1987. Jan 1;241:153–159. [DOI] [PMC free article] [PubMed] [Google Scholar]
- 15. Springer J, Tschirner A, Haghikia A, Lal H, Grzesiak A, Kaschina E, et al. Prevention of liver cancer cachexia‐induced cardiac wasting and heart failure. Eur Heart J. 2014. Apr;35:932–941. [DOI] [PMC free article] [PubMed] [Google Scholar]
- 16. Tschirner A, von Haehling S, Palus S, et al. Ursodeoxycholic acid treatment in a rat model of cancer cachexia. J Cachexia Sarcopenia Muscle. 2012. Mar;3:31–36. [DOI] [PMC free article] [PubMed] [Google Scholar]
- 17. Palus S, Akashi Y, von Haehling S, et al. The influence of age and sex on disease development in a novel animal model of cardiac cachexia. Int J Cardiol. 2009. Apr 17;133:388–393. [DOI] [PubMed] [Google Scholar]
- 18. Schmidt K, von Haehling S, Doehner W, et al. IGF‐1 treatment reduces weight loss and improves outcome in a rat model of cancer cachexia. J Cachexia Sarcopenia Muscle. 2011. Jun;2:105–109. [DOI] [PMC free article] [PubMed] [Google Scholar]
- 19. Kisselev AF, Akopian TN, Castillo V, Goldberg AL Proteasome active sites allosterically regulate each other, suggesting a cyclical bite‐chew mechanism for protein breakdown. Mol Cell. 1999. Sep;4:395–402. [DOI] [PubMed] [Google Scholar]
- 20. Hasselgren PO, Fischer JE. Muscle cachexia: current concepts of intracellular mechanisms and molecular regulation. Ann Surg. 2001. Jan;233:9–17. [DOI] [PMC free article] [PubMed] [Google Scholar]
- 21. Springer J, Tschirner A, Hartman K, Palus S, Wirth EK, Ruis SB, et al. Inhibition of xanthine oxidase reduces wasting and improves outcome in a rat model of cancer cachexia. Int J Cancer. 2012. Nov 1;131:2187–2196. [DOI] [PubMed] [Google Scholar]
- 22. Llovera M, Garcia‐Martinez C, Agell N, Lopez‐Soriano FJ, Argiles JM Muscle wasting associated with cancer cachexia is linked to an important activation of the ATP‐dependent ubiquitin‐mediated proteolysis. Int J Cancer. 1995. Mar 29;61:138–141. [DOI] [PubMed] [Google Scholar]
- 23. Llovera M, Garcia‐Martinez C, Lopez‐Soriano J, Carbo N, Agell N, López‐Soriano FJ et al. Role of TNF receptor 1 in protein turnover during cancer cachexia using gene knockout mice. Mol Cell Endocrinol. 1998. Jul 25;142:183–189. [DOI] [PubMed] [Google Scholar]
- 24. Saitoh M, Hatanaka M, Konishi M, Ishida J, Palus S, Ebner N, et al. Erythropoietin improves cardiac wasting and outcomes in a rat model of liver cancer cachexia. Int J Cardiol. 2016. Sep 1;218:312–317. [DOI] [PubMed] [Google Scholar]
- 25. Ferlay J, Autier P, Boniol M, et al. Estimates of the cancer incidence and mortality in Europe in 2006. Ann Oncol. 2007. Mar;18:581–592. [DOI] [PubMed] [Google Scholar]
- 26. Li YP, Reid MB. NF‐kappaB mediates the protein loss induced by TNF‐alpha in differentiated skeletal muscle myotubes. Am J Physiol Regul Integr Comp Physiol. 2000. Oct;279:R1165–R1170. [DOI] [PubMed] [Google Scholar]
- 27. Kotler DP, Wang J, Pierson RN. Body composition studies in patients with the acquired immunodeficiency syndrome. Am J Clin Nutr. 1985. Dec;42:1255–1265. [DOI] [PubMed] [Google Scholar]
- 28. Zeman RJ, Ludemann R, Easton TG, Etlinger JD Slow to fast alterations in skeletal muscle fibers caused by clenbuterol, a beta 2‐receptor agonist. Am J Physiol. 1988. Jun;254:E726–E732. [DOI] [PubMed] [Google Scholar]
- 29. Ciccarelli M, Santulli G, Pascale V, Trimarco B, Iaccarino G, Adrenergic receptors and metabolism: role in development of cardiovascular disease. Front Physiol. 2013. Oct 3;4:265. [DOI] [PMC free article] [PubMed] [Google Scholar]
- 30. Sun XM, Butterworth M, MacFarlane M, Dubiel W, Ciechanover A, Cohen GM, Caspase activation inhibits proteasome function during apoptosis. Mol Cell. 2004. Apr 9;14:81–93. [DOI] [PubMed] [Google Scholar]
- 31. Sandri M, Sandri C, Gilbert A, Skurk C, Calabria E, Picard A, Foxo transcription factors induce the atrophy‐related ubiquitin ligase atrogin‐1 and cause skeletal muscle atrophy. Cell. 2004. Apr 30;117:399–412. [DOI] [PMC free article] [PubMed] [Google Scholar]
- 32. Glass DJ. Skeletal muscle hypertrophy and atrophy signaling pathways. Int J Biochem Cell Biol. 2005. Oct;37:1974–1984. [DOI] [PubMed] [Google Scholar]
- 33. Penna F, Costamagna D, Fanzani A, et al. Muscle wasting and impaired myogenesis in tumor bearing mice are prevented by ERK inhibition. PLoS One. 2010;5:e13604. [DOI] [PMC free article] [PubMed] [Google Scholar]
- 34. Bodine SC, Latres E, Baumhueter S, Lai VK, Nunez L, Clarke BA, Identification of ubiquitin ligases required for skeletal muscle atrophy. Science. 2001. Nov 23;294:1704–1708. [DOI] [PubMed] [Google Scholar]
- 35. Gomes MD, Lecker SH, Jagoe RT, Navon A, Goldberg AL, Atrogin‐1, a muscle‐specific F‐box protein highly expressed during muscle atrophy. Proc Natl Acad Sci U S A. 2001. Dec 4;98:14440–14445. [DOI] [PMC free article] [PubMed] [Google Scholar]
- 36. Stevenson EJ, Giresi PG, Koncarevic A, Kandarian SC, Global analysis of gene expression patterns during disuse atrophy in rat skeletal muscle. J Physiol. 2003. Aug 15;551:33–48. [DOI] [PMC free article] [PubMed] [Google Scholar]
- 37. Lee SJ, McPherron AC. Regulation of myostatin activity and muscle growth. Proc Natl Acad Sci U S A. 2001. Jul 31;98:9306–9311. [DOI] [PMC free article] [PubMed] [Google Scholar]
- 38. McFarlane C, Plummer E, Thomas M, Hennebry A, Ashby M, Ling N, Myostatin induces cachexia by activating the ubiquitin proteolytic system through an NF‐kappaB‐independent, FoxO1‐dependent mechanism. J Cell Physiol. 2006. Nov;209:501–514. [DOI] [PubMed] [Google Scholar]
- 39. Cai D, Frantz JD, Tawa NE Jr, Melendez PA, Oh BC, Lidov HG IKKbeta/NF‐kappaB activation causes severe muscle wasting in mice. Cell. 2004. Oct 15;119:285–298. [DOI] [PubMed] [Google Scholar]
- 40. Li YP, Lecker SH, Chen Y, et al. TNF‐alpha increases ubiquitin‐conjugating activity in skeletal muscle by up‐regulating UbcH2/E220k. FASEB J. 2003. Jun;17:1048–1057. [DOI] [PubMed] [Google Scholar]
- 41. Barth S, Glick D, Macleod KF. Autophagy: assays and artifacts. J Pathol. 2010. Jun;221:117–124. [DOI] [PMC free article] [PubMed] [Google Scholar]
- 42. Komatsu M, Ichimura Y. Physiological significance of selective degradation of p62 by autophagy. FEBS Lett. 2010. Apr 2;584:1374–1378. [DOI] [PubMed] [Google Scholar]
- 43. Mammucari C, Milan G, Romanello V, Masiero E, Rudolf R, Del Piccolo P, FoxO3 controls autophagy in skeletal muscle in vivo. Cell Metab. 2007. Dec;6:458–471. [DOI] [PubMed] [Google Scholar]
- 44. von Haehling, S , Morley, JE , Coats, AJS , Anker, SD . Ethical guidelines for publishing in the Journal of Cachexia, Sarcopenia and Muscle: update 2019. J Cachexia Sarcopenia Muscle. 2019 Oct; 10: 1143‐1145. [DOI] [PMC free article] [PubMed] [Google Scholar]