Abstract
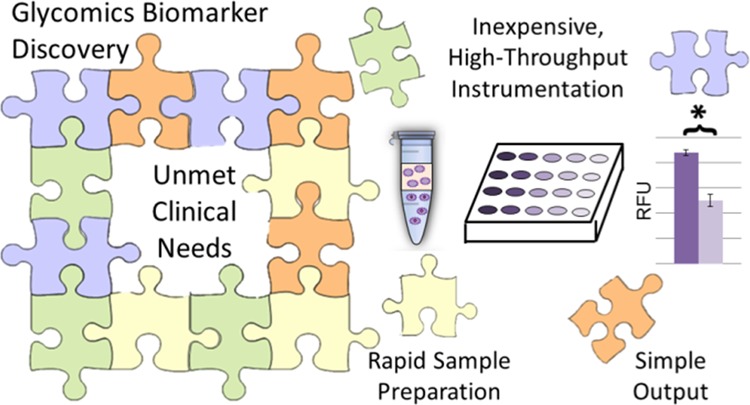
Glycomic-based approaches to discover potential biomarkers have shown great promise in their ability to distinguish between healthy and diseased individuals; these methods can identify when aberrant glycosylation is significant, but they cannot practically be adapted into widely implemented diagnostic assays because they are too complex, expensive, and low-throughput. We have developed a new strategy that addresses challenges associated with sample preparation, sample throughput, instrumentation needs, and data analysis to transfer the valuable knowledge provided by protein glycosylation into a clinical environment. Notably, the detection limits of the assay are in the single-digit picomole range. Proof of principle is demonstrated by quantifying the changes in the sialic acid content in fetuin. As the sialic acid content in proteins varies in a number of disease states, this example demonstrates the utility of the method for biomarker analysis. Furthermore, the developed method can be adapted to other biologically important saccharides, affording a broad array of quantitative glycomic analyses that are accessible in a high-throughput, plate-reader format. These studies enable glycomic-based biomarker discovery efforts to transition through the difficult landscape of developing a potential biomarker into a clinical assay.
Introduction
Protein glycosylation is a prevalent post-translational modification that is sensitive to changes in the cellular environment. Aberrant protein glycosylation can be correlated to a number of diseases including multiple types of cancer,1−3 Parkinson’s disease,4 and cardiovascular disease.5 Glycans represent a promising class of biomarkers that can indicate diseases with high sensitivity and specificity; however, current methods to analyze glycans are not well suited for the clinical laboratory because of complex sample preparation needs.
In order to quantify oligosaccharides, researchers typically conjugate the reducing-end aldehyde with a fluorophore using reductive amination.2,6−8 Derivatization produces stoichiometrically labeled saccharides whose relative molar quantities can be compared. However, efficient fluorescent labeling via reductive amination requires high excesses of fluorophore and other reagents that necessitate sample cleanup. Cleanup can be performed by a variety of procedures, such as solid-phase extraction or gel filtration,9 but these procedures increase the length and complexity of sample preparation and decrease the throughput analysis.
Following sample preparation, oligosaccharides can be separated by liquid chromatography7 or capillary electrophoresis.6 In-depth structural characterization can be added with mass spectrometry (MS) analysis using either matrix-assisted laser desorption ionization6 or electrospray7,8 ionization. Structural identities can also be elucidated by comparison to a reference database, although databases are specific to fluorophores such as 2-aminobenzamide (2-AB)10 or 2-aminopyridine.11 These techniques can provide the necessary sensitivity and low limits of detection needed to quantify potential glycan-based biomarkers; however, the instrumentation needed is expensive, low-throughput, and it requires expertise to operate and maintain. Therefore, this instrumentation-heavy approach is not well suited for broad adoption in clinical labs.
An additional disadvantage of the current standard workflow for glycomics analysis is the fact that the important glycomic features—such as the amount of sialylation or fucosylation—are not quantifiable in a single peak: the heterogeneous nature of protein glycosylation splits the population of identical glycan features into multiple analytical signals, increasing the complexity of data analysis. One elegant solution to this problem is to simplify the analysis approach and prepare the samples such that the glycan features of interest are detectable in a single peak.12 Using a gas chromatography–MS-based workflow, the released, derivatized monosaccharides that corresponded to various glycan features—such as sialylated or fucosylated glycans—were detectable in cancer patients and healthy controls, demonstrating that this condensed glycan feature approach is capable of differentiating between diseased and healthy populations with high sensitivity and specificity.12 Saccharides such as fucose and sialic acid have shown strong correlation to disease,13,14 but fluorescent-based quantitation fails to consolidate the populations of these important species into a single analytical signal.
The current methods used to quantify protein glycosylation have been invaluable in the field of biomarker discovery; translation to usefulness in the clinical laboratory requires new, simplified methods that reduce cost and complexity. Presented herein is a new method to quantify protein glycosylation that simplifies the sample preparation, instrumental analysis, and signal output. To obtain a single peak corresponding to a particular glycan feature, saccharides are selectively cleaved with a glycosidase that releases the glycan of interest. Next, a standard fluorescent derivatization with 2-AB is used, and excess fluorophore is removed in a rapid, automatable fashion through the adaptation of a procedure first reported by Chu et al.15 Samples are transferred to a 384-well plate, and the fluorescence intensity is rapidly measured, an approach more conducive to high-throughput sample analysis than conventional glycan profiling. The fluorescent signal is specific to the glycan cleaved by the endoglycosidase or exoglycosidase used, allowing for the quantitation of specific features in a simple signal output.
The usefulness of the method is demonstrated by quantifying sialic acid and demonstrating how small differences in glycosylation can be identified in two proteins whose glycan profiles are very similar. Sialic acid was chosen as the glycan for proof-of-concept demonstration because of its immense importance in distinguishing disease states. Indeed, sialylated glycoforms have already been implicated as biomarkers for Parkinson’s disease,16 breast cancer,17 and prostate cancer.18 In addition, the quantity of sialic acid in haptoglobin is so disease-specific; measuring it may be an optimal way to discriminate liver cancer from cirrhosis, the two conditions that are known to be tough to tell apart.19
The method we developed to quantify sialic acid makes three technological advances that combine to produce a simple, high-throughput glycomics assay. (1) Glycan specificity is controlled by the glycosidase used; (2) derivatization cleanup is expedited using liquid/liquid extraction instead of chromatography; (3) low detection limits and high throughput are afforded by a plate-reader. This method reduces the analysis cost and complexity; these benefits result in an assay that will allow researchers to cross the difficult divide between glycan-based biomarker discovery and clinical assay development, where throughput and simplicity are paramount.
Experimental Section
Materials and Reagents
Acetic acid, acetonitrile, 2-AB, octanal, 5 M NaCNBH3 in 1 M NaOH, neuraminidase (sialidase) from Clostridium perfringens, N-acetylneuraminic acid (sialic acid), fetuin, and asialofetuin (from fetal calf serum) were purchased from MilliporeSigma (St. Louis, MO), and 3 and 10 kDa molecular weight cutoff (MWCO) filters were purchased from VWR (Radnor, PA).
Cleanup of 2-AB Labeling Solution
A standard labeling solution containing 10 μL of phosphate-buffered saline (PBS), 1.4 μL of 5 M NaCNBH3 in 1 M NaOH, 5.6 μL of 500 mM 2-AB in acetonitrile, and 3 μL of acetic acid was diluted to 220 μL with water. A reference blank was prepared using identical volumes but using acetonitrile with no 2-AB in solution; all samples and the reference blank were prepared in triplicate. Two octanal cleanup procedures were compared. In the first procedure, 600 μL of octanal was added to the samples; then, the samples were vortexed for 1 min, rested for 1 min, and centrifuged for 1 min at 6400g. The octanal was discarded, taking care not to disturb the aqueous layer, and three 50 μL aliquots of the aqueous layer were transferred to a 384-microwell plate for fluorescent detection. In the second, optimized, procedure, the extraction step with 600 μL was conducted twice. Then, 180 μL of the aqueous layer was transferred to a clean 1.5 mL Eppendorf tube, and 100 μL of octanal was added to the samples, followed by vortexing for 1 min, resting for 1 min, and centrifuging for 1 min at 6400g. Three 50 μL aliquots of the aqueous layer were transferred to a 384-microwell plate for fluorescent detection.
2-AB-Derivatized Sialic Acid Quantitation
A sialic acid standard was diluted to various concentrations in PBS; 10 μL of sialic acid was mixed with 1.4 μL of 5 M NaCNBH3 in 1 M NaOH, 5.6 μL of 500 mM 2-AB in acetonitrile, and 3 μL acetic acid. The samples were wrapped in parafilm and aluminum foil and incubated for 16 h at 60 °C in a dry bath. Following labeling, the solution was diluted to 220 μL with water and transferred to a 1.5 mL Eppendorf tube. A volume of 600 μL of octanal was added to the samples, and the samples were vortexed for 1 min, rested for 1 min, and centrifuged for 1 min at 6400g. Then, octanal was discarded, taking care not to disturb the aqueous layer. A second aliquot of 600 μL of octanal was added, and the extraction procedure was repeated. Next, 180 μL of the aqueous layer was transferred to a clean 1.5 mL Eppendorf tube, and 100 μL of octanal was added to the samples, followed by vortexing for 1 min, resting for 1 min, and centrifuging for 1 min at 6400g. Three 50 μL aliquots of the aqueous layer were transferred to a 384-microwell plate for fluorescent detection.
Application to Sialic Acid Cleaved from Glycoproteins
Solutions of fetuin and asialofetuin (1.5 mg/mL) were mixed in different ratios (100% fetuin, 90% fetuin, 55% fetuin, 50% fetuin, and 100% asialofetuin); 93 μL of these solutions and 5 μL of 0.2% sodium dodecyl sulfate (SDS) in PBS were incubated for 10 min at 100 °C to denature protein. The samples were allowed to cool, and 2 μL of neuraminidase (0.05 U/μL) was added. The samples were incubated for 24 h at 37 °C to ensure complete deglycosylation of the proteins. A sample containing 93 μL of water and 5 μL of 0.2% SDS in PBS (without protein) was incubated with 2 μL of sialidase as a negative control. The samples were loaded onto a 3 or 10 kDa MWCO filter and centrifuged at 12,000g for 30 min. The filtrate was immediately labeled with 2-AB or stored at −20 °C. The samples were prepared in triplicate; the labeling and cleanup conditions were identical to those used to quantify the sialic acid standard for the initial application to the model protein system. Specifically, 10 μL of the glycan solution was labeled, as described above, and 50 μL of the 220 μL of aqueous sample, after octanal extraction, was quantified, as described above.
For the final comparison of the mixed protein samples containing fetuin and asialofetuin, a slight modification to the procedure was made to maximize the signal-to-noise ratio of the fluorescence readout: following labeling, the samples were diluted to a volume of 140 μL instead of 220 μL; after the second 600 μL octanal addition was discarded, 120 μL was transferred instead of 180 μL. After the third octanal extraction with 100 μL of the solvent, a single 100 μL volume of the aqueous layer was transferred to 384-well plates instead of three 50 μL volumes. Five replicates of each protein mixture were prepared.
Fluorescent Detection and Data Analysis
Readings were taken on a SpectraMax iD3 microplate reader (Molecular Devices, San Jose, CA). The read height was set to 1 mm, and the excitation and emission wavelengths were 330 and 420 nm, respectively. Raw fluorescent units (RFUs) are reported in the Results and Discussion section. To calculate the sialic acid content in the fetuin/asialofetuin mixtures, the published value of 11 mol sialic acid/mol of protein20 was multiplied by the amount of fetuin in the sample. The expected fluorescence response for sialic acid in fetuin was found by multiplying the slope of the calibration curve for 2-AB-derivatized sialic acid by the expected sialic acid content and adding the background signal from asialofetuin.
Results and Discussion
We endeavored to solve a long-standing problem in the glycomics field, facilitating the transition between glycan-based biomarker discovery and clinical assay development. The key problem is the need for technology that can quantify glycans selectively and at low detection limits in a clinically viable, high-throughput assay. The field has already achieved low detection limits for glycans using the attachment of 2-AB to their reducing ends. Yet, these derivatized glycans are typically quantified via an instrumentation-intensive platform [high-performance liquid chromatography (HPLC) with fluorescence detection.] Chromatography has been required for two reasons: (1) to separate the labeled glycans from the excess labeling reagent that is necessary to obtain efficient labeling and (2) to provide specificity, as the glycans can be discriminated based on their retention times. Moving away from a chromatographic step would require addressing both of these needs. To address the first, we adopted a new approach to remove excess 2-AB, based on a recent work by Chu et al.15 The fluorophore is rapidly removed by reacting and extracting it with octanal. A key benefit to this method is that following cleanup, the labeled saccharides remain in aqueous solution undiluted, eliminating the need for any drying steps prior to quantitative analysis. Purified samples can therefore be directly transferred to a plate reader for a fast, efficient fluorescent reading. The data below show how implementing this extraction method allows for a high-throughput readout. Afterward, we demonstrate how assay specificity can also be addressed without relying on HPLC or MS.
Rapid Cleanup of 2-AB-Labeled Glycans and Quantification on a Plate Reader
The octanal reaction/extraction procedure by Chu et al.15 was modified, so that it could be implemented into a chromatography-free workflow. In the initial report of using this extraction procedure, most of the unreacted 2-AB was removed, but HPLC was still required for the complete removal of the residual labeling reagent from the glycans. The purity requirements for a chromatography-free workflow are inherently higher than the previously described approach because the residual fluorophore would introduce a higher background signal, impeding the detection and quantitation of labeled glycans. To effectively adapt the octanal extraction method for the experiment described herein, the procedure was modified, so that substantially more residual 2-AB would be selectively removed from solution, while keeping the labeled saccharides in solution and recovering them with high efficiency. Three key aspects were important during optimization: reducing the background, maximizing repeatability, and minimizing solvent consumption.
Figure 1 shows how modifications to the original octanal extraction procedure improve the removal of residual 2-AB. Figure 1A shows the residual fluorescence intensity that is obtained from unremoved 2-AB, following the original protocol in ref (15). In this case, the 2-AB labeling solution, containing no saccharide, was vortexed with 600 μL of octanal; octanal was discarded, and the fluorescence of the aqueous solution was measured. The fluorescence intensity was 27 times higher than that of the blank (Figure 1C) with a significant standard deviation between analyses. The excess background would significantly diminish the quantitative capability of our assay; so, efforts were taken to identify the extraction conditions that reduced the fluorescence intensity and increase its repeatability. Optimized extraction conditions were as follows: two 600 μL extractions followed by a 100 μL extraction. These conditions produced the results as in Figure 1B; the background signal is reduced by a factor of 10 and the standard deviation is also smaller. (Note: reducing the third extraction volume to 100 μL, instead of 600 μL, reduced the waste generated and did not negatively impact either the background or the repeatability.)
Figure 1.
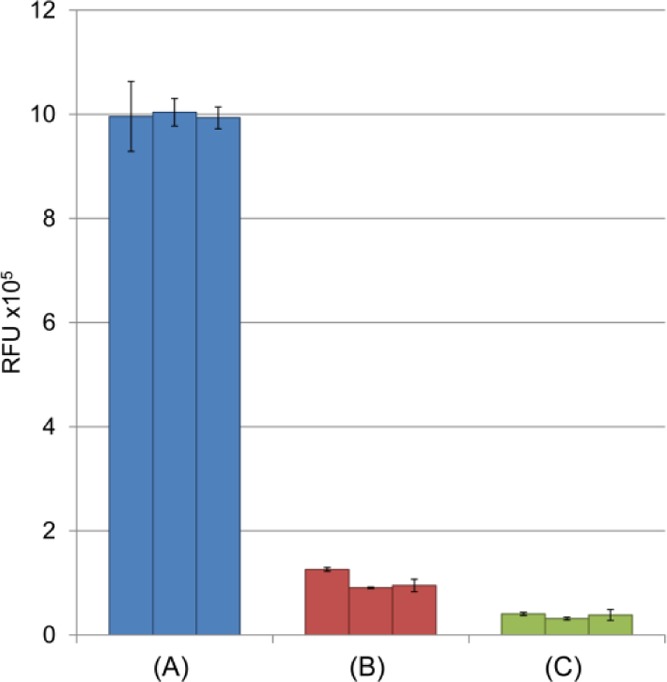
Optimization of the octanal cleanup procedure. Fluorescence intensity of 2-AB labeling solutions measured after: (A) one 600 μL octanal extraction and (B) two 600 μL extractions followed by one 100 μL extraction. (C) Fluorescence intensity of a blank with no 2-AB. Background was considerably reduced using optimized washing conditions (B). Samples were prepared in triplicate; each bar represents one sample which was divided into three individual wells; error bars represent the standard deviation of individual well measurements.
After the cleanup conditions were optimized, reaction efficiency, linearity, and the limit of detection were determined. To determine the reaction efficiency, various concentrations of a sialic acid standard were labeled with 2-AB, purified by octanal extraction, and quantified by fluorescence. The fluorescence intensity of the derivatized glycans was compared to the fluorescence intensity of pure 2-AB at the same concentrations as that of the glycan standards. The results are shown in Figure 2. The 2-AB and 2-AB-derivatized sialic acids produced very similar fluorescence intensity at each concentration. Surprisingly, the 2-AB-derivatized glycans had a slightly higher signal at each point tested. This is predominately because of a slightly higher background, as a blank of the reductive amination solution following octanal cleanup had a substantially higher signal than pure water. The slopes of the two curves are almost identical (0.0197 vs 0.0184), indicating that the change in fluorescence signal with the change in concentration is consistent, for both the 2-AB tag by itself and the tagged, purified glycan. These nearly identical slopes demonstrate that the reaction proceeded to ∼100% completion, and the cleanup procedure did not result in any measurable sample losses. The linearity of the calibration curve was quite good, with an R2 value of 0.999, and no decrease in linearity was observed compared to the standard curve produced solely from 2-AB. The limit of quantitation (LOQ) was 2.7 pmol/well for 2-AB (where no extraction is required) and 8.8 pmol/well for 2-AB-derivatized sialic acid (where the samples are extracted with octanal). The increase in LOQ for the derivatized saccharide is the result of higher background standard deviation following octanal extraction; the LOQ remains sufficiently low to quantify saccharides in biologically relevant, low-abundant glycoproteins.
Figure 2.
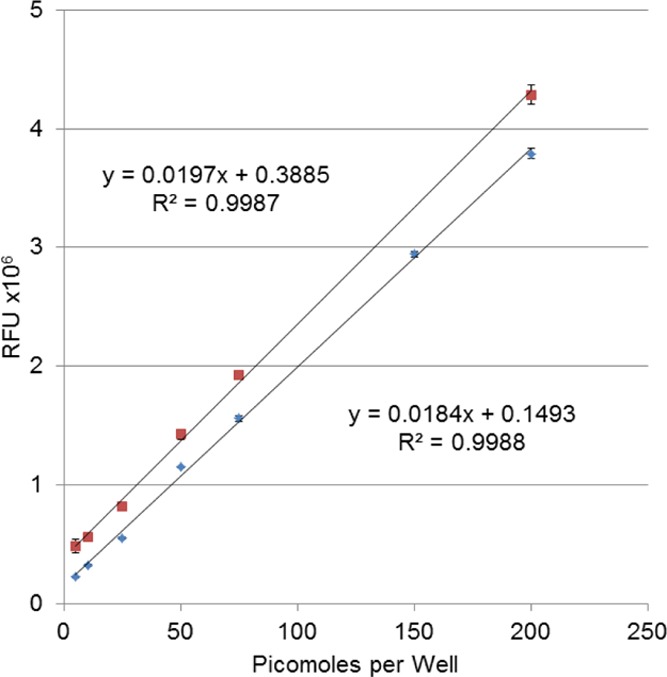
Calibration curves of 2-AB standard (⧫) and 2-AB-derivatized sialic acid (■). The error bars, which are present at every concentration point, are too small to see on some points.
Obtaining Glycan Specificity without HPLC or MS Detection
Current glycan quantitation methods typically require either HPLC retention times or m/z’s (from MS) to discriminate one type of glycan from another; a broadly implementable approach would remove the need for this type of instrumentation. We mitigate this problem by implementing highly specific glycosidases into the workflow. In a proof-of-concept example, fetuin and asialofetuin are treated with sialidase to demonstrate how the developed method could be used to identify small, specific changes in protein glycosylation. These proteins have identical sequences and contain three N-linked glycosylation sites; the difference between the proteins is that fetuin is heavily sialylated, containing approximately 11 mol sialic acid/mol protein,20 whereas asialofetuin contains no sialic acid; otherwise, the glycan components are identical. The workflow used to prepare samples is shown in Figure 3. Fetuin and asialofetuin were incubated with an enzyme that selectively releases sialic acid from N-glycans. Following enzymatic cleavage, the samples were passed through a MWCO filter to separate the released glycans from the protein. The filtrate, containing cleaved saccharides, was incubated with 2-AB labeling solution. Following sample cleanup, the fluorescence intensity was measured.
Figure 3.
Experimental workflow to quantify sialic acids in glycoproteins; sialic acid (pink diamonds) is enzymatically cleaved from proteins and then passed through an MWCO filter. The samples are then labeled with 2-AB. Excess fluorophore is conjugated to octanal and removed through the separation of the octanal (orange) and aqueous layers. Aqueous solution is transferred to a microplate where the fluorescent intensity is measured.
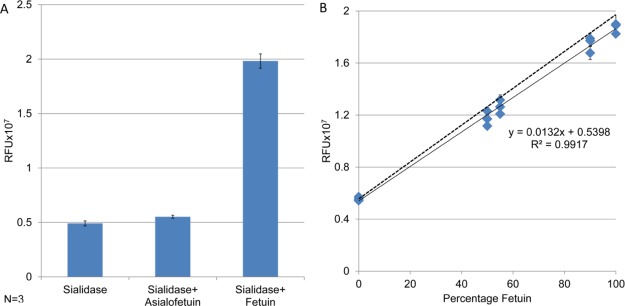
The effectiveness of the workflow in Figure 3 can be seen in Figure 4A, which contains the quantitative results obtained after subjecting fetuin and asialofetuin to the workflow. When asialofetuin was subjected to this procedure, the fluorescence intensity of the extracted glycans was approximately equivalent to the signal contained for the negative control, where no protein other than sialidase is present. The increase in fluorescence intensity observed when fetuin is incubated with sialidase indicates that sialic acid was successfully cleaved and derivatized. These data demonstrate that the combination of a selective glycosidase, a careful derivatization and cleanup procedure, and a fluorescent readout is sufficient to detect and quantify cleaved saccharides of interest.
Figure 4.
Demonstration of method specificity, accuracy, and linearity for glycoproteins. (A) Fluorescent intensity of cleaved sialic acid from negative control, asialofetuin, and fetuin. (B) Calibration curve for fetuin and asialofetuin mixed in different ratios: the fluorescent intensity increases linearly with the sialylated fraction of the protein. The dotted line shows the fluorescence intensity expected from the calculated sialic acid content.
To verify that the inclusion of the glycosidase step did not deteriorate the quantitative metrics of the overall assay, we built a new calibration curve, by mixing fetuin and asialofetuin in different ratios and subjecting the samples to the workflow; the results are shown in Figure 4B. The solid line shows the measured fluorescent signal plotted against the percentage of fetuin in the samples, producing a linear response with low intra- and intersample variation. Importantly, an R2 value of >0.99 was obtained, which demonstrates that every step of the procedure, including glycan cleavage, labeling, residual labeling reagent removal, and quantitation, can be performed with high repeatability and can provide a linear response.
The accuracy of the assay is also demonstrated; the dotted line represents the fluorescence intensity values, calculated from the 2-AB-derivatized sialic acid calibration curve in Figure 2, that would be obtained if exactly 11 mol of sialic acid was present per mole of fetuin—as reported elsewhere20––and no sample losses were experienced during glycan cleavage, derivatization, or purification. An example calculation showing explicitly how the values in this curve are calculated is provided in the Supporting Information. Clearly, the measured values remain very close to the predicted ones, demonstrating that the method is highly accurate and that sialic acid present in the protein is effectively cleaved, labeled, and detected.
As a final point of rigor, we verified that the assay maintains its linearity throughout the range of concentrations and conditions tested herein. The most concentrated sample shown in this work is the sample in Figure 4B corresponding to 100% fetuin; it contained 720 pmol of sialic acid per well, as described in the sample calculation (Supporting Information). A calibration curve for 2-AB from 100 to 1000 pmol/well is provided in Figure S1. The slope of this curve (0.0018 × 10⁷ RFU/pmol) is unchanged from the slope shown in Figure 2, which covers a range up to 200 pmol/well; the assay does not suffer a drop in sensitivity in this higher concentration range; this point is also confirmed by the highly linear nature of the curve: R2 > 0.9999. Additionally, when ∼9–90 pmol of fetuin is deglycosylated, generating ∼100–1000 pmol of sialic acid, the released, derivatized glycans produce a highly linear response (R2 = 0.998), showing that even the deglycosylation and labeling steps do not impact the linearity of the assay; see Figure S1.
Finally, we determined the extent to which two samples with very similar glycosylation profiles could be discriminated in this assay. Five replicates of four different protein mixtures (containing fetuin and asialofetuin) were prepared and assayed. The results are shown in Figure 5. The mixtures containing either 100% fetuin or 90% fetuin/10% asialofetuin could be discriminated easily, at >99% confidence interval (p < 0.01). This result shows that when a protein’s glycosylation changes by just 10%, this assay can detect it with certainty. Two samples whose glycosylation was even more similar were also compared. These samples had a difference in their sialic acid content of just 5%. Here, the samples were not quite differentiable at the 95% confidence interval, with p = 0.0696. As the goal of this assay is to develop a clinically relevant assay platform that can distinguish substantial changes in glycosylation (typically greater than twofold different), these metrics are quite appealing: biological variability among patients in the same cohort would present a much larger variation in glycosylation than the 5% measurement uncertainty determined here.
Figure 5.
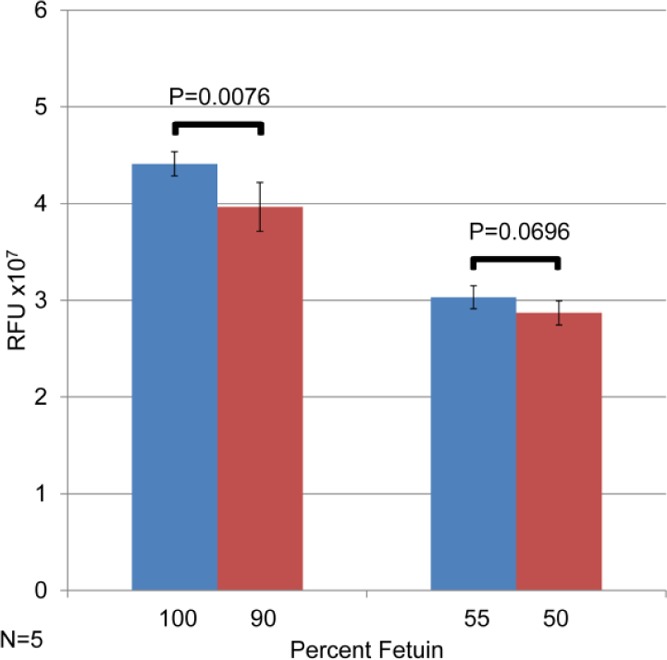
Demonstration that the method is capable of measuring small changes in glycosylation in proteins. (Left side): Protein sample containing either 100% fetuin or 90% fetuin; 10% asialofetuin is readily discriminable. Protein samples containing 55% fetuin or 50% fetuin are almost discriminable at the 95% confidence interval.
Although only a single glycosidase example is needed to demonstrate the proof of principle, this assay could be multiplexed. Other glycans that can be cleaved with glycosidases could be used in parallel to create a unique glycan fingerprint for patients; a depiction of this vision can be seen in Figure 6. The relative abundances of different glycan features can be compared to develop diagnostic tests that discriminate between healthy and diseased individuals. The features could even be assessed en masse using machine learning software, such as the recently described Aristotle Classifier, which was specifically designed for discriminating disease states using a panel of glycan features.21 The easy fluorescent quantitation of multiple glycan features for patient samples, such as that described in Figure 6, could provide the means to identify highly sensitive and specific biomarkers in a convenient clinical assay, not requiring more instrument-heavy workflows. Additionally, biomarkers identified in highly informative (MS-based or HPLC fluorescence-based) glycomics experiments can be adapted to a clinically viable format using the developed assay.
Figure 6.
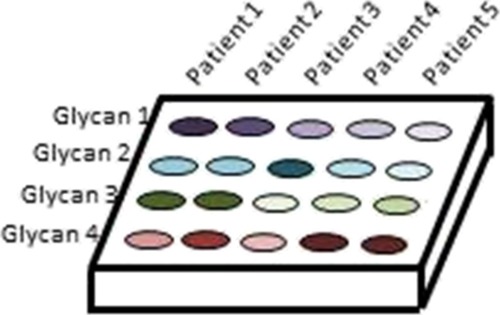
Multiplexed quantitation of different glycan features used to create a unique glycan fingerprint for individual patients.
Conclusions
Herein, we provide a solution for researchers who have discovered promising glycan-based biomarkers but need a viable assay for validating their biomarkers on a large scale and transitioning the assay to the clinic. The developed method provides characteristics that are needed in clinically viable assays: incorporating glycosidases allows for the quantification of glycan-specific features in the simple, fast purification of derivatized saccharides with octanal increases in sample throughput, and the use of a plate reader for quantifying the fluorescence signal transforms a slow, technology-intensive assay to one that is clinically viable. Combined, these features result in an assay capable of reliably discriminating between small differences in protein glycosylation in a rapid, high-throughput fashion. Proof of concept was established by selectively detecting one particular type of glycan, sialic acid, whose abundance is commonly modified in disease states. The method successfully detected a glycosylation change with just a 10% change in the sialic acid content of the protein tested.
Acknowledgments
The authors are grateful to NIH for supporting this work via grants R35GM136354 and T32-GM008359.
Supporting Information Available
The Supporting Information is available free of charge at https://pubs.acs.org/doi/10.1021/acsomega.9b03334.
The authors declare no competing financial interest.
Supplementary Material
References
- Saldova R.; Royle L.; Radcliffe C. M.; Abd Hamid U. M.; Evans R.; Arnold J. N.; Banks R. E.; Hutson R.; Harvey D. J.; Antrobus R.; Petrescu S. M.; Dwek R. A.; Rudd P. M. Ovarian Cancer is Associated with Changes in Glycosylation in Both Acute-Phase Proteins and IgG. Glycobiology 2007, 17, 1344–1356. 10.1093/glycob/cwm100. [DOI] [PubMed] [Google Scholar]
- Arnold J. N.; Saldova R.; Galligan M. C.; Murphy T. B.; Mimura-Kimura Y.; Telford J. E.; Godwin A. K.; Rudd P. M. Novel Glycan Biomarkers for the Detection of Lung Cancer. J. Proteome Res. 2011, 10, 1755–1764. 10.1021/pr101034t. [DOI] [PubMed] [Google Scholar]
- Peracaula R.; Tabarés G.; Royle L.; Harvey D. J.; Dwek R. A.; Rudd P. M.; de Llorens R. Altered glycosylation pattern allows the distinction between prostate-specific antigen (PSA) from normal and tumor origins. Glycobiology 2003, 13, 457–470. 10.1093/glycob/cwg041. [DOI] [PubMed] [Google Scholar]
- Russell A. C.; Šimurina M.; Garcia M. T.; Novokmet M.; Wang Y.; Rudan I.; Campbell H.; Lauc G.; Thomas M. G.; Wang W. The N-Glycosylation of Immunoglobulin G as a Novel Biomarker of Parkinson’s Disease. Glycobiology 2017, 27, 501–510. 10.1093/glycob/cwx022. [DOI] [PubMed] [Google Scholar]
- Menni C.; Gudelj I.; Macdonald-Dunlop E.; Mangino M.; Zierer J.; Bešić E.; Joshi P. K.; Trbojević-Akmačić I.; Chowienczyk P. J.; Spector T. D.; Wilson J. F.; Lauc G.; Valdes A. M. Glycosylation Profile of Immunoglobulin G is Cross-Sectionally Associated with Cardiovascular Disease Risk Score and Subclinical Atherosclerosis in Two Independent Cohorts. Circ. Res. 2018, 122, 1555–1564. 10.1161/circresaha.117.312174. [DOI] [PMC free article] [PubMed] [Google Scholar]
- Suzuki H.; Müller O.; Guttman A.; Karger B. L. Analysis of 1-Aminopyrene-3,6,8-trisulfonate-Derivatized Oligosaccharides by Capillary Electrophoresis with Matrix-Assisted Laser Desorption/Ionization Time-of-Flight Mass Spectrometry. Anal. Chem. 1997, 69, 4554–4559. 10.1021/ac970090z. [DOI] [PubMed] [Google Scholar]
- Bigge J. C.; Patel T. P.; Bruce J. A.; Goulding P. N.; Charles S. M.; Parekh R. B. Nonselective and Efficient Fluorescent Labeling of Glycans Using 2-Amino Benzamide and Anthranilic Acid. Anal. Biochem. 1995, 230, 229–238. 10.1006/abio.1995.1468. [DOI] [PubMed] [Google Scholar]
- Harvey D. J. Electrospray Mass Spectrometry and Fragmentation of N-Linked Carbohydrates Derivatized at the Reducing Terminus. J. Am. Soc. Mass Spectrom. 2000, 11, 900–915. 10.1016/s1044-0305(00)00156-2. [DOI] [PubMed] [Google Scholar]
- Ruhaak L. R.; Zauner G.; Huhn C.; Bruggink C.; Deelder A. M.; Wuhrer M. Glycan Labeling Strategies and their use in Identification and Quantification. Anal. Bioanal. Chem. 2010, 397, 3457–3481. 10.1007/s00216-010-3532-z. [DOI] [PMC free article] [PubMed] [Google Scholar]
- Royle L.; Campbell M. P.; Radcliffe C. M.; White D. M.; Harvey D. J.; Abrahams J. L.; Kim Y.-G.; Henry G. W.; Shadick N. A.; Weinblatt M. E.; Lee D. M.; Rudd P. M.; Dwek R. A. HPLC-Based Analysis of Serum N-Glycans on a 96-Well Plate Platform with Dedicated Database Software. Anal. Biochem. 2008, 376, 1–12. 10.1016/j.ab.2007.12.012. [DOI] [PubMed] [Google Scholar]
- Takahashi N.; Kato K. GALXY (Glycoanalysis by the Three Axes of MS and Chromatography): a Web Application that Assists Structural Analyses of N-Glycans. Trends Glycosci. Glycotechnol. 2003, 15, 235–251. 10.4052/tigg.15.235. [DOI] [Google Scholar]
- Ferdosi S.; Rehder D. S.; Maranian P.; Castle E. P.; Ho T. H.; Pass H. I.; Cramer D. W.; Anderson K. S.; Fu L.; Cole D. E. C.; Le T.; Wu X.; Borges C. R. Stage Dependence, Cell-Origin Independence, and Prognostic Capacity of Serum Glycan Fucosylation, β1-4 Branching, β1-6 Branching, and α2-6 Sialylation in Cancer. J. Proteome Res. 2018, 17, 543–558. 10.1021/acs.jproteome.7b00672. [DOI] [PMC free article] [PubMed] [Google Scholar]
- Adamczyk B.; Tharmalingam T.; Rudd P. M. Glycans as Cancer Biomarkers. Biochim. Biophys. Acta 2012, 1820, 1347–1353. 10.1016/j.bbagen.2011.12.001. [DOI] [PubMed] [Google Scholar]
- Pinho S. S.; Reis C. A. Glycosylation in Cancer: Mechanisms and Clinical Implications. Nat. Rev. Cancer 2015, 15, 540–555. 10.1038/nrc3982. [DOI] [PubMed] [Google Scholar]
- Chu A.-H. A.; Saati A. E.; Scarcelli J. J.; Cornell R. J.; Porter T. J. Reactivity-Driven Cleanup of 2-Aminobenzamide Derivatized Oligosaccharides. Anal. Biochem. 2018, 546, 23–27. 10.1016/j.ab.2018.01.012. [DOI] [PubMed] [Google Scholar]
- Russell A. C.; Šimurina M.; Garcia M. T.; Novokmet M.; Wang Y.; Rudan I.; Campbell H.; Lauc G.; Thomas M. G.; Wang W. The N-glycosylation of immunoglobulin G as a novel biomarker of Parkinson’s disease. Glycobiology 2017, 27, 501–510. 10.1093/glycob/cwx022. [DOI] [PubMed] [Google Scholar]
- Liang L.; Shen Y.; Zhang J.; Xu S.; Xu W.; Liang C.; Han B. Identification of breast cancer through spectroscopic analysis of cell-membrane sialic acid expression. Anal. Chim. Acta 2018, 1033, 148–155. 10.1016/j.aca.2018.04.072. [DOI] [PubMed] [Google Scholar]
- Pihikova D.; Kasak P.; Kubanikova P.; Sokol R.; Tkac J. Aberrant sialylation of a prostate-specific antigen: Electrochemical label-free glycoprofiling in prostate cancer serum samples. Anal. Chim. Acta 2016, 934, 72–79. 10.1016/j.aca.2016.06.043. [DOI] [PMC free article] [PubMed] [Google Scholar]
- Huang Y.; Zhou S.; Zhu J.; Lubman D. M.; Mechref Y. LC-MS/MS isomeric profiling of permethylated N-glycans derived from serum haptoglobin of hepatocellular carcinoma (HCC) and cirrhotic patients. Electrophoresis 2017, 38, 2160–2167. 10.1002/elps.201700025. [DOI] [PMC free article] [PubMed] [Google Scholar]
- Aich U.; Hurum D. C.; Basumallick L.; Rao S.; Pohl C.; Rohrer J. S.; Kandzia S. Evaluation of Desialylation During 2-Amino Benzamide Labeling of Asparagine-Linked Oligosaccharides. Anal. Biochem. 2014, 458, 27–36. 10.1016/j.ab.2014.03.008. [DOI] [PubMed] [Google Scholar]
- Hua D.; Patabandige M. W.; Go E. P.; Desaire H. The Aristotle Classifier: Using the Whole Glycomic Profile to Indicate a Disease State. Anal. Chem. 2019, 91, 11070–11077. 10.1021/acs.analchem.9b01606. [DOI] [PMC free article] [PubMed] [Google Scholar]
Associated Data
This section collects any data citations, data availability statements, or supplementary materials included in this article.


