Abstract
Luteolin (LT) is a poorly soluble bioactive compound that suffered bioavailability problems after oral administration. Hence, the aim of the proposed research work was to formulate and investigate various solid dispersions (SDs) of LT in order to enhance its dissolution and bioactivity. LT-SD was prepared using polyethylene glycol 4000 (PEG 4000) as a carrier at the mass ratios of 1:1, 1:2, and 1:4. LT-SD was prepared using different methods including fusion (FU), solvent evaporation (SE), and microwave irradiation (MI) methods. The prepared LT-SD was duly characterized in terms of differential scanning calorimetry (DSC), X-ray diffraction (XRD), scanning electron microscopy (SEM), infrared (IR) spectroscopy, and nuclear magnetic resonance (NMR) and evaluated for dissolution and in vitro antioxidant activity. The results of DSC, XRD, SEM, IR, and NMR suggested the formation of LT-SD. After 90 min of the dissolution study, the results displayed that the % release of LT from prepared SD was significantly higher compared with the pure LT and its physical mixture dispersion (PMD). LT-SD prepared using the MI method displayed the maximum release of LT (i.e., 97.78 ± 4.41%) at a 1:2 mass ratio of LT:PEG 4000. The LT-SD prepared using the SE method displayed the maximum release of 93.78 ± 3.98% at a mass ratio of 1:4 of LT:PEG 4000. The SD prepared by the MI method showed enhanced dissolution due to higher aqueous solubility and the reduction of particle size. The solid-state characterization studies (DSC, XRD, SEM, IR, and NMR studies) suggested the morphological conversion of LT into the amorphous form from the crystalline state. The results of the antioxidant study revealed that the formation LT-SD displayed significantly higher radical scavenging activity than the pure LT. Therefore, SD obtained using PEG 4000 could be a potential strategy for maximizing the solubility, in vitro dissolution, and therapeutic efficacy of LT.
1. Introduction
Luteolin (LT) (molecular structure: Figure 1A; chemical name: 2-(3,4-dihydroxyphenyl)-5,7-dihydroxychromen-4-one and CAS registry number: 491-70-3) is a light yellow-colored crystalline powder that comes under the class of bioflavonoids.1 The molecular formula and molecular weight of LT are C15H10O6 and 286.24 g/mol, respectively.1,2 It can be found in many plants including celery, perilla leaf, chamomile tea, and green pepper.3,4 Several potential pharmaceutical and therapeutic applications for LT have been reported, but it experiences the problem of formulation development due to its weak aqueous solubility.5,6 Moreover, the poor solubility (1.93 × 10⁻⁵ mol/kg at 20 °C) and stability of LT in water severely restricts its applications in the development of pharmaceutical products.7
Figure 1.
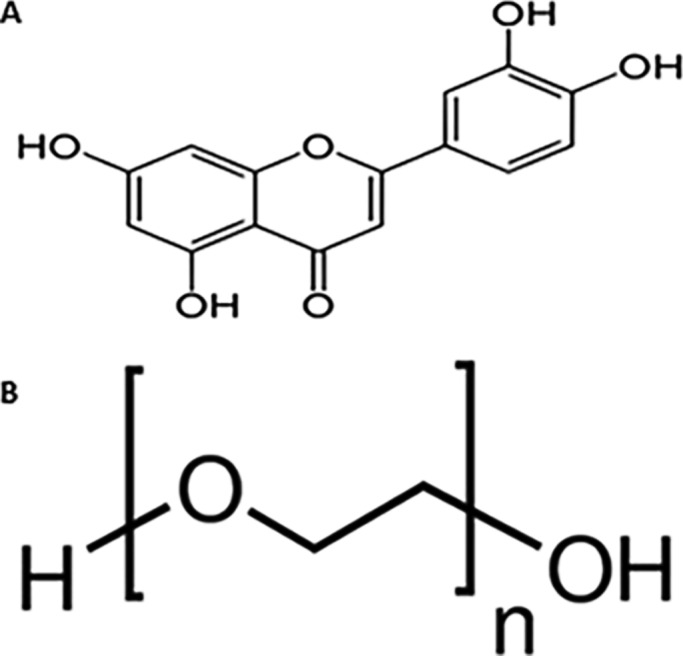
Chemical structures of (A) LT and (B) PEG 4000.
Solid dispersion (SD) technology has been used extensively in maximizing the solubility, in vitro dissolution rate, and bioavailability of poorly soluble drugs.8,9 The crystalline form of such drugs can be transformed into the amorphous form using SD technology.10 Numerous studies have highlighted the advantages of SD in the enhancement of the solubility and dissolution rate of drugs with poor water solubility.11−13
Polyethylene glycols (PEGs) with molecular weights of 1500–20,000 are commonly used in the manufacturing of SD. The solubility of PEGs in water is normally good, but it decreases with an increase in the molar mass of PEGs. The specific benefit of PEGs in the preparation of SD is that these carriers are also miscible/soluble in commonly used organic solvents. The melting points of PEGs of importance lie under 65 °C in each case (e.g., the melting ranges of PEG 1000, PEG 4000, and PEG 6000 are 30–40, 50–58, and 55–63 °C, respectively).14 The lower melting points of PEGs are helpful in the manufacturing of SD by the different methods. Furthermore, they are also able to improve the wettability of poorly soluble compounds.15
The SDs of poorly soluble compounds can be prepared using an inert hydrophilic carrier by various methods such as the fusion (FU), solvent evaporation (SE), and microwave irradiation (MI) methods.16 The identification of the physical state of the drug in SD is important. Various sophisticated techniques including differential scanning calorimetry (DSC), X-ray diffraction (XRD), and Fourier transform infrared spectroscopy (FTIR) are commonly used techniques for the characterization of SDs.
Some pharmaceutical approaches such as co-crystal technology,17,18 cyclodextrin complexation,19,20 phospholipid complexation,21 polymeric micelles,5 and nanoparticulate drug delivery system22 have been studied to enhance the solubility, dissolution rate, and bioavailability of LT in the literature. A co-solvent approach had also been attempted in order to enhance the solubility and physicochemical profile of LT.6 In this study, LT-SD was prepared using different methods (FU, SE, and MI) using PEG 4000 (Figure 1B) as a carrier in the different mass ratios. The developed LT-SDs were optimized by the dissolution study to select the best formulation (from each method) and further characterized for their physicochemical parameters with DSC, XRD, FTIR, and SEM. Finally, the in vitro antioxidant study was also explored to check the antioxidant potential of the developed LT-SD.
2. Results and Discussion
2.1. Preparation of LT-SD
Different SDs of LT were prepared using three different methods, namely, FU, SE, and MI methods. The SE method involves the solubility/miscibility of LT and PEG 4000 as a carrier in absolute ethanol, and then the organic solvent was evaporated in a water bath. The key point of this method was to ensure complete solubility/miscibility of LT in the carrier and disperse uniformly. In the case of the MI method, the heat is produced, which can allow for penetrating any material at any point of the sample at the same time. The microwave energies produced by MI can influence the crystalline structure of the drug molecule. The time of exposure had great importance in achieving the amorphous form of the drug, which results in enhanced dissolution rate of the drug.23 The time of a microwave oven can be fixed, but MI energies could not be fixed. This method has the main advantage of not using organic solvents and the absence of any risk originating from the residual solvents.
The formulation LT-SD was obtained with the carrier (PEG 4000) at the different mass ratios of 1:1, 1:2, and 1:4 using different techniques. The mass ratios of 1:1, 1:2, and 1:4 were selected randomly as there is no issue of miscibility/solubility of PEG 4000 with most of the organic solvents used in the preparation of SD.15 PEG 4000 is easily miscible/soluble in organic solvents.14 In the preparation of SDs, the drugs and polymers are separately dissolved in organic solvents. Then, the drug solutions and polymer solutions are mixed together, and organic solvents are evaporated in order to obtain SDs. Because the solid drug is finally dispersed into the solid polymer in SD, the solubility/miscibility of the drug in a polymer, i.e., PEG 4000, is not important.8 Hence, the solubility/miscibility studies between LT and PEG 4000 were not carried out in this study. Nevertheless, LT has been reported as freely soluble in PEG 4000, and the solubility of the solute is enhanced with enhancement in the molar mass of the carrier, i.e., PEG 4000 in this case.6 Therefore, LT will also be freely or very soluble in PEG 4000. Therefore, the miscibility/solubility of LT in PEG 4000 was not an issue. PEG is the most commonly used polymer for the preparation of SD. It offers various advantages over other hydrophilic carriers including low melting point (50–60 °C), rapid solidification rate, and capability of forming solid drug solutions.24,25 The effect of various mass ratios on LT dissolution was chosen as the indicator for its evaluation.
2.2. DSC Studies
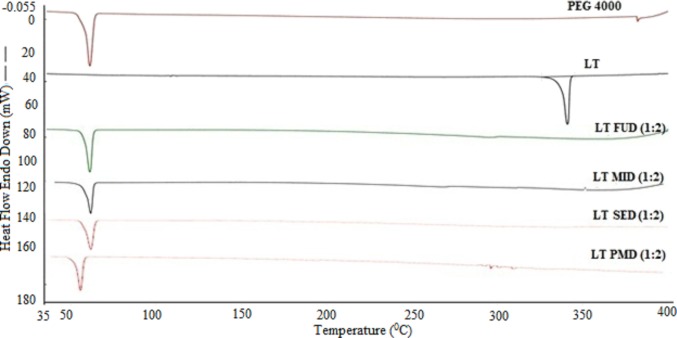
DSC is a commonly used thermal analysis method due to its capability to provide detailed information about the physical properties. The DSC thermograms of LT, PEG 4000, LT-physical mixture dispersion (PMD), and LT-SDs (LT-FUD, LT-SED, and LT-MID) are presented in Figure 2. The thermal curve of LT presented a sharp and crystalline endothermic peak at 341.4 °C, corresponding to its melting temperature. PEG 4000 showed a characteristic peak at 62.7 °C, corresponding to melting temperature of PEG 4000. The melting temperature of LT has been reported as 338.4 °C.6 The melting temperature and DSC thermogram of LT recorded in this study were very close with those reported in the literature. The DSC curve of the different LT-SDs (LT-FUD, LT-SED, and LT-MID) and PMD showed the endothermic peaks near to the melting temperature of PEG 4000. However, the crystalline peak of LT disappeared in all SDs as well as in PMD. The disappearance of the LT peak in SDs and PMD could be attributed to the molecular dispersion of LT in PEG 4000 and converted to the amorphous state, so there is no definite melting temperature of LT that was observed.
Figure 2.
DSC thermograms of LT, PEG 4000, LT-PMD, LT-FUD, LT-MID, and LT-SED.
2.3. XRD Studies
The XRD diffractogram of LT, PEG 4000, LT-PMD, and LT-SDs (LT-FUD, LT-SED, and LT-MID) are presented in Figure 3. The XRD spectra of LT showed various intense peaks at 14.3°, 16.1°, 26.1°, 29.2°, and 27.6° at a diffraction angle range of 5–50°, suggesting that LT was present in the crystalline form. The recorded XRD peaks of LT were in accordance with those reported in the literature.6 However, the polymer PEG 4000 presented the diffraction peaks at 20.6° and 23.5° only. The diffraction peak intensity of LT-PMD weakens in comparison to pure LT, but many diffraction peaks still remained compared with PEG 4000. This observation suggested that some amount of the LT was still in the crystalline form in PMD. The diffraction pattern of LT-SDs (LT-FUD, LT-SED, and LT-MID) presented the complete disappearance of the characteristic peaks of LT. The disappearance of the characteristic peaks of LT suggested that LT is completely dispersed in the PEG 4000 carrier and converted to the amorphous state. Only the characteristic peaks of the carrier were observed in the LT-SDs, which suggested the absence of any physical interaction between LT and PEG 4000.
Figure 3.
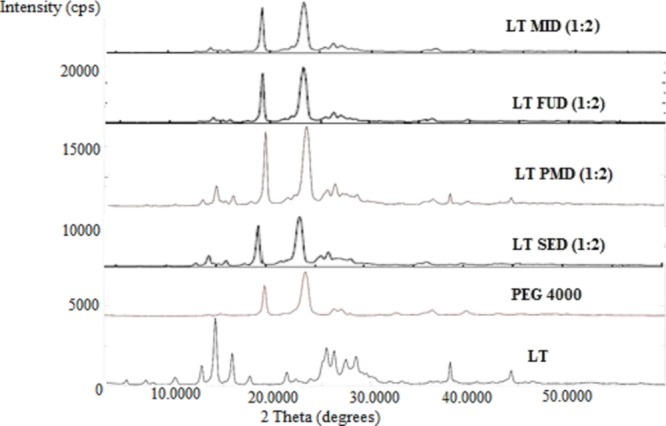
XRD spectra of LT, PEG 4000, LT-PMD, LT-FUD, LT-MID, and LT-SED.
2.4. SEM Studies
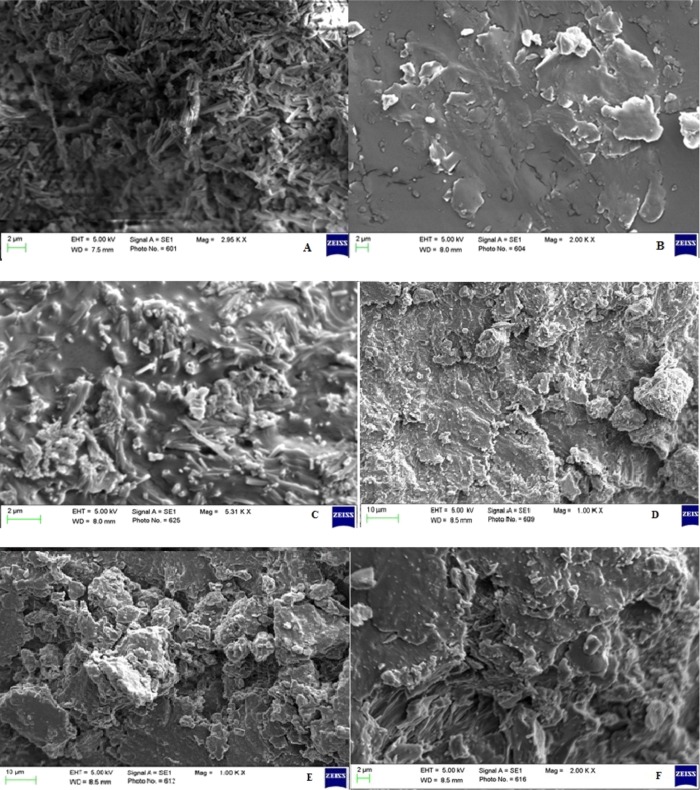
To study the surface morphology of various SDs, SEM study was carried out, and these images are depicted in Figure 4A–F. Figure 4A depicts the image of pure LT, and the particles were found to be in the crystal shape, and the carrier PEG 4000 (Figure 4B) exists as irregularly shaped particles with smooth surfaces. The formulation LT-PMD displayed the presence of LT crystals surrounded by PEG 4000 (Figure 4C). The images of LT-FUD (Figure 4D), LT-SED (Figure 4E), and LT-MID (Figure 4F) showed the irregularly shaped particles, and the surface was found to be rough and irregular. It confirms that LT had lost its crystalline structure, suggesting the conversion to the amorphous form. The formation of a new and different solid state is indicated by the changes and modification of drug particle shapes in the SD.26 The same size of LD-SD was not achieved for each method as suggested by SEM images. The molecular interaction between LT and PEG 4000 is expected to be different in different methods. Therefore, the size of SDs in each method was not the same. From this study, it has been inferred that the particle size of LT reduced markedly with variable degrees.
Figure 4.
SEM images of (A) LT and (B) PEG 4000, (C) LT-PMD and (D) LT-FUD, and (E) LT-SED and (F) LT-MID.
2.5. FTIR Analysis
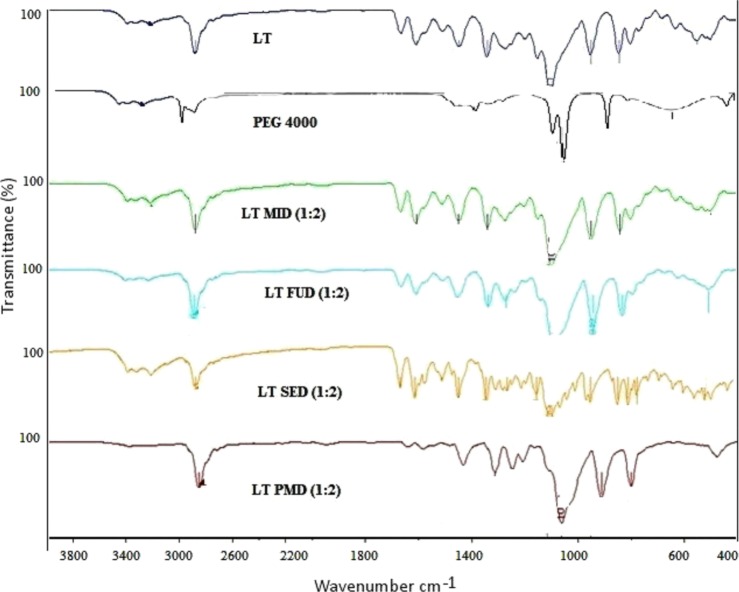
The FTIR spectra of LT-SDs (LT-FUD, LT-SED, and LT-MID) were used to interpret the newly formed bonds between LT and PEG 4000 in the solid state as shown in Figure 5. It has been reported that different molecules have a particular IR spectrum, which is being used as a fingerprint.27 The pure LT spectra showed sharp characteristic peaks attributed to the phenolic hydroxyl group (Ar–OH) stretching vibration at 2878 cm–1. The spectra also showed a distinct peak at 1606, 1447, 1341, 1302, 951, and 844 cm–1, which is ascribed to C=O stretching, C=C aromatic stretching, C–O–C pyran ring, and C–H aromatic bending. The FTIR peaks of LT were found in accordance with those reported in the literature.20 The carrier PEG 4000 has shown vibrational peaks at 3316 and 1087 cm–1, suggesting vibrational stretching of O–H and C–O–C, respectively. The characteristic peaks obtained at 1045, 1379, 2972.5, and 3317 cm–1 are assigned to C–O, C=O, C–H, and O–H, respectively.23 In LT-SD, all assigned peaks displayed no significant variation compared to the pure LT, suggesting the possibility of H-bonding with C=C. No clear shifts in the vibrational bands were observed in the LT with PEG 4000. The C=O stretching vibration for LT-SD was slightly shifted to 1665 and 1607 cm–1 due to stretching vibrations. The other characteristic peaks for LT-SDs were found at 1447 and 1340 cm–1 (C=C aromatic bending), 949 and 944 cm–1 (C–H aromatic bending), which showed a similar peak range as compared to pure LT. The spectra of PMD were found to be identical, and the main absorption bands of LT appeared in all the spectra in the region of absorption around 2879 cm–1. The distinct peak in the region is due to phenolic −OH stretching vibration. This indicated that there was no distinction between the internal structures and the conformation of these samples at the molecular level.
Figure 5.
FTIR spectra of LT, PEG 4000, LT-PMD, and LT-SDs (LT-FUD, LT-SED, and LT-MID).
2.6. Nuclear Magnetic Resonance (NMR) Studies
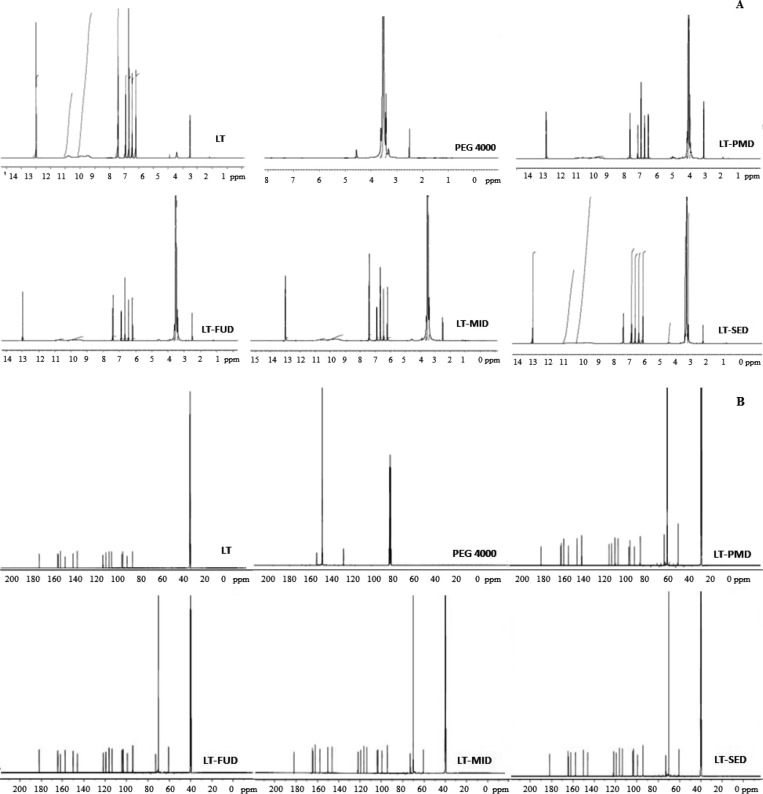
The proton-NMR (1H-NMR) and carbon-NMR (13C-NMR) of LT, PEG 4000, LT-PMD, LT-FUD, LT-MID, and LT-SED were executed to examine the complex genesis, and the chemical shift of entire samples depicted in Figure 6A,B. The 1H-NMR spectra of pure LT in deuterated dimethyl sulfoxide (DMSO-d6) presented a sharp deshielded singlet at 12.99 ppm, which attributed to the C-5 OH proton of flavonoids. The rest of the hydroxyl group displayed a broad singlet at δ 9.46, 9.90, and 10.80 ppm. The aromatic carbon depicted double doublet peaks at 7.41–7.43 ppm for the pure LT, and the pyran ring showed a definite singlet peak at δ 6.67 ppm. The carrier PEG 4000 presented the chemical shift values for tertiary methylene at δ 3.42–3.43 and 3.61–3.63 ppm. The singlet peak for the hydroxyl group of the carrier lies at δ 4.57 ppm.
Figure 6.
(A) 1H-NMR spectra of LT, PEG 4000, LT-PMD, LT-MID, and LT-SID. (B) 13C NMR spectra of LT, PEG 4000, LT-PMD, LT-MID, and LT-SID.
In contrast, the formulations LT-PMD, LT-FUD, LT-MID, and LT-SED expressed a slight change for the chemical shift values of the hydroxyl group having a singlet δ value of 12.99, 12.98, 12.99, and 12.99 ppm, respectively. The aromatic ring of the flavones attached to −OH group for LT-PMD, LT-FUD, LT-MID, and LT-SED exhibited a minor change in the number of protons as compared to pure LT having a δ value in between 7.41 and 7.43 ppm. The pyran ring also showed a definite singlet peak at δ 6.67 and 6.68 ppm, concluding that there is no interaction between the pure LT and the developed LT-PMD, LT-FUD, LT-MID, and LT-SED. Also, the carrier PEG 4000 further enhances the solubility of the formulations without having any interaction with the pure LT. The chemical shift values of the developed formulations exhibited a multiplet peak at δ 3.24–3.90 ppm, expressing the enhanced solubility as compared to the pure drug. The NMR spectrum of compounds could be assigned to a change in the structure of the molecule to observe the interaction and solubility with the polymer from the original pure drug. A lot of new signals were observed along with slight shifts in the original signals in the δ range of δ 3.24–3.90 ppm. This evidence concludes that the solubility properties of the LT-SDs have increased as compared to pure LT.16,20 Based on the 1H-NMR and 13C-NMR value, LT-MID showed the best formulation with the lesser chemical shift as compared to pure LT and PEG 4000.
2.7. Dissolution Study
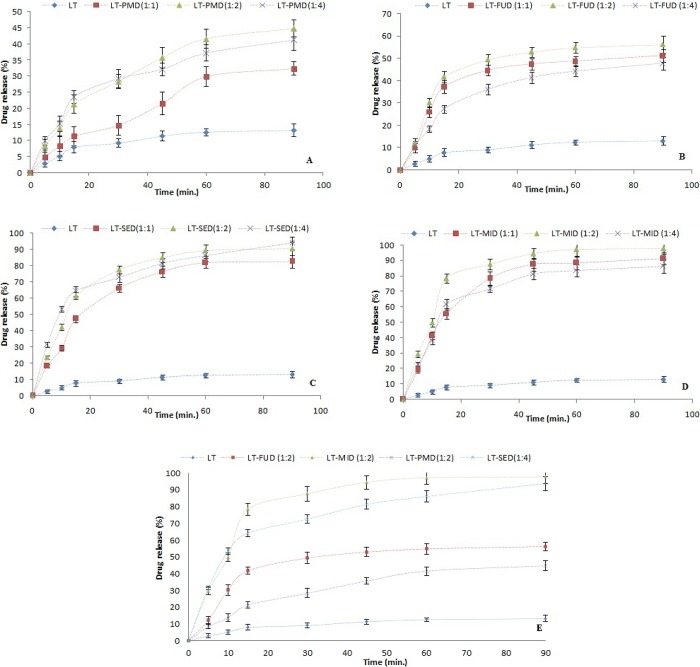
The in vitro drug release profile of LT from pure LT, LT-PMD, and LT-SDs (LT-FUD, LT-SED, and LT-MID) at three different mass ratios (1:1, 1:2, and 1:4) were performed, and results are presented in Figure 7A–E. The results showed significant enhancement in the drug release in the prepared LT-SD and PMD than pure LT in 90 min of study. The % release of pure LT was found to be 13.11 ± 0.83, whereas PMD (1:1, 1:2, and 1:4) showed drug release between 32.36 ± 2.83 and 44.76 ± 3.14% (Figure 7A), respectively. The PMD exhibited a higher dissolution rate compared to the pure LT, which might be due to the enhanced solubilization potential of PEG 4000. The SD formulation prepared by the FU method (LT-FUD) depicted the drug release between 47.78 ± 3.91 and 56.23 ± 2.45% (Figure 7B), the SE method (LT-SED) showed 82.43 ± 3.91 and 93.78 ± 4.22% (Figure 7C), and the MI method (LT-MID) showed 86.21 ± 3.43 and 97.78 ± 3.98% (Figure 7D) at three different mass ratios. These results suggested that the use of PEG 4000 as the carrier and transformation of the LT crystal to the amorphous state could definitely result in an enhancement in the solubility of LT. The hydrophilic polymer encapsulates the drug and helps to solubilize the drug readily due to its rapid contact with the dissolution media.28
Figure 7.
In vitro dissolution study of (A) LT and LT-PMD, (B) LT and LT-FUD, (C) LT and LT-SED, (D) LT and LT-MID, and (E) LT and LT-SDs (LT-PMD; 1:2), (LT-MID; 1:2), (LT-SDD; 1:4), and (LT-FUD; 1:2).
The trend observed for LT release from its dispersions was found highest in LT-MID followed by LT-SED > LT-FUD > LT-PMD. Among all prepared LT-SDs, the maximum release was found with LT-SD prepared by the MI method using an LT:PEG 4000 ratio of 1:2 (97.78 ± 4.4%) followed by the formulation prepared by the SE method using an LT:PEG 4000 ratio of 1:4 (93.78 ± 3.98%) (Figure 7E). The formulation LT-MID showed the maximum drug release at an LT:PEG ratio of 1:2. Overall, the release of LD from all SDs was much higher than pure LT. The most probable reasons for the enhancement in the dissolution rate of LT from all SDs are due to the amorphization of LT.16 However, the highest release of LT from LT-MID could be possible due to maximum amorphization of LT by microwave rays, improved surfactant, and wetting characteristics of PEG 400 with LT.16,23 The electromagnetic waves of microwave pass through the material and cause the molecules to oscillate, generating heat at each point of the material by the interaction of the electromagnetic field with its molecular and electronic structure. The microwave penetrates, allows the production of heat throughout the sample at the same rate resulting in uniform volumetric heating, and provides SD with better intimate contact between LT and PEG 4000.15,29 Further, the drug release data were fitted to different release kinetic models, and results are summarized in Table 1. The r2 values were observed minimum for the zero-order model for all SDs. However, the r2 values were obtained maximum in the case of a matrix-diffusion model for all SDs. Hence, the best fit model was a matrix-diffusion model for all the prepared SDs. The similarity factor (f2) value was estimated for pure LT, PMD, and optimized SDs in order to evaluate the statistical differences of the PMD and optimized SDs with that of pure LT. In vitro dissolution profiles of optimized SDs and PMD in comparison with pure LT are presented in Figure 7E. The estimated f2 values for pure LT and different formulations are summarized in Table 2. It was observed that the f2 values for PMD and optimized SDs were greater than 50, suggesting that the dissolution curves of PMD and optimized SDs are statistically different with that of pure LT (p < 0.05).
Table 1. Release Kinetics Model of LT-SDs Prepared by Three Different Methods.
| release model | LT-FUD (1:1) | LT-FUD (1:2) | LT-FUD (1:4) | LT-PMD (1:1) | LT-PMD (1:2) | LT-PMD (1:4) | LT-SED (1:1) | LT-SED (1:2) | LT-SED (1:4) | LT-MID (1:1) | LT-MID (1:2) | LT-MID (1:4) |
|---|---|---|---|---|---|---|---|---|---|---|---|---|
| zero order | 0.7462 | 0.4608 | 0.2390 | 0.8685 | 0.8735 | 0.8786 | 0.7784 | 0.6625 | 0.5224 | 0.6027 | 0.4517 | 0.5523 |
| first order | 0.8299 | 0.6769 | 0.5244 | 0.8964 | 0.9286 | 0.9205 | 0.8950 | 0.8599 | 0.8222 | 0.7871 | 0.8120 | 0.8234 |
| matrix | 0.9586 | 0.9193 | 0.8712 | 0.9576 | 0.9836 | 0.9749 | 0.9631 | 0.9527 | 0.9221 | 0.9331 | 0.9071 | 0.9432 |
| Peppas | 0.9227 | 0.8946 | 0.8636 | 0.9628 | 0.9861 | 0.9842 | 0.9341 | 0.9469 | 0.9075 | 0.8966 | 0.8950 | 0.8979 |
| Hix. Crow. | 0.8048 | 0.6168 | 0.4549 | 0.8882 | 0.9130 | 0.9086 | 0.8621 | 0.8096 | 0.7455 | 0.7382 | 0.7254 | 0.7514 |
Table 2. Similarity Factor f2 for Optimized LT-SDs Prepared by Different Methods.
| similarity factor | LT-PMD (1:2) | LT-FUD (1:2) | LT-SED (1:4) | LT-MID (1:2) |
|---|---|---|---|---|
| f2 (%) | 66.03 | 77.50 | 89.40 | 92.28 |
2.8. Antioxidant Activity
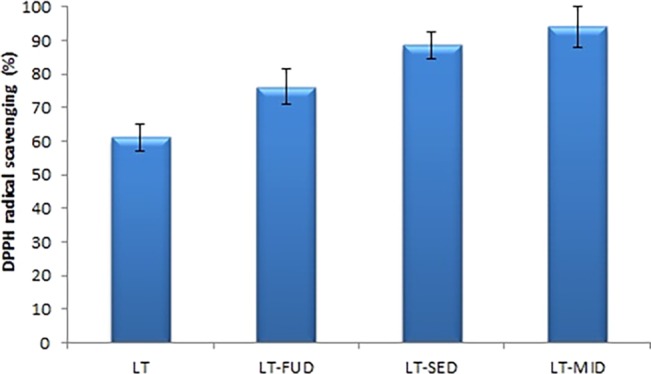
The 2,2-diphenyl-1-picrylhydrazyl (DPPH) radical scavenging activities of LT and LT-SDs (LT-FUD, LT-SED, and LT-MID) with a fixed LT-PEG 4000 mass ratio (1:2) were evaluated, and the results are depicted in Figure 8. The result of the study showed a significant increase (p < 0.05) of DPPH radical scavenging activity for LT-SDs (LT-FUD, LT-SED, and LT-MID) than pure LT (61.12 ± 4.11%). Among the three prepared SD, the highest DPPH radical scavenging activities showed by LT-MID is 94.14 ± 6.11% followed by LT-SED (88.55 ± 3.98%). The DPPH radical scavenging activity of LT-MID and LT-SED was found significantly higher than that of LT-FUD (76.23 ± 5.12) and pure LT (p < 0.05). The significant higher antioxidant activity result was achieved due to the higher solubility of LT in the used carrier PEG 4000. The formulation LT-MID showed the highest activity due to the greater improvement in solubility and dissolution due to the amorphization of LT by microwave rays. It has been reported that the antioxidants have the ability to donate the H+ or e– to DPPH and convert DPPH into DPPH-H; hence, the antioxidant activity of antioxidants is mainly associated with e– or H+ donating ability.30 In LT-SD, the electrons increase its scavenging abilities of oxidants and free radicals.31 The results of the study revealed that the formation of LT-SD (a bioflavonoid) showed good radical scavenging activity and antioxidant activities.
Figure 8.
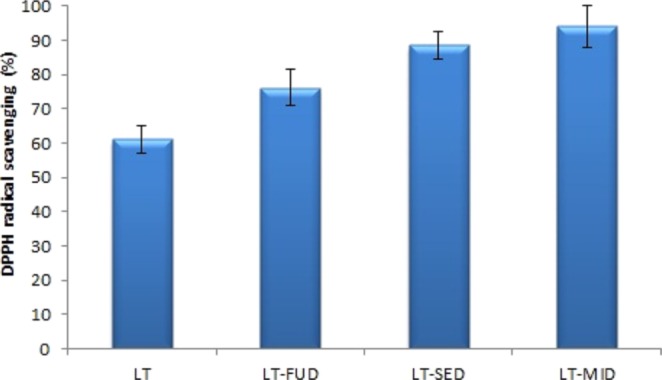
In vitro antioxidant activity of LT and LT-SDs (LT-FUD, LT-SED, and LT-MID).
3. Conclusions
The formulations LT-SDs were prepared by FU, SE, and MI methods using PEG 4000 as a carrier to enhance the dissolution rate and antioxidant activity of LT. Prepared SDs of LT were characterized using DSC, XRD, SEM, FTIR, and NMR studies. The result of the study revealed significant enhancement in the dissolution rate of LT from SD (p < 0.05). The greater dissolution enhancement of LT was achieved from SD prepared by the MI method at an LT:PEG 4000 ratio of 1:2. The DSC and XRD study confirms the transformation of a crystalline state of LT to an amorphous state. The IR study spectra revealed no interaction between LT and PEG 4000. The highest antioxidant activity was also achieved by LT-SD prepared by the MI method. Overall, the results of our study supported the proclaimed claims of the MI method as an effective and solvent-free alternative for preparing SDs for poorly soluble drugs such as LT.
4. Material and Methods
4.1. Materials
LT (purity 99.0%) was purchased from Beijing Mesochem Technology Co. Pvt. Ltd. (Beijing, China). PEG 4000 (purity 99.0%) was procured from E-Merck (Darmstadt, Germany). High-performance liquid chromatography (HPLC) grade ethanol (purity 99.9%) was purchased from Sigma Aldrich (St. Louis, MO, USA). The chemicals used in the study were of analytical/pharmaceutical grade with high purity.
4.2. Preparation of Physical Mixture
The PMD was prepared by mixing LT and PEG 4000 in the different mass ratios (1:1, 1:2, and 1:4) with the trituration method to get a homogeneous mixture, which was coded as LT-PMD. The obtained LT-PMDs were sieved using sieve no. 45 to obtain uniform particles and stored in a desiccator till further evaluation.23
4.3. Preparation of LT-SD
In this work, the SDs of LT were obtained using three different technologies including FU, SE, and MI techniques. The preparation of drug-carrier dispersions is easy and convenient in terms of mass ratio and molar ratio. Therefore, these mass ratios were prepared in mass ratio in this study.23 The composition of LT-SDs prepared using three different techniques is summarized in Table 3.
Table 3. Composition of LT-SDs Prepared by Three Different Methods.
| LT:PEG
4000 (mass ratio) | |||||||||||
|---|---|---|---|---|---|---|---|---|---|---|---|
| PMD | LT-FUD | LT-SED | LT-MID | ||||||||
| 1:1 | 1:1 | 1:1 | 1:1 | ||||||||
| 1:2 | 1:2 | 1:2 | 1:2 | ||||||||
| 1:4 | 1:4 | 1:4 | 1:4 | ||||||||
4.3.1. FU Method
LT-SD was prepared by the FU method using the different ratios of LT to PEG 4000, which was coded as LT-FUD. PEG 4000 with different mass ratios (1:1, 1:2, and 1:4) was taken and heated to a molten state at 60 °C, and the calculated amount of LT was included. The molten mass was continuously stirred with a glass rod till complete dissolution of LT. The obtained dispersion was solidified at ambient temperature. The dispersion was transferred in a desiccator for 24 h and then pulverized using a porcelain mortar and pestle. The obtained mass was sieved again using sieve no. 45 to obtain the particles of uniform size.32
4.3.2. SE Method
The SD of LT was prepared by the SE method in different ratios of LT to PEG 4000, which was coded as LT-SED. LT:PEG 4000 with three different mass ratios (1:1, 1:2, and 1:4) was taken. LT and PEG 4000 were dispensed into a beaker in which the required amount ethanol was added for the dissolution of LT and PEG 4000. The beaker was kept in a water bath held at 60 °C to evaporate the organic solvent. The organic solvents from the SDs are usually evaporated using a rotary evaporator in order to prevent the release in the environment.33,34 Nevertheless, in the preparation of SDs of drugs, organic solvents are evaporated completely with a rapid evaporation rate, which cannot be achieved using a rotary evaporator. For the rapid evaporation of organic solvents from SDs, some other techniques such as water bath or tray dryer have been used.35,36 Therefore, the SDs of LT were prepared in beakers, which were subjected to water bath for the evaporation of organic solvents instead of using a rotary evaporator.16,35,36 The preparation was cooled in ice and solidified for 12 h, and the obtained mass was stored and then pulverized using a pestle and mortar. The obtained mass was sieved using sieve no. 45 in order to obtain the particles of uniform size.16
4.3.3. MI Method
MI activated SDs of LT were prepared in different ratios of LT to PEG 4000 which were coded as LT-MID. The mixture of LT:PEG 4000 in the different mass ratios (1:1, 1:2, and 1:4) with a batch size of 1.0 g was taken into a glass beaker and subjected to microwaves at 500 W power in a microwave oven (Samsung Model ME0113M1). Only one beaker was microwaved at a point in time. The obtained masses were grounded using a glass mortar, and the then pulverized powder was sieved using sieve no. 45 in order to obtain the particles of uniform size.23
4.4. DSC
During the course of SD formation, various endothermic and exothermic changes could occur, which can be identified using a thermoanalytical method such as DSC.20 The thermal characteristics of LT, PEG 4000, PMD, and LT-SD (LT-FUD, LT-SED, and LT-MID) were assessed using a DSC (DSC-8000, Perkin Elmer, Waltham, MA, USA). Each sample was accurately weighed into sealed aluminum pans, and the blank pan was used as a reference. The temperature range used for such study was 25–400 °C with a heating rate of 5 °C/min. The nitrogen gas was purged with a flow rate of 50 mL/min. The thermograms of LT and PEG 4000 were compared with the prepared LT-SD (LT-FUD, LT-SED, and LT-MID) for comparative evaluation of the changes in the thermal behavior of LT in various SDs.
4.5. XRD
The variations in the crystallinity of LT in various SDs can be identified using diffraction techniques such as XRD.23 The crystallinity of LT, PMD, and LT-SD (LT-FUD, LT-SED, and LT-MID) was obtained using a diffractometer. The XRD spectra of LT, PMD, and LT-SD (LT-FUD, LT-SED, and LT-MID) were obtained using a diffractometer (Ultima IV diffractometer; Rigaku Inc. Tokyo, Japan) with a copper anode (Cu Kα radiation). The voltage and current for recording XRD spectra were set at 40 kV and 25 mA, respectively. These spectra were obtained at a step width of 0.05 °C and a diffraction angle between 3 and 60°. The results were interpreted based on the peak intensities of each sample recorded at various diffraction angles.
4.6. SEM
The surface morphology of prepared LT, PEG 4000, PMD and SDs (LT-FUD, LT-SED, and LT-MID) were determined by a SEM Zeiss EVO LS10 (Cambridge, UK).16 Each sample was sputter-coated using gold primarily and examined at an accelerating voltage of 1.6 kV.
4.7. FTIR Spectroscopic Analysis
The FTIR spectra of powdered samples of LT, PMD, and LT-SDs (LT-FUD, LT-SED, and LT-MID) were obtained using a spectrophotometer (Perkin Elmer, Marlborough, MA, USA) by the potassium bromide (KBr, 150 bar) pellet method.27 The sample equivalent to LT (5 mg) was mixed with about 100 mg of KBr using a clean glass pestle and mortar. The obtained mixtures were compressed in order to obtain the pellets. The samples were scanned in the scanning range of 450–4000 cm–1, with a resolution of 1 cm –1 using blank KBr. The results were interpreted by comparing the FTIR peaks of pure samples with those of prepared SDs.
4.8. NMR
To determine the nature of the proton or protonated group in LT, PEG 4000, LT-PMD, and LT-SDs (LT-FUD, LT-SED, and LT-MID), the 1H-NMR and 13C-NMR spectra in DMSO-d6 were recorded.20 The study was performed using a Bruker Avance NMR spectrometer using tetramethylsilane (TMS) as a standard. The chemical shift of LT-SD compared with the pure LT and PEG 4000 was determined to illustrate the mechanism of SD formation. This study was carried out to understand the mechanism of interaction of protons of LT with the PEG 4000. The samples were evaluated for one-dimensional 1H-NMR and 13C-NMR at 700 and 176 MHz, respectively. These spectra were taken using software topspin 3.2.
4.9. Dissolution Study
The in vitro dissolution study of pure LT, PMD, and SDs (LT-FUD, LT-SED, and LT-MID) was performed using a dissolution apparatus.37 The dissolution media was composed of 0.1 N HCl (900 mL) at 37 ± 0.5 °C with a stirring speed of 100 rpm. These studies were performed in 0.1 N HCl in order to simulate acidic gastric conditions and to maintain sink conditions throughout the dissolution test. All the formulations (containing 50 mg of LT) and pure LT (50 mg) were immersed in the dissolution media. The sample solution (5 mL) was withdrawn at a specific time interval (5, 10, 15, 30, 45, 60, and 90 min) and filtered with a 0.45 μm filter. Furthermore, the preheated fresh medium of an equal volume was added to maintain the same volume throughout the study. The concentration of LT in each withdrawn sample was determined using a UV spectrophotometer. The cumulative drug release rate was obtained by constructing the graphs between the amounts of drug release vs time. The release mechanism of LT-SD was investigated, and the data showed the best linear fit selected as the final release model.38 The data were fitted with different kinetic models to determine the release mechanism. The results obtained are the mean of three determinations. The f2 value was estimated using eq 1 in order to compare the resulting dissolution profiles:
| 1 |
where Rt and Tt are the percentages of the drug dissolved at time t for the reference and the test formulation, respectively. Each time point was weighted equally, and the dissolution profiles were considered as equal when the f2 was higher than 50. This means that the average difference between the two profiles at all time points is 10%.
4.10. Antioxidant Activity
The in vitro antioxidant activity of LT and LT-SDs (LT-FUD, LT-SED, and LT-MID) was measured using DPPH assay with slight modifications.31 The colorless solution of the sample will be converted into a violet color by the DPPH solution. The electron scavenging capability of antioxidants leads to a change in color. The control (LT) and LT-SD (LT-FUD, LT-SED, and LT-MID) were dissolved in DMSO to get a fixed concentration (5.0 mg/mL). Separately, the stock solution of DPPH was prepared in methanol (0.4 mg/mL). Then, the sample solution (1 mL) was taken and transferred to the DPPH solution (2 mL). The reaction mixture was mixed vigorously with shaking and incubated in the dark at room temperature for 30 min. The absorbance of the resulting solution was measured at 517 nm using a UV–vis spectrophotometer. The blank sample was prepared with a similar procedure without LT, and the antioxidant activity was determined using eq 2:
| 2 |
where AControl is the absorbance of the control, and ASample is the absorbance of the sample.
4.11. Statistical Analysis
Results are expressed as mean ± standard deviation (SD) from three replicates for each experiment, and the data were analyzed by using PCP Disso V3 software (Bharati Vidyapeeth Deemed University, Pune, Maharashtra, India). The analysis of variance (ANOVA) and Tukey’s test were used to compare the differences among various groups, and a value of p < 0.05 was considered to be statistically significant.
Acknowledgments
This research work was supported by Researchers Supporting Project (number RSP-2019/146) at King Saud University, Riyadh, Saudi Arabia.
Glossary
List of Abbreviations
- LT
luteolin
- SDs
solid dispersions
- PEGs
polyethylene glycols
- PEG 4000
polyethylene glycol 4000
- FU
fusion
- SE
solvent evaporation
- MI
microwave irradiation
- FUD
fusion dispersion
- SED
solvent evaporation dispersion
- MID
microwave irradiation dispersion
- DSC
differential scanning calorimetry
- XRD
X-ray diffraction
- SEM
scanning electron microscopy
- IR
infrared
- FTIR
Fourier transform infrared
- PMD
physical mixture dispersion
- NMR
nuclear magnetic resonance
- 1H-NMR
proton-nuclear magnetic resonance
- 13C-NMR
carbon-nuclear magnetic resonance
- DMSO-d6
deuterated dimethyl sulfoxide
- DPPH
2,2-diphenyl-1-picrylhydrazyl
- HPLC
high-performance liquid chromatography
- TMS
tetramethylsilane
- f2
similarity factor
The authors declare no competing financial interest.
References
- Wagle A.; Seong S. H.; Joung E. J.; Kim H. R.; Jung H. A.; Choi J. S. Discovery of a highly potent tyrosinase inhibitor, luteolin 5-O-β-d-glucopyranoside, isolated from Cirsium japonicum var. maackii (Maxim.) Matsum., Korean thistle: kinetics and computational molecular docking simulation. ACS Omega 2018, 3, 17236–17245. 10.1021/acsomega.8b02694. [DOI] [Google Scholar]
- Yang K.; Song Y.; Ge L.; Su J.; Wen Y.; Long Y. Measurement and correlation of the solubilities of luteolin and rutin in five imidazole-based ionic liquids. Fluid Phase Equilib. 2013, 344, 27–31. 10.1016/j.fluid.2013.01.026. [DOI] [Google Scholar]
- Rui L.; Xi L.; Jiang Y.; Guan-Hua D. Protective effects of luteolin against amyloid β25–35-induced toxicity on rat cerebral microvascular endothelial cells. Chinese J. Nat. Med. 2010, 8, 223–227. 10.3724/SP.J.1009.2010.00223. [DOI] [Google Scholar]
- Abidin L.; Mujeeb M.; Imam S. S.; Aqil M.; Khurana D. Enhanced transdermal delivery of luteolin via non-ionic surfactant-based vesicle: quality evaluation and anti-arthritic assessment. Drug Delivery 2016, 23, 1069–1074. 10.3109/10717544.2014.945130. [DOI] [PubMed] [Google Scholar]
- Qing W.; Wang Y.; Li H.; Ma F.; Zhu J.; Liu X. Preparation and characterization of copolymer micelles for the solubilization and in vitro release of luteolin and luteoloside. AAPS PharmSciTech 2017, 18, 2095–2101. 10.1208/s12249-016-0692-y. [DOI] [PubMed] [Google Scholar]
- Shakeel F.; Haq N.; Alshehri S.; Ibrahim M. A.; Elzayat E. M.; Altamimi M. A.; Mohsin K.; Alanazi F. K.; Alsarra I. A. Solubility, thermodynamic properties and solute-solvent molecular interactions of luteolin in various pure solvents. J. Mol. Liq. 2018, 255, 43–50. 10.1016/j.molliq.2018.01.155. [DOI] [Google Scholar]
- Peng B.; Yan W. Solubility of luteolin in ethanol + water mixed solvents at different temperatures. J. Chem. Eng. Data 2010, 55, 583–585. 10.1021/je900381r. [DOI] [Google Scholar]
- Kaushik R.; Budhwar V.; Kaushik D. An overview on recent patents and technologies on solid dispersion. Recent Pat. Drug Delivery Formulation 2020, 10.2174/1872211314666200117094406. [DOI] [PMC free article] [PubMed] [Google Scholar]
- Johnson L. M.; Hillmyer M. A. Critical excipient properties for the dissolution enhancement of phenytoin. ACS Omega 2019, 4, 19116–19127. 10.1021/acsomega.9b02383. [DOI] [PMC free article] [PubMed] [Google Scholar]
- Szabó E.; Démuth B.; Galata D. L.; Vass P.; Hirsch E.; Csontos I.; Marosi G.; Nagy Z. K. Continuous formulation approaches of amorphous solid dispersions: Singnificance of powder flow properties and feeding performance. Pharmaceutics 2019, 11, 654. 10.3390/pharmaceutics11120654. [DOI] [PMC free article] [PubMed] [Google Scholar]
- Wlodarski K.; Sawicki W.; Haber K.; Knapik J.; Wojnarowska Z.; Paluch M.; Lepek P.; Hawelek L.; Tajber L. Physicochemical properties of tadalafil solid dispersions–Impact of polymer on the apparent solubility and dissolution rate of tadalafil. Eur. J. Pharm. Biopharm. 2015, 94, 106–115. 10.1016/j.ejpb.2015.04.031. [DOI] [PubMed] [Google Scholar]
- Nagy Z. K.; Balogh A.; Démuth B.; Pataki H.; Vigh T.; Szabaó B.; Molnár K.; Schmidt B. T.; Horák P.; Marosi G.; Verreck G. .; Van Assche I.; Brewster M. E. High speed electrospinning for scaled-up production of amorphous solid dispersion of itraconazole. Int. J. Pharm. 2015, 480, 137–142. 10.1016/j.ijpharm.2015.01.025. [DOI] [PubMed] [Google Scholar]
- Sun M.; Wu C.; Fu Q.; Di D.; Kuang X.; Wang C.; He Z.; Wang J.; Sun J. Solvent-shift strategy to identify suitable polymers to inhibit humidity-induced solid-state crystallization of lacidipine amorphous solid dispersions. Int. J. Pharm. 2016, 503, 238–246. 10.1016/j.ijpharm.2016.01.062. [DOI] [PubMed] [Google Scholar]
- Leuner C.; Dressman J. Improving drug solubility for oral delivery using solid dispersions. Eur. J. Pharm. Biopharm. 2000, 50, 47–60. 10.1016/S0939-6411(00)00076-X. [DOI] [PubMed] [Google Scholar]
- Zawar L. R.; Bari S. B. Preparation, characterization and in vivo evaluation of antihyperglycemic activity of microwave generated repaglinide solid dispersion. Chem. Pharm. Bull. 2012, 60, 482–487. 10.1248/cpb.60.482. [DOI] [PubMed] [Google Scholar]
- Alshehri S. M.; Shakeel F.; Ibrahim M. A.; Elzayat E. M.; Altamimi M.; Mohsin K.; Almeanazel O. T.; Alkholief M.; Alshetaili A.; Alsulays B.; Alanazi F. K.; Alsarra I. A. Dissolution and bioavailability improvement of bioactive apigenin using solid dispersions prepared by different techniques. Saudi Pharm. J. 2019, 27, 264–273. 10.1016/j.jsps.2018.11.008. [DOI] [PMC free article] [PubMed] [Google Scholar]
- Luo Y.; Chen S.; Zhou J.; Chen J.; Tian L.; Gao W.; Zhang Y.; Ma A.; Li L.; Zhou Z. Luteolin cocrystals: Characterization, evaluation of solubility, oral bioavailability and theoretical calculation. J. Drug Delivery Sci. Technol. 2019, 50, 248–254. 10.1016/j.jddst.2019.02.004. [DOI] [Google Scholar]
- Zhang Z.; Li D.; Luo C.; Huang C.; Qiu R.; Deng Z.; Zhang H. Cocrystals of natural products: Improving the dissolution performance of flavonoids using betaine. Cryst. Growth Des. 2019, 19, 3851–3859. 10.1021/acs.cgd.9b00294. [DOI] [Google Scholar]
- Liu B.; Li W.; Zhao J.; Liu Y.; Zhu X.; Liang G. Physicochemical characterisation of the supramolecular structure of luteolin/cyclodextrin inclusion complex. Food Chem. 2013, 141, 900–906. 10.1016/j.foodchem.2013.03.097. [DOI] [PubMed] [Google Scholar]
- Alshehri S.; Imam S. S.; Altamimi M. A.; Jafar M.; Hassan M. b Z.; Hussain A.; Ahad A.; Mahdi W. Host-guest complex of β-cyclodextrin and pluronic F127 with luteolin: Physicochemical characterization, anti-oxidant activity and molecular modeling studies. J. Drug Delivery. Sci. Technol. 2020, 55, 101356. 10.1016/j.jddst.2019.101356. [DOI] [Google Scholar]
- Khan J.; Saraf S.; Saraf S. Preparation and evaluation of luteolin-phospholopid complex as an effective drug delivery tool against Ga1N/LPS induced liver damage. Pharm. Dev. Technol. 2016, 21, 475–486. 10.3109/10837450.2015.1022786. [DOI] [PubMed] [Google Scholar]
- Dang H.; Meng M. H. W.; Zhao H.; Iqbal J.; Dai R.; Deng Y.; Lv F. Luteolin-loaded solid lipid nanoparticles synthesis, characterization, & improvement of bioavailability, pharmacokinetics in vitro and in vivo studies. J. Nanopart. Res. 2014, 16, 2347. 10.1007/s11051-014-2347-9. [DOI] [Google Scholar]
- Alshehri S.; Shakeel F.; Ibrahim M.; Elzayat E.; Altamimi M.; Shazly G.; Mohsin K.; Alkholief M.; Alsulays B.; Alshahrani A.; Almalki B.; Alanazi F. Influence of the microwave technology on solid dispersions of mefenamic acid and flufenamic acid. PLoS One 2017, 12, E0182011. 10.1371/journal.pone.0182011. [DOI] [PMC free article] [PubMed] [Google Scholar]
- Bikiaris D. N. Solid dispersions, part I: recent evolutions and future opportunities in manufacturing methods for dissolution rate enhancement of poorly water-soluble drugs. Expert Opin. Drug Delivery 2011, 8, 1501–1519. 10.1517/17425247.2011.618181. [DOI] [PubMed] [Google Scholar]
- Bikiaris D. N. Solid dispersions, part II: new strategies in manufacturing methods for dissolution rate enhancement of poorly water-soluble drugs. Expert Opin. Drug Delivery 2011, 8, 1663–1680. 10.1517/17425247.2011.618182. [DOI] [PubMed] [Google Scholar]
- Pandya P.; Pandey N.; Singh S.; Kumar M. Formulation and characterization of ternary complex of poorly soluble duloxetine hydrochloride. J. Appl. Pharm. Sci. 2015, 5, 088–096. 10.7324/JAPS.2015.50615. [DOI] [Google Scholar]
- Huang J.; Wigent R. J.; Schwartz J. B. Drug–polymer interaction and its significance on the physical stability of nifedipine amorphous dispersion in microparticles of an ammonio methacrylate copolymer and ethylcellulose binary blend. J. Pharm. Sci. 2008, 97, 251–262. 10.1002/jps.21072. [DOI] [PubMed] [Google Scholar]
- Shazly G. A.; Ibrahim M. A.; Badran M. M.; Zoheir K. M. A. Utilizing Pluronic F-127 and Gelucire 50/13 solid dispersions for enhanced skin delivery of flufenamic acid. Drug Dev. Res. 2012, 73, 299–307. 10.1002/ddr.21013. [DOI] [Google Scholar]
- Moneghini M.; Bellich B.; Baxa P.; Princivalle F. Microwave generated solid dispersions containing ibuprofen. Int. J. Pharm. 2008, 361, 125–130. 10.1016/j.ijpharm.2008.05.026. [DOI] [PubMed] [Google Scholar]
- Ghafoor K.; Choi Y. H.; Jeon J. Y.; Jo I. H. Optimization of ultrasound-assisted extraction of phenolic compounds, antioxidants, and anthocyanins from grape (Vitis vinifera) seeds. J. Agric. Food Chem. 2009, 57, 4988–4994. 10.1021/jf9001439. [DOI] [PubMed] [Google Scholar]
- Dong H.; Yang X.; He J.; Cai S.; Xiao K.; Zhu L. Enhanced antioxidant activity, antibacterial activity and hypoglycemic effect of luteolin by complexation with manganese (II) and its inhibition kinetics on xanthine oxidase. RSC Adv. 2017, 7, 53385–53395. 10.1039/C7RA11036G. [DOI] [Google Scholar]
- Zawar L. R.; Bari S. B. Microwave induced solid dispersion as a novel technique for enhancing dissolution rate of repaglinide. Adv. Pharmacol. Pharm. 2013, 1, 95–101. 10.13189/app.2013.010208. [DOI] [Google Scholar]
- Wang L.; Wu W.; Wang L.; Wang L.; Zhao X. Highly water-soluble solid dispersions of honokiol: Preparation, solubility, and bioavailability studies and anti-tumor activity evaluation. Pharmaceutics 2019, 11, 573. 10.3390/pharmaceutics11110573. [DOI] [PMC free article] [PubMed] [Google Scholar]
- Školáková T.; Slámová M.; Školáková A.; Kadeřábková A.; Patera J.; Zámostný P. Investigation of dissolution mechanism and release kinetics of poorly water-soluble tadalafil from amorphous solid dispersions prepared by various methods. Pharmaceutics 2019, 11, 383. 10.3390/pharmaceutics11080383. [DOI] [PMC free article] [PubMed] [Google Scholar]
- Arora S. C.; Sharma P. K.; Irchhaiya R.; Khatkar A.; Singh N.; Gagoria J. Development, characterization and solubility study of solid dispersions of cefuroxime axetil by solvent evaporation method. J. Adv. Pharm. Technol. Res. 2010, 1, 326–329. 10.4103/0110-5558.72427. [DOI] [PMC free article] [PubMed] [Google Scholar]
- Yousaf A.; Zulfiqar S.; Shahzad Y.; Hussain T.; Mahmood T.; Jamshaid M. The preparation and physicochemical characterization of eprosartan mesylate-laden polymeric ternary solid dispersions for enhanced solubility and dissolution rate of the drug. Polym. Med. 2018, 48, 69–75. 10.17219/pim/102976. [DOI] [PubMed] [Google Scholar]
- Truong D. H.; Tran T. H.; Ramasamy T.; Choi J. Y.; Choi H. G.; Yong C. S.; Kim J. O. Preparation and characterization of solid dispersion using a novel amphiphilic copolymer to enhance dissolution and oral bioavailability of sorafenib. Powder Technol. 2015, 283, 260–265. 10.1016/j.powtec.2015.04.044. [DOI] [Google Scholar]
- Costa P.; Lobo J. M. S. Modeling and comparison of dissolution profiles. Eur. J. Pharm. Sci. 2001, 13, 123–133. 10.1016/S0928-0987(01)00095-1. [DOI] [PubMed] [Google Scholar]


