

Abstract
GSK983, a novel tetrahydrocarbazole, inhibits the replication of a variety of unrelated viruses in vitro with EC50 values of 5–20 nM. Both replication of the adenovirus Ad-5 and the polyoma virus SV-40, and episomal maintenance of human papillomaviruses (HPV) and Epstein-Barr virus (EBV) are susceptible to GSK983. The compound does not inhibit all viruses; herpes simplex virus (HSV-1), human immunodeficiency virus (HIV), and lytic replication of EBV were not susceptible at concentrations below 1 μM. GSK983 does inhibit the growth of cell lines immortalized by HTLV-1, EBV, HPV, SV40 and Ad-5, with EC50 values in the range of 10–40 nM. Depending on the cell line, the compound induces either apoptosis or cytostasis at concentrations over 20 nM. GSK983 also inhibits cell lines immortalized by non-viral mechanisms, but has little effect on primary cells. The CC50 values for keratinocytes, fibroblasts, lymphocytes, endothelial, and bone marrow progenitor cells are all above 10 μM. The pattern of inhibition, which includes diverse viruses as well as growth of immortalized cells of varied origins, suggests the target is a host cell protein, rather than a viral protein. Preliminary mechanism studies indicate that GSK983 acts by inducing a subset of interferon-stimulated genes.
Keywords: Novel antiviral, GSK983, Tetrahydrocarbazole, Interferon-stimulated genes
1. Introduction
Tremendous progress has been made in treating viral infections over recent decades. Success stories include acyclovir and its prodrug for herpes simplex virus (HSV), two neuraminidase inhibitors for influenza, five antiviral drugs for hepatitis B (HBV), and almost two-dozen human immunodeficiency virus (HIV) drugs. Despite these significant advances, however, many common viral infections still do not have safe and effective treatments. For example, there are no antiviral drugs for either the Dengue virus, which causes 50–100 million cases of Dengue fever a year (Morens and Fauci, 2008), or the oncogenic human papillomaviruses, which cause cervical cancer and have a prevalence of 26.8% in U.S. women (Dunne et al., 2007).
Most of the success stories in the discovery and development of new antiviral drugs have been achieved by focusing on viral targets. The drawback to this approach is that, unless viruses are closely related, separate drug discovery and development efforts are required for each virus. In some cases, multiple inhibitors are needed in combination to combat the rapid development of resistance. This is clearly the case with HIV, and it is expected to be the case with hepatitis C (HCV) (Grunberger et al., 2008). Inhibiting pathogen targets still has great value and will clearly continue to yield beneficial new drugs, but use of host targets in antiviral therapy is growing. For example, one of the newest classes of HIV inhibitors, the CCR5 antagonists, targets the cell surface receptors and blocks entry of the virus (Schlect et al., 2008).
The allure of host targets is the potential to identify and develop broad-spectrum antiviral agents. This is particularly attractive for emerging infections, such as the 2002–2003 SARS coronavirus outbreak. In such cases, a broad-spectrum agent could allow for effective treatment without the lead time necessary to develop a virus-specific therapy. A broad-spectrum inhibitor would also be welcome in the treatment of niche indications, such as progressive multifocal leukoencephalopathy (PML) caused by uncontrolled JC virus infection in the central nervous system of immune-compromised patients. In such cases, medical need is acute, but the patient population is not large enough to provide an economic incentive for development of a virus-specific drug.
Currently, many health care providers use interferons or ribavirin off-label to treat serious viral infections with no approved therapy. These drugs provide benefit in some cases, but the efficacy is typically quite modest, and there are numerous side effects, many of which are serious, associated with use of these drugs (Leyssen et al., 2008, Borden et al., 2007). For details of the adverse events associated with interferon and ribavirin use, see http://www.fda.gov/cder/foi/label/2007/103964s5120lbl.pdf and http://www.fda.gov/cder/foi/label/2007/021511s014lbl.pdf.
This manuscript describes a novel antiviral compound, the tetrahydrocarbazole GSK983. It has a unique profile, with initial data that suggest broad-spectrum antiviral activity via a host target. This manuscript describes the antiviral data in a number of in vitro viral replication systems, and it discusses the implications of preliminary mechanism of action studies.
2. Materials and methods
2.1. Compounds
N-[(1R)-6-Chloro-2,3,4,9-tetrahydro-1H-carbazol-1-yl]-2-pyridinecarboxamide (GSK983, Fig. 1 ) and its enantiomer GSK984 were synthesized by GlaxoSmithKline, Research Triangle Park, NC (Boggs et al., 2007). The molecular weight of GSK983 is 326. Stock solutions and serial dilutions were prepared in dimethyl sulfoxide (DMSO). In all experiments equal volumes of the serial dilutions were added to growth medium so that all final solutions, including the untreated controls, contained the same concentration of DMSO of ≤1% (v/v).
Fig. 1.
Structure of GSK983.
2.2. Cells and cell lines
The details of the cells and cell lines used in this study and the growth media used for their culture can be found in Supplementary Materials. All are of human origin except for the Vero cell line. Some cell types were prepared in the laboratory as described below.
Peripheral blood mononuclear cells (PBMCs) were prepared from buffy coats as previously described (Ferris et al., 2005).
B cells and CD4 T cells were prepared from human blood obtained with informed consent by negative selection using the StemCell Technologies RosetteSep technique, according to the manufacturer's protocols. Purity of the preparations was 90–95% for B cells and 97% for CD4 cells. B cells were activated by addition of 1 μg/ml soluble CD40 ligand (R&D Systems #617-CL), interleukin-4, 20 ng/ml (R&D Systems #204-IL), and 1 nM phorbol 12-myristate 13-acetate (PMA; Sigma #P-1585). PBMCs and CD4s were activated with phytohemagglutinin and IL2 as previously described (Ferris et al., 2005). In all cases, the cells doubled 3–4 times within 96 h after stimulation.
B-LCL 5/2/1 is a mixed population of B lymphoblastoid cells prepared by infection of PBMCs with the B95.8 strain of EBV as described by Frisan et al. (2001).
W12 medium (Stanley et al., 1989), DMEM, MEM and RPMI 1640 growth media were obtained from Invitrogen (Carlsbad, CA). Eagle MEM was obtained from ATCC. KGM and EGM MV media were obtained from Cambrex (East Rutherford, NJ). Unless otherwise specified, each medium contained 10% (v/v) of fetal bovine serum and either gentamicin (10 μg/ml) or penicillin (100 IU/ml) plus streptomycin (100 μg/ml). All cultures were grown at 37 °C in an atmosphere containing 5% CO2.
Bone marrow toxicity assays were run by Cambrex Bio Science Walkersville, Inc. (East Rutherford, NJ) using the methods described by Eaves (1995).
2.3. Measurement of cell growth and viability
Most measurements employed the MTS assay (Barltrop et al., 1991, Cory et al., 1991) in which the reduction by cells of 3-(4,5-dimethylthythiazol-2-yl)-5-(3-carboxymethoxyphenyl)-2-(4-sulfophenyl)-2H-tetrazolium, inner salt (MTS) is measured. CellTiter 96 Aqueous MTS reagent Powder was purchased from Promega and phenazine methosulfate was purchased from Sigma. The suggested protocol from Promega was followed. After a 2 h incubation of cells and reagent at 37 °C and 5% CO2, the absorbance was read at 490 nm (A 490) using a Wallac Victor 1420 Multilabel plate reader. It has been shown that the net A 490 is proportional to the number (and thus the mass) of viable cells (Cory et al., 1991). We have verified this for W12-20850 cells (data not shown).
In some experiments, sensitivity and dynamic range were increased by carrying out kinetic measurements of A 490 for 2 h after addition of reagent using a Tecan Spectrafluor Plus plate reader with the plate maintained at 35 °C. A 490 per hour was then calculated by linear regression of the linear portion of the curve. In other experiments, cell growth and viability were estimated from cellular ATP measurements using the CellTiter-Glo Luminescent Cell Viability Assay (CTG, Promega) according to the manufacturer's protocol. Luminescence was measured using a Wallac 1420 Victor plate reader.
2.4. Adenovirus assay
HFF cells were plated in 96 well plates at 2.5 × 10⁴ cells/well. Sixteen hours after plating, the cells were infected with adenovirus type 5 (ATCC VR-1516) at an MOI of 3 for 2 h. Virus was removed from the cells and 200 μl of fresh medium containing compounds at concentrations ranging from 100 to 0.003 μM were added to each well. After further incubation for 3 days, cell culture fluid was removed and cells rinsed with PBS twice. Intracellular adenovirus DNA from HFFs was quantified by qPCR as described below.
2.5. SV40 assay
Vero cells were plated in 96 well plates at 2 × 10⁴ cells/well. Cells were allowed to adhere to the wells for 4 h and then were infected with SV40 strain Pa-57 (ATCC VR-239) at an MOI of 0.1 for 2 h. Supernatant was removed from the cells and diluted compounds ranging from 100 to 0.003 μM were added. After incubation for 3 days, cells were assayed for growth by MTS and for SV40 DNA by qPCR as described below.
2.6. Hybrid capture assay for HPV16 DNA
W12-20850 cells were seeded at 7.5 × 10³ cells/well into a 96 well plate-containing compound at concentrations ranging from 100 to 0.001 μM. Plates were incubated at 37 °C in the presence of 5% CO2 for 4 days. Cells were lysed in 0.2N NaOH, 1% Igepal, and episomal HPV-16 DNA was quantified using a non-radioactive hybrid capture technique with HPV-16 specific capture and detection probes. Hybridization plates (Nunc Maxisorb 96 well Cat #450320) were coated with a mixture of capture probe and ReactiBind solution (Pierce #17250) for at least 4 h and then washed with 0.2× SSC, 0.05% Tween20 (SSC/T) prior to blocking with 150 μl/well of 0.2N NaOH, 1% Igepal, 10 mg/ml herring sperm DNA for 6–8 h. The hybridization was carried out by mixing 27 μl of lysed cells with 45 μl of denatured detection probe in 6 M guanidine isothiocyanate. To prevent evaporation, 50 μl of mineral oil was added to each well. The plate was then heated to 90 °C for 6.5 min, and the hybridization continued at 42 °C overnight. Assay plates were washed 6 times with SSC/T. Anti-digoxigenin HRP-conjugated antibody (Boehringer Mannheim 1207733, 1:5000) was incubated in the wells for 30 min at room temperature and washed with PBS/0.05% Tween-20. SuperSignal LBA substrate (Pierce Cat #37070) was added and chemiluminescence was measured using a Wallac 1420 Victor plate reader.
2.7. DNA measurement by quantitative PCR (qPCR)
Cells were grown in 96-well plate format, and medium was removed by aspiration. The cells were washed with buffered saline and then lysed by addition of 100 μl of a solution containing 10 mM Tris–HCl (pH 8.3), 50 mM KCl, 2.5 mM MgCl, 0.45% (w/v) NP-40, 0.45% (w/v) Tween 20, proteinase K, 0.5 mg/ml. After incubation at 55 °C for 2 h, the proteinase K was inactivated by heating the plate at 98 °C for 20 min. DNA was quantified from 5 μl aliquots of these samples using the Invitrogen quantitative PCR kit (Cat #11730-017) in an ABI 7900 HT system. After 50 °C for 2 min and 95 °C for 2 min, 40 cycles were run at 95 °C for 15 s and 55 °C (60 °C for actin) for 1 min. The primers and probes used were synthesized by Mega Base Inc. (Evanston, IL) and are listed in Supplementary Materials; final concentration of each in the qPCR reaction mixtures was 150 nM.
2.8. mRNA measurement by qPCR
W12 cells were grown in 75 cm2 flasks; the medium was aspirated, and the cells were washed with chilled PBS. The cells were lysed, and total RNA was extracted from the lysate using the Qiagen RNeasy mini kit following the manufacturer's protocol. An aliquot of total RNA was profiled on an Agilent bioanalyzer to assess RNA quality. Levels of mRNA from selected genes (see Supplementary Materials) were measured in quadruplicate by RT-qPCR. Briefly, total RNA samples were treated with DNA-free™ deoxyribonuclease I (Ambion, USA) to remove genomic DNA. The efficiency of the DNase procedure was validated in a standard TaqMan assay using a GAPDH probe and primer set in a standard PCR reaction. DNA-free total RNA samples were quantified using RiboGreen RNA quantitation reagent (Molecular Probes). First strand cDNA synthesis was carried out using High Capacity cDNA Archive Kit (Applied Biosystems, Foster City, CA). Gene specific primers were designed using Primer Express software (Applied Biosystem, Foster City, CA), confirmed by BLAST search using public and propriety sequence databases and experimentally validated. Final concentrations of forward and reverse primers for each assay were 900 nM. The final concentration of each fluorogenic probe was 100 nM (see Supplementary Materials for the primer/probe sequences). Quantitative PCR was carried out using a 7900HT Sequence Detector System (Applied Biosystems) in a 10 μl reaction volume. Universal PCR Master Mix 2X (Applied Biosystems) and universal PCR conditions recommended by the vendor (Applied Biosystems) were used.
The expression levels of each gene were calculated as mean cycle threshold values (Ct) and normalized to the level of GADPH mRNA expression. Changes in expression levels due to treatment were first calculated as dCt = (Ct (control) − Ct (treated)). Statistical significance of the dCt values was calculated using the two-sided t-test. Fold increases for significant changes (p ≤ 0.05) were then calculated as F = 2dCt.
2.9. Apoptosis assay
Apoptosis was estimated by measurement of cytoplasmic histone-associated DNA fragments, using the Cell Death Detection ELISA kit from Boehringer Mannheim according to the manufacturer's instructions. Sensitivity and dynamic range of the assay were increased by carrying out kinetic measurements of absorbance at 405 nm (A 405) in a Tecan Spectrofluor Plus plate-reader at 30 °C. A 405 per hour was then calculated by linear regression of the linear portion of the curve. Fas-activating antibody (Upstate Biotechnology 05-201) was used as a positive control.
2.10. Luciferase assay
Cells were grown in 96-well plates in 0.1 ml of medium per well. At the indicated times, 0.1 ml of Steady-Glo Luciferase reagent (Promega) was added to each well. Luminescence was measured 15 min after addition using a Wallac 1420 Victor plate reader.
2.11. Analysis of dose–response curves
Inhibition dose–response curves were analyzed by fitting to a modified form of the Hill equation (Hill, 1910).
| (1) |
in which %ctrl is the percent of the control response at concentration x of inhibitor, I max the asymptotic maximum level of inhibition observed as x increases, K the median effect concentration of inhibitor, the concentration at which %ctrl = 100 − I max/2, and N is the Hill coefficient.
If the maximum level of inhibition is 100%, Eq. (1) reduces to Eq. (2), the more familiar form of the Hill equation:
| (2) |
In Eq. (2), K is the inhibitor concentration giving %ctrl = 50. In this case, K is equal to the EC50 or CC50.
Values of K and I max and their standard errors were calculated by fitting inhibition data to Eqs. (1), (2) using a non-linear regression program based on the modified Marquardt–Levenberg algorithm (Mager, 1972). The values reported below are the means and standard error (S.E.) of at least two independent measurements. If fitting the data to Eq. (1) gave a value of I max significantly less than 100%, the inhibition parameters are reported as K, the median effect concentration, and I max. For such data, use of the terms EC50 or CC50 is not appropriate, as illustrated by examples in which the dose–response curves have I max equal to or less than 50% (see Table 1, Table 4, Table 5). If the value of I max is close to 100%, or if there was no clear asymptotic level of inhibition at the highest concentrations tested, the inhibition parameters are reported as EC50 or CC50.
Table 1.
Inhibition by GSK983 of adenovirus-5 replication in HFF cells and SV40 replication in Vero cells.
Table 4.
Effects of GSK983 on growth of cell lines immortalized by integrated viral genomes.
| Cell line | Virus | Measurement | K (nM) ± S.E. | Imax, % ± S.E. |
|---|---|---|---|---|
| HEK293 | Adenovirus 5 | Growth, CTG | 12 ± 2 | 52 ± 2 |
| WI38 VA13 | SV40 | Growth, CTG | 16 ± 5 | 28 ± 2 |
| Namalwa | EBV | Growth, MTS | 10 ± 2 | 66 ± 2.5 |
| W12 20861 | HPV16 | Growth, MTS | 25 ± 9 | 35 ± 2.8 |
| SiHa | HPV16 | Growth, MTS | 37 ± 6 | 39 ± 1.6 |
| Caski | HPV16 | Growth, MTS | 32 ± 6 | 33 ± 1.5 |
| HeLa | HPV 18 | Growth, MTS | 20 ± 2 | 50 ± 0.8 |
Table 5.
Effects of GSK983 on growth of cell lines immortalized by non-viral transformation events.
| Name | Cell type | # of titrations | K (nM) ± S.E. | Imax, % ± S.E. |
|---|---|---|---|---|
| Veroa | Kidney epithelial | 4 | 20 ± 5 | 43 ± 1 |
| Huh7 | Liver epithelial | 3 | 41 ± 10 | 26 ± 1 |
| Jurkat | T lymphoblast | 4 | 52 ± 3 | 51 ± 1 |
| Molt4 | T lymphoblast | 4 | 13 ± 1.3 | 85 ± 2 |
| U937 | Monocyte | 4 | 26 ± 4 | 55 ± 2 |
| BJAB | B lymphoblast | 2 | 9 ± 0.6 | 84 ± 1.5 |
Cells were grown using the media indicated in Supplementary Materials. Cells were plated in 96-well plates with medium containing serial dilutions of GSK983 with a concentration range of 1 nM to 10 μM. Measurement of cell growth was determined by MTS after 72 h of incubation at 37 °C. Values of K and Imax were calculated by fitting data to Eq. (1).
Vero cell line derived from African Green monkey. All other cell lines are of human origin.
3. Results
3.1. Effects of GSK983 on productive virus replication
3.1.1. Adenovirus
GSK983 (Fig. 1) inhibits replication of adenovirus-5 (Ad-5) in primary human fibroblasts (HFF) (Fig. 2 and Table 1 ) with a median effect concentration (K) of 21 nM and maximum inhibition (I max) of 99%. In this case, the I max value is almost 100%, so the K and EC50 values are equivalent. Growth of the uninfected HFF, as measured by MTS, was not inhibited at concentrations of GSK983 below one micromolar. The CC50 was 35,500 nM in this experiment, and it averaged 55,000 nM over a number of different experiments (Table 1, Table 6). The selectivity index between inhibition of adenovirus replication and cytotoxicity in HFF is thus greater than 2000-fold (Table 1). The observed antiviral activity of GSK983 is stereospecific. In contrast to the potent inhibition by GSK983, its enantiomer GSK984 did not affect adenovirus replication at concentrations below one micromolar (EC50 > 10 μM, data not shown).
Fig. 2.
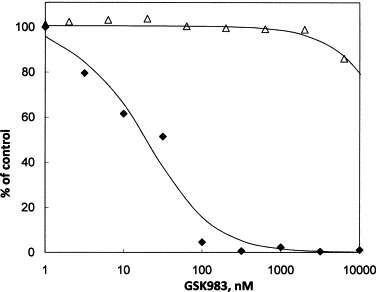
Inhibition of adenovirus-5 replication and growth of HFF cells by GSK983. Cells were infected at an MOI of 3, for 2 h. Virus was removed and fresh medium containing the indicated concentrations of compound was added to each well. Adenovirus-5 DNA measurements were made by qPCR from cells 72 h after addition of compound. Measurement of cell growth in presence of compound was determined in parallel by MTS. (♦) Adenovirus-5 DNA; (▵) uninfected HFF cells by MTS.
Table 6.
Effects of GSK983 on growth of other primary human cells.
| Cell name | Cell type | # of titrations | CC50 (nM) ± S.E. |
|---|---|---|---|
| HFF | Fibroblast | 26 | 55,000 ± 1,300 |
| PBMC-resting | Lymphocyte | 4 | 520,000 ± 220,000 |
| PBMC-activated | Lymphocyte | 4 | 224,000 ± 68,000 |
| B cells-resting | Lymphocyte | 6 | >10,000 |
| CD4 T cells-resting | Lymphocyte | 3 | 60,000 ± 13,000 |
| WI38 | Fibroblast | 2 | 90,000 ± 2,500 |
| HUVEC | Endothelial | 2 | >10,000 |
| Erythroid | Bone marrow progenitor cells | 3 | >10,000 |
| Granulocyte/macrophage | Bone marrow progenitor cells | 3 | 160,000 ± 88,000 |
Erythroid and granulocyte/macrophage toxicity assays were run by Cambrex Bio Science Walkersville, Inc. using the methods described by Eaves (1995). The other cell types were grown using the media indicated in Supplementary Materials. Cells were plated in 96-well plates with medium containing serial dilutions of GSK983 with a concentration range of 3 nM to 100 μM. Measurement of cell growth was determined by CTG (HFF, B and CD4 T cells) or MTS (HFF, PBMC, WI38, HUVEC) after 72 h of incubation at 37 °C. CC50 values were calculated by fitting data to Eq. (2).
3.1.2. Simian virus 40
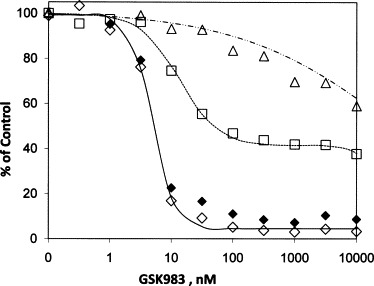
GSK983 also inhibits replication of the polyoma virus SV40 in Vero cells (Fig. 3 and Table 1). The median effect concentration (K) was 7.5 nM and the maximum inhibition (I max) was 88%. In this case interpretation of the data is complicated by the fact that growth of the host Vero cells is also inhibited with a similar median effect concentration (K) of 12 nM. The maximum inhibition of cell growth (I max), however, was only 37%, which is significantly lower than that for viral replication. The difference in I max values between the antiviral and growth effects suggests that GSK983 has an antiviral effect distinct from the effect on cell growth. To address this issue, we calculated the ratio of SV40 DNA to MTS activity of the infected Vero cells. This ratio is proportional to viral DNA per cell and as seen in Fig. 3, falls with increasing GSK983 concentration. The median effect concentration (K) for reduction of the ratio is 12 ± 2 nM, and the maximum inhibition (I max) is 79 ± 2%. This result suggests that GSK983 does reduce SV40 replication, but because of the different forms of the dose–response curves for inhibition of the viral yield and inhibition of growth of the host Vero cells we are unable to calculate a selectivity index. There was no system available to study SV40 infection of primary cells, limiting our ability to calculate a true selectivity index.
Fig. 3.
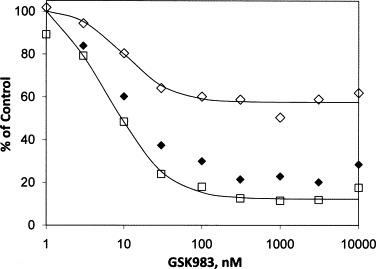
Inhibition of SV40 virus replication and growth of Vero cells by GSK983. Cells were infected at an MOI of 0.1, for 2 h. Virus was removed and fresh medium containing the indicated concentrations of compound was added to each well. SV40 DNA measurements were made by qPCR from cells 72 h after addition of compound. Measurement of cell growth in presence of compound was determined in parallel by MTS. (□) SV40 DNA; (♢) uninfected Vero cells, MTS; (♦) ratio, SV40 DNA/Vero MTS, plotted as % of ratio in the untreated control.
We show below that GSK983 inhibits the growth of a number of cell lines which are immortalized either by viral infection or, as in the case of Vero cells, non-viral events.
3.1.3. Viruses whose productive replication is not inhibited by GSK983
The effects of GSK983 on HSV-1 infection in Vero cells and HIV-1 infection in PBMCs were also studied over a concentration range of 1 nM to 100 μM. In contrast to the above results, comparatively weak inhibition was seen with 50% inhibition in the micromolar range. Similarly, GSK983 did not inhibit lytic replication of EBV induced by sodium butyrate and PMA in P3HR1 cells. No significant inhibition occurred below 10 μM (data not shown).
3.2. Effects of GSK983 on the growth of cell lines immortalized by viral infection
3.2.1. Epstein-Barr virus and HTLV1
IM9 is a lymphoblastoid B cell line immortalized by episomal Epstein-Barr virus, and MT4 is a CD4 T cell line transformed by integrated human T-cell leukemia virus 1. GSK983 is a potent inhibitor of growth of both cell lines (Fig. 4 and Table 2 ) with median effect concentrations of 16 and 8 nM, respectively. The maximum inhibition achieved by GSK983 is greater than 95% of the control for both cell lines, and this level is reached below 100 nM. In addition to the curve shown, viral yield was measured in the IM9 cells by quantitative PCR and was found to decrease in parallel with inhibition of cell growth (data not shown). GSK983 was also found to inhibit the newly prepared mixed B-LCL line 5/2/1 (Table 2) with a dose response identical to that for IM9.
Fig. 4.
Effects of GSK983 on growth of cell lines immortalized by episomal EBV or integrated HTLV-1 and on the growth of corresponding uninfected primary cells. Cells were plated in 96-well plates with medium containing the indicated concentrations of compound. Measurement of cell growth was determined by CTG after 72 h of incubation with the compound. Cell line labels are followed by the viruses they contain in parentheses. (♢) IM9 (EBV); (♦) MT-4 (HTLV-1); (□) activated primary B cells; (△) activated primary CD4 T cells; (■) activated PBMCs.
Table 2.
Effects of GSK983 on growth of cell lines immortalized by episomal EBV or integrated HTLV1.
| Cell line (virus) | Cell line growth |
Host primary cell | Host primary cell growth |
Selectivity index |
|
|---|---|---|---|---|---|
| K (nM)a ± S.E. | Imax, % ± S.E. | CC50 (nM) ± S.E. | Value ± S.E. | ||
| IM9 (EBV) | 16 ± 2 | 97 ± 1 | Activated B cell | >10,000 | >620 ± 80 |
| B-LCL 5/2/1 (EBV) | 14 ± 0.3 | 93 ± 1 | Activated B cell | >10,000 | >700 ± 15 |
| MT4 (HTLV1) | 7.5 ± 0.6 | 98 ± 2 | Activated CD4 T cell | 57,000 ± 6,100 | 7600 ± 1000 |
Calculations from the data in Fig. 4.
Since the values of Imax are close to 100%, K ∼ EC50.
The enantiomer GSK984 was relatively inactive, with EC50 values of 13,000 ± 2000 nM for IM9 and 35,000 ± 2000 nM for MT4 cells (data not shown).
The effects of GSK983 on the primary cell types from which the infected cell lines were originally derived were also measured (Fig. 4 and Table 2). No inhibition of activated B and CD4 T cells was seen in the nanomolar range, and the CC50 values were in each case greater than 10 μM. The selectivity index calculated for inhibition of the EBV-immortalized lines versus activated B cells was thus >600, and it was 7600 for inhibition of the HTLV1-immortalized MT4 line versus activated CD4 T cells (Table 2).
3.2.2. Human papillomaviruses
W12-20850 (W12) is a cell line created by immortalization of human keratinocytes by episomal HPV-16. GSK983 is a potent inhibitor of HPV DNA levels in growing W12 cells. The median effect concentration determined using the hybrid capture assay is 5 nM, the maximum inhibition (I max) of HPV levels by GSK983 is greater than 95% of the control, and the I max value is reached at concentrations below 100 nM (Fig. 5 and Table 3 ). As in the case of the Vero cells above, however, GSK983 has effects on the growth of the W12 cells. The K values for the compound's effects on viral DNA and growth are similar, but there is a difference in the I max values (Table 3). In the case of W12 growth inhibition, I max does not approach 100%, but rather is asymptotic at 60% of control. When the ratio of HPV DNA to MTS activity is calculated, the resulting dose–response curve is not significantly different from that for inhibition of total HPV DNA (Fig. 5 and Table 3). Since this ratio is proportional to viral DNA copy number per cell, it suggests GSK983 reduces HPV viral copy number independent of the effect on the W12 cells’ functioning. The reduction in copy number was confirmed by measurement of HPV and cellular actin DNA by quantitative PCR (Table 3). Similar values of K were observed, and the I max values were only slightly lower. Calculation of gene numbers from these data showed that at 100 nM GSK983, the copy number, expressed as HPV genomes per actin gene, was reduced from 460 to 150.
Fig. 5.
Effects of GSK983 on HPV DNA in W12 cells and cell growth in W12 and human keratinocyte cells (HKC). Cells were plated in 96-well plates with medium containing the indicated concentrations of compound for 4 days. Measurement of W12 cell growth was determined by MTS followed by HPV16 DNA determination from the same cells by hybrid capture. Measurement of HKC cell growth in presence of compound was determined in parallel by MTS. (♢) W12 HPV DNA; (□) growth of W12 by MTS; (♦) W12, ratio HPV DNA/MTS, plotted as % of ratio in the untreated control; (△) growth of HKC by MTS.
Table 3.
Effects of GSK983 on growth of cell lines immortalized by episomal human papillomavirus.
| Cell | HPV type | Host primary cell | Measurement | K (nM) ± S.E. | Imax, % ± S.E. | Selectivity index ± S.E. |
|---|---|---|---|---|---|---|
| W12-20850a | 16 | HKC | DNA, hybrid capture | 4.5 ± 0.3 | 96 ± 1 | 8,900 ± 2,700 |
| W12-20850a | 16 | HKC | Growth, MTS | 11 ± 2 | 60 ± 7 | |
| W12-20850a | 16 | HKC | Ratio, HPV DNA/MTS | 4.9 ± 0.5 | 90 ± 2 | |
| W12-20850 | 16 | HKC | HPV DNA, qPCR | 3.3 ± 0.5 | 85 ± 2 | 12,000 ± 4,000 |
| W12-20850 | 16 | HKC | Growth, Actin DNA, qPCR | 6 ± 0.4 | 60 ± 1 | |
| CIN612 | 31 | HKC | HPV DNA, qPCR | 2.4 ± 0.1 | 86 ± 1 | 16,600 ± 5,000 |
| CIN612 | 31 | HKC | Growth, MTS | 2.8 ± 0.1 | 70 ± 1 | |
| HKC/HPV16 | 16 | HKC | HPV DNA, qPCR | 2.2 ± 0.2 | 89 ± 2 | 18,000 ± 5,600 |
| HKC/HPV16 | 16 | HKC | Growth, MTS | 3.0 ± 0.4 | 59 ± 1 | |
| Human keratinocyte (HKC)a | None | N/A | Growth, MTS | 40,000 ± 11,800 | ∼100 |
The enantiomer GSK984 was again relatively inactive, with EC50 values of 6900 ± 680 nM for reduction of HPV DNA and 17000 ± 3600 nM for inhibition of growth of W12 cells (data not shown).
GSK983 had little impact on the growth of uninfected human keratinocytes. The CC50 for GSK983 in these primary cells was approximately 40 μM (Fig. 5 and Table 3), giving a selectivity index of 8900 for reduction of HPV DNA compared to inhibition of HKC growth.
The results with W12 cells were extended by measurements of HPV DNA in other HPV-bearing cells using the quantitative PCR DNA assay. A keratinocyte line immortalized by a second high risk virus, HPV-31, and another HPV-16-immortalized line were used. The K values for reduction of HPV DNA by GSK 983 in both cell lines were similar and comparable to the values measured for W12 cells. The effects of GSK983 on growth of the three cell lines were also similar (Table 3).
3.2.3. Effects of GSK983 on the growth of cells lines immortalized by integrated viral genomes
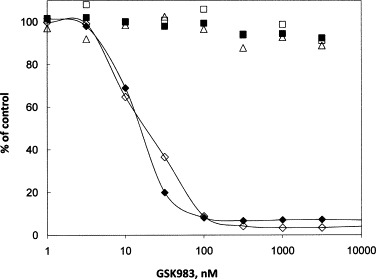
Although it is not necessary for viral replication, integration of all or part of the adenovirus, SV40, EBV and HPV genomes can occur as a chance event by recombination during viral replication, generating an immortalized cell line. We examined the effects of GSK983 on the growth of several such cell lines, and the results are in Fig. 6 and Table 4 . All of the lines tested were susceptible to GSK983, with median effect concentrations (K) in the range of 10–30 nM, averaging 22 ± 4 nM. The values of K for inhibition by GSK983 of the lines with integrated Ad-5 (HEK293), SV40 (Wi38 VA13) and EBV (Namalwa) were not significantly different from those for inhibition of the corresponding productive or episomal infections. The four keratinocyte lines with integrated HPV, however, were less susceptible than the episomally infected lines by about 2-fold. In contrast to the observed maximum inhibition of viral DNA of 86–99% in the productive or episomal infections, I max values in all of the integrated lines were asymptotic at significantly less than 100%. The I max values varied from 28% (Wi38 VA13) to 66% (Namalwa).
Fig. 6.
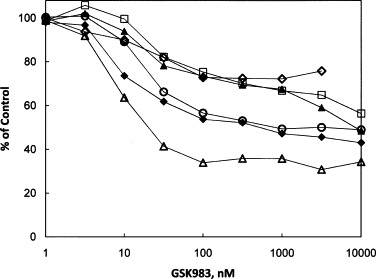
Inhibition by GSK983 of growth of cell lines bearing integrated adenovirus, SV40, EBV and HPV genomes. Cells were plated in 96-well plates with medium containing the indicated concentrations of compound. Measurement of cell growth was determined by CTG or MTS after 72 h of incubation with the compound. Cell line labels are followed by the viruses they contain in parentheses. (♦) HEK293 (Ad5); (♢) WI38 VA13 (SV40); (△) Namalwa (EBV); (▴) W12-20861 (HPV16); (□) CaSki (HPV16); (○) HeLa (HPV18).
3.3. Effects of GSK983 on growth of other immortalized cell lines
The form of the dose–response curves for inhibition by GSK983 of the cell lines with integrated virus are very similar to that observed for growth of the HPV-infected W12 cell line (Fig. 5, Fig. 6) and of the Vero cell line (Fig. 3). Vero cells are African Green monkey kidney cells immortalized by an unknown event, which is probably not a viral infection. This led us to study the effects of GSK983 on the growth of five other cell lines of human origin, immortalized by non-viral transformation events (Table 5 ). The results show the same characteristic form of the dose–response curves. The median effect concentrations were in the range of 10–50 nM, and the maximum inhibition was asymptotic at values less than 100%.
3.4. Effects of GSK983 on the growth of host primary cells
Wherever possible in the above studies, we have compared the effects of GSK983 on each virally infected or transfected cell line with the effects on the primary cell type from which the cell line was originally derived (Fig. 2, Fig. 4, Fig. 5; Table 1, Table 2, Table 3). In each case, the CC50 for inhibition of primary cell growth was greater than 10 μM. Table 6 shows additional data on HFF cells and measurements of the effects of GSK983 on growth of other types of primary cells. These include PBMCs, resting B and T cells, WI38 fibroblasts, HUVEC endothelial cells, and two types of bone marrow progenitors. None of the primary cell types tested was significantly inhibited by GSK983 at concentrations below 1 μM, and 50% inhibition was seen in the range of 10–100 μM. Unlike the viral assays, in which GSK983 was clearly more potent than its enantiomer GSK984, in the primary cells, similar CC50 values were observed for both enantiomers (data not shown). This suggests that the inhibition of primary cells by GSK983 is likely separate from the mechanism responsible for the antiviral data presented above.
3.5. Effects of GSK983 on cell growth over time
The results presented above show two distinct types of growth inhibition curves in immortalized cells, the >95% inhibition observed in IM9 and MT4 lines (Fig. 4) and the less than 70% maximum inhibition observed many other cell lines, including W12 (Fig. 5) and U937 (Table 5). We measured the inhibition over the course of 72 h to determine the reason for these two distinct patterns. During this time period, the cell lines double 2–3 times. To see >95% inhibition in this experiment, cell death must occur. If the maximum inhibition is significantly below 100% the inhibition is most likely due to cytostasis.
Fig. 7 shows measurements of growth of W12, U937 and IM9 cells for a period of 3 days after addition of a range of concentrations of GSK983. Growth of all three-cell lines was exponential throughout this time with doubling times of 33 ± 0.3, 20 ± 0.5 and 17 ± 0.5 h for W12, U937 and IM9, respectively. For W12 and U937 in the presence of GSK983, a concentration-dependent decrease in the rate of growth was seen which reached zero between 20 and 50 nM and remained at zero at higher concentrations. These results indicate induction of cytostasis by GSK983, consistent with the asymptotic dose–response curves for these cells. Similar studies with Vero cells (data not shown) also indicated cytostasis, consistent with the dose response. In contrast, the growth rate of the IM9 cells becomes negative at higher concentrations of GSK983. This indicates cell death, consistent with the observed dose response with I max approaching 100%.
Fig. 7.
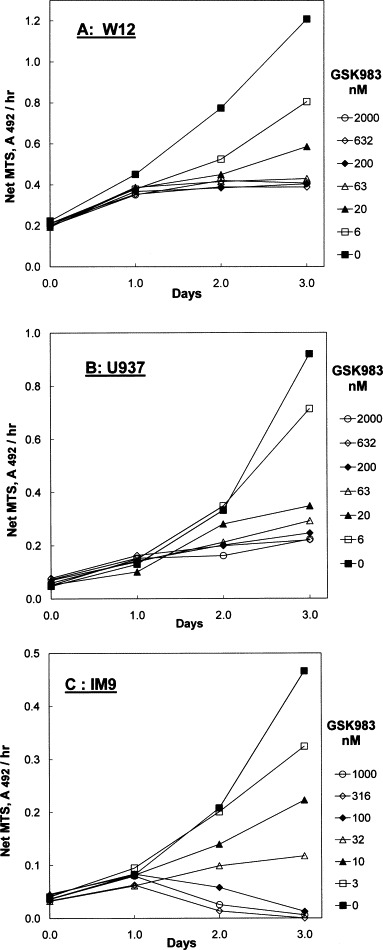
Time course of growth of (A) W12, (B) U937 and (C) IM9 cells in the presence of GSK983. The indicated concentrations of GSK983 were added to cells growing in 96-well plates at time zero. Rate of MTS reduction, to determine cell growth, was determined for 3 days starting at day zero. Growth of cells in untreated controls is indicated by solid squares in each case (GSK983, 0 nM).
All growth curves showed that inhibition by GSK983 was not immediate, regardless of whether the final outcome of was cytostasis or cell death. No reduction in growth rate occurred until approximately 24 h after addition of the compound (Fig. 7).
The mechanism of GSK983-induced cell death was investigated by measuring apoptosis in cell lines exposed to the drug (Fig. 8 ). GSK983-induced apoptosis in the IM9 and MT4 cell lines, but apoptosis did not occur in those cell lines with the asymptotic dose response to GSK983, such as W12 and U937. This is the result expected if inhibition by GSK983 resulted in cytostasis for the W12 and U937 lines. Two controls were used in this study. The inactive enantiomer GSK984 did not induce apoptosis in any of the cell lines studied, and all cell lines were susceptible to positive control, the Fas-activating antibody.
Fig. 8.
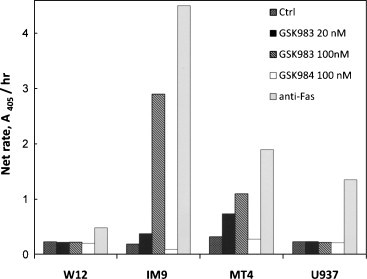
Apoptosis induced in cell lines after exposure to GSK983 for 20 h (IM9 and MT4 cells) or 40 h (W12 and U937). Cells were treated with GSK983 at the concentrations indicated for the time specified above. Apoptosis was estimated by measuring histone-associated DNA fragments in the cytoplasm by ELISA. Ctrl, no compound added; anti-Fas, positive control.
3.6. GSK983 induces expression of interferon-stimulated genes in infected and immortalized cells
GSK983's biological profile, which includes activity against a variety of viruses and immortalized cell lines, suggests that its target is a cellular protein. The observed delay in the onset of inhibition by GSK983 further suggests that the mechanism of action requires the induction of cellular genes. Thus we studied the effects of GSK983 on the expression of a set of 546 human genes selected independently of this study for investigation of metabolic and signaling pathways (the Pathway Set, see Supplementary Materials for details). The experiment was carried out in W12 cells since the cytostatic inhibition of these cells by GSK983 permitted reliable preparation of intracellular mRNA.
Genes whose expression was up-regulated by GSK983 were identified by two criteria. First, at the concentration of GSK983 near the EC50 (10 nM), a statistically significant increase in expression should be seen when comparing the value after 48 h of treatment to the untreated control. The minimum significant increase detectable was about 1.5-fold based on the observed standard errors (Table 7 ). Second, the increase should show a reasonable dose response. After 48 h of treatment with 100 nM GSK983, a statistically significant increase of at least 2-fold should be seen when compared with both the untreated and GSK984-treated controls.
Table 7.
Genes of the Pathway Set with expression significantly up-regulated by GSK983 in W12 or HKC cells.
| Gene symbol | Cell type | Untreated abundancea |
Fold increase due to GSK983 |
||||
|---|---|---|---|---|---|---|---|
| log(2) at zero time | S.E. | 10 nM, 24 h | 10 nM, 48 h | 100 nM, 24 h | 100 nM, 48 h | ||
| CEL | W12 | −22.4 | 0.2 | – | 14.1 | 3.0 | 10.6 |
| COL10A1 | W12 | −15.0 | 0.4 | 0.8b | 2.0 | 3.6 | 2.4 |
| CPT1B | W12 | −13.9 | 0.1 | 2.2 | 2.2 | 3.2 | 6.4 |
| CSF2 | W12 | −13.5 | 0.3 | 1.5b | 1.7 | 3.7 | 4.9 |
| DCN | W12 | −11.0 | 0.1 | 1.5b | 2.1 | 2.3 | 15.4 |
| DMPK | W12 | −12.6 | 0.1 | 0.9b | 2.1 | 2.9 | 4.1 |
| ERN2 | W12 | −17.0 | 0.4 | 0.7b | 2.6 | 1.7b | 2.8 |
| FMOD | W12 | −17.1 | 0.3 | 1.0b | 1.5 | 1.7 | 2.5 |
| IFIT1c | W12 | −12.0 | 0.1 | 2.6 | 2.0 | 5.5 | 5.5 |
| IL6c | W12 | −14.0 | 0.4 | 2.5b | 1.8 | 3.8 | 10.2 |
| IL8 | W12 | −9.3 | 0.2 | 1.8b | 1.4 | 2.1 | 2.3 |
| ISG15c | W12 | −9.9 | 0.1 | 2.5 | 3.0 | 4.3 | 9.3 |
| LIFR | W12 | −14.6 | 0.2 | 2.1b | 1.5 | 1.3b | 2.2 |
| LRP1 | W12 | −12.6 | 0.3 | 1.2b | 3.5 | 3.7 | 3.5 |
| NR1H3 | W12 | −12.1 | 0.2 | 0.6b | 1.8 | 6.8 | 2.7 |
| OAS1c | W12 | −11.0 | 0.3 | 1.1b | 1.7 | 2.2 | 5.0 |
| OAS2c | W12 | −10.3 | 0.4 | 2.1 | 1.8 | 1.9 | 2.9 |
| OASLc | W12 | −10.6 | 0.2 | 1.8 | 2.2 | 6.7 | 10.9 |
| CCL5 | W12 | −16.4 | 0.4 | 7.9b | 41.5 | 3.1 | 47.4 |
| SNAP25 | W12 | −18.3 | 1.0 | 1.2b | 3.7 | 1.7b | 4.7 |
| TLR5 | W12 | −15.7 | 0.4 | 1.9b | 1.7 | 2.4 | 3.1 |
| TNFSF10c | W12 | −14.5 | 0.1 | 3.7 | 1.8 | 4.3 | 8.4 |
| ADAMTS5 | HKC | −16.3 | 0.3 | 2.6 | 2.3 | 1.3b | 7.5 |
| ABCD1 | HKC | −15.1 | 0.7 | 2.0 | 4.5 | 2.3 | 3.7 |
| ABCG1 | HKC | −11.3 | 0.4 | 2.5 | 3.1 | 5.0 | 4.8 |
| BIK | HKC | −9.1 | 0.1 | 2.2 | 1.8 | 2.3 | 3.7 |
| CDKN1A | HKC | −4.7 | 0.1 | 1.7b | 1.6 | 1.8 | 4.3 |
| CSF2 | HKC | −11.6 | 0.1 | 1b | 4.1 | 2.8 | 5.8 |
| MDM2 | HKC | −6.5 | 0.1 | 2.1 | 3.2 | 2.4 | 2.9 |
| MGP | HKC | −13.2 | 0.1 | 1.9 | 2.9 | 2.0 | 3.0 |
| MMP1 | HKC | −9.5 | 0.2 | 5.8b | 2.2 | 5.2b | 5.0 |
Growing cultures of W12 and HKC cells were treated with 0, 10 and 100 nM GSK983 and 100 nM GSK984. RNA was prepared from samples taken at 0, 24 and 48 h after addition of the compound and mRNA levels of each of the 546 genes of the Pathway Set were measured in quadruplicate by RT-qPCR. Changes in expression levels due to GSK983 treatment were calculated as described in Section 2.
Relative to GADPH mRNA (Ct ∼ 15).
Fold change not significantly different from 1.
Interferon-stimulated gene (ISG).
The results are in Table 7. At both 10 and 100 nM, GSK983 produced significant increases in expression of 22 genes in the HPV-immortalized W12 cells and 9 genes in the primary human keratinocytes. Only one gene, CSF2, was induced in both cell types. Of the 22 genes induced in W12 cells, seven (IFIT1 (ISG56), IL6, ISG15, OAS1, OAS2, OASL and TNFSF10 (TRAIL)) are known to be interferon-stimulated genes (ISGs). Using four published lists of ISGs (Browne et al., 2001, Der et al., 1998, Radaeva et al., 2008), we determined that 26 of the 546 genes of the Pathway Set were ISGs. Thus of any 22 genes of the set selected at random, only one would be expected to be an ISG. In the set of genes induced by GSK983 in W12 cells, ISGs are 7-fold over-represented, and calculations of Chi-square showed that the probability that this over-representation was due to chance is ≪0.001. Two chemokines, IL8 and CCL5, occur in the 22 genes induced in W12 cells. This number is also significantly greater than expected by chance. No ISGs or chemokines were found in the set of genes up-regulated in HKCs.
The RNA samples were tested for expression of five additional ISGs which were not included in the Pathway Set (Table 8 ). Three (IFI6, IFI44 and IRF9) were strongly induced by GSK983 in W12 cells but not in HKCs. Results for the other two were not significant.
Table 8.
Effect of GSK983 in W12 and HKC cells on expression of other interferon-stimulated genes not in the Pathway Set.
| Gene symbol | Cell type | Untreated abundancea |
Fold increase due to GSK983 |
||||
|---|---|---|---|---|---|---|---|
| log(2) at zero time | S.E. | 10 nM, 24 h | 10 nM, 48 h | 100 nM, 24 h | 100 nM, 48 h | ||
| IFI6 | W12 | −8.8 | 0.12 | 1.1b | 2.2 | 2.3 | 7.3 |
| IFI16 | W12 | −9.9 | 0.10 | 5.2 | 1.6 | 1.3 | 1.2b |
| IFI44 | W12 | −10.7 | 0.15 | 2.9 | 2.7 | 2.9 | 4.0 |
| IRF3 | W12 | −9.5 | 0.14 | 7.8 | 1.3 | 1.5 | 1.2b |
| IRF9 | W12 | −10.2 | 0.15 | 1.0b | 1.7 | 1.6 | 4.5 |
| IFI6 | HKC | −2.3 | 0.08 | 1.3b | 1.4b | 1.1b | 1.4b |
| IFI16 | HKC | −11.5 | 0.25 | 2.3b | 2.7 | 0.6b | 0.8b |
| IFI44 | HKC | −7.8 | 0.11 | 1.9b | 1.7b | 0.7b | 0.5b |
| IRF3 | HKC | −11.1 | 0.29 | 3.7 | 2.4 | 1.1b | 0.8b |
| IRF9 | HKC | −5.3 | 0.12 | 1. 3b | 1.5b | 1.6 | 1.5b |
The RNA samples from the experiment of Table 7 were analyzed in quadruplicate by RT-qPCR for mRNA levels of each of the 5 genes listed above. Changes in expression levels due to GSK983 treatment were calculated as described in Section 2.
Relative to GADPH mRNA (Ct ∼ 15).
Fold change not significantly different from 1.
In summary, GSK983 induces a limited set of genes in W12 cells. The major components of this set are interferon-stimulated genes. The results also show that not all ISGs are up-regulated. Notably, the three interferons (alpha, beta, and gamma), PKR and Mx1 were not induced (data not shown).
To verify that these results were not restricted to W12 cells, we checked induction of IFIT1 (ISG56) in another susceptible cell line, HEK293, using a strain stably transfected with the luciferase gene under the control of the IFIT1 promoter. The results are in Fig. 9 . Strong induction of luciferase was seen with both 10 and 30 nM GSK983 over a 48-h period. These results were comparable to the induction by the positive controls, 10 and 30 units/ml of α-interferon.
Fig. 9.
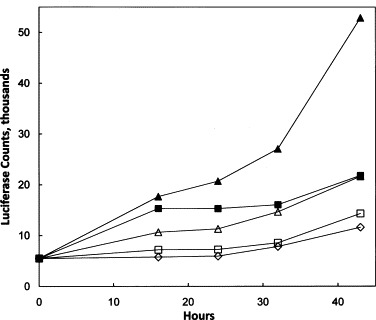
Induction of luciferase under control of the IFIT1 promoter by GSK983 and α-interferon in HEK293 cells. HEK293-IFIT1 cells were grown in 96-well plates in the presence of GSK983 or α-IFN. Luciferase activity was measured at the time points indicated. (△) GSK983 10 nM; (▴) GSK983 30 nM; (□) α-IFN 10 units; (■) α-IFN 30 units; (♢) no addition.
4. Discussion
The results presented here show that GSK983 has a broad spectrum of activities, inhibiting both viral replication and the growth of immortalized cells in a relatively narrow range of 5–50 nM. GSK983's effects, however, are quite selective, and the compound does not impact the growth of any of the primary cells studied at concentrations below 1 μM.
A number of antiviral assays are presented, but the most straightforward system to interpret is the inhibition of adenovirus 5 (Ad-5). In this system, the virus completes its full life cycle in a monolayer cell culture of primary cells. We see a classic antiviral dose–response curve, with full inhibition (I max) of 100% occurring below 100 nM. The impact of GSK983 on the viral replication can be directly compared to the compound's impact on the growth of the uninfected HFF, which is minimal. The selectivity index of over 2000 clearly indicates GSK983 is inhibiting the viral replication.
The other antiviral systems presented are more complicated to interpret, since they each use immortalized cells. The results detailed above clearly indicate that all the immortalized cell lines evaluated are susceptible to GSK983, regardless of whether a virus is present (Table 2, Table 3, Table 4, Table 5). The time course and apoptosis experiments demonstrate that this effect is typically cytostasis, but, in some cases, is apoptosis (Fig. 7, Fig. 8).
The SV40 experiments are the first example which uses immortalized cells. In this case, the standard assay measures SV40 productive replication in Vero cells. Since Vero growth is inhibited by GSK983 even in the absence of virus, the challenge is to separate the antiviral and growth inhibition effects. As noted in Section 3, we used the ratio of viral DNA to MTS activity as an indicator of the level of viral DNA per cell, and that analysis demonstrates a significant reduction of viral DNA (Fig. 3). While this suggests an antiviral effect, it does not prove that the antiviral effect is directly due to the action of GSK983 rather than secondary to the cytostasis of the host cells.
In the case of the cell lines immortalized by episomal or retrovirally integrated virus, a much clearer analysis is possible. In the three HPV-infected cell lines, viral DNA levels were inhibited by GSK983 with K values of 2–5 nM, and the maximum level of inhibition approached 100%. Cell growth was also inhibited with similar K values, and we showed for W12 cells that the inhibition was cytostatic. As a result, the maximum inhibition is significantly less than 100%. In our first analysis, we looked at the ratio of HPV DNA to MTS activity, which is reduced by GSK983, indicating a drop in viral copy number per cell which was confirmed by qPCR. This suggests a selective antiviral effect. In a second approach to studying selectivity, we measured the effect of GSK983 on primary human keratinocytes, the uninfected cells most closely related to the W12 line, and found a difference of K values of over 8000-fold (Fig. 5 and Table 3). Although this comparison is not perfect, since the cells are from different genetic lineages, it is strongly suggestive of a selective effect.
The data from the cell lines immortalized by either episomal or integrated HPV allow us to form initial hypotheses about the action of GSK983. All of these lines have two things in common. First, their growth is dependent on the virus. Second, their growth is inhibited at similar median effect concentrations (K), and these K values for growth are also similar to the median effect concentrations for inhibition of viral yield. As we consider the mechanism, we can envision three possible explanations for GSK983's role in the observed activity. First, GSK983 could inhibit the viral replication, and that inhibition could lead to cytostasis, since growth of the cell line is dependent on the virus. If this is the case, the observed inhibition should be dependent on copy number, and it is not. The W12 cell line has approximately 1000 episomal copies of HPV (Stanley et al., 1989), the HKC/HPV16 line has 60–80 episomal copies (Lee et al., 2004), and the integrated line has even fewer copies, but all of these lines have similar growth rates (data not shown) and K values for inhibition (Table 3). Furthermore, we observed similar effects on growth in both episomal lines, where the copy number can decrease, and the integrated lines, where copy number is fixed (Table 3, Table 4). The second possible explanation is that reduction of viral copy number is a simple consequence of the induction of cytostasis by GSK983. This is also unlikely, since cytostasis is not induced in uninfected keratinocytes, but clearly requires the presence of the virus (Table 3). Consequently, the third explanation seems to be the most likely: reduction of viral copy number and cell growth rate are parallel consequences of the effects of GSK983 on a single target.
The results with the EBV and HTLV-1 immortalized cell lines can lead to the same conclusion, even though they appear different at first glance (Fig. 4), since inhibition by GSK983 is manifested as apoptosis rather than cytostasis (Fig. 7, Fig. 8). Comparing the potent inhibition of the viral-immortalized cell lines with the lack of effect on related primary cells gives a selectivity index of approximately 1000. As above, this is an imperfect comparison, since the genetic lineages of the primary and immortalized cells are not identical, but it is very suggestive of a selective effect and clearly shows that GSK983 does not cause apoptosis in the primary cells, even when they are activated. We also note that the number of cell line passages since the viral immortalization event does not influence the outcome of the assay. The freshly immortalized 5/2/1 B-LCLs behave in the same fashion as the much older IM9 cell line. This suggests that the viral immortalization is the key to the cell line's susceptibility, not other events that may have occurred during subsequent rounds of replication.
In our preliminary mechanism of action studies, the time course of growth in the presence of GSK983 (Fig. 7) showed a delay in inhibition during the first 24 h. This suggests that the mechanism could involve induction of a gene or set of genes in the host cell. Further studies comparing gene expression in the HPV W12 system and primary keratinocytes revealed that a subset of interferon-stimulated genes is up-regulated in the W12 cells, but not the primary keratinocytes. That result is not confined to the HPV W12 system, but was confirmed in a second cell line immortalized by an adenovirus (Fig. 9). Also notable is the negative result: the interferons themselves are not up-regulated.
Obviously, there is still a significant amount of work needed to fully understand the mechanism (or mechanisms) of GSK983, but our initial experiments point to some useful starting points for identifying the target. It is possible that the multiple activities described above result from the action of GSK983 with similar potency on multiple targets. For instance, the current data do not rule out the scenario in which the antiviral effect on adenovirus-5 replication in primary cells is due to inhibition of a viral target, and all of the effects observed in immortalized and transformed cell lines are due to a separate mechanism with a cellular target. If this is the case, the mechanisms of GSK983 are still of interest, because of both the compound's potent inhibition of adenovirus, and its clear selectivity for immortalized cells over primary cells.
The data presented here are also consistent with another assumption. The effects of GSK983, which all manifest in a relatively narrow concentration range, could result from the action of the compound on a single cellular target. If this is the case, the cell lines and viral replications that are susceptible to GSK983 must have in common some feature not shared with the primary cells and the viral replications that are not susceptible. All of the susceptible cell lines, whether immortalized by viral infection, integration of viral genes or by other non-viral means, have abnormal cellular DNA replication and loss of normal cell cycle control. By definition, the primary cell types do not have these features. Furthermore, we showed that two viruses that actively turn on cellular DNA replication during their productive replication are susceptible to GSK983. Ad-5, SV40 and HPV share this property (Knipe and Howley, 2007). Ad-5 and SV40 were inhibited by GSK983 (Fig. 2, Fig. 3), but we were unable to study productive replication of HPV due to lack of a suitable experimental system. The viruses we studied that are not susceptible to GSK983 either do not actively promote cellular DNA replication, as in the case of HIV, or they actively block it, as in the case of lytic replication of the herpesviruses EBV (Kudoh et al., 2006) and HSV (Song et al., 2000). Thus, the susceptibility to GSK983 correlates with loss of normal cell cycle control.
Abrogation of cell cycle control, either by viral or immortalizing events, triggers a variety of host cell defenses which can lead to cytostasis or apoptosis. In order to continue viral replication or immortalization, these defenses must be inactivated. Our preliminary studies suggest that GSK983's mechanism of action may allow a cellular defense to be reactivated, resulting in the reactivation of synthesis of a subset of interferon-stimulated genes. This mechanism could at the same time produce both the direct anti-viral effect and the cell-cycle arrest or apoptosis that we have observed (reviewed in Randall and Goodbourn, 2008). This proposed mechanism would also explain the lack of observed activity of GSK983 against the primary cell types studied. If the activity of GSK983 is dependent upon a prior viral or immortalizing event, the compound would have no effect upon primary cells.
In conclusion, GSK983 is a novel tetrahydrocarbazole that inhibits multiple viruses. It appears to have a unique mechanism of action that functions via a cellular target. This target is important to the replication of many, but not all, viruses and to the growth of immortalized cells. The intriguing biological profile of GSK983 warrants further study.
Acknowledgements
We would like to thank Paul Lambert (University of Wisconsin), John Lee (University of Iowa) and Laimonis Laimins (Northwestern University) for providing cell lines used in this study.
Footnotes
Supplementary data associated with this article can be found, in the online version, at doi:10.1016/j.antiviral.2008.12.015.
Appendix A. Supplementary data
References
- Barltrop J.A., Owen T.C., Cory A.H., Cory J.G. 5-(3-Carboxymethoxyphenyl)-2-(4,5-dimethylthiazolyl)-3-(4-sulfophenyl)tetrazolium, inner salt (MTS) and related analogs of 3-(4,5-dimethylthiazolyl)-2,5-diphenyltetrazolium bromide (MTT) reducing to purple water-soluble formazans as cell-viability indicators. Bioorg. Med. Chem. Lett. 1991;1:611–614. [Google Scholar]
- Boggs S.D., Cobb J.D., Gudmundsson K.S., Jones L.A., Matsuoka R.T., Millar A., Patterson D.E., Samano V., Trone M.D., Xie S., Zhou X. Efficient asymmetric synthesis of N-[(1R)-6-chloro-2,3,4,9-tetrahydro-1H-carbazol-1-yl]-2-pyridinecarboxamide for treatment of human papillomavirus infections. Org. Process Res. Dev. 2007;11:539–545. [Google Scholar]
- Borden E.C., Sen G.C., Uze G., Silverman R.H., Ransohoff R.M., Foster G.R., Stark G.R. Interferons at age 50: past, current and future impact on biomedicine. Nat. Rev. Drug Discov. 2007;6:975–990. doi: 10.1038/nrd2422. [DOI] [PMC free article] [PubMed] [Google Scholar]
- Browne E.P., Wing B., Coleman D., Shenk T. Altered cellular mRNA levels in human cytomegalovirus-infected fibroblasts: viral block to the accumulation of antiviral mRNAs. J. Virol. 2001;75:12319–12330. doi: 10.1128/JVI.75.24.12319-12330.2001. [DOI] [PMC free article] [PubMed] [Google Scholar]
- Cory A.H., Owen T.C., Barltrop J.A., Cory J.G. Use of an aqueous soluble tetrazolium/formazan assay for cell growth assays in culture. Cancer Commun. 1991;3:207–212. doi: 10.3727/095535491820873191. [DOI] [PubMed] [Google Scholar]
- Der S.D., Zhou A., Williams B.R., Silverman R.H. Identification of genes differentially regulated by interferon alpha, beta, or gamma using oligonucleotide arrays. Proc. Natl. Acad. Sci. U.S.A. 1998;95:15623–15628. doi: 10.1073/pnas.95.26.15623. [DOI] [PMC free article] [PubMed] [Google Scholar]
- Dunne E.F., Unger E.R., Sternberg M., McQuillan G., Swan D.C., Patel S.S., Markowitz L.E. Prevalence of HPV infection among females in the United States, 1947–1984. J. Am. Med. Assoc. 2007;297:813–819. doi: 10.1001/jama.297.8.813. [DOI] [PubMed] [Google Scholar]
- Eaves C.J. Assays of hemopoietic progenitor cells. In: Beutler E., Lichtman M.A., Coller B.A., Kipps T.J., editors. Williams Hematology. McGraw-Hill, Inc.; 1995. pp. L22–L26. [Google Scholar]
- Ferris R.G., Hazen R.J., Roberts G.B., St. Clair M.H., Chan J.H., Romines K.R., Freeman G.A., Tidwell J.H., Schaller L.T., Cowan J.R., Short S.A., Weaver K.L., Selleseth D.W., Moniri K.R., Boone L.R. Antiviral activity of GW678248, a novel benzophenone nonnucleoside reverse transcriptase inhibitor. Antimicrob. Agents Chemother. 2005;49:4046–4051. doi: 10.1128/AAC.49.10.4046-4051.2005. [DOI] [PMC free article] [PubMed] [Google Scholar]
- Frisan T., Levitsky V., Masucci M. Generation of lymphoblastoid cell lines (LCLs) In: Wilson J.B., May G.H.W., editors. Epstein-Barr Virus Protocols. Humana Press; 2001. pp. 123–127. [Google Scholar]
- Grunberger C., Wyles D.L., Kaihara K.A., Schooley R.T. 3-Drug synergistic interactions of small molecular inhibitors of hepatitis C virus replication. J. Inf. Dis. 2008;197:42–45. doi: 10.1086/524062. [DOI] [PMC free article] [PubMed] [Google Scholar]
- Hill A.V. The possible effects of the aggregation of the molecules of hemoglobin on its dissociation curves. J. Physiol. (Lond.) 1910;40:4–8. [Google Scholar]
- Knipe D.M., Howley P.M. 5th ed. Lippincott Williams & Wilkins; 2007. Fields Virology. [Google Scholar]
- Kudoh A., Daikoku T., Ishimi Y., Kawaguchi Y., Shirata N., Iwahori S., Isomura H., Tsurumi T. Phosphorylation of MCM4 at sites inactivating DNA helicase activity of the MCM4-MCM6-MCM7 complex during Epstein-Barr virus productive replication. J. Virol. 2006;80:10064–10072. doi: 10.1128/JVI.00678-06. [DOI] [PMC free article] [PubMed] [Google Scholar]
- Lee J.H., Yi S.M., Anderson M.E., Berger K.L., Welsh M.J., Klingelhutz A.J., Ozbun M.A. Propagation of infectious human papillomavirus type 16 by using an adenovirus and Cre/LoxP mechanism. Proc. Natl. Acad. Sci. U.S.A. 2004;101:2094–2099. doi: 10.1073/pnas.0308615100. [DOI] [PMC free article] [PubMed] [Google Scholar]
- Leyssen P., De Clerq E., Neyts J. Molecular strategies to inhibit the replication of RNA viruses. Antivir. Res. 2008;78:9–25. doi: 10.1016/j.antiviral.2008.01.004. [DOI] [PMC free article] [PubMed] [Google Scholar]
- Mager M.E. Academic Press, Inc.; 1972. Data Analysis in Biochemistry and Biophysics. [Google Scholar]
- Morens D.M., Fauci A.S. Dengue and hemorrhagic fever: a potential threat to public health in the United States. J. Am. Med. Assoc. 2008;299:214–216. doi: 10.1001/jama.2007.31-a. [DOI] [PubMed] [Google Scholar]
- Radaeva S., Jaruga B., Hong F., Kim W., Fan S., Cai H., Strom S., Liu Y., El-Assal O., Gao B. Interferon-alpha activates multiple STAT signals and down-regulates c-Met in primary human hepatocytes. Gastroenterology. 2008;122:1020–1034. doi: 10.1053/gast.2002.32388. [DOI] [PubMed] [Google Scholar]
- Randall R.E., Goodbourn S. Interferons and viruses: an interplay between induction, signalling, antiviral responses and virus countermeasures. J. Gen. Virol. 2008;89:1–47. doi: 10.1099/vir.0.83391-0. [DOI] [PubMed] [Google Scholar]
- Schlect J., Schellhorn S., Dezube B., Jacobson J. New approaches in the treatment of HIV/AIDS – focus on maraviroc and other CCR5 antagonists. Ther. Clin. Risk Manage. 2008;4:473–485. doi: 10.2147/tcrm.s1997. [DOI] [PMC free article] [PubMed] [Google Scholar]
- Song B., Liu J.J., Yeh K.C., Knipe D.M. Herpes simplex virus infection blocks events in the G1 phase of the cell cycle. Virology. 2000;267:326–334. doi: 10.1006/viro.1999.0146. [DOI] [PubMed] [Google Scholar]
- Stanley M.A., Browne H.M., Appleby M., Minson A.C. Properties of a non-tumorigenic human cervical keratinocyte cell line. Int. J. Cancer. 1989;43:672–676. doi: 10.1002/ijc.2910430422. [DOI] [PubMed] [Google Scholar]
Associated Data
This section collects any data citations, data availability statements, or supplementary materials included in this article.