

Abstract
Because of the conflicting data concerning the SARS-CoV inhibitory efficacy of ribavirin, an inosine monophosphate (IMP) dehydrogenase inhibitor, studies were done to evaluate the efficacy of ribavirin and other IMP dehydrogenase inhibitors (5-ethynyl-1-β-d-ribofuranosylimidazole-4-carboxamide (EICAR), mizoribine, and mycophenolic acid) in preventing viral replication in the lungs of BALB/c mice, a replication model for severe acute respiratory syndrome (SARS) infections (Subbarao, K., McAuliffe, J., Vogel, L., Fahle, G., Fischer, S., Tatti, K., Packard, M., Shieh, W.J., Zaki, S., Murphy, B., 2004. Prior infection and passive transfer of neutralizing antibody prevent replication of severe acute respiratory syndrome coronavirus (SARS-CoV) in the respiratory tract of mice. J. Virol. 78, 3572–3577). Ribavirin given at 75 mg/kg 4 h prior to virus exposure and then given twice daily for 3 days beginning at day 0 was found to increase virus lung titers and extend the length of time that virus could be detected in the lungs of mice. Other IMP dehydrogenase inhibitors administered near maximum tolerated doses using the same dosing regimen as for ribavirin were found to slightly enhance virus replication in the lungs. In addition, ribavirin treatment seemed also to promote the production of pro-inflammatory cytokines 4 days after cessation of treatment, although after 3 days of treatment ribavirin inhibited pro-inflammatory cytokine production in infected mice, significantly reducing the levels of the cytokines IL-1α, interleukin-5 (IL-5), monocyte chemotactic protein-1 (MCP-1), and granulocyte-macrophage colony stimulating factor (GM-CSF). These findings suggest that ribavirin may actually contribute to the pathogenesis of SARS-CoV by prolonging and/or enhancing viral replication in the lungs. By not inhibiting viral replication in the lungs of infected mice, ribavirin treatment may have provided a continual source of stimulation for the inflammatory response thought to contribute to the pathogenesis of the infection. Our data do not support the use of ribavirin or other IMP dehydrogenase inhibitors for treating SARS infections in humans.
Keywords: SARS-CoV, Ribavirin, IMP dehydrogenase inhibitor, BALB/C mouse, Enhancement, Infection, Severe acute respiratory syndrome, Coronavirus
1. Introduction
Inosine monophosphate (IMP) dehydrogenase, a key enzyme in de novo synthesis of purine nucleotides, is an important therapeutic target. Three inhibitors of IMP dehydrogenase have reached the market. Of these, ribavirin (Rebetol® and Virazole®) is a broad-spectrum antiviral agent, which in combination with interferon-alpha is now used for treatment of hepatitis C virus infections (Cinatl et al., 2005). It was thought that ribavirin might be useful for treating coronavirus-associated severe acute respiratory syndrome infections (SARS) because of its broad-spectrum inhibition of RNA viruses.
Mizoribine (Bredinin®) and mycophenolic mofetil (CellCept®), a derivative of mycophenolic acid (MPA), are the other two IMP dehydrogenase-inhibiting compounds; they have been introduced as immunosuppressants (Allison, 2000, Pankiewicz et al., 2004) for patients with hepatitis C receiving transplants. MPA has shown appreciable biological activity, including immunosuppression of inflammation (Vincenti, 2003). Because inflammation is thought to play a role in the pathogenesis of SARS (Lee et al., 2004), MPA might be a useful compound in reducing the inflammatory response associated with SARS infections. Another inhibitor, EICAR, is an investigative drug (Shigeta, 2000) (Fig. 1 ).
Fig. 1.
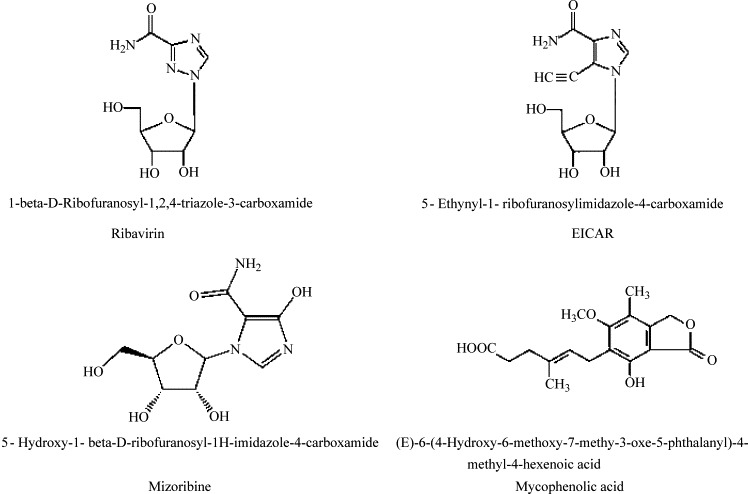
Structures of compounds evaluated for efficacy in SARS-CoV mouse lung replication model.
Of the IMP dehydrogenase inhibitors mentioned above, only ribavirin has been extensively evaluated in severe acute respiratory syndrome coronavirus (SARS-CoV) cell culture assays and used for actual treatment of SARS infections. Initial studies by Cinatl et al., 2003a, Cinatl et al., 2003b suggested that ribavirin did not inhibit SARS-CoV replication in African green monkey kidney cells (Vero) at therapeutically achievable concentrations. This was subsequently confirmed in several laboratories (Barnard et al., 2004b, Ströher et al., 2004, Chen et al., 2004, Tan et al., 2004). More than likely ribavirin was not phosphorylated to sufficient levels in Vero cells to achieve an antiviral effect (Cinatl et al., 2005). However, others have found that ribavirin was a potent inhibitor of viral replication in Vero cells (Yamamoto et al., 2004). In addition, ribavirin apparently inhibited SARS-CoV replication in rhesus monkey kidney cells (FRhK-4) at 50 μg/ml. However, the clinically equivalent concentration of this dose would be above plasma levels achievable in humans (Koren et al., 2003). Morgenstern et al. (2005) have found ribavirin to be efficacious against SARS-CoV in several other cells lines including embryonic African green monkey kidney cells (MA-104), pig kidney cells (PK-15), and human colon carcinoma cell lines (Caco-2 and CL-14).
Clinically, some retrospective studies have shown that ribavirin did not facilitate the recovery of patients infected with SARS-CoV (Lee et al., 2004, Wang et al., 2004). A randomized trial showed that ribavirin was not efficacious (Zhao et al., 2003). In addition, SARS patients in Canada treated with ribavirin still had high copy numbers of SARS-CoV RNA in multiple lobes of the lung at their time of death (Mazzulli et al., 2004). The outcome for patients treated with hydrocortisone and ribavirin was not any better; the plasma levels of SARS-CoV mRNA were increased in the second and third weeks of illness compared to those who received placebo (Lee et al., 2004). However, in another study, five of eight patients treated with ribavirin had reduced viral loads during treatment (Wang et al., 2004), while three did not.
Because of the conflicting data concerning the efficacy of ribavirin (reviewed by Cinatl et al., 2005), studies were done to evaluate ribavirin as well as other IMP dehydrogenase inhibitors for efficacy in preventing viral replication in the lungs of BALB/c mouse model for SARS-CoV (Subbarao et al., 2004).
2. Materials and methods
2.1. Cells and virus
African green monkey kidney cells (Vero 76) and human colon adenocarcinoma cells (CaCo-2) were obtained from American Type Culture Collection (ATCC; Manassas, VA, USA). Embryonic African green monkey kidney cells (MA-104) were originally obtained from Whitaker MA Bioproducts (Walkersville, MD, USA). Vero E6 cells were kindly provided by the Centers for Disease Control (Atlanta, GA, USA). All cells were routinely grown in minimal essential medium (MEM) supplemented with 10% heat-inactivated fetal bovine serum (FBS; Hyclone Laboratories, Logan, UT, USA) and the CaCo-2 cells in DMEM supplemented with 10% FBS. For antiviral assays, the serum was reduced to 2% and gentamicin added to the medium at a final concentration of 50 μg/ml.
Severe acute respiratory syndrome coronavirus, strain Urbani (200300592), was obtained from the CDC and routinely passaged in Vero 76 cells. All experiments involving infectious SARS-CoV were carried out in BSL-3+ laboratories. All personnel wore complete body protective coverings and HEPA-filtered powered air purifying respirators.
2.2. Compounds
Ribavirin was obtained from ICN Pharmaceuticals (Costa Mesa, CA). Ribavirin monophosphate was kindly provided by Dr. Zhi Hong (Valeant Pharmaceuticals International, Costa Mesa, CA) and mizoribine was obtained from Dr. Dennis Carson (University of California at San Diego). 5-Ethynyl-1-β-d-ribofuranosylimidazole-4-carboxamide (EICAR) was obtained from the NIAID Antiviral Substances Program and mycophenolic acid was purchased from Sigma (St. Louis, MO). Alferon N Injection® was provided by Hemispherx Biopharma, Inc. (New Brunswick, NJ, USA). All compounds were solubilized in minimal essential medium for in vitro assays and in physiological saline (PSS) for in vivo experiments. Structures of compounds used in the current studies are shown in Fig. 1.
2.3. Cytopathic effect (CPE) inhibition assay
A modified protocol of Barnard et al. (2004a) was used for in vitro evaluation of antiviral efficacy of the IMP dehydrogenase inhibitors. Compounds were tested at varying concentrations (four log10 or eight (1/2) log10 dilutions). Virus and compound were added in equal volumes to near-confluent cell monolayers in 96-well tissue culture plates. The MOI used was ranged from 0.01 to 0.025 in order to produce virus cytopathic effects in 100% of the cells in the virus control wells within 3–4 days. The plates were incubated at 37 °C until the cells in the virus control wells showed complete viral CPE as observed by light microscopy. Each concentration of drug was assayed for virus inhibition of viral CPE in triplicate and for cytotoxicity in duplicate. Six wells per plate were set aside as uninfected, untreated cell controls and six wells per plate received virus only and represented controls for virus replication. Alferon® (Hemispherx Biopharma, Inc.), a human leukocyte-derived alfa-n3 interferon (IFN), was included as a positive control drug for each set of compounds tested.
Morphological changes resulting from cytotoxicity of a compound or virus cytopathic effect were graded on a scale of 0–5, 5 being defined as the appearance of complete cytotoxicity or cytopathic effect involving the entire monolayer as observed by light microscopy. The values obtained were then converted to percents of untreated, uninfected controls. The 50% cell cytotoxic doses (CC50) and 50% virus inhibitory doses (IC50), representing the putative concentration at which 50% of the monolayers would show compound cytotoxicity or virus cytopathic effect, respectively, were estimated by regression analysis. A selectivity index (SI) was calculated using the formula: SI = CC50/IC50. The activity in the CPE assay was then verified spectrophotometrically by neutral red (NR) uptake assay on the same plate (see below).
2.4. Neutral red uptake assay for determination of antiviral efficacy and compound cytotoxicity
This assay was done for each CPE inhibition test plate described above to verify the inhibitory activity and the cytotoxicity detected by visual observation. The usual correlation between visual and neutral red assays in our hands has been greater than 95% (Barnard et al., 1997). The NR assay was performed using a modified method of Cavenaugh et al. (1990) as described by Barnard et al. (2004b). Briefly, medium was removed from each well of a plate, 0.011% NR was added to each well of the plate, and the plate incubated for 2 h at 37 °C in the dark. The NR solution was removed from the wells, rinsed and any remaining dye extracted using ethanol buffered with Sörenson's citrate buffer. Absorbances at 540 nm/405 nm were read with a microplate reader (Bio-Tek EL 1309; Bio-Tek Instruments, Inc., Winooski, VT). Absorbance values were expressed as percents of untreated controls and IC50, CC50, and SI values were calculated as described above.
2.5. Virus yield reduction assay
Some compounds were evaluated in a more sensitive assay to confirm the results of the CPE inhibition/NR uptake assays. Infectious virus yields from each well from a second CPE inhibition assay were determined as previously described (Barnard et al., 2004b). After CPE was scored as described above, each plate was frozen at −80 °C and thawed. Sample wells at each compound concentration tested were pooled and titered in Vero 76 cells for infectious virus by CPE assay as previously described by Barnard et al. (2004a).
A 90% reduction in virus yield (IC90) was then calculated by linear regression analysis. This represented a one-log10 inhibition in titer when compared to untreated virus controls.
2.6. Animal studies
2.6.1. Animals
Specific pathogen-free BALB/c female mice (8–16 g, range varied with each experiment) were obtained from Charles River Laboratories (Wilmington, MA). They were quarantined for 24 h prior to being transferred to the BSL-3 facility for adaptation for 1 week to use in the experiment. Mice were fed with standard mouse chow and tap water ad libitum. Mouse studies approved by the Utah State University Animal Care and Use Committee were carried out in an approved animal biosafety level 3 facility. Personnel entering the facility wore powered air-purifying respirators (3M HEPA Air-Mate; 3M, Saint Paul, MN). For the infectious disease experiments, mice were housed in bonneted filter-topped cages placed within a HEPA-filtered horizontal laminar flow ventilated animal rack.
2.6.2. Preliminary toxicity evaluation
For each compound, a dose range finding experiment was done to determine the maximum tolerated concentration using dosage regimens that were to be used in the actual efficacy studies with the compound.
2.6.3. Experimental design
Thirty mice per group were treated by intraperitoneal (i.p.) injection or intranasal (i.n.) administration with an appropriate concentration of compound or PSS (placebo) 4 h prior to infection of mice. After the 4 h pretreatment, the mice were sedated with an i.p. injection of 20 mg/kg of Ketamine® and were infected i.n. with 50 μl of clarified virus lysate diluted 1:5 in saline (cell culture virus passage 4, 105 CCID50) with each nostril receiving approximately 50 μl. Animals were treated twice daily (BID) with an appropriate compound or placebo administered either i.p. or i.n. with the second dosage generally following the first by about 8 h. However, on day 0 the animals received drug 4 h prior to exposure to virus, then another dose immediately after exposure to virus and another dose 8 h after the second dose for a total of three doses. For most experiments, animals were also treated with compound or placebo BID on days 1 and 2 after virus exposure. Uninfected animals (10 for each dose of compound or placebo) were treated with the same concentrations of drug or with placebo as were the infected mice and served as toxicity controls. All treatments ceased after day 2, and animals were sacrificed at days 3 and 7 post-virus exposure. For an experiment of 7-day duration, 20 animals from the virus-infected groups and 7 mice from the uninfected groups of mice were sacrificed on day 3 post-virus exposure and assayed for weight gain or loss. The remaining mice were sacrificed on day 7 and assayed for weight gain or loss as well. Lungs were removed, weighed, and scored as described below. Portions of the lung were also assayed for the presence of virus as described below.
2.6.4. Lung scoring
Lungs were scored based on surface appearance of lungs. Lungs were assigned a score from 0 to 4, with 0 meaning that the lungs looked normal and 4 denoting that the entire surface area of the lung was inflamed and showed plum colored lung consolidation. However, no lung consolidation was seen (model of viral replication only), although some surface inflammation of the lining of the lung was noted in many treated, infected mice, but not in untreated mice.
2.6.5. Lung virus titer determinations
Each mouse lung was homogenized, the tissue fragments allowed to settle, and varying dilutions of the supernatant fluids were assayed in triplicate for infectious virus in Vero 76 cells by CPE assay and titers (CCID50 values) calculated using the Reed–Muench method (Reed and Muench, 1938).
2.6.6. Statistical analysis
Differences in mean lung weight and virus titers were analyzed by the Student's t-test. Wilcoxon ranked sum analysis was used for mean lung score comparisons. To detect differences in cytokine profiles of each treatment group, two-way repeated analysis of variance was used. For comparisons of cytokine levels between two treatments for an individual cytokine, a t-test was used.
2.7. Cytokine microarray analysis
At days 3 and 7 post-infection, lung samples were taken from four of the mice in each treatment group. Lung samples from each time point were homogenized in a volume adjusted for lung weights, immediately frozen, and stored for 1 week prior to analysis. Cytokine levels in the supernatant fluids, adjusted for total protein, were measured on the same day using the Quansys Q-Plex™ Mouse Cytokine Array. This platform was chosen for its ability to simultaneously measure 16 different mouse cytokines with a small sample volume (30 μl). Cytokines that were quantified included interleukin-1 alpha (IL-1α), interleukin-1 beta (IL-1β), interleukin-2 (IL-2), interleukin-3 (IL-3), interleukin-4 (IL-4), interleukin-5 (IL-5), interleukin-6 (IL-6), interleukin-9 (IL-9), interleukin-10 (IL-10), interleukin-12 (IL-12), monocyte chemotactic protein-1 (MCP-1), interferon gamma (IFN-γ), tumor necrosis factor alpha (TNF-α), macrophage inflammatory protein-1-alpha (MIP-1α), granulocyte-macrophage colony stimulating factor (GM-CSF), and RANTES. Total protein in each sample was determined using a bicinchoninic acid (BCA™) assay. The total protein values were then used to adjust the measured cytokine levels in proportion to the amount of protein present in each sample.
3. Results
3.1. In vitro antiviral activity of IMP dehydrogenase inhibitors
Of the IMP dehydrogenase inhibitors evaluated in vitro, none were inhibitory to virus replication independent of compound cytotoxicity (Table 1 ). The closely related analog of ribavirin, viramidine, was also evaluated and was found not be active. The compounds were either not selectively inhibitory or inactive at the concentrations tested and not toxic. Since a number of investigators have indicated that ribavirin does inhibit SARS-CoV replication in vitro, even in Vero cells, ribavirin was further evaluated in vitro by neutral red uptake assay. In Vero E6 cells, the EC50 = 1253 ± 1102 μM (n = 5, number of independent experiments) and in Vero 76 cells, the EC50 = 270 ± 50 μM (n = 4). Ribavirin was also evaluated for efficacy against SARS-CoV infection in MA-104 cells and CaCo-2 cells by virus yield reduction assay. The EC90 values, representing a one-log drop in virus titer, were equal to 225 μM and 4100 μM, respectively, compared to the EC90 value of 560 μM in Vero 76 cells shown in Table 1. When evaluated 2 days after exposure to virus-infected cells, ribavirin only inhibited virus yields at very high concentrations, EC90 = 454 ± 236 μM (n = 2). After a 4-day exposure, similar results were also obtained, EC90 = 545 ± 63 μM (n = 2).
Table 1.
In vitro SARS-CoV inhibitory activity of IMP dehydrogenase inhibitors and Alferon® in Vero 76 cells
| Compound | Visual assay |
NR assay |
Virus yield reduction assay | ||||
|---|---|---|---|---|---|---|---|
| IC50 (μM) | CC50 (μM) | SI | IC50 (μM) | CC50 (μM) | SI | IC90 (μM) | |
| EICAR | >40 | >40 | 0 | 28 | 16 | 0 | >40 |
| MPA | >30 | >30 | 0 | >30 | >30 | 0 | NDa |
| Mizoribine | >40 | >40 | 0 | >40 | >40 | 0 | ND |
| Viramidine | >410 | >410 | 0 | >410 | >410 | 0 | ND |
| Ribavirin | 210 | 283 | 1 | 320 | 402 | 1 | 590 |
| Ribavirin monophosphate | >30 | >30 | 0 | >30 | >30 | 0 | ND |
| Alferon® | 93b | >32000 | >344 | 32 | >32000 | >1000 | 1600 |
ND: not done.
Expressed as international units.
Some studies have inferred ribavirin efficacy against SARS-CoV, especially in cell lines that probably phosphorylate to its antiviral active form (reviewed by Oxford et al., 2005, Hui and Wong, 2004, Morgenstern et al., 2005, Chen et al., 2004). In other studies in which ribavirin was evaluated for efficacy in cells less likely to phosphorylate the compound, ribavirin was not efficacious against SARS-CoV (Barnard et al., 2004b, Ströher et al., 2004, Chen et al., 2004, Tan et al., 2004). Thus, the question remains if ribavirin can truly inhibit SARS-CoV. Therefore, the next set of studies was done to determine if ribavirin could inhibit SARS-CoV infection in a mouse lung replication model (no pathogenesis detected) in which the question of phosphorylation is likely not an issue.
3.2. In vivo antiviral activity of IMP dehydrogenase inhibitors
In a first set of experiments, ribavirin (administered either i.p. or i.n.) was evaluated at the maximum tolerated dose in BALB/c mice, 75 mg/kg/day, twice a day beginning with a 4 h pretreatment, followed by two treatments immediately after virus exposure and 8 h later. The mice were subsequently treated BID on days 1 and 2 after virus exposure and then sacrificed on day 3 about 12 h after the last treatment. Some mice from each treatment were kept alive, receiving no further treatment and then sacrificed on day 7. From previous experiments, it was determined that maximum lung virus titers were obtained on either day 3 or 4 and subsequently declined to undetectable levels by day 7 (data not shown) in agreement with other studies (Subbarao et al., 2004). In the current experiments, lung virus titers at day 3 were also at the levels detected in previous experiments and virus was not normally detectable by day 7. The infection was resolved with the virus totally cleared from the lungs; lung pathology was not detected in this model (Subbarao et al., 2004).
When mice were treated i.p. following the protocol just described, the ribavirin-treated animals, infected or uninfected significantly (p < 0.05), lost weight during the experiment when measured at day 3, suggesting that the dose used was near the threshold of tolerance in the mice (Table 2 ). At day 7, the ribavirin-treated animals had begun to gain weight, although the weight gain for infected animals treated with the drug and surviving to day 7 was less than the animals in other treatment groups surviving to day 7.
Table 2.
Effects of i.p. or i.n. ribavirin treatmenta on SARS-CoV (Urbani) replication in 12–14 g female BALB/c mice
| Intraperitoneal administration |
Intranasal administration |
||||||
|---|---|---|---|---|---|---|---|
| Treatment (mg/kg) | Day of sacrifice | Virus titer (log10 CCID50/g)b | Percent body weight change | Treatment (mg/kg) | Day of sacrifice | Virus titer (log10 CCID50/g)b | Percent body weight change |
| Virus-infected mice | |||||||
| 75c | Day 3 | 4.3 ± 0.5* | −13* | 75 | Day 3 | 5.2 ± 0.7 | −10* |
| Day 7 | 5.3 ± 0.01* | +2 | Day 7 | 4.4 ± 0.2 | +5 | ||
| Placebo | Day 3 | 3.8 ± 0.4 | +12 | Placebo | Day 3 | 4.4 ± 0.8 | +1 |
| Day 7 | 0 | +15 | Day 7 | 0 | +17 | ||
| Uninfected mice | |||||||
| 75c | Day 3 | 0 | −14* | 75 | Day 3 | 0 | −9* |
| Day 7 | 0 | +3 | Day 7 | 0 | +9 | ||
| Placebo | Day 3 | 0 | +6 | Placebo | Day 3 | 0 | −4 |
| Day 7 | 0 | +21 | Day 7 | 0 | +12 | ||
Treatment schedule: 4 h pretreatment, then BID, days 0–2.
Values are expressed as mean ± standard deviation.
Maximum tolerated dose determined in a previous experiment using the same dosage regimen.
p ≤ 0.05, comparison: ribavirin-treated, virus-infected groups to PSS-treated, virus-infected groups.
Ribavirin treatment did not reduce viral lung titers at a dose of 75 mg/kg. On the contrary, virus titers were significantly higher on day 3 (p < 0.001). The presence of ribavirin also apparently inhibited clearance of virus from the lungs of animals at day 7, whereas no virus was detected in the placebo-treated mice. Infectious virus has routinely been shown to be cleared in the lungs of untreated, infected animals by day 7 (Subbarao et al., 2004).
The results of treating the SARS-CoV infection in mice using the i.n. route are also summarized in Table 2. Again, ribavirin-treated mice lost weight during the experiment when measured at day 3, as did ribavirin-treated mice in the sham-infected group. At day 7, the ribavirin-treated animals had begun to gain weight in the presence of the drug, although the weight gain for infected animals treated with ribavirin and surviving to day 7 was less than the weight gain of the animals in the other treatment groups at day 7. Ribavirin treatment by the i.n. route also did significantly (p < 0.01) not reduce viral lung titers at the dose of 75 mg/kg, with virus titers higher than those in the placebo-treated animals on day 3. Ribavirin therapy appeared to also inhibit clearance of virus from the lungs at day 7 as was seen with i.p. administration, since 4.4 log10 virus was detected in the lungs at this time, whereas none was detected in the placebo-treated mice.
The same experimental design was used to evaluate and verify the unusual finding described above, using smaller mice (8–13 g). Ribavirin i.p. treatment, as before, did not reduce viral lung titers at a dose of 75 mg/kg (Table 3 ) compared to the placebo-treated, infected mice; the titers were significantly higher (p < 0.05). As in previous experiments, virus titers were higher on day 3 and ribavirin treatment inhibited clearance of virus from the lungs at day 7. Similar results were obtained by administering ribavirin i.n., although there appeared to be no enhancement of virus infection at day 3 (Table 3).
Table 3.
Effects of i.p. or i.n. ribavirin treatmenta on SARS-CoV (Urbani) replication in 8–13 g female BALB/c mice
| Intraperitoneal administration |
Intranasal administration |
||||||
|---|---|---|---|---|---|---|---|
| Treatment (mg/kg) | Day of sacrifice | Virus titer (log10 CCID50/g)b | Percent body weight change | Treatment (mg/kg) | Day of sacrifice | Virus titer (log10 CCID50/g)b | Percent body weight change |
| Virus-infected mice | |||||||
| 75c | Day 3 | 5.9 ± 0.4* | −6 | 75 | Day 3 | 4.9 ± 0.3 | −11 |
| Day 7d | 3.7 ± 0.1* | +12 | Day 7 | 4.3 ± 0.4 | +14 | ||
| Placebo | Day 3 | 4.7 ± 0.4 | +22 | Placebo | Day 3 | 5.2 ± 0.4 | +6 |
| Day 7 | 0 | +29 | Day 7 | 0 | +31 | ||
| Uninfected mice | |||||||
| 75 | Day 3 | 0 | −11 | 75 | Day 3 | 0 | −8 |
| Day 7 | 0 | −4 | Day 7 | 0 | +18 | ||
| Placebo | Day 3 | 0 | +7 | Placebo | Day 3 | 0 | +12 |
| Day 7e | 0 | +37 | Day 7 | 0 | +8 | ||
Treatment schedule: 4 h pretreatment, then BID, days 0–2.
Values are expressed as mean ± standard deviation.
Maximum tolerated dose determined in a previous experiment using the same dosage regimen.
One mouse died on day 2, four mice died on day 5, and two mice died on day 6.
Six mice died in this group on day 6.
p ≤ 0.05, comparison: ribavirin-treated, virus-infected groups to PSS-treated, virus-infected groups.
An argument could be made that the 75 mg/kg dose was too high or too frequent and perhaps the mice became immunocompromised, which led to a deleterious inflammatory response or to the inhibition of protective immune responses, allowing the virus to overcome normal host-range specificity that permits normal mice to clear the infection without getting disease. Therefore, experiments were done to evaluate the efficacy of ribavirin at a higher concentration administered as a single dose and to evaluate ribavirin administered at a lower dose using the same dosage regimen described for the previous experiments.
Animals treated with ribavirin at 20 mg/kg/day gained weight as expected from a dose that was lower than the maximum tolerated dose (Table 4 ). However, this dose did not significantly affect lung virus titers and it did not lead to a prolonged infection as happened with the 75 mg/kg dosage regimen. When a higher dose of ribavirin (175 mg/kg) was administered one time on the same day after virus infection, no inhibition of lung virus titers was detected (Table 5 ) and virus was not detected in the lungs of mice sacrificed at day 7 (data not shown).
Table 4.
Effects of i.p. ribavirin treatmenta on SARS-CoV (Urbani) replication in 11–14 g female BALB/c mice
| Treatment (mg/kg) | Day of sacrifice | Virus titer (log10 CCID50/g)b | Percent body weight change |
|---|---|---|---|
| Virus-infected mice | |||
| 20 | Day 3 | 5.5 ± 0.6 | +33 |
| Day 7 | 0 | +10 | |
| Placebo | Day 3 | 5.1 ± 0.2 | +10 |
| Day 7 | 0 | +21 | |
| Uninfected mice | |||
| 20 | Day 3 | 0 | −12* |
| Day 7 | 0 | +18 | |
| Placebo | Day 3 | 0 | +7 |
| Day 7 | 0 | +37 | |
Treatment schedule: 4 h pretreatment, then BID, days 0–2.
Values are expressed as mean ± standard deviation.
p < 0.05, comparison: ribavirin-treated, uninfected group day 3 to PSS-treated, uninfected group day 3.
Table 5.
Effects of single i.p. administration of high concentrations of ribavirin on SARS-CoV (Urbani) replication in 8–14 g female BALB/c mice
| Treatmenta (mg/kg) | Virus titer (log10 CCID50/g)b | Percent body weight change |
|---|---|---|
| Virus-infected mice | ||
| 175 | 4.6 ± 0.4 | +10 |
| 75 | 4.5 ± 0.3 | +40 |
| Placebo | 4.4 ± 0.4 | +9 |
| Uninfected mice | ||
| 175 | 0 | +4 |
| 75 | 0 | −7 |
| Placebo | 0 | +18 |
Animals were sacrificed on day 3. No virus was detected on day 7 in any animal.
Values are expressed as mean ± standard deviation.
Lung homogenates from the first experiment in which ribavirin was administered at 75 mg/kg/day, BID, for 3 days were also analyzed for the presence of cytokines using the Q-plex™ Mouse Cytokine Array system (Table 6 ). Included in the analysis were a number of pro-inflammatory cytokines including IL-1β, IL-6, IL-10, MCP-1, IFN-γ, and TNF-α, some of which have been detected in significant levels in plasma samples from SARS patients (Pang et al., 2003; Zhang et al., 2004, Sheng et al., 2005). The results indicated that on day 3, SARS-CoV infection induced significantly higher levels of cytokines (p = 0.003) in the lungs in response to virus (group-2) exposure than in uninfected mice (group-1). IL-10, MCP-1 (p = 0.05), and MIP-1α concentrations were at least three-fold above levels detected in uninfected, untreated mice. In infected mice (group-2), the levels of IL-1α (p < 0.0001), IL-1β (p = 0.05), IL-6 (p = 0.04), IFN-γ (p = 0.03), TNF-α, GM-CSF, and RANTES (almost two-fold) were greater than two-fold above those found in uninfected, untreated mice (group-1). Ribavirin treatment of infected mice (group-4) on day 3 seemed to ameliorate the induction of the cytokine storm by virus infection, since levels of IL-α (p = 0.02), IL-5 (p = 0.006), MCP-1 (p = 0.04), and GM-CSF (p = 0.02) were significantly higher in the ribavirin-treated animals (group-4) when compared to virus-infected animals (group-2). Ribavirin treatment of uninfected mice (group-3) seemed not to perturb the cytokine response compared to the placebo-treated, uninfected mice (group-1). Levels of cytokines in ribavirin-treated, infected mice (group-4) were somewhat similar to cytokine levels in uninfected, untreated mice (group-1), although the levels of IL-1α (p = 0.002), IL-6 (p = 0.003), IL-12 (p = 0.05), MCP-1 (p = 0.02), and IFN-γ (p = 0.014) were still significantly higher in the ribavirin-treated, infected mice (group-4).
Table 6.
Cytokine levels (pg/ml) detected in lung homogenates from BALB/c mice infected with SARS-CoV and treated with ribavirin
| Treatment |
||||||||
|---|---|---|---|---|---|---|---|---|
| Day 3 |
Day 7 |
|||||||
| No virus, no compound | Virus | Ribavirin | Ribavirin + virus | No virus, no compound | Virus | Ribavirin | Ribavirin + virus | |
| Group-1 | Group-2 | Group-3 | Group-4 | Group-5 | Group-6 | Group-7 | Group-8 | |
| IL-1α | 108.3 ± 7.4a | 418.1 ± 12.4 | 132.8 ± 95.2 | 307.5 ± 41.8 | 117.2 ± 26.5 | 251.1 ± 34.4 | 89.7 ± 58.2 | 339.7 ± 24.8 |
| IL-1β | 61.9 ± 14.1 | 228.6 ± 108.0 | 91.5 ± 75.2 | 101.1 ± 16.3 | 67.3 ± 11.4 | 96.7 ± 4.6 | 53.1 ± 14.4 | 128.9 ± 20.4 |
| IL-2 | 1.4 ± 0.1 | 2.5 ± 0.6 | 1.4 ± 0.6 | 1.9 ± 0.5 | 1.0 ± 0.1 | 3.5 ± 0.2 | 1.3 ± 0.0 | 3.5 ± 1.1 |
| IL-3 | 2.7 ± 0.4 | 3.3 ± 0.6 | 1.4 ± 0.3 | 2.1 ± 1.2 | 2.4 ± 0.1 | 1.9 ± 0.5 | 3.2 ± 0.8 | 1.9 ± 0.2 |
| IL-4 | 5.2 ± 0.7 | 10.1 ± 2.4 | 5.9 ± 3.5 | 6.3 ± 0.3 | 4.8 ± 0.1 | 6.2 ± 0.8 | 4.9 ± 0.9 | 7.3 ± 0.5 |
| IL-5 | 28.3 ± 1.2 | 60.8 ± 8.2 | 25.6 ± 2.0 | 34.2 ± 2.1 | 20.5 ± 5.4 | 34.3 ± 1.4 | 19.8 ± 1.7 | 33.4 ± 0.4 |
| IL-6 | 10.0 ± 1.1 | 46.2 ± 15.3 | 17.0 ± 9.0 | 36.2 ± 6.2 | 4.6 ± 0.9 | 11.6 ± 1.5 | 6.2 ± 0.4 | 20.2 ± 3.2 |
| IL-9 | 129.1 ± 19.4 | 178.2 ± 9.1 | 134.2 ± 39.3 | 140.9 ± 6.7 | 69.9 ± 44.1 | 110.4 ± 21.5 | 101.5 ± 25.7 | 126.3 ± 67.6 |
| IL-10 | 119.7 ± 39.7 | 460.0 ± 400.7 | 77.4 ± 20.1 | 138.9 ± 37.8 | 70.9 ± 15.5 | 156.3 ± 9.4 | 60.7 ± 13.8 | 65.3 ± 21.1 |
| IL-12 | 1235.2 ± 126.8 | 5702.9 ± 2353.8 | 1642.5 ± 630.0 | 1993.8 ± 336.6 | 1408.3 ± 381.4 | 9063.8 ± 730.5 | 915.2 ± 628.8 | 9208.4 ± 943.9 |
| MCP-1 | 764.4 ± 166.1 | 3559.2 ± 1232.1 | 792.9 ± 124.7 | 1578.8 ± 130.8 | 727.1 ± 11.2 | 2574.2 ± 191.7 | 676.3 ± 254.7 | 3576.2 ± 927.9 |
| IFN-γ | 801.2 ± 447.3 | 2276.9 ± 1036.8 | 185.9 ± 8.1 | 1861.6 ± 93.5 | 156.3 ± 9.5 | 3458.7 ± 25.0 | 157.8 ± 1.3 | 2397.0 ± 187.3 |
| TNF-α | 8.9 ± 0.6 | 34.6 ± 12.2 | 10.5 ± 4.2 | 13.6 ± 1.2 | 8.8 ± 0.4 | 19.9 ± 1.1 | 7.9 ± 0.0 | 23.4 ± 1.4 |
| MIP-1α | 61.3 ± 7.7 | 324.6 ± 126.4 | 56.1 ± 14.7 | 185.2 ± 76.9 | 43.5 ± 4.5 | 243.8 ± 56.5 | 40.2 ± 11.3 | 161.9 ± 45.5 |
| GM-CSF | 9.5 ± 2.2 | 24.8 ± 5.2 | 7.9 ± 1.9 | 10.7 ± 0.9 | 7.0 ± 2.4 | 17.9 ± 1.1 | 7.9 ± 0.5 | 15.7 ± 4.2 |
| RANTES | 496.8 ± 74.9 | 1083.1 ± 370.3 | 334.0 ± 45.2 | 634.0 ± 586.5 | 583.5 ± 191.5 | 1019.7 ± 43.1 | 213.2 ± 84.5 | 829.0 ± 171.4 |
Values are expressed as mean ± standard deviation. Comparisons with significant differences are noted in Section 3.
In contrast to the cytokine profiles found on day 3, the cytokine profiles were somewhat different in infected animals (group-6) and infected animals treated with ribavirin (group-8) when compared to placebo-treated animals (group-5) and held until day 7 (p = 0.003). Cytokine levels in virus-infected mice (group-6) which were still significantly increased compared to control animals (group-5) were IL-2 (p = 0.009), IL-6 (p = 0.05), IL-10 (p = 0.04), IL-12 (p = 0.01), MCP-1 (p = 0.04), IFN-γ (p < 0.0001), TNF-α (p = 0.01), and GM-CSF (p = 0.05) (Table 6). Other cytokines were also increased as well, including IL-1α and IL-1β, IL-5, IL-9, MIP-1α, and RANTES. At day 7 in infected mice treated with ribavirin (group-8), IL-1α (p = 0.03), IL-4 (p = 0.04), IL-6 (p = 0.04), IL-12 (p = 0.01), IFN-γ (p = 0.007), and TNF-α (p = 0.01) were still elevated in infected mice when compared to the untreated, uninfected animals (group-5). When the cytokines levels of the ribavirin-treated, infected animals (group-8) were compared to those of the virus-infected animals (group-6), only the levels of IFN-γ (0.03) were significantly lower on the ribavirin-treated, infected animals; the remaining cytokines levels were similar in both groups. For these three groups of mice, cytokine levels of IL-6 (p ≤ 0.05), IL-12 (p ≤ 0.02), IFN-γ (p ≤ 0.07), and TNF-α (p = 0.01) remained significantly higher in both the virus-infected (group-6) and virus-infected, treated animals (group-8) at day 7 when compared to the untreated, uninfected control group of animals (group-5) at day 7. In addition, 10 other cytokines seemed to be at higher levels in both the virus-infected (group-6) and virus-infected, treated animals (group-8) at day 7 when compared to the control group of animals (group-5) at day 7, although these increases were not statistically different. IL-3 was the only cytokine that seemed to be reduced in both the virus-infected animals (group-6) and in the ribavirin-treated, infected mice (group-8) compared to the control animals (group-5).
Ribavirin is an IMP dehydrogenase inhibitor and inhibition of this enzyme by ribavirin is one mechanism whereby ribavirin inhibits RNA virus infections. It could conceivably inhibit RNA viruses by other mechanisms such as inhibition of viral polymerase activity by the 5′-triphosphate metabolite of ribavirin, inhibition of viral capping guanylyltransferase activity (viral or cellular) by ribavirin 5′-triphosphate, and induction of mutations in the viral genome (Leyssen et al., 2005). Thus, inhibition of virus replication could occur by one or more of these mechanisms.
The in vitro data suggested that perhaps ribavirin and the other IMP dehydrogenase inhibitors only modestly inhibited SARS-CoV replication in vitro or not all (Table 1). Would other IMP dehydrogenase inhibitors enhance SARS-CoV replication in mice or would they simply be inactive as demonstrated in vitro? Therefore, the effects of treatment with other IMP dehydrogenase inhibitors were evaluated for the ability to reduce lung virus titers using the standard efficacy testing protocol described above. Doses evaluated for each compound were near the maximum tolerated dose determined for each in previous experiments or at a dose approximately 10-fold lower than the maximum tolerated dose (data not shown). The results indicated that in EICAR- and mycophenolic acid-treated mice, the lung virus titers increased with increasing dosage, although these increases in lung virus titers were not quite significantly different from the lung virus titers in placebo-treated, infected mice (Table 7 ). However, even though the trend for enhancing virus titers was detected, these compounds did not prolong the lung infection as ribavirin did; no virus was detected at day 7 (data not shown).
Table 7.
Effects of i.p. treatmenta with other IMP dehydrogenase inhibitors on SARS-CoV (Urbani) replication in 12–16 g female BALB/c mice
| Compound | Treatment (mg/kg) | Virus titer (log10 CCID50/g) ± S.D.b |
|
|---|---|---|---|
| Day 3 | Day 7 | ||
| EICAR | 75c | 5.5 ± 0.5 | 0 |
| 10 | 5.3 ± 0.3 | 0 | |
| PSS | 5.1 ± 0.6 | 0 | |
| Mizoribine | 25c | 4.9 ± 0.3 | 0 |
| 2.5 | 4.7 ± 0.6 | 0 | |
| PSS | 4.8 ± 0.4 | 0 | |
| Mycophenolic acid | 75c | 5.5 ± 0.2 | 0 |
| 10 | 5.3 ± 0.5 | 0 | |
| PSS | 5.1 ± 0.6 | 0 | |
4 h pretreatment, then BID, days 0–2.
Values are expressed as mean ± standard deviation and represent titers from day 3.
Maximum tolerated dose determined in a previous experiment using the same dosage regimen.
4. Discussion
Although a number of laboratories have shown ribavirin to be efficacious in inhibiting SARS-CoV in vitro (Koren et al., 2003, Chen et al., 2004, Chu et al., 2004, Yamamoto et al., 2004, Morgenstern et al., 2005, Saijo et al., 2005), other laboratories have found ribavirin not to inhibit the virus in vitro (Huggins, 2003, Cinatl et al., 2003a, Cinatl et al., 2003b, Barnard et al., 2004a, Ströher et al., 2004, Tan et al., 2004). There are no current data demonstrating efficacy in vivo, at least in animals. The in vitro studies described in the current report have demonstrated that ribavirin was inactive in various strains of Vero cells, probably due to lack of phosphorylation to the active triphosphate form (Hong and Cameron, 2004, Morgenstern et al., 2005). In other cell lines such as Caco-2, PK-15, CL-14, HPEK, and MA-104, presumably capable of phosphorylating ribavirin to the triphosphate form, ribavirin was found to be efficacious (IC50 = 2–60 μg/ml) at concentrations that could be achieved clinically (Morgenstern et al., 2005). In the current study, ribavirin evaluated in Vero 76 cells was active at around 270 μM (IC50 ∼ 660 μg/ml), but was also toxic (average CC50 = 690 μM, ∼1685 μg/ml). In our studies, ribavirin was also only inhibitory at very high concentrations in MA-104 cells and CaCo-2 cells and not selectively inhibitory in either cell line. In a number of the studies cited above (Tan et al., 2004, Saijo et al., 2005), especially those showing the efficacy of combinational therapy with interferon (Morgenstern et al., 2005), there was a failure to report or to do rigorous (i.e., spectrophotometric analysis) cytotoxicity evaluations. Alternatively, the duration of the assays was so short that toxicity may have been minimized, although in our studies ribavirin was still only inhibitory at very high concentrations. Thus, based on the in vitro data, it has been very difficult to determine if ribavirin is efficacious independent of toxicity and to determine if it should be recommended for treating SARS infections.
In a number of clinical studies, ribavirin (Lee et al., 2004, Ströher et al., 2004, Wang et al., 2004) or ribavirin plus corticosteroids (Peiris et al., 2003, So et al., 2003) were initially used on a limited basis to treat patients with SARS. Retrospective analysis of those studies did not demonstrate the efficacy of ribavirin (Mazzulli et al., 2004, Leong et al., 2004), except in one study in which treatment with ribavirin plus steroid was associated with a better outcome than ribavirin treatment alone (Cheng et al., 2004). Most studies did not find any association of ribavirin with reduced viral loads (Mazzulli et al., 2004). In addition, two patients treated with ribavirin early in the infection (days 4 and 6 of illness) seemed to have the highest virus titers in the lungs upon post mortem examination when compared to other patients (Mazzulli et al., 2004), although Wang et al. (2004) reported that ribavirin reduced viral loads in five of eight patients. In addition to the apparent lack of efficacy in most studies, the risk of ribavirin-induced anemia along with hypoxia resulted in increased risk of death in the treated SARS patients (Chiou et al., 2005). Thus, ribavirin may not be useful for treating SARS infections because of its questionable efficacy and because of its known toxicity (reviewed by van Vonderen et al., 2003, Lai, 2005).
These conflicting data prompted the present studies in which ribavirin was evaluated in a mouse lung replication model in which no pathogenesis is detected, but in which virus replicates to high titers in the lungs and often in the snout (Subbarao et al., 2004). The maximum tolerated dose given over the first 3 days of infection increased virus loads in the lungs and in fact appeared to increase viral loads and prolong the infection in the lungs. This finding is in harmony with the human studies cited above.
The mechanism whereby ribavirin may enhance the infection remains obscure. As has been shown by examination of sera from patients with active SARS infections (Mazzulli et al., 2004, Pang et al., 2003), infection of mice with SARS-CoV also triggered a large increase in inflammatory chemokines in C57BL/6 mice (Glass et al., 2004). Large increases in pro-inflammatory cytokines in the sera of patients recovering from SARS infections (Wang et al., 2005) have also been detected. Likewise, we have shown a large increase in pro-inflammatory cytokines in the lungs of BALB/c mice. Virus lung titers detected in ribavirin-treated mice (group-8) on day 7 apparently corresponded with a concomitant increase in the levels of a number of pro-inflammatory cytokines (IL-1α, IL-1β, IL-6, and MCP-1) in the lungs of infected, ribavirin-treated animals (group-8) at this time as opposed to the normal levels of cytokines detected in infected control (group-6) animals at day 7. In contrast, levels of IL-10 and IFN-γ, in particular, were substantially higher in the virus-infected mice (group-6). However, the virus in the lung was cleared in infected animals not treated with ribavirin virus (group-6), but was present at high levels in the lungs of ribavirin-treated, infected animals (group-8). This observation may reflect the finding in vitro that IFN-γ, along with IFN-α or IFN-β, can reduce virus titers detected in cell culture to below detectable limits (Cinatl et al., 2003a, Cinatl et al., 2003b, Scagnolari et al., 2004) accounting for the lack of detectable virus in the group-6 animals. The lack of interferon in the ribavirin-treated, infected animals may be due to the lack of sufficient IFN-γ levels to control the virus.
In contrast, on day 3 in infected mice treated with ribavirin the pro-inflammatory cytokine levels were all lower than in infected, untreated mice, although only the decreases of IL-1α, IL-5, and IL-9 were significantly different. These cytokine results suggest that ribavirin may have mediated the cytokine inflammatory response at day 3. However, the virus loads in ribavirin-treated infected mice were significantly greater than in the untreated, infected mice and suggest that the return of cytokines to normal levels was not enough to inhibit viral replication. Thus, in a SARS mouse infection the response of the animal may be first characterized by a viral replication phase that then induces an immune phase that contributes to pathogenesis and disease.
These findings also suggest that ribavirin may actually contribute to the pathogenesis of SARS-CoV by prolonging and/or enhancing viral replication in the lungs, thus providing a continual source of stimulation for the inflammatory response thought to contribute to the pathogenesis of the infection (Li et al., 2004). The possibility also exists that ribavirin might have immunomodulatory properties which adversely affect the clearance of SARS-CoV from the lungs, at least in mice. For example, ribavirin can have an indirect immunomodulatory effect, as it has been shown to decrease the release of pro-inflammatory cytokines from macrophages of mice (Cheng et al., 2004). It also has been shown to suppress IL-10 levels in BALB/c mice (Tam et al., 1999) as it did initially in the current study. Ribavirin has been shown to switch the immune response of mice infected with mouse hepatitis virus, another coronavirus, from a Th-2 to Th-1 response (Ning et al., 1998). In agreement with these findings, ribavirin has been reported to promote T-cell mediated immunity such as the induction of INF-γ, TNF-α, and IL-2 (Tam et al., 2002), none of which were enhanced in the presence of ribavirin in SARS infected mice in our study. Alternatively, one could argue that inbred animals could have some potential genetic defect responsible for enhancement of virus infection in the presence of ribavirin. However, other studies in our laboratory indicate that totally unrelated compounds, such as promazine, also enhance viral infection at certain doses (Barnard et al., 2006). However, it would be interesting to evaluate ribavirin in outbred animals infected with SARS-CoV.
By initially suppressing the virus-induced cytokine storm (including IL-1α, IL-5, and IL-9) in infected mice, ribavirin may have upset the balance and timing of the Th1 and Th2 responses. Thus, ribavirin treatment may have altered the cytokine environment in the lung to allow viral persistence (i.e., polarized to a Th1 response) and to select against the development of responses such as neutralizing antibody that would normally abrogate viral replication (Hong and Cameron, 2004). The cytokines levels in mice at day 7 support this hypothesis, since some Th1-associated cytokines were at abnormally high levels at day 7.
Finally, other IMP dehydrogenase inhibitors seemed to have also enhanced the SARS-CoV infection in mice, although to a lesser extent than did ribavirin. This could suggest that a certain cell type essential for viral clearance such as type I pneumocytes or alveolar macrophages may have been functionally inhibited or induced to apoptosis, thus leading to the escape of virus from the initially important first line of defense that prevents or limits viral infection. Supporting this hypothesis are the following studies. IMP dehydrogenase inhibitors have been shown to induce apoptosis in a number of cell types (Jayaram et al., 2002, Meier et al., 2003, Khanna et al., 2004, Anatol et al., 2005, Ishitsuka et al., 2005). Mycophenolic acid has been shown to suppress production of pro-inflammatory cytokines, nitric oxide, and LDH in macrophages as well as inhibit the enzyme IMP dehydrogenase in the macrophages (Jonsson and Carlsten, 2002). This suppression of metabolic activities was probably a function of the IMP dehydrogenase inhibitory properties of the mycophenolic acid, since all of the suppressed activities could be reversed with the addition of guanosine. In addition, mycophenolate mofetil has been shown to inhibit differentiation, maturation, and allostimulatory functions of human monocyte-derived dendritic cells (Colic et al., 2003). Ribavirin has also been shown to inhibit macrophage production of pro-inflammatory cytokines and Th2 cytokines while preserving Th1 cytokine induction (Ning et al., 1998). Thus, under the right conditions IMP dehydrogenase inhibitors may actually promote viral infections by suppressing the function of or inhibiting cell types necessary for normal clearance of virus.
The results strongly suggest that using ribavirin as therapy for treating SARS infections should be reconsidered until further animal studies clarify the effects of ribavirin on cytokine and chemokine profiles during an infection and until ribavirin can be demonstrated to have a significant effect on reducing viral replication in vivo.
Acknowledgements
This work was supported by contracts NO1-AI-30048 and NO1-AI-15345 from the Virology Branch, NIAID, National Institutes of Health.
References
- Allison A.C. Immunosuppressive drugs: the first 50 years and a glance forward. Immunopharmacology. 2000;47:63–83. doi: 10.1016/s0162-3109(00)00186-7. [DOI] [PubMed] [Google Scholar]
- Anatol P., Danuta P., Janusz D., Bozena P. Expression of bcl-2 protein in chronic hepatitis C: effect of interferon alpha 2b with ribavirin therapy. World J. Gastroenterol. 2005;11:2949–2952. doi: 10.3748/wjg.v11.i19.2949. [DOI] [PMC free article] [PubMed] [Google Scholar]
- Barnard D.L., Bischofberger N., Kim C.U., Huffman J.H., Sidwell R.W., Dougherty J.P., Lew W., Williams M.A., Yang W. Acyclic phosphonomethylether nucleoside inhibitors of respiratory viruses. Antivir. Chem. Chemother. 1997;8:223–233. [Google Scholar]
- Barnard D.L., Hubbard V.D., Burton J., Smee D.F., Morrey J.D., Otto M.J., Sidwell R.W. Inhibition of severe acute respiratory syndrome-associated coronavirus (SARSCoV) by calpain inhibitors and β-d-N4-hydroxycytidine. Antivir. Chem. Chemother. 2004;15:15–22. doi: 10.1177/095632020401500102. [DOI] [PubMed] [Google Scholar]
- Barnard D.L., Hubbard V.D., Smee D.F., Sidwell R.W., Watson K.G.W., Tucker S.P.T., Reece P.A.R. In vitro activity of second generation pyridazinyl oxime ethers related to pirodavir: novel capsid-binding inhibitors with potent anti-picornavirus activity. Antimicrob. Agents Chemother. 2004;48:1766–1772. doi: 10.1128/AAC.48.5.1766-1772.2004. [DOI] [PMC free article] [PubMed] [Google Scholar]
- Barnard D.L., Day C.W., Montgomery R., Heiner M., Bailey K., Lauridsen L.J., Sidwell R.W. Efficacy of an anti-psychotic, 10-(3-(dimethylamino)propyl)phenothiazine (promazine), for inhibiting SARS-CoV replication in a mouse model. VIII International Symposium on Respiratory Viral Infections; March 16–19; 2006. Session V. [Google Scholar]
- Cavenaugh P.R., Jr., Moskwa P.S., Donish W.H., Pera P.J., Richardson D., Andrese A.P. A semi-automated NR red based chemosensitivity assay for drug screening. Investig. New Drugs. 1990;8:347–354. doi: 10.1007/BF00198590. [DOI] [PubMed] [Google Scholar]
- Chen F., Chan K.H., Jiang Y., Kao R.Y., Lu H.T., Fan K.W., Cheng V.C., Tsui W.H., Hung I.F., Lee T.S., Guan Y., Peiris J.S., Yuen K.Y. In vitro susceptibility of 10 clinical isolates of SARS coronavirus to selected antiviral compounds. J. Clin. Virol. 2004;31:69–75. doi: 10.1016/j.jcv.2004.03.003. [DOI] [PMC free article] [PubMed] [Google Scholar]
- Cheng V.C., Tang B.S., Wu A.K., Chu C.M., Yuen K.Y. Medical treatment of viral pneumonia including SARS in immunocompetent adult. J. Infect. 2004;49:262–273. doi: 10.1016/j.jinf.2004.07.010. [DOI] [PMC free article] [PubMed] [Google Scholar]
- Chiou H.E., Liu C.L., Buttrey M.J., Kuo H.P., Liu H.W., Kuo H.T., Lu Y.T. Adverse effects of ribavirin and outcome in severe acute respiratory syndrome: experience in two medical centers. Chest. 2005;128:263–272. doi: 10.1378/chest.128.1.263. [DOI] [PMC free article] [PubMed] [Google Scholar]
- Chu C.M., Cheng V.C., Hung I.F., Wong M.M., Chan K.H., Chan K.S., Kao R.Y., Poon L.L., Wong C.L., Guan Y., Peiris J.S., Yuen K.Y., HKU/UCH SARS Study Group Role of lopinavir/ritonavir in the treatment of SARS: initial virological and clinical findings. Thorax. 2004;59:252–256. doi: 10.1136/thorax.2003.012658. [DOI] [PMC free article] [PubMed] [Google Scholar]
- Cinatl J., Morgenstern B., Bauer G., Chandra P., Rabenau H., Doerr H.W. Treatment of SARS with human interferons. Lancet. 2003;362:293–294. doi: 10.1016/S0140-6736(03)13973-6. [DOI] [PMC free article] [PubMed] [Google Scholar]
- Cinatl J., Morgenstern B., Bauer G., Chandra P., Rabenau H., Doerr H.W. Glycyrrhizin, an active component of liquorice roots, and replication of SARS-associated coronavirus. Lancet. 2003;361:2045–2046. doi: 10.1016/S0140-6736(03)13615-X. [DOI] [PMC free article] [PubMed] [Google Scholar]
- Cinatl J., Jr., Michaelis M., Hoever G., Preiser W., Doerr H.W. Development of antiviral therapy for severe acute respiratory syndrome. Antivir. Res. 2005;66:81–97. doi: 10.1016/j.antiviral.2005.03.002. [DOI] [PMC free article] [PubMed] [Google Scholar]
- Colic M., Stojic-Vukanic Z., Pavlovic B., Jandric D., Stefanoska I. Mycophenolate mofetil inhibits differentiation, maturation and allostimulatory function of human monocyte-derived dendritic cells. Clin. Exp. Immunol. 2003;134:63–69. doi: 10.1046/j.1365-2249.2003.02269.x. [DOI] [PMC free article] [PubMed] [Google Scholar]
- Glass W.G., Subbarao K., Murphy B., Murphy P.M. Mechanisms of host defense following severe acute respiratory syndrome-coronavirus (SARS-CoV) pulmonary infection of mice. J. Immunol. 2004;173:4030–4039. doi: 10.4049/jimmunol.173.6.4030. [DOI] [PubMed] [Google Scholar]
- Hong Z., Cameron C.E. Pleiotropic mechanisms of ribavirin antiviral activities. Prog. Drug Res. 2004;59:41–69. doi: 10.1007/978-3-0348-8171-5_2. [DOI] [PubMed] [Google Scholar]
- Huggins J.W. Severe acute respiratory syndrome (SARS) and coronavirus testing—United States. Morb. Mortal. Wkly. Rep. 2003;52:297–302. [PubMed] [Google Scholar]
- Hui D.S., Wong G.W. Advancements in the battle against severe acute respiratory syndrome. Expert Opin. Pharmacother. 2004;5:1687–1693. doi: 10.1517/14656566.5.8.1687. [DOI] [PubMed] [Google Scholar]
- Ishitsuka K., Hideshima T., Hamasaki M., Raje N., Kumar S., Podar K., Le Gouill S., Shiraishi N., Yasui H., Roccaro A.M., Tai Y.Z., Chauhan D., Fram R., Tamura K., Jain J., Anderson K.C. Novel inosine monophosphate dehydrogenase inhibitor VX-944 induces apoptosis in multiple myeloma cells primarily via caspase-independent AIF/Endo G pathway. Oncogene. 2005;24:5888–5896. doi: 10.1038/sj.onc.1208739. [DOI] [PubMed] [Google Scholar]
- Jayaram H.N., Yalowitz J.A., Arguello F., Greene J.F., Jr. Toxicity and efficacy of benzamide riboside in cancer chemotherapy models. Curr. Med. Chem. 2002;9:787–792. doi: 10.2174/0929867024606858. [DOI] [PubMed] [Google Scholar]
- Jonsson C.A., Carlsten H. Mycophenolic acid inhibits inosine 5′-monophosphate dehydrogenase and suppresses production of pro-inflammatory cytokines, nitric oxide, and LDH in macrophages. Cell. Immunol. 2002;216:93–101. doi: 10.1016/s0008-8749(02)00502-6. [DOI] [PubMed] [Google Scholar]
- Khanna N., Jayaram H.N., Singh N. Benzamide riboside induced mitochondrial mediated apoptosis in human lung cancer H520 cells. Life Sci. 2004;75:179–190. doi: 10.1016/j.lfs.2003.11.026. [DOI] [PubMed] [Google Scholar]
- Koren G., King S., Knowles S., Phillips E. Ribavirin in the treatment of SARS: a new trick for an old drug? CMAJ. 2003;168:1289–1292. [PMC free article] [PubMed] [Google Scholar]
- Lai S.T. Treatment of severe acute respiratory syndrome. Eur. J. Clin. Microbiol. Infect. Dis. 2005;(September):1–9. doi: 10.1007/s10096-005-0004-z. (Epub ahead of print) [DOI] [PMC free article] [PubMed] [Google Scholar]
- Lee N., Allen Chan K.C., Hui D.S., Ng E.K., Wu A., Chiu R.W., Wong V.W., Chan P.K., Wong K.T., Wong E., Cockram C.S., Tam J.S., Sung J.J., Lo Y.M. Effects of early corticosteroid treatment on plasma SARS-associated coronavirus RNA concentrations in adult patients. J. Clin. Virol. 2004;31:304–309. doi: 10.1016/j.jcv.2004.07.006. [DOI] [PMC free article] [PubMed] [Google Scholar]
- Leong H.N., Ang B., Earnest A., Teoh C., Xu W., Leo Y.S. Investigational use of ribavirin in the treatment of severe acute respiratory syndrome, Singapore, 2003. Trop. Med. Int. Health. 2004;9:923–927. doi: 10.1111/j.1365-3156.2004.01281.x. [DOI] [PMC free article] [PubMed] [Google Scholar]
- Leyssen P., Balzarini J., De Clercq E., Neyts J. The predominant mechanism by which ribavirin exerts its antiviral activity in vitro against flaviviruses and paramyxoviruses is mediated by inhibition of IMP dehydrogenase. J. Virol. 2005;79:1943–1947. doi: 10.1128/JVI.79.3.1943-1947.2005. [DOI] [PMC free article] [PubMed] [Google Scholar]
- Li Y., Luo C., Li W., Xu Z., Zeng C., Bi S., Yu J., Wu J., Yang H. Structure-based preliminary analysis of immunity and virulence of SARS coronavirus. Vir. Immunol. 2004;17:528–534. doi: 10.1089/vim.2004.17.528. [DOI] [PubMed] [Google Scholar]
- Mazzulli T., Farcas G.A., Poutanen S.M., Willey B.M., Low D.E., Butany J., Asa S.L., Kain K.C. Severe acute respiratory syndrome-associated coronavirus in lung tissue. Emerg. Infect. Dis. 2004;10:20–24. doi: 10.3201/eid1001.030404. [DOI] [PMC free article] [PubMed] [Google Scholar]
- Meier V., Burger E., Mihm S., Saile B., Ramadori G. Ribavirin inhibits DNA, RNA, and protein synthesis in PHA-stimulated human peripheral blood mononuclear cells: possible explanation for therapeutic efficacy in patients with chronic HCV infection. J. Med. Virol. 2003;69:50–58. doi: 10.1002/jmv.10264. [DOI] [PubMed] [Google Scholar]
- Morgenstern B., Michaelis M., Baer P.C., Doerr H.W., Cinatl J., Jr. Ribavirin and interferon-beta synergistically inhibit SARS-associated coronavirus replication in animal and human cell lines. Biochem. Biophys. Res. Commun. 2005;326:905–908. doi: 10.1016/j.bbrc.2004.11.128. [DOI] [PMC free article] [PubMed] [Google Scholar]
- Ning Q., Brown D., Parodo J., Cattral M., Gorczynski R., Cole E., Fung L., Ding J.W., Liu M.F., Rotstein O., Phillips M.J., Levy G. Ribavirin inhibits viral-induced macrophage production of TNF, IL-1, the production of procoagulant fgl2 prothrombinase, and preserves Th1 cytokine production but inhibits Th2 cytokine response. J. Immunol. 1998;160:3487–3493. [PubMed] [Google Scholar]
- Oxford J.S., Balasingam S., Chan C., Catchpole A., Lambkin R. New antiviral drugs, vaccines and classic public health interventions against SARS coronavirus. Antivir. Chem. Chemother. 2005;16:13–21. doi: 10.1177/095632020501600102. [DOI] [PubMed] [Google Scholar]
- Pang B.S., Wang Z., Zhang L.M., Tong Z.H., Xu L.L., Huang X.X., Guo W.J., Zhu M., Wang C. Dynamic changes and the meanings of blood cytokines in severe acute respiratory syndrome. Chin. Med. J. 2003;26:586–589. [PubMed] [Google Scholar]
- Pankiewicz K.W., Patterson S.E., Black P.L., Jayaram H.N., Risal D., Goldstein B.M., Stuyver L.J., Schinazi R.F. Cofactor mimics as selective inhibitors of NAD-dependent inosine monophosphate dehydrogenase (IMPDH)—the major therapeutic target. Curr. Med. Chem. 2004;11:887–900. doi: 10.2174/0929867043455648. [DOI] [PubMed] [Google Scholar]
- Peiris J.S., Chu C.M., Cheng V.C., Chan K.S., Hung I.F., Poon L.L., Law K.I., Tang B.S., Hon T.Y., Chan C.S., Chan K.H., Ng J.S., Zheng B.J., Ng W.L., Lai R.W., Guan Y., Yuen K.Y., HKU/UCH SARS Study Group Clinical progression and viral load in a community outbreak of coronavirus-associated SARS pneumonia: a prospective study. Lancet. 2003;361:1767–1772. doi: 10.1016/S0140-6736(03)13412-5. [DOI] [PMC free article] [PubMed] [Google Scholar]
- Reed L.J., Muench N. A simple method of estimating fifty per cent endpoints. Am. J. Hyg. 1938;27:493–497. [Google Scholar]
- Saijo M., Morikawa S., Fukushi S., Mizutani T., Hasegawa H., Nagata N., Iwata N., Kurane I. Inhibitory effect of mizoribine and ribavirin on the replication of severe acute respiratory syndrome (SARS)-associated coronavirus. Antivir. Res. 2005;66:159–163. doi: 10.1016/j.antiviral.2005.01.003. [DOI] [PMC free article] [PubMed] [Google Scholar]
- Scagnolari C., Vicenzi E., Bellomi F., Stillitano M.G., Pinna D., Poli G., Clementi M., Dianzani F., Antonelli G. Increased sensitivity of SARS-coronavirus to a combination of human type I and type II interferons. Antivir. Ther. 2004;9:1003–1011. [PubMed] [Google Scholar]
- Sheng W.H., Chiang B.L., Chang S.C., Ho H.N., Wang J.T., Chen Y.C., Hsiao C.H., Hseuh P.R., Chie W.C., Yang P.C. Clinical manifestations and inflammatory cytokine responses in patients with severe acute respiratory syndrome. J. Formos. Med. Assoc. 2005;104:715–723. [PubMed] [Google Scholar]
- Shigeta S. Recent progress in antiviral chemotherapy for respiratory syncytial virus infections. Expert Opin. Investig. Drugs. 2000;9:221–235. doi: 10.1517/13543784.9.2.221. [DOI] [PubMed] [Google Scholar]
- So L.K., Lau A.C., Yam L.Y., Cheung T.M., Poon E., Yung R.W., Yuen K.Y. Development of a standard treatment protocol for severe acute respiratory syndrome. Lancet. 2003;361:1615–1617. doi: 10.1016/S0140-6736(03)13265-5. [DOI] [PMC free article] [PubMed] [Google Scholar]
- Ströher U., DiCaro A., Li Y., Strong J.E., Aoki F., Plummer F., Jones S.M., Feldmann H. Severe acute respiratory syndrome-related coronavirus is inhibited by interferon-alpha. J. Infect. Dis. 2004;189:1164–1167. doi: 10.1086/382597. [DOI] [PMC free article] [PubMed] [Google Scholar]
- Subbarao K., McAuliffe J., Vogel L., Fahle G., Fischer S., Tatti K., Packard M., Shieh W.J., Zaki S., Murphy B. Prior infection and passive transfer of neutralizing antibody prevent replication of severe acute respiratory syndrome coronavirus in the respiratory tract of mice. J. Virol. 2004;78:3572–3577. doi: 10.1128/JVI.78.7.3572-3577.2004. [DOI] [PMC free article] [PubMed] [Google Scholar]
- Tam R.C., Lim C., Bard J., Pai B. Contact hypersensitivity responses following ribavirin treatment in vivo are influenced by type 1 cytokine polarization, regulation of IL-10 expression, and costimulatory signaling. J. Immunol. 1999;163:3709–3717. [PubMed] [Google Scholar]
- Tam R.C., Lau J.Y., Hong Z. Mechanisms of action of ribavirin in antiviral therapies. Antivir. Chem. Chemother. 2002;12:261–272. doi: 10.1177/095632020101200501. [DOI] [PubMed] [Google Scholar]
- Tan E.L., Ooi E.E., Lin C.Y., Tan H.C., Ling A.E., Lim B., Stanton L.W. Inhibition of SARS coronavirus infection in vitro with clinically approved antiviral drugs. Emerg. Infect. Dis. 2004;10:581–586. doi: 10.3201/eid1004.030458. [DOI] [PMC free article] [PubMed] [Google Scholar]
- van Vonderen M.G., Bos J.C., Prins J.M., Wertheim-van Dillen P., Speelman P. Ribavirin in the treatment of severe acute respiratory syndrome (SARS) Neth. J. Med. 2003;61:238–241. [PubMed] [Google Scholar]
- Vincenti F. Immunosuppression minimization: current and future trends in transplant immunosuppression. J. Am. Soc. Nephrol. 2003;14:1940–1948. doi: 10.1097/01.asn.0000076844.59963.cf. [DOI] [PubMed] [Google Scholar]
- Wang W.K., Chen S.Y., Liu I.J., Kao C.L., Chen H.L., Chiang B.L., Wang J.T., Sheng W.H., Hsueh P.R., Yang C.F., Yang P.C., Chang S.C. Temporal relationship of viral load, ribavirin, interleukin (IL)-6, IL-8, and clinical progression in patients with severe acute respiratory syndrome. Clin. Infect. Dis. 2004;39:1071–1075. doi: 10.1086/423808. [DOI] [PMC free article] [PubMed] [Google Scholar]
- Wang C.H., Liu C.Y., Wan Y.L., Chou C.L., Huang K.H., Lin H.C., Lin S.M., Lin T.Y., Chung K.F., Kuo H.P. Persistence of lung inflammation and lung cytokines with high-resolution CT abnormalities during recovery from SARS. Respir. Res. 2005;6:42. doi: 10.1186/1465-9921-6-42. [DOI] [PMC free article] [PubMed] [Google Scholar]
- Yamamoto N., Yang R., Yoshinaka Y., Amari S., Nakano T., Cinatl J., Rabenau H., Doerr H.W., Hunsmann G., Otaka A., Tamamura H., Fujii N., Yamamoto N. HIV protease inhibitor nelfinavir inhibits replication of SARS-associated coronavirus. Biochem. Biophys. Res. Commun. 2004;318:719–725. doi: 10.1016/j.bbrc.2004.04.083. [DOI] [PMC free article] [PubMed] [Google Scholar]
- Zhang Y., Li J., Zhan Y., Wu L., Yu X., Zhang W., Ye L., Xu S., Sun R., Wang Y., Lou J. Analysis of serum cytokines in patients with severe acute respiratory syndrome. Infect. Immun. 2004;72:4410–4415. doi: 10.1128/IAI.72.8.4410-4415.2004. [DOI] [PMC free article] [PubMed] [Google Scholar]
- Zhao Z., Zhang F., Xu M., Huang K., Zhong W., Cai W., Yin Z., Huang S., Deng Z., Wei M., Xiong J., Hawkey P.M. Description and clinical treatment of an early outbreak of severe acute respiratory syndrome (SARS) in Guangzhou, PR China. J. Med. Microbiol. 2003;52:715–720. doi: 10.1099/jmm.0.05320-0. [DOI] [PubMed] [Google Scholar]