

Graphical abstract
Keywords: Cellular heterogeneity, Transcriptomic heterogeneity, Cancer stem cell, Triple negative breast cancer, Single-cell analysis, Splice variants, Fluidigm Polaris, RNA-sequencing
Abstract
Tumor heterogeneity is generated through a combination of genetic and epigenetic mechanisms, the latter of which plays an important role in the generation of stem like cells responsible for tumor formation and metastasis. Although the development of single cell transcriptomic technologies holds promise to deconvolute this complexity, a number of these techniques have limitations including drop-out and uneven coverage, which challenge the further delineation of tumor heterogeneity. We adopted deep and full-length single-cell RNA sequencing on Fluidigm’s Polaris platform to reveal the cellular, transcriptomic, and isoform heterogeneity of SUM149, a triple negative breast cancer (TNBC) cell line. We first validate the quality of the TNBC sequencing data with the sequencing data from erythroleukemia K562 cell line as control. We next scrutinized well-defined marker genes for cancer stem-like cell to identify different cell populations. We then profile the isoform expression data to investigate the heterogeneity of alternative splicing patterns. Though classified as triple-negative breast cancer, the SUM149 stem cells show heterogeneous expression of marker receptors (ER, PR, and HER2) across the cells. We identified three cell populations that express patterns of stemness: epithelial-mesenchymal transition (EMT) cancer stem cells (CSCs), mesenchymal-epithelial transition (MET) CSCs and Dual-EMT-MET CSCs. These cells also manifested a high level of heterogeneity in alternative splicing patterns. For example, CSCs have shown different expression patterns of the CD44v6 exon, as well as different levels of truncated EGFR transcripts, which may suggest different potentials for proliferation and invasion among cancer stem cells. Our study identified features of the landscape of previously underestimated cellular, transcriptomic, and isoform heterogeneity of cancer stem cells in triple-negative breast cancers.
1. Introduction
Extensive heterogeneity at both cellular and transcriptomic levels remains a challenge for breast cancer research and therapy [1], [2]. Based on the presence or absence of protein markers: estrogen receptor (ER), progesterone receptor (PR) and human epidermal growth factor receptor 2 (HER2), breast cancers are typically classified into four subtypes: luminal A, luminal B, HER2-enriched, and triple-negative breast cancers [3]. This classification forms the major determinant of treatment, which primarily targets these receptors. However, it is apparent that there is great inter-tumor heterogeneity within each of these molecular subtypes [4], [5]. Furthermore, tumors display significant intra-tumor heterogeneity generated through genetic and epigenetic mechanisms [6]. The latter leads to a hierarchical development of tumor cells from the precursor cancer stem-like cells (CSCs), which drives tumorigenesis and metastasis [7]. These CSCs also contribute to therapeutic resistance through multiple mechanisms [8], [9], [10], [11]. In addition to commonly investigated heterogeneity of cell types and gene expressions, alternative splicing of transcripts generates an additional level of complexity contributing to heterogeneity [12], [13]. For example, CD44, first described as a marker of breast CSCs [14] has multiple splice variants. The CD44v6 isoform has been significantly associated with metastasis in bulk breast tumor [15], [16] but its relationship with different cell types as well as its expression pattern at the single-cell level remains to be defined. New methods for studying these sources of cellular transcriptomic heterogeneity are now feasible.
Most research on cellular heterogeneity of breast cancers has been limited to bulk tumor samples, supporting the classification into four subtypes [3] and revealing features of non-tumor compartments like cancer-associated fibroblasts [17] and immune cells [18]. Recent development of single-cell RNA sequencing (scRNA-seq) enables the characterization of heterogeneous tumor cells at a higher resolution. In addition to known heterogeneity of ER and HER2 expression [4], [19], these studies have demonstrated heterogeneity within CSC populations [20]. These studies also demonstrated the breast CSCs can exist in alternate mesenchymal (EMT) or epithelial (MET) states which are regulated by the tumor microenvironment [21]. The plasticity of CSCs in transition between these states is fundamental to their ability to metastasize [7].
Transcriptomic heterogeneity of breast cancer at the single-cell level has not yet been extended to the elucidation of alternative splice isoforms, although it has been characterized in bulk tumor samples [22], [23], [24], [25]. In eukaryotes, isoforms emerge from splicing of heterogeneous nuclear RNA in the step to make mRNAs [26]. The resulting isoforms from one gene could present identical, similar or opposing protein functions [27]. At least 20% of genes with known splicing isoforms express multiple transcript variants within a single cell [28], [29]. Such extensive heterogeneity of isoforms poses great challenges to scRNA-seq techniques. Popular scRNA-seq techniques, such as Drop-seq, provide low-coverage sequencing reads that are biased to 5′- or 3′-ends [30]. Precluding the robust identification of isoforms with low expression [31], these scRNA-seq methods would likely miss low-expressed isoforms due to drop-out, making them completely inaccessible [32]. Quantification of isoforms with higher expression levels is difficult and may require adequate reads to cover the splicing sites, which many scRNA-seq techniques do not meet [31].
Here we present the transcriptome analysis of the TNBC breast cancer cell line SUM149 using Fluidigm’s Polaris sequencing platform. This technique performs full-length single-cell RNA sequencing and generate data with relatively high sequencing coverage and accuracy, enabling investigation at a higher resolution. Our study reveals heterogeneous expression of marker genes (ER, PR, and HER2) across the TNBC cells. At the cellular level, we identified three cancer stem cell populations: epithelial-mesenchymal transition (EMT), mesenchymal-epithelial transition (MET) and Dual-EMT-MET CSCs. At the transcriptomic level, these cell populations also manifested a high level of heterogeneity in alternative splicing patterns, which would be missed in an analysis of lower resolution. To our knowledge, this is the first study to profile heterogeneity of breast cancer cells using Fluidigm’s Polaris platform at both single-cell- and single-isoform-levels.
2. Results
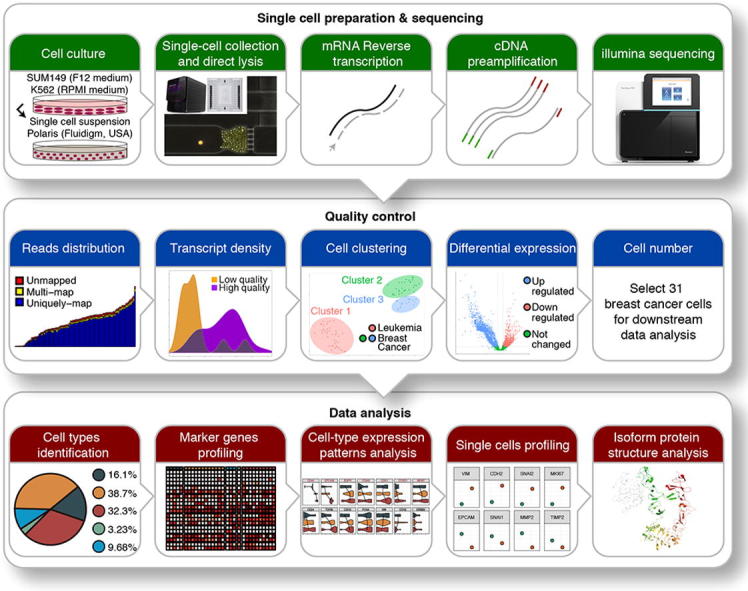
To study intrinsic tumor heterogeneity in TNBC, we conducted a single-cell transcriptome analysis of the TNBC SUM149 cell line utilizing Fluidigm’s Polaris cell capture and sequencing technology (Fig. 1, upper panel). To our knowledge, this is the first report of this new sequencing platform in literature. To verify the quality of this data for downstream analysis, stringent quality control was applied (Fig. 1, middle panel). Two cells from leukemia control samples and five cells from breast cancer samples were discarded because of low total reads. Another two cells from breast cancer samples were discarded because of mapping rate less than 80%. From t-SNE plot (Fig. S1A), the remaining 87 single cells were clustered into 3 groups, with cluster 1 corresponding to leukemia samples and both clusters 2 and 3 corresponding to breast cancer samples. Differential expression analysis between leukemia control samples and breast cancer samples also revealed two groups within breast cancer samples (Fig. S2A). To further ensure the quality of cells, we investigated the expression levels of 6 housekeeping genes (GAPDH, ACTB, LDHA, RAB7A, B2M, and HPRT1) and found that the majority of cells (10 cells) from cluster 3 had low expression levels of housekeeping genes and lower number of transcripts; they were removed from downstream analysis (Fig. S3C). The gene enrichment analysis (Fig. S2B) and target gene profiling (Fig. S3A and S3B) showed similar expression patterns on gene and isoform levels. We then scrutinized well-defined breast cancer marker genes (ERBB2, ESR1, ESR2, and PGR) and found that overall they were not differentially expressed, which is consistent with the expected TNBC expression pattern (ER-, PR-, ERBB2-). The overall results from quality control supported the validity of our data. The remaining 31 breast cancer cells were used for further downstream analyses: cancer stem cell identification, cell-type heterogeneity, and specific isoforms profiling (Fig. 1, lower panel).
Fig. 1.

Overview of the workflow. Breast cancer SUM149 and erythroleukemia K562 cell lines were cultured in separate media, suspended, collected, and lysed using Polaris instrument (Fluidigm, USA). Single-cell RNAs were then reverse transcribed, followed by cDNA preamplification and Illumina sequencing. Stringent quality controls were applied to the resulting data; in-depth data analysis was conducted on the remaining 31 cells for biological insights.
2.1. Fluidigm single-cell sequencing revealed the intrinsic landscape of breast cancer cell heterogeneity
Based on the expression pattern from differential expression in quality control, we further profiled breast cancer marker genes (ERBB2, ESR1, ESR2, and PGR) within TNBC cells and discovered some level of intrinsic heterogeneity. In 31 breast cancer cells, none of them expressed ESR1 nor PGR. Two (6%) of them expressed ESR2 and five (16%) expressed low levels of ERBB2, but none of them expressed ESR2 and ERBB2 simultaneously (Fig. 2C). The ESR2-208 (ENST00000554572, estrogen receptor beta isoform 2) was the major isoform expressed for ESR2 gene, and ERBB2-204 (ENST00000541774, ERBB2 transcript variant 3) was the major isoform for ERBB2. This result revealed an unexpected finding, the existence of ESR2+ cells and ERBB2+ cells within this TNBC, demonstrating the high transcriptomic heterogeneity of these cells.
Fig. 2.

A. Previously defined gene signatures for cancer stem cells (CSCs) in bulk RNA-seq (Al-Hajj et al., 2003; Ginestier et al., 2007). B. Cell types proportion showing cellular heterogeneity: EMT CSCs (32.3%), EMT non-CSCs (38.7%), MET CSCs (9.68%), Dual-EMT-MET CSCs (3.23%) and non-CSCs (16.1%). C. Heatmap of analyzed genes grouped by known expression patterns showing heterogeneous expression of ESR2 and ERBB2 within TNBC and highly diverse expression patterns within and among different cell populations.
2.2. Expression profiles of EMT CSC marker genes suggest 2-stage development of EMT CSCs in breast cancers
From the expression patterns, we also observed that CD44 exhibited high levels of expression. Therefore we investigated the existence of cancer stem cells (CSCs) within our breast cancer samples. Through the expression profiling of CSC and epithelial/mesenchymal-related gene signatures (CD44, CD24, EPCAM, ALDH1A1 and ALDH1A3) (Fig. 2A and Fig. S4), we identified 10 EMT CSCs (32%), 3 MET CSCs (10%), 1 Dual-EMT-MET CSCs (3%), 12 EMT non-CSCs (39%) and 5 non-CSCs (16%) (Fig. 2B).
To examine the difference of expression patterns among stem cell populations, we performed principal component analysis on these 31 breast cancer cell transcriptomes by using all the expressed genes. The result did not show any systematic differences or clusters, suggesting a similar global gene expression patterns among different types of breast cancer cells (Fig. S4). To determine the phenotypes of different cell populations, we did similar PCA using only the selected marker genes. This approach roughly revealed 3 clusters: EMT CSCs, EMT non-CSCs, and non-CSCs (Fig. 3B and Fig. S5); only MET CSCs showed high discrepancy. A variable correlation plot identified the correlation between genes and different clusters (Fig. 3A); the length of lines represented the level of gene contribution to clusters. We observed that EMT CSCs were related to the expression of ITGA6, EPCAM, CCND1, CD44, EGFR, CDH1, CCND1, and MKI67 (Fig. 3A, upper right quadrant). The violin plot of gene expression levels (Fig. 3C) showed that EMT CSCs had relatively higher expression of genes in upper right quadrant in Fig. 3A; it also demonstrated the transition pattern from EMT CSCs to EMT non-CSCs and then to non CSCs at both cellular (Fig. 3B) and transcriptomic (Fig. 3C) levels. These results suggested the substantial heterogeneity of cancer stem cells within TNBC, which would not be detected by traditional bulk RNA-seq analysis.
Fig. 3.

A. Variable correlation plot showing the contribution of each of 20 genes to quadrants and particularly ITGA6, EPCAM, CCND1, CD44, EGFR, CDH1, and MKI67 contributed to the upper right quadrant (EMT CSCs). B. PCA plot showing the transition from EMT CSCs to EMT non-CSCs, and then to non CSCs, which was driven toward the upper right quadrant (EMT CSCs). C. Violin plot showing the transitional expression patterns of analyzed genes among non CSCs, EMT non-CSCs, and EMT CSCs.
2.3. CSCs exhibit distinct phenotypes within the same cell population
The diverse expression distributions in violin plots (Fig. 3C) demonstrated heterogeneity within the same type of CSC. In MET CSCs (samples 12, 32, and 35), we found that samples 32 and 35 displayed EMT features (CD44+ and CD24-/low), while sample 12 showed purely MET CSC features (ALDH+) (Fig. 4A). Sample 32 had no expression of CD44v6 isoform, while 12 and 35 expressed high levels of CD44v6 isoform. As for gene profiling, sample 32 exhibited low or no expression of proliferation-related genes (MKI67 and PCNA) even though it displayed EMT features as sample 35.
Fig. 4.

A. Three MET CSCs showing the existence of EMT features within MET CSC populations, and one Dual EMT-MET CSC (BC8) exhibiting a mixture of EMT and MET features. The CD44 here represents the canonical CD44. B. Two EMT single cells from different cell populations showing diverse expression patterns in terms of proliferation (MKI67, CCND1, and CCNE2) and aggressiveness (MMP2 and TIMP2).
Such discrepancy also existed in the EMT CSC population. For instance, sample 26 expressed CD44v6 isoforms while sample 16 and 22 did not (Fig. S5). Furthermore, all these three samples exhibited expression of EGFR gene but more specifically, sample 16 and 26 only expressed EGFR-201 isoform, which is the canonical isoform for EGFR, while sample 22 only expressed the EGFR-211 isoform. The expression of EGFR has previously been reported to be correlated with the metastasis and tumorigenicity of TNBC [33]. However, we found that sample 16 with EGFR-201 isoform expressed higher levels of genes linked to tumor aggressiveness than sample 22 with EGFR-211 isoform because sample 16 had corresponding expression patterns of metastasis genes (high SNAI1, high MMP2, and low TIMP2). This suggests that EGFR-211 isoform was less associated with aggressiveness and metastasis than the EGFR-201 isoform. These results demonstrate diverse expression patterns of single cells from the same cell types, which can be elusive with other single-cell techniques.
2.4. EMT cells favor transcripts of EGFR with skipped 5′-end sequences
To verify that EGFR-211 is indeed less involved in metastasis, we investigated other cells with similar gene profiling in our data (Fig. S6). We found that the EGFR-211 isoform was expressed only in cells with EMT features (EMT CSCs and EMT non-CSCs, Fig. 5A). EMT non-CSCs expressing the EGFR-211 isoform tend to have higher levels of proliferation-related genes (Fig. 5A). More specifically, sample 39 was identified as EMT non-CSC and sample 16 as EMT CSC. Both of them expressed CD44v6, ESR2, and EGFR-201 isoform but only sample 39 expressed EGFR-211 isoform. For gene profiling, sample 39 expressed lower levels of SNAI1, MMP2, EPCAM, CDH1, STAT1, SMAD4, TYMP, BAD, and HK1 but higher levels of VIM, CDH2, MKI67, CCND1, CCNE2, CDK1, and TIMP2, compared with sample 16 (Fig. 4B). These gene signatures suggest that sample 39 was less aggressive but more proliferative, while sample 16 was the complete opposite.
Fig. 5.

A. Boxplot showing that EGFR-211 isoform expressed only in cells with EMT features. EMT non-CSCs with EGFR-211 isoform had a higher level of EGFR gene and proliferation-related genes (PCNA, CCND1, and MKI67). B. The extracellular protein structure of EGFR-211 isoform (colorful portion, 464 amino acid residues), showing its missing part of N terminal (grey portion) compared to the canonical EGFR-201 isoform (colorful portion and grey portion, 1210 amino acid residues). C. PCA plot showing the diverse expression patterns of CD44v6 isoform within different CSC populations (compared with Fig. 3B). D. Box plots showing statistical significance in the expression levels of MCL1 and JUN genes between CD44v6-positive and CD44v6-negative populations.
To further investigate the potential functions of the EGFR-211 isoform, for which there was no functional annotation, we obtained its protein sequence from ENSEMBL and then mapped its protein structure to that of EGFR-201, the canonical isoform of EGFR, using PyMOL (The PyMOL Molecular Graphics System, Version 2.0 Schrödinger, LLC). The protein structure of EGFR-211 isoform (Fig. 5B) showed that it is missing most of the N-terminal compared with the canonical EGFR-201 isoform (Protein Data Bank ID: 5WB8) [34]. This leads to a compromised receptor domain for the epithelial growth factor. Other than that, ENSEMBL and UniProt predict a missing kinase domain for the final product, although the corresponding transcription sequence is present. Provided the importance of EGFR in tumor development, the change of the transcripts may lead to a major disruption of the protein functionality.
2.5. The expression profiles of CD44v6 showed diverse patterns within different cell populations
To further investigate the functional and phenotypic diversity of the CD44v6 isoform, we examined the expression patterns of its related isoforms (CD44-206: ENST00000415148, CD44-208: ENST00000428726, CD44-215: ENST00000525241, CD44-223: ENST00000526553, CD44-229: ENST00000528672, CD44-231: ENST00000531110, CD44-237: ENST00000534082, CD44-238: ENST00000534296) within different cell populations (Table S1). We also visualized the alignment files using Integrative Genomics Viewer (IGV) from Broad Institute [35] to ensure the existence of CD44v6 isoforms. Across all 31 breast cancer cells, 11 cells (36%) expressed the CD44v6 isoform; none of them was in the non-CSC group (Fig. S7). Three of them were EMT CSCs, two were MET CSCs, and the rest were EMT non-CSCs. This distribution of CD44v6 showed diverse expression patterns within different cell populations, suggesting that the CD44v6 isoform is generally related to CSC and EMT/MET features (Fig. 5C).
Next, we compared gene profiling between these two CD44v6- and CD44v6+ populations. We found that CD44v6+ cells were characterized by high levels of MCL1 (Wilcoxon test, p = 0.006) and JUN genes (Wilcoxon test, p = 0.0081) (Fig. 5D), suggesting that CD44v6+ is associated with proliferation (JUN gene) and tumorigenesis (MCL1 gene), consistent with previous reports at the bulk level [15].
3. Discussion
Using transcriptome analysis of single cells from a TNBC cell line, we demonstrated diverse cell populations and extensive heterogeneity of both gene and isoform expression patterns within and among different cell populations. To our knowledge, this cellular and transcriptomic heterogeneity profiling along with isoform analysis at single cell level have not been previously reported for TNBC.
Heterogeneity profiling at both cellular and transcriptomic levels depends on reliable scRNA-seq using Fluidigm’s Polaris platform, which we have applied to a TNBC SUM149 cell line. One advantage of Fluidigm sequencing platform is the accuracy of the measurement. From the technical perspectives, the capability of microscopic imaging of captured single cells before lysis ensures that only one single cell is analyzed, providing an advantage over droplet-based technologies such as Drop-seq [36]. The Fluidigm Polaris system also enables the identification of biomarkers on the cell surface, which is not possible with Drop-seq. Furthermore, the tag-based protocols of Drop-seq only capture either 5′- or 3′-ends of each RNA molecule [30] and this being restricted to one end of the transcript may reduce the mappability and also make it harder to distinguish different isoforms [37]. The Smart-seq protocol on the Fluidigm’s C1 platform, on the other hand, performs quantification with a full-length based method, which tries to achieve uniform read coverage of each transcript, which can yield higher coverage across transcripts [38]. From the computational perspective, Fluidigm platform treats every single cell as one bulk sample and generates a corresponding transcriptome, while Drop-seq sequences all the cells simultaneously with the help of cell barcodes and Unique Molecular Identifiers (UMI) to distinguish different cells [39]. This introduces a new problem of how to correctly determine the number of cells sequenced under the influence of sequencing error. Moreover, since Fluidigm treats each cell as one bulk sample, current computational methods for bulk RNA-seq can be applied directly to its scRNA-seq data although these methods do need optimization to perform better. For example, optimized imputation algorithm could identify cells with similar gene expression profiles and pools reads from them to assist in transcript expression estimation. Taking advantage of Fluidigm’s RNA-seq platforms, we revealed the extensive cellular and transcriptomic heterogeneity of TNBC at a higher resolution and accuracy.
Aside from the technical advantage, we also presented important observations in regards to characterizing breast cancers. TNBC is characterized by the lack of estrogen receptor (ER), progesterone receptor (PR), and human epidermal growth factor receptor 2 (HER2), based on transcriptomic signatures [40]. Although previously defined TNBC signatures [41] were recapitulated in the majority of our breast cancer single cells from the SUM149 cell line, there still exists substantial heterogeneity, which is obscured in bulk analysis. Although only two cells expressed ESR2 (ERβ) gene, it might imply a potential effect of ESR2 on TNBC, as a previous study showed ESR2 exerts proliferative effects in the absence of ESR1 (ERɑ) gene [42]. The fact that the major expressed isoform for ESR2 gene is ESR2-208 (estrogen receptor beta isoform 2, ERβ2) might shed light on treatment for TNBC because it can induce proteasome-dependent degradation of ERα (ESR1) [43] and the inhibition of ESR2 might turn TNBC into ER+ breast cancer, which is susceptible to hormone therapy. Therefore, future studies might explore ESR2 and its variants as diagnostic and prognostic tools and as a therapeutic target for TNBC. Second, five cells expressed comparatively low levels of ERBB2. A similar result was reported for the SUM149 cell line at the bulk level [44]. These results are consistent with previous studies suggesting that the beneficial effects of HER2 targeting therapies may extend to a subset of HER2 negative tumors, where a subpopulation of cells express HER2 [45], [46].
There is a general consensus that TNBC cells are enriched for CSCs, which may exist in alternative EMT or MET like states [21], [47]. However, much controversy remains on whether cancer stem cells (CSCs) and the EMT processes are highly correlated with each other. Some studies have suggested a high correlation between EMT and CSCs [48], while others revealed little relationship between them [49]. In this study, we identified 5 subtypes of cells (EMT CSCs, MET CSCs, Dual-EMT-MET CSCs, EMT non-CSCs, and non-CSCs), suggesting that CSCs and EMT/MET processes can exist simultaneously (MET CSCs and EMT CSCs) but can also exist independently (EMT non-CSCs). One possible explanation for such differences might be that EMT/MET signatures can be correlated with CSC status as CSCs develop into certain stages. Different studies might investigate different stages of CSCs or bulk analysis masked different stages of CSCs, generating opposite conclusions. It has been reported that breast cancer stem cells exist in distinct EMT and MET states characterized by the expression of distinct CSC marker [21]. However, in this study, we identified MET CSCs with EMT features (Sample 32 and 35, Fig. 4A). One possible explanation is that single-cell transcriptome analysis reveals cells in a dynamic state, contrasted with a static state in bulk RNA-seq; therefore, cells in the middle stage of EMT/MET can possess both EMT and MET features. Similarly, EMT CSCs and MET CSCs identified in this study did not express common EMT/MET-associated genes at the same time. Specifically, some EMT CSCs expressed VIM but no CDH2 or the other way around. It’s possible that the same type of cells live around each other and, thus, if one cell expresses a high level of some genes, others do not have to express those genes. Or these cells might display subtle differences in the level of these genes.
Many studies have provided evidence that EGFR is a crucial component driving proliferation, metastasis, and EMT process in TNBC [33], [50], [51]. Correspondingly, we found that EGFR had higher expression levels in cells with EMT features than in MET CSCs (Fig. S4). However, there remain discrepancies within cells with EMT features. We found that some cells expressing both EGFR-211 and EGFR-201 isoforms were less aggressive and more proliferative than those expressing EGFR-201 but no EGFR-211 isoform. To assess the potential functions of EGFR-211, we compared its protein structure with that of the canonical EGFR-201 isoform. A major difference between the two isoforms is that EGFR-211 skipped a major part of the N-terminal sequence (Fig. 5B). The N-terminal sequence mainly corresponds to the extracellular domain of the receptor. The compromised receptor domain may lead to a significant disruption in regulating the functionality of EGFR [52]. Previous studies found similar patterns in EGFR with comprised tyrosine receptors, where disrupted extracellular domain inhibited the autophosphorylation of EGFR and thus suppressed the activity of EGFR [52]. Other than that, UniProt and ENSEMBL predict the protein product of the transcript also loses its intracellular kinase domain, even though the corresponding coding sequence is present. The activation of the receptor tyrosine kinase greatly relies on the dimerization of two receptor proteins and their cross-phosphorylation [53], [54]. If the prediction is correct, the presence of the isoform may lead to an inhibition of the EGFR functionality. However, if the coding sequence of the kinase domain is actually translated, the EGFR isoform, compromised receptor domain of which may lead to dysregulation, may lead to unregulated activation of its functionality. The protein has been repeatedly found in contribution to the aggressiveness of cancer cells [33], [50], [51]. The implication of the functionality changes of the alternative splicing needs to be confirmed through more studies at the protein level.
CD44 is widely accepted as one of the marker genes to identify CSCs within all tumors [55]. However, the relationship between CD44 and distant metastasis has been ambiguous. Some studies suggested that the presence of CD44+ CSCs in breast cancer was associated with distant metastasis [56], while others showed that total CD44 expression could not predict distant metastasis [57]. Such contradictory results may due to multiple isoforms of the CD44 gene. Among these isoforms, CD44v6 has been shown to be significantly associated with metastasis [15], [16] and CSC progression [58]. In this study, we found that CD44v6 was distributed among different cell populations; from gene profiling between CD44v6+ and CD44v6- groups, we found significantly higher levels of MCL1 and JUN (Fig. 5D) in CD44v6+ groups. MCL1 has been proved to be essential in breast tumorigenesis and tumor metastasis [59], [60]. Similarly, JUN is generally linked to metastasis and stem cell expansion in invasive breast cancers [61], [62]. Overall, our results suggest that CD44v6 was more associated with the process of proliferation and tumorigenesis.
The single cell technologies described should prove valuable for future studies on the generation of heterogeneous population during carcinogenesis, cancer progression, and treatment. First, future development may stain captured cells during Fluidigm RNA-seq analysis. Staining cells will permit examination of cells for viability, surface markers, and reporter genes, and thus provide ground truth for single cells. Future studies may obtain this information as validation of data analysis. Second, with the further development of scRNA-seq technology, it will be feasible to acquire deeper sequencing data with more cells. The methods deployed in this study will naturally lead to a more thorough characterization of different types of CSCs in breast cancers and other cancers.
Altogether, our study demonstrates the potential scope of single-cell transcriptome analysis in the profiling of cellular and transcriptomic heterogeneity of breast CSCs. Our findings demonstrated the highly dynamic and heterogeneous nature of breast CSCs. It also highlights the need to conduct further analyses on CSCs at single-cell resolution in order to understand the molecular mechanisms and improve cancer therapies.
4. Materials and methods
4.1. Single cells preparation and sequencing
Breast cancer SUM149 and erythroleukemia K562 control cell lines were cultured in F12 and RPMI medium, respectively. At about 80% confluency, cells were harvested from the culture flasks and diluted to about 300 cells/μl in PBS. Cell suspensions of SUM149 and K562 were separately processed using a Polaris instrument (Fluidigm, USA), 48-well full-length RNA-seq chip and reagents (Clontech and Fluidigm, USA). Captured single cells were separately lysed to release total RNA and converted to cDNA libraries followed by pre-amplification of cDNAs all on the chip according to the manufacturer's protocol. The product of every single cell was transferred to a well of 96-well plate for barcoding using Nextera XT DNA library prep kit (Illumina, USA). Single cell barcoded products were pooled together in one lane for sequencing on HiSeq 2500. Raw sequencing data were processed through the following pipeline to determine gene expression patterns of every single cell of SUM149 and K562 cell lines.
4.2. Quality control and quantification
The scRNA-seq was processed on 48 cells from leukemia K562 cell line (control sample) and 48 cells from breast cancer SUM149 cell line using Fluidigm’s Polaris microfluidic platform at Single Cell Analysis Core of Rogel Comprehensive Cancer Center of the University of Michigan. SUM149 is a commonly used cell line for TNBC. The reference genome was modified from the ENSEMBL reference genome version 90 to contain only those genes with protein products (UniProt IDs). The RNA reads were then aligned against our modified reference genome using STAR_2.5.3a (default parameters) [63], and relative gene expression was quantified as expected count using RSEM v1.3.0 (default parameters) [64]. Isoform expression levels were summed to derive the expected count for each gene. Quality control assessment of aligned scRNA-seq reads was performed using FastQC v0.11.2 [65] and then all the quality control reports were summarized using Multiqc v1.0.dev0 [66]. To remove cells with low-quality sequencing values, two filtering criteria were applied: (1) the number of total reads and (2) mapping rates. To remove genes and isoforms with low expression value, the following processes were applied: (1) Expected count value below 1 were substituted with zero; (2) Expected count values were log2-transformed after adding a value of one.
To explore the separation of our scRNA-seq data, unsupervised clustering using the principal component analysis (PCA) [67] was performed on both gene and isoform levels and the result was visualized using t-Distributed Stochastic Neighbor Embedding (t-SNE) plot [68]. All the cells were conserved. To verify the quality of our single cells, the expression levels of 6 housekeeping genes (GAPDH, ACTB, LDHA, RAB7A, B2M, and HPRT1) were investigated. To verify the quality of isoform quantification, we compared expression patterns and conducted gene enrichment analysis on both gene and isoform level.
4.3. Validation of sequencing data
To validate our sequencing data, the analysis of differential expression on both gene and isoform levels was performed using edgeR v3.18.1 (default parameters) [69] with leukemia samples as control. Differentially expressed genes and isoforms were defined as genes and isoforms with false discovery rate (FDR) no larger than 0.05 and log2-transformed fold change no less than 1. Heatmap was drawn on top 5% (ranked by FDR) differentially expressed genes with unsupervised clustering of cells. Expression profiling of known breast cancer marker genes (ERBB2, ESR1, ESR2, and PGR) was investigated in the quantification results of all the breast cancer single cells.
4.4. Cancer stem cells identification
It has been reported that TNBC cells usually have higher expression of epithelial-mesenchymal transition (EMT) and mesenchymal-epithelial transition (MET) signatures [47], which are generally linked to cancer stem cells (CSCs) [48]. To verify the existence of CSCs, we analyzed the expression of several markers: CD44, CD24, EPCAM [14] and ALDH (aldehyde dehydrogenase) [70]. EMT CSCs were identified as cells with CD44+, CD24-/low, and EPCAM+; MET CSCs as cells with ALDH1A1+ and/or ALDH1A3+; and dual-EMT-MET CSCs as cells with gene signatures of both EMT and MET, as previously described [70], [71]. To better characterize the EMT feature, cells with CD44+ and CD24-/low in non-CSC group were identified as non-CSCs with EMT features (EMT non-CSCs).
To further investigate the functional and phenotypic differences, the expression level of marker genes associated with differentiation (CD24, EPCAM, CDH1, CCND1), breast cancer stemness (CD44, ITGA6, ALDH1A1, ALDH1A3), EMT/metastasis (VIM, CDH2, TGFBI, EGFR) and proliferation (PCNA, MKI67) was quantitatively assessed. Unsupervised principal component analysis (PCA) was performed on all breast cancer single cell transcriptomes by using all the genes as well as only the marker genes mentioned above in FactoMineR package in R [72]. Genes were also analyzed by unsupervised PCA.
4.5. CD44 and EGFR isoforms profiling
To identify the impact of specific isoforms of CD44 and EGFR in the transition among different types of CSCs, we performed isoform profiling of CD44v6, EGFR-201 (ENST00000275493) and EGFR-211 (ENST00000638463). To determine the existence of CD44v6, the resulting bam files of all single cells from STAR alignment were visualized using Integrative Genomics Viewer (IGV) from Broad Institute [35] and those showing reads mapping to chr11:35204512-35204640 were identified as CD44v6 positive. The status of CD44v6+/-, EGFR-201+/- and EGFR-211+/- was assessed in the downstream analysis.
4.6. Isoform protein structures and functions analysis
To obtain insights on the isoform protein structure and its possible functions, we started with isoform protein sequences from ENSEMBL and then visualized its protein structure using PyMOL software (The PyMOL Molecular Graphics System, Version 1.2r3pre, Schrödinger, LLC). The protein structure of canonical isoform was obtained from the Protein Data Bank (PDB). The protein structure of our identified isoform was compared with that of the canonical isoform in PyMOL to assess its possible biological functions.
5. Authors’ contributions
SW, HJ, SF, EA designed the project; SF performed wet-lab experiments; SW and HZ performed analysis and wrote the paper; HL, EA, EK, MW, GSO and YF supervised the project, provided suggestions, and proofread the paper. All authors read and approved the final manuscript.
CRediT authorship contribution statement
Shaocheng Wu: Methodology, Visualization, Writing - original draft, Writing - review & editing. Hongjiu Zhang: Methodology, Writing - review & editing. Shamileh Fouladdel: Methodology, Data curation. Hongyang Li: Writing - review & editing. Evan Keller: Visualization. Max S. Wicha: Writing - review & editing. Gilbert S. Omenn: Methodology, Writing - review & editing, Supervision. Ebrahim Azizi: Methodology, Investigation, Writing - review & editing, Supervision. Yuanfang Guan: Methodology, Writing - review & editing, Supervision.
Acknowledgments
We thank the R and D technical team at Fluidigm Company for scientific assistance to do single cell analysis by Polaris, and the staff of the Single Cell Analysis Core and Sequencing Core of the Comprehensive Cancer Center at the University of Michigan. We also thank the Rogel Cancer Center Single Cell Core supported by Cancer Center Support Grant (P30 CA046592).
Footnotes
Supplementary data to this article can be found online at https://doi.org/10.1016/j.csbj.2020.03.005.
Appendix A. Supplementary data
The following are the Supplementary data to this article:
Availability of data and materials
Source code is freely available for download at https://github.com/GuanLab/Single-cell-pipeline, implemented in R. The datasets generated and/or analyzed during the current study is freely available for download at https://www.ncbi.nlm.nih.gov/Traces/study/?acc=PRJNA478449.
References
- 1.Koren S., Bentires-Alj M. Breast tumor heterogeneity: source of fitness. Hurdle for therapy. Mol Cell. 2015;60:537–546. doi: 10.1016/j.molcel.2015.10.031. [DOI] [PubMed] [Google Scholar]
- 2.Zardavas D., Irrthum A., Swanton C., Piccart M. Clinical management of breast cancer heterogeneity. Nat Rev Clin Oncol. 2015;12:381–394. doi: 10.1038/nrclinonc.2015.73. [DOI] [PubMed] [Google Scholar]
- 3.Dietze E.C., Sistrunk C., Miranda-Carboni G., O’Regan R., Seewaldt V.L. Triple-negative breast cancer in African-American women: disparities versus biology. Nat Rev Cancer. 2015;15:248–254. doi: 10.1038/nrc3896. [DOI] [PMC free article] [PubMed] [Google Scholar]
- 4.Chung W., Eum H.H., Lee H.-O., Lee K.-M., Lee H.-B., Kim K.-T. Single-cell RNA-seq enables comprehensive tumour and immune cell profiling in primary breast cancer. Nat Commun. 2017;8:15081. doi: 10.1038/ncomms15081. [DOI] [PMC free article] [PubMed] [Google Scholar]
- 5.Azizi E., Carr A.J., Plitas G., Cornish A.E., Konopacki C., Prabhakaran S. Single-cell map of diverse immune phenotypes driven by the tumor microenvironment. Cell. 2017 doi: 10.1016/j.cell.2018.05.060. [DOI] [PMC free article] [PubMed] [Google Scholar]
- 6.Turashvili G., Brogi E. Tumor heterogeneity in breast cancer. Front Med. 2017;4:227. doi: 10.3389/fmed.2017.00227. [DOI] [PMC free article] [PubMed] [Google Scholar]
- 7.Cabrera M.C. Cancer stem cell plasticity and tumor hierarchy. World J Stem Cells. 2015;7:27. doi: 10.4252/wjsc.v7.i1.27. [DOI] [PMC free article] [PubMed] [Google Scholar]
- 8.Eyler C.E., Rich J.N. Survival of the fittest: cancer stem cells in therapeutic resistance and angiogenesis. J Clin Oncol. 2008;26:2839–2845. doi: 10.1200/JCO.2007.15.1829. [DOI] [PMC free article] [PubMed] [Google Scholar]
- 9.Frame F.M., Maitland N.J. Cancer stem cells, models of study and implications of therapy resistance mechanisms. Adv Exp Med Biol. 2011;720:105–118. doi: 10.1007/978-1-4614-0254-1_9. [DOI] [PubMed] [Google Scholar]
- 10.Doherty M.R., Smigiel J.M., Junk D.J., Jackson M.W. Cancer stem cell plasticity drives therapeutic resistance. Cancers. 2016:8. doi: 10.3390/cancers8010008. [DOI] [PMC free article] [PubMed] [Google Scholar]
- 11.Cojoc M., Mäbert K., Muders M.H., Dubrovska A. A role for cancer stem cells in therapy resistance: cellular and molecular mechanisms. Semin Cancer Biol. 2015;31:16–27. doi: 10.1016/j.semcancer.2014.06.004. [DOI] [PubMed] [Google Scholar]
- 12.Menon R., Panwar B., Eksi R., Kleer C., Guan Y., Omenn G.S. Computational inferences of the functions of alternative/noncanonical splice isoforms specific to HER2/ER-/PR– breast cancers, a chromosome 17 C-HPP study. J Proteome Res. 2015;14:3519–3529. doi: 10.1021/acs.jproteome.5b00498. [DOI] [PMC free article] [PubMed] [Google Scholar]
- 13.Liu S., Im H., Bairoch A., Cristofanilli M., Chen R., Deutsch E.W. A chromosome-centric human proteome project (C-HPP) to characterize the sets of proteins encoded in chromosome 17. J Proteome Res. 2013;12:45–57. doi: 10.1021/pr300985j. [DOI] [PMC free article] [PubMed] [Google Scholar]
- 14.Al-Hajj M., Wicha M.S., Benito-Hernandez A., Morrison S.J., Clarke M.F. Prospective identification of tumorigenic breast cancer cells. Proc Natl Acad Sci U S A. 2003;100:3983–3988. doi: 10.1073/pnas.0530291100. [DOI] [PMC free article] [PubMed] [Google Scholar]
- 15.Lopez J.I., Camenisch T.D., Stevens M.V., Sands B.J., McDonald J., Schroeder J.A. CD44 attenuates metastatic invasion during breast cancer progression. Cancer Res. 2005;65:6755–6763. doi: 10.1158/0008-5472.CAN-05-0863. [DOI] [PubMed] [Google Scholar]
- 16.Wu X.-J., Li X.-D., Zhang H., Zhang X., Ning Z.-H., Yin Y.-M. Clinical significance of CD44s, CD44v3 and CD44v6 in breast cancer. J Int Med Res. 2015;43:173–179. doi: 10.1177/0300060514559793. [DOI] [PubMed] [Google Scholar]
- 17.Erez N., Truitt M., Olson P., Arron S.T., Hanahan D. Cancer-associated fibroblasts are activated in incipient neoplasia to orchestrate tumor-promoting inflammation in an NF-kappaB-dependent manner. Cancer Cell. 2010;17:135–147. doi: 10.1016/j.ccr.2009.12.041. [DOI] [PubMed] [Google Scholar]
- 18.Gajewski T.F., Schreiber H., Fu Y.-X. Innate and adaptive immune cells in the tumor microenvironment. Nat Immunol. 2013;14:1014–1022. doi: 10.1038/ni.2703. [DOI] [PMC free article] [PubMed] [Google Scholar]
- 19.Schmitt M.W., Kennedy S.R., Salk J.J., Fox E.J., Hiatt J.B., Loeb L.A. Detection of ultra-rare mutations by next-generation sequencing. Proc Natl Acad Sci U S A. 2012;109:14508–14513. doi: 10.1073/pnas.1208715109. [DOI] [PMC free article] [PubMed] [Google Scholar]
- 20.Akrap N., Andersson D., Bom E., Gregersson P., Ståhlberg A., Landberg G. Identification of distinct breast cancer stem cell populations based on single-cell analyses of functionally enriched stem and progenitor pools. Stem Cell Rep. 2016;6:121–136. doi: 10.1016/j.stemcr.2015.12.006. [DOI] [PMC free article] [PubMed] [Google Scholar]
- 21.Liu S., Cong Y., Wang D., Sun Y., Deng L., Liu Y. Breast cancer stem cells transition between epithelial and mesenchymal states reflective of their normal counterparts. Stem Cell Rep. 2014;2:78–91. doi: 10.1016/j.stemcr.2013.11.009. [DOI] [PMC free article] [PubMed] [Google Scholar]
- 22.Heckler M.M., Zeleke T.Z., Divekar S.D., Fernandez A.I., Tiek D.M., Woodrick J. Antimitotic activity of DY131 and the estrogen-related receptor beta 2 (ERRβ2) splice variant in breast cancer. Oncotarget. 2016;7:47201–47220. doi: 10.18632/oncotarget.9719. [DOI] [PMC free article] [PubMed] [Google Scholar]
- 23.Johnson R.M., Vu N.T., Griffin B.P., Gentry A.E., Archer K.J., Chalfant C.E. The alternative splicing of cytoplasmic polyadenylation element binding protein 2 drives anoikis resistance and the metastasis of triple negative breast cancer. J Biol Chem. 2015;290:25717–25727. doi: 10.1074/jbc.M115.671206. [DOI] [PMC free article] [PubMed] [Google Scholar]
- 24.Gross M.I., Demo S.D., Dennison J.B., Chen L., Chernov-Rogan T., Goyal B. Antitumor activity of the glutaminase inhibitor CB-839 in triple-negative breast cancer. Mol Cancer Ther. 2014;13:890–901. doi: 10.1158/1535-7163.MCT-13-0870. [DOI] [PubMed] [Google Scholar]
- 25.Yamanaka K. YM155, a selective survivin suppressant, inhibits tumor spread and prolongs survival in a spontaneous metastatic model of human triple negative breast cancer. Int J Oncol. 2011 doi: 10.3892/ijo.2011.1077. [DOI] [PubMed] [Google Scholar]
- 26.Wang E.T., Sandberg R., Luo S., Khrebtukova I., Zhang L., Mayr C. Alternative isoform regulation in human tissue transcriptomes. Nature. 2008;456:470–476. doi: 10.1038/nature07509. [DOI] [PMC free article] [PubMed] [Google Scholar]
- 27.Chen L., Kostadima M., Martens J.H.A., Canu G., Garcia S.P., Turro E. Transcriptional diversity during lineage commitment of human blood progenitors. Science. 2014;345:1251033. doi: 10.1126/science.1251033. [DOI] [PMC free article] [PubMed] [Google Scholar]
- 28.Tang F., Barbacioru C., Wang Y., Nordman E., Lee C., Xu N. mRNA-Seq whole-transcriptome analysis of a single cell. Nat Methods. 2009;6:377–382. doi: 10.1038/nmeth.1315. [DOI] [PubMed] [Google Scholar]
- 29.Marinov G.K., Williams B.A., McCue K., Schroth G.P., Gertz J., Myers R.M. From single-cell to cell-pool transcriptomes: stochasticity in gene expression and RNA splicing. Genome Res. 2014;24:496–510. doi: 10.1101/gr.161034.113. [DOI] [PMC free article] [PubMed] [Google Scholar]
- 30.Picelli S. Single-cell RNA-sequencing: the future of genome biology is now. RNA Biol. 2017;14:637–650. doi: 10.1080/15476286.2016.1201618. [DOI] [PMC free article] [PubMed] [Google Scholar]
- 31.Saliba A.-E., Westermann A.J., Gorski S.A., Vogel J. Single-cell RNA-seq: advances and future challenges. Nucleic Acids Res. 2014;42:8845–8860. doi: 10.1093/nar/gku555. [DOI] [PMC free article] [PubMed] [Google Scholar]
- 32.Kharchenko P.V., Silberstein L., Scadden D.T. Bayesian approach to single-cell differential expression analysis. Nat Methods. 2014;11:740–742. doi: 10.1038/nmeth.2967. [DOI] [PMC free article] [PubMed] [Google Scholar]
- 33.Ueno N.T., Zhang D. Targeting EGFR in triple negative breast cancer. J Cancer. 2011;2:324–328. doi: 10.7150/jca.2.324. [DOI] [PMC free article] [PubMed] [Google Scholar]
- 34.Freed D.M., Bessman N.J., Kiyatkin A., Salazar-Cavazos E., Byrne P.O., Moore J.O. EGFR ligands differentially stabilize receptor dimers to specify signaling kinetics. Cell. 2017;171 doi: 10.1016/j.cell.2017.09.017. 683–95.e18. [DOI] [PMC free article] [PubMed] [Google Scholar]
- 35.Robinson J.T., Thorvaldsdóttir H., Winckler W., Guttman M., Lander E.S., Getz G. Integrative genomics viewer. Nat Biotechnol. 2011;29:24–26. doi: 10.1038/nbt.1754. [DOI] [PMC free article] [PubMed] [Google Scholar]
- 36.Ziegenhain C., Vieth B., Parekh S., Reinius B., Guillaumet-Adkins A., Smets M. Comparative analysis of single-cell RNA sequencing methods. Mol Cell. 2017;65 doi: 10.1016/j.molcel.2017.01.023. 631–43.e4. [DOI] [PubMed] [Google Scholar]
- 37.Archer N., Walsh M.D., Shahrezaei V., Hebenstreit D. Modeling enzyme processivity reveals that RNA-Seq libraries are biased in characteristic and correctable ways. Cell Syst. 2016;3 doi: 10.1016/j.cels.2016.10.012. 467–79.e12. [DOI] [PMC free article] [PubMed] [Google Scholar]
- 38.Picelli S., Faridani O.R., Björklund A.K., Winberg G., Sagasser S., Sandberg R. Full-length RNA-seq from single cells using Smart-seq2. Nat Protoc. 2014;9:171–181. doi: 10.1038/nprot.2014.006. [DOI] [PubMed] [Google Scholar]
- 39.Macosko E.Z., Basu A., Satija R., Nemesh J., Shekhar K., Goldman M. Highly parallel genome-wide expression profiling of individual cells using nanoliter droplets. Cell. 2015;161:1202–1214. doi: 10.1016/j.cell.2015.05.002. [DOI] [PMC free article] [PubMed] [Google Scholar]
- 40.Brenton J.D., Carey L.A., Ahmed A.A., Caldas C. Molecular classification and molecular forecasting of breast cancer: ready for clinical application? J Clin Oncol. 2005;23:7350–7360. doi: 10.1200/JCO.2005.03.3845. [DOI] [PubMed] [Google Scholar]
- 41.Bianchini G., Balko J.M., Mayer I.A., Sanders M.E., Gianni L. Triple-negative breast cancer: challenges and opportunities of a heterogeneous disease. Nat Rev Clin Oncol. 2016;13:674–690. doi: 10.1038/nrclinonc.2016.66. [DOI] [PMC free article] [PubMed] [Google Scholar]
- 42.Cheng G., Li Y., Omoto Y., Wang Y., Berg T., Nord M. Differential regulation of estrogen receptor (ER)α and ERβ in primate mammary gland. J Clin Endocrinol Metab. 2005;90:435–444. doi: 10.1210/jc.2004-0861. [DOI] [PubMed] [Google Scholar]
- 43.Zhao C., Matthews J., Tujague M., Wan J., Strom A., Toresson G. Estrogen receptor 2 negatively regulates the transactivation of estrogen receptor in human breast cancer cells. Cancer Res. 2007;67:3955–3962. doi: 10.1158/0008-5472.CAN-06-3505. [DOI] [PubMed] [Google Scholar]
- 44.Menon R., Im H., Zhang E.Y., Wu S.-L., Chen R., Snyder M. Distinct splice variants and pathway enrichment in the cell-line models of aggressive human breast cancer subtypes. J Proteome Res. 2014;13:212–227. doi: 10.1021/pr400773v. [DOI] [PMC free article] [PubMed] [Google Scholar]
- 45.Perez E.A., Reinholz M.M., Hillman D.W., Tenner K.S., Schroeder M.J., Davidson N.E. HER2 and chromosome 17 effect on patient outcome in the N9831 adjuvant trastuzumab trial. J Clin Oncol. 2010;28:4307–4315. doi: 10.1200/JCO.2009.26.2154. [DOI] [PMC free article] [PubMed] [Google Scholar]
- 46.Kim Y.G., Yoon Y.N., Choi H.S., Kim J.-H., Seol H., Lee J.K. Breast cancer stem cells in HER2-negative breast cancer cells contribute to HER2-mediated radioresistance and molecular subtype conversion: clinical implications for serum HER2 in recurrent HER2-negative breast cancer. Oncotarget. 2018;9:5811–5822. doi: 10.18632/oncotarget.23528. [DOI] [PMC free article] [PubMed] [Google Scholar]
- 47.Lawson D.A., Bhakta N.R., Kessenbrock K., Prummel K.D., Yu Y., Takai K. Single-cell analysis reveals a stem-cell program in human metastatic breast cancer cells. Nature. 2015;526:131–135. doi: 10.1038/nature15260. [DOI] [PMC free article] [PubMed] [Google Scholar]
- 48.Brabletz T. EMT and MET in metastasis: where are the cancer stem cells? Cancer Cell. 2012;22:699–701. doi: 10.1016/j.ccr.2012.11.009. [DOI] [PubMed] [Google Scholar]
- 49.Tsuji T., Ibaragi S., Shima K., Hu M.G., Katsurano M., Sasaki A. Epithelial-mesenchymal transition induced by growth suppressor p12CDK2-AP1 promotes tumor cell local invasion but suppresses distant colony growth. Cancer Res. 2008;68:10377–10386. doi: 10.1158/0008-5472.CAN-08-1444. [DOI] [PMC free article] [PubMed] [Google Scholar]
- 50.Marotti J.D., Collins L.C., Hu R., Tamimi R.M. Estrogen receptor-beta expression in invasive breast cancer in relation to molecular phenotype: results from the Nurses’ Health Study. Mod Pathol. 2010;23:197–204. doi: 10.1038/modpathol.2009.158. [DOI] [PMC free article] [PubMed] [Google Scholar]
- 51.Thomas C., Rajapaksa G., Nikolos F., Hao R., Katchy A., McCollum C.W. ERbeta1 represses basal breast cancer epithelial to mesenchymal transition by destabilizing EGFR. Breast Cancer Res. 2012;14:R148. doi: 10.1186/bcr3358. [DOI] [PMC free article] [PubMed] [Google Scholar]
- 52.Ilekis J.V., Gariti J., Niederberger C., Scoccia B. Expression of a truncated epidermal growth factor receptor-like protein (TEGFR) in ovarian cancer. Gynecol Oncol. 1997;65:36–41. doi: 10.1006/gyno.1996.4526. [DOI] [PubMed] [Google Scholar]
- 53.Dawson J.P., Berger M.B., Lin C.-C., Schlessinger J., Lemmon M.A., Ferguson K.M. Epidermal growth factor receptor dimerization and activation require ligand-induced conformational changes in the dimer interface. Mol Cell Biol. 2005;25:7734–7742. doi: 10.1128/MCB.25.17.7734-7742.2005. [DOI] [PMC free article] [PubMed] [Google Scholar]
- 54.Turk H.F., Chapkin R.S. Analysis of epidermal growth factor receptor dimerization by BS3 cross-linking. Methods Mol Biol. 2014:25–34. doi: 10.1007/978-1-4939-1789-1_3. [DOI] [PMC free article] [PubMed] [Google Scholar]
- 55.Yan Y., Zuo X., Wei D. Concise review: emerging role of CD44 in cancer stem cells: a promising biomarker and therapeutic target. Stem Cells Transl Med. 2015;4:1033–1043. doi: 10.5966/sctm.2015-0048. [DOI] [PMC free article] [PubMed] [Google Scholar]
- 56.Abraham B.K., Fritz P., McClellan M., Hauptvogel P., Athelogou M., Brauch H. Prevalence of CD44+/CD24-/low cells in breast cancer may not be associated with clinical outcome but may favor distant metastasis. Clin Cancer Res. 2005;11:1154–1159. [PubMed] [Google Scholar]
- 57.Hu J., Li G., Zhang P., Zhuang X., Hu G. A CD44v subpopulation of breast cancer stem-like cells with enhanced lung metastasis capacity. Cell Death Dis. 2017;8 doi: 10.1038/cddis.2017.72. [DOI] [PMC free article] [PubMed] [Google Scholar]
- 58.Orian-Rousseau V., Chen L., Sleeman J.P., Herrlich P., Ponta H. CD44 is required for two consecutive steps in HGF/c-Met signaling. Genes Dev. 2002;16:3074–3086. doi: 10.1101/gad.242602. [DOI] [PMC free article] [PubMed] [Google Scholar]
- 59.Young A.I.J., Law A.M.K., Castillo L., Chong S., Cullen H.D., Koehler M. MCL-1 inhibition provides a new way to suppress breast cancer metastasis and increase sensitivity to dasatinib. Breast Cancer Res. 2016;18:125. doi: 10.1186/s13058-016-0781-6. [DOI] [PMC free article] [PubMed] [Google Scholar]
- 60.Campbell K.J., Dhayade S., Ferrari N., Sims A.H., Johnson E., Mason S.M. MCL-1 is a prognostic indicator and drug target in breast cancer. Cell Death Dis. 2018;9:19. doi: 10.1038/s41419-017-0035-2. [DOI] [PMC free article] [PubMed] [Google Scholar]
- 61.Jiao X., Katiyar S., Willmarth N.E., Liu M., Ma X., Flomenberg N. c-Jun induces mammary epithelial cellular invasion and breast cancer stem cell expansion. J Biol Chem. 2010;285:8218–8226. doi: 10.1074/jbc.M110.100792. [DOI] [PMC free article] [PubMed] [Google Scholar]
- 62.Vleugel M.M., Greijer A.E., Bos R., van der Wall E., van Diest P.J. c-Jun activation is associated with proliferation and angiogenesis in invasive breast cancer. Hum Pathol. 2006;37:668–674. doi: 10.1016/j.humpath.2006.01.022. [DOI] [PubMed] [Google Scholar]
- 63.Dobin A., Davis C.A., Schlesinger F., Drenkow J., Zaleski C., Jha S. STAR: ultrafast universal RNA-seq aligner. Bioinformatics. 2013;29:15–21. doi: 10.1093/bioinformatics/bts635. [DOI] [PMC free article] [PubMed] [Google Scholar]
- 64.Li B., Dewey C.N. RSEM: accurate transcript quantification from RNA-Seq data with or without a reference genome. BMC Bioinf. 2011;12:323. doi: 10.1186/1471-2105-12-323. [DOI] [PMC free article] [PubMed] [Google Scholar]
- 65.Andrews S. FastQC: a quality control tool for high throughput sequence data 2010.
- 66.Ewels P., Magnusson M., Lundin S., Käller M. MultiQC: summarize analysis results for multiple tools and samples in a single report. Bioinformatics. 2016;32:3047–3048. doi: 10.1093/bioinformatics/btw354. [DOI] [PMC free article] [PubMed] [Google Scholar]
- 67.Pearson K. On lines and planes of closest fit to systems of points in space. 1901.
- 68.van der Maaten L., Hinton G. Visualizing data using t-SNE. J Mach Learn Res. 2008;9:2579–2605. [Google Scholar]
- 69.Robinson M.D., McCarthy D.J., Smyth G.K. edgeR: a bioconductor package for differential expression analysis of digital gene expression data. Bioinformatics. 2010;26:139–140. doi: 10.1093/bioinformatics/btp616. [DOI] [PMC free article] [PubMed] [Google Scholar]
- 70.Ginestier C., Hur M.H., Charafe-Jauffret E., Monville F., Dutcher J., Brown M. ALDH1 is a marker of normal and malignant human mammary stem cells and a predictor of poor clinical outcome. Cell Stem Cell. 2007;1:555–567. doi: 10.1016/j.stem.2007.08.014. [DOI] [PMC free article] [PubMed] [Google Scholar]
- 71.Dontu G., Al-Hajj M., Abdallah W.M., Clarke M.F., Wicha M.S. Stem cells in normal breast development and breast cancer. Cell Prolif. 2003;36(Suppl 1):59–72. doi: 10.1046/j.1365-2184.36.s.1.6.x. [DOI] [PMC free article] [PubMed] [Google Scholar]
- 72.Lê S., Josse J., Husson F. FactoMineR: an R package for multivariate analysis. J Stat Softw. 2008;25:1–18. [Google Scholar]
Associated Data
This section collects any data citations, data availability statements, or supplementary materials included in this article.
Supplementary Materials
Data Availability Statement
Source code is freely available for download at https://github.com/GuanLab/Single-cell-pipeline, implemented in R. The datasets generated and/or analyzed during the current study is freely available for download at https://www.ncbi.nlm.nih.gov/Traces/study/?acc=PRJNA478449.