Highlights
-
•
We review the quantitative and qualitative behaviour of 22 infectious diseases caused by viruses.
-
•
The information is compared and visualized by means of Multidimensional Scaling technique.
-
•
The results are consistent with clinical practice.
-
•
The proposed mathematical tools tackle a large number of virus and information.
Keywords: Multidimensional scaling, Clustering, Virus diseases
Abstract
Background and Objective
Viruses are infectious agents that replicate inside organisms and reveal a plethora of distinct characteristics. Viral infections spread in many ways, but often have devastating consequences and represent a huge danger for public health. It is important to design statistical and computational techniques capable of handling the available data and highlighting the most important features.
Methods
This paper reviews the quantitative and qualitative behaviour of 22 infectious diseases caused by viruses. The information is compared and visualized by means of the multidimensional scaling technique.
Results
The results are robust to uncertainties in the data and revealed to be consistent with clinical practice.
Conclusions
The paper shows that the proposed methodology may represent a solid mathematical tool to tackle a larger number of virus and additional information about these infectious agents.
1. Introduction
Viruses exert enormous damage on humans worldwide and are the single most important cause of infectious morbidity and mortality. History was, and still is, shaped since ancient times by viral diseases. These diseases began to be characterized in the 19th century leading to the identification and differentiation of many viral illnesses [1]. The first viruses were identified at the end of the 19th century and since then the process of discovery has continued steadily with a growing momentum in these years. In fact, in recent years it is possible to visualize viral structure at an atomic level of resolution, nucleotide sequences of viral genomes are known, and functional domains of numerous viruses and enzymes have been established [1], [2]. This information is now being applied to the development of diagnostic tools and effective antiviral therapies.
The classification of viruses has also evolved. Firstly, sub-classifications were based on pathologic features such as the preference of a specific organ (for example, the liver in viral hepatitis). Secondly, some epidemiologic characteristics were defined as the transmission by arthropods (arbovirus, for example) [1]. The current classifications are based on the type and structure of the viral nucleic acid and its replication strategy, the symmetry type of the capsid of the virus, and the presence or absence of a lipid envelop [1], [2].
More than 2000 species of viruses have been identified and approximately 650 are capable of infecting humans and animals [2]. Diseases can range from the common cold to fatal events such as Ebola, Smallpox or Rabies [2]. Globally, viral diseases are very diverse and present several degrees of complexity.
In this study we will adopt multidimensional scaling (MDS) to visualize the relationships between 22 selected human viral infectious diseases. Some viruses were selected based on recent viral outbreaks and presence in the media (for example, Influenza A virus subtype H5N1, Ebola and Chikungunya), others were chosen due to historical reasons (for example, Rabies, Poliomyelitis and Smallpox), and still others due to their prevalence and incidence in human populations (for example, Influenza, Rhinovirus and Norovirus). In two viral diseases (Human Immunodeficiency Virus and Rabies) we consider both the treated and untreated paradigms of the disease due to the huge discrepancy in mortality.
MDS is proven to obtain a new perspective on visualizing global data associated with human pathologies. MDS is a set of techniques used to analyse similarities in data that produce spatial or geometric representations of complex objects [3], [4], [5]. MDS had its origin in behavioural sciences for its help in understanding judgements of individuals (as preference, or relatedness) concerning elements in a set of objects [6], [7], [8]. Nowadays, MDS is used with a large variety of real data, such as biological taxonomy [9], [10], [11], [12], finance [13], [14], marketing [15], sociology [16], physics [17], geophysics [18], [19], [20], communication networks [21], [22], biology and biomedics [23], [24], among others [25], [26].
Bearing these ideas in mind, the paper is organized as follows. In Section 2 we present the MDS technique. In Section 3 we study and compare data regarding 22 virus diseases. Finally, in Section 4 we draw the main conclusions.
2. Multidimensional scaling
Given s objects in a m-dimensional space and a measure of proximity, , between objects i and j, a symmetric s × s matrix, , of item to item (dis)similarities is calculated in a first step. The MDS algorithm produces a s × q (q < m) configuration, X, representing point coordinates (items), where q is specified by the user. Thus, row i from matrix X gives the coordinates of object i in the q-dimensional embedding space. Configuration X preserves, as best as possible, the proximities between pairwise elements in the higher m-dimensional space and unveils the underlying data structure. MDS is, consequently, different from other similar techniques, such as factor and cluster analysis, because there are no assumptions concerning which factors might drive each dimension. Additionally, MDS is able to treat distinct types of data, has better convergence rates, and is less complex than other methods [3], [27].
In order to arrive at the best configuration X, MDS evaluates different alternative configurations while minimizing a goodness-of-fit function. This problem, equivalent to minimizing the raw stress function, σ 2, can be formulated as [28]:
| (1) |
where is a user chosen non-negative weight and is a measure of the (dis)similarities among the items in the embedding space. Therefore, is usually a distance measure. Smaller (larger) distances between two objects translate into more (less) similarities between them. For example, the Minkowski distance provides a general way to specify distance for quantitative data in a multidimensional space:
| (2) |
where is the value of dimension k for object i and αk is a weight factor. When αk = 1, the Euclidean and the city-block distances are obtained for r = 2 and r = 1, respectively. Nevertheless, the MDS technique allows users to choose other metrics for the comparison of objects that can be better adequate for their data. In the sequel we will adopt the Canberra distance and the cosine correlation.
There are different stress measures, such as the normalized raw stress, which is σ 2 divided by the sum of squared dissimilarities. Possible alternatives are Kruskal's stress-1 and Kruskal's stress-2, which divide σ by the sum of squared distances, or by a function of the variances of distances, respectively. Another example is the S-stress measure given by the sum of squared errors between squared distances and squared dissimilarities [29], [30].
The Shepard diagram is used to infer the quality of the MDS solution. Let denote the similarities between objects i and j. A Shepard diagram consists of pairs and . If a line connecting the pairs is drawn, then the approximation error, concerning dissimilarities of each object, is given by . The Shepard diagram is thus useful for visualizing the residuals and outliers resulting from the MDS application to the data. A narrow scatter around the 45 degree line indicates a good fit between and .
The stress plot represents σ 2 versus the number of dimensions q of the MDS maps. Usually, we get a monotonic decreasing chart and we choose q as a compromise between reducing σ 2 and having a low dimension for the MDS charts.
MDS can be divided according to the classification of data similarities, the number of similarity matrices and the nature of the MDS model. We thus have the non-metric, or metric MDS, if similarity data are qualitative or quantitative. In what concerns the number of similarity matrices and nature of the model we have classical MDS (i.e., with one matrix and unweighted models), replicated MDS (i.e., with several matrices and unweighted models) and weighted MDS (i.e., with several matrices and weighted models).
The MDS interpretation is based on the emerging clusters and distances between points in the map, rather than on their absolute coordinates, or the geometrical form of the locus. Thus, we can rotate or translate the MDS chart since the distances between points remain identical. Usually, two or three dimensional charts are selected, because they allow a direct graphical representation.
MDS has advantages over other methods, such as principal component analysis (PCA), since MDS can follow similarity/dissimilarity matrices based on several distinct metrics. MDS uses the inter-object distances rather than the coordinates of the objects and, therefore, it turns out that the MDS is a more general method than PCA [18], [31].
3. Multidimensional scaling analysis
In this section we use MDS tools to visualize the relationships between s = 22 infectious diseases caused by viruses, namely Bird Flu (BFlu), Chicken Pox (CPox), Chikungunya (Chi), Dengue Fever (Den), Ebola (Ebo), Hepatitis B (HepB), HIV (HIV), HIV—untreated (HIV Un), Marburg virus disease (Mar), Measles (Mea), MERS (MERS), Mumps (Mum), Norovirus (Nor), Polio (Pol), Rabies (Rab), Rabies—untreated (Rab Un), Rhinovirus (Rhi), Rotavirus (Rot), Rubella (Rub), SARS (SARS), Seasonal Flu (SFlu) and Smallpox (Sma).
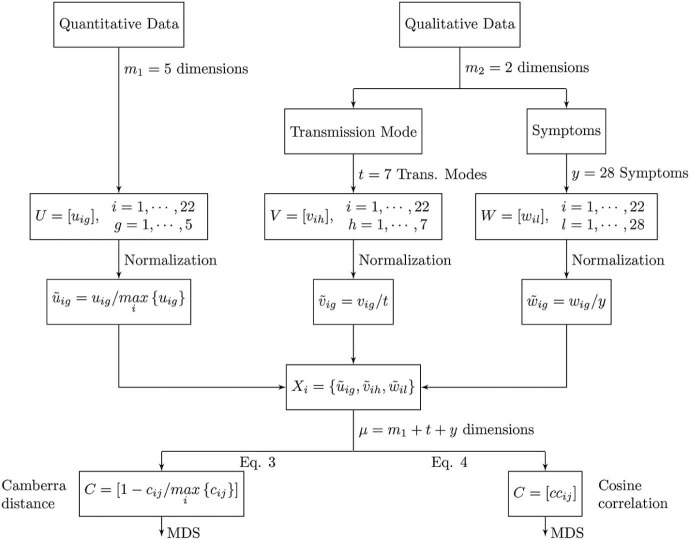
To the disease, , we associate m 1 = 5 quantitative and m 2 = 2 qualitative features. Therefore, we have a dimensional space of attributes. We start by pre-processing the quantitative and the qualitative data, yielding a new equivalent µ-dimensional space (to be defined in the sequel) for disease comparison.
Table 1 lists the quantitative data, , , . We consider the disease fatality rate, the average basic reproductive number, the average serial interval, the incubation period and the virus survival time outside the host.
Table 1.
Quantitative attributes of the diseases considered in the study.
| Disease | Acronym | Fatality rate (%) | Average basic reproductive number | Average serial interval (days) | Incubation period (days) | Survival outside host (days) | |
|---|---|---|---|---|---|---|---|
| i | g | 1 | 2 | 3 | 4 | 5 | |
| 1 | Bird flu | BFlu | 59.00 | 2.00 | 3.00 | 3.0 | 30.0 |
| 2 | Chicken pox | CPox | 0.00 | 7.50 | 14.00 | 14.0 | 2.0 |
| 3 | Chikungunya | Chi | 0.40 | 4.00 | 23.00 | 2.5 | – |
| 4 | Dengue fever | Den | 5.00 | 3.00 | 16.00 | 7.0 | 63.0 |
| 5 | Ebola | Ebo | 75.00 | 2.50 | 15.30 | 11.4 | 50.0 |
| 6 | Hepatitis B | HepB | 0.75 | 6.00 | 25.00 | 75.0 | 28.0 |
| 7 | HIV | HIV | 2.10 | 3.50 | – | 60.0 | 42.0 |
| 8 | HIV—untreated | HIV Un | 80.00 | 3.50 | – | 60.0 | 42.0 |
| 9 | Marburg virus disease | Mar | 25.00 | 1.60 | 9.00 | 6.0 | 21.0 |
| 10 | Measles | Mea | 0.20 | 15.00 | 11.70 | 11.0 | 0.1 |
| 11 | MERS | MERS | 27.00 | 0.50 | 7.60 | 5.0 | 3.0 |
| 12 | Mumps | Mum | 0.01 | 5.50 | 18.00 | 17.0 | 0.3 |
| 13 | Norovirus | Nor | 0.08 | 3.70 | 1.86 | 1.5 | 24.0 |
| 14 | Polio | Pol | 22.00 | 6.00 | – | 13.0 | 160.0 |
| 15 | Rabies | Rab | 0.00 | 1.60 | – | 40.0 | 6.0 |
| 16 | Rabies—untreated | Rab Un | 100.00 | 1.60 | – | 40.0 | 6.0 |
| 17 | Rhinovirus | Rhi | 0.00 | 3.70 | 7.50 | 3.0 | 1.0 |
| 18 | Rotavirus | Rot | 0.00 | 3.50 | 7.00 | 1.5 | 60.0 |
| 19 | Rubella | Rub | 0.00 | 6.50 | 18.30 | 17.7 | 0.9 |
| 20 | SARS | SARS | 11.00 | 3.50 | 10.00 | 8.0 | 9.0 |
| 21 | Seasonal flu | SFlu | 0.01 | 1.30 | 3.30 | 2.0 | 2.0 |
| 22 | Smallpox | Sma | 15.00 | 6.00 | 17.70 | 14.0 | 1.5 |
Table 2, Table 3 summarize the qualitative features, namely the transmission mode, and the main symptoms of the disease.
Table 2.
Main transmission mode of the diseases considered in the study.
| Disease | Acronym | Animal–human | Airborne droplet | Bites | Body fluids | Sexual contact | Surfaces | Faecal–oral | |
|---|---|---|---|---|---|---|---|---|---|
| i | h | 1 | 2 | 3 | 4 | 5 | 6 | 7 | |
| 1 | Bird flu | BFlu | 1 | 0 | 0 | 0 | 0 | 0 | 0 |
| 2 | Chicken pox | CPox | 0 | 1 | 0 | 0 | 0 | 0 | 0 |
| 3 | Chikungunya | Chi | 0 | 0 | 1 | 0 | 0 | 0 | 0 |
| 4 | Dengue fever | Den | 0 | 0 | 1 | 0 | 0 | 0 | 0 |
| 5 | Ebola | Ebo | 0 | 0 | 0 | 1 | 0 | 0 | 0 |
| 6 | Hepatitis B | HepB | 0 | 0 | 0 | 1 | 1 | 0 | 0 |
| 7 | HIV | HIV | 0 | 0 | 0 | 1 | 1 | 0 | 0 |
| 8 | HIV—untreated | HIV Un | 0 | 0 | 0 | 1 | 1 | 0 | 0 |
| 9 | Marburg virus disease | Mar | 0 | 0 | 0 | 1 | 0 | 0 | 0 |
| 10 | Measles | Mea | 0 | 1 | 0 | 0 | 0 | 0 | 0 |
| 11 | MERS | MERS | 0 | 1 | 0 | 0 | 0 | 0 | 0 |
| 12 | Mumps | Mum | 0 | 1 | 0 | 0 | 0 | 1 | 0 |
| 13 | Norovirus | Nor | 0 | 0 | 0 | 0 | 0 | 1 | 1 |
| 14 | Polio | Pol | 0 | 0 | 0 | 0 | 0 | 0 | 1 |
| 15 | Rabies | Rab | 0 | 0 | 1 | 0 | 0 | 0 | 0 |
| 16 | Rabies—untreated | Rab Un | 0 | 0 | 1 | 0 | 0 | 0 | 0 |
| 17 | Rhinovirus | Rhi | 0 | 1 | 0 | 0 | 0 | 0 | 1 |
| 18 | Rotavirus | Rot | 0 | 0 | 0 | 0 | 0 | 1 | 1 |
| 19 | Rubella | Rub | 0 | 1 | 0 | 0 | 0 | 0 | 0 |
| 20 | SARS | SARS | 0 | 1 | 0 | 0 | 0 | 0 | 1 |
| 21 | Seasonal flu | SFlu | 0 | 1 | 0 | 0 | 0 | 0 | 0 |
| 22 | Smallpox | Sma | 0 | 1 | 0 | 0 | 0 | 0 | 0 |
Table 3.
Main symptoms of the diseases considered in the study.
| Disease | Acronym | Fever | Cough | Sore throat | Muscle and body aches | Nausea | Abdominal pain | Diarrhoea | Vomiting | Rash | Itchy | Fluid blisters | Tiredness, fatigue, weakness | Loss of appetite | Headache | Joint pain | Joint swelling | Bleeding | Jaundice | Swollen glands | Chills | Chest pain | Runny nose | Conjunctivitis | Red spots | Shortness of breath | Confusion | Agitation | Sneezing | |
|---|---|---|---|---|---|---|---|---|---|---|---|---|---|---|---|---|---|---|---|---|---|---|---|---|---|---|---|---|---|---|
| i | l | 1 | 2 | 3 | 4 | 5 | 6 | 7 | 8 | 9 | 10 | 11 | 12 | 13 | 14 | 15 | 16 | 17 | 18 | 19 | 20 | 21 | 22 | 23 | 24 | 25 | 26 | 27 | 28 | |
| 1 | Bird flu | BFlu | 1 | 1 | 1 | 1 | 1 | 1 | 1 | 1 | 0 | 0 | 0 | 0 | 0 | 0 | 0 | 0 | 0 | 0 | 0 | 0 | 0 | 0 | 0 | 0 | 0 | 0 | 0 | 0 |
| 2 | Chicken pox | CPox | 1 | 0 | 0 | 0 | 0 | 0 | 0 | 0 | 1 | 1 | 1 | 1 | 1 | 1 | 0 | 0 | 0 | 0 | 0 | 0 | 0 | 0 | 0 | 0 | 0 | 0 | 0 | 0 |
| 3 | Chikungunya | Chi | 1 | 0 | 0 | 1 | 0 | 0 | 0 | 0 | 1 | 0 | 0 | 0 | 0 | 1 | 1 | 1 | 0 | 0 | 0 | 0 | 0 | 0 | 0 | 0 | 0 | 0 | 0 | 0 |
| 4 | Dengue fever | Den | 1 | 0 | 0 | 1 | 0 | 0 | 0 | 0 | 1 | 0 | 0 | 0 | 0 | 1 | 1 | 0 | 1 | 0 | 0 | 0 | 0 | 0 | 0 | 0 | 0 | 0 | 0 | 0 |
| 5 | Ebola | Ebo | 1 | 0 | 0 | 1 | 0 | 1 | 1 | 1 | 0 | 0 | 0 | 1 | 0 | 1 | 0 | 0 | 1 | 0 | 0 | 0 | 0 | 0 | 0 | 0 | 0 | 0 | 0 | 0 |
| 6 | Hepatitis B | HepB | 1 | 0 | 0 | 0 | 1 | 1 | 0 | 1 | 0 | 0 | 0 | 1 | 1 | 0 | 1 | 0 | 0 | 1 | 0 | 0 | 0 | 0 | 0 | 0 | 0 | 0 | 0 | 0 |
| 7 | HIV | HIV | 1 | 0 | 1 | 1 | 0 | 0 | 0 | 0 | 1 | 0 | 0 | 1 | 0 | 1 | 1 | 0 | 0 | 0 | 1 | 0 | 0 | 0 | 0 | 0 | 0 | 0 | 0 | 0 |
| 8 | HIV—untreated | HIV Un | 1 | 0 | 1 | 1 | 0 | 0 | 0 | 0 | 1 | 0 | 0 | 1 | 0 | 1 | 1 | 0 | 0 | 0 | 1 | 0 | 0 | 0 | 0 | 0 | 0 | 0 | 0 | 0 |
| 9 | Marburg virus disease | Mar | 1 | 0 | 1 | 1 | 1 | 1 | 1 | 1 | 1 | 0 | 0 | 0 | 0 | 1 | 0 | 0 | 1 | 0 | 0 | 1 | 1 | 0 | 0 | 0 | 0 | 0 | 0 | 0 |
| 10 | Measles | Mea | 1 | 1 | 0 | 0 | 0 | 0 | 0 | 0 | 0 | 0 | 0 | 0 | 0 | 0 | 0 | 0 | 0 | 0 | 0 | 0 | 0 | 1 | 1 | 1 | 0 | 0 | 0 | 0 |
| 11 | MERS | MERS | 1 | 1 | 0 | 0 | 1 | 0 | 1 | 1 | 0 | 0 | 0 | 0 | 0 | 0 | 0 | 0 | 0 | 0 | 0 | 0 | 0 | 0 | 0 | 0 | 1 | 0 | 0 | 0 |
| 12 | Mumps | Mum | 1 | 0 | 0 | 1 | 0 | 0 | 0 | 0 | 0 | 0 | 0 | 1 | 1 | 1 | 0 | 0 | 0 | 0 | 1 | 0 | 0 | 0 | 0 | 0 | 0 | 0 | 0 | 0 |
| 13 | Norovirus | Nor | 1 | 0 | 0 | 1 | 1 | 1 | 1 | 1 | 0 | 0 | 0 | 0 | 0 | 1 | 0 | 0 | 0 | 0 | 0 | 0 | 0 | 0 | 0 | 0 | 0 | 0 | 0 | 0 |
| 14 | Polio | Pol | 1 | 0 | 1 | 0 | 1 | 1 | 0 | 0 | 0 | 0 | 0 | 1 | 0 | 1 | 0 | 0 | 0 | 0 | 0 | 0 | 0 | 0 | 0 | 0 | 0 | 0 | 0 | 0 |
| 15 | Rabies | Rab | 1 | 0 | 0 | 0 | 0 | 0 | 0 | 0 | 0 | 0 | 0 | 1 | 0 | 1 | 0 | 0 | 0 | 0 | 0 | 0 | 0 | 0 | 0 | 0 | 0 | 1 | 1 | 0 |
| 16 | Rabies—untreated | Rab Un | 1 | 0 | 0 | 0 | 0 | 0 | 0 | 0 | 0 | 0 | 0 | 1 | 0 | 1 | 0 | 0 | 0 | 0 | 0 | 0 | 0 | 0 | 0 | 0 | 0 | 1 | 1 | 0 |
| 17 | Rhinovirus | Rhi | 0 | 1 | 1 | 0 | 0 | 0 | 0 | 0 | 0 | 0 | 0 | 0 | 0 | 0 | 0 | 0 | 0 | 0 | 0 | 0 | 0 | 1 | 0 | 0 | 0 | 0 | 0 | 1 |
| 18 | Rotavirus | Rot | 1 | 0 | 0 | 0 | 0 | 1 | 1 | 1 | 0 | 0 | 0 | 0 | 0 | 0 | 0 | 0 | 0 | 0 | 0 | 0 | 0 | 0 | 0 | 0 | 0 | 0 | 0 | 0 |
| 19 | Rubella | Rub | 1 | 0 | 0 | 0 | 0 | 0 | 0 | 0 | 1 | 0 | 0 | 0 | 0 | 0 | 1 | 0 | 0 | 0 | 1 | 0 | 0 | 0 | 0 | 0 | 0 | 0 | 0 | 0 |
| 20 | SARS | SARS | 1 | 0 | 0 | 1 | 0 | 0 | 1 | 0 | 0 | 0 | 0 | 1 | 0 | 1 | 0 | 0 | 0 | 0 | 0 | 0 | 0 | 0 | 0 | 0 | 0 | 0 | 0 | 0 |
| 21 | Seasonal flu | SFlu | 1 | 1 | 1 | 1 | 0 | 0 | 1 | 1 | 0 | 0 | 0 | 1 | 0 | 1 | 0 | 0 | 0 | 0 | 0 | 0 | 0 | 1 | 0 | 0 | 0 | 0 | 0 | 0 |
| 22 | Smallpox | Sma | 1 | 0 | 0 | 1 | 0 | 0 | 0 | 1 | 0 | 0 | 0 | 1 | 0 | 1 | 0 | 0 | 0 | 0 | 0 | 0 | 0 | 0 | 0 | 0 | 0 | 0 | 0 | 0 |
The transmission mode dimension is represented as binary data (Table 2 ), , , . This means that we consider t = 7 conditions, specifically animal–human, airborne droplet, bites, body fluids, sexual contact, surfaces and faecal–oral. The value means that disease i has the transmission mode h, and means that disease i does not have the transmission mode h.
In a similar way, for the symptoms dimension we consider y = 28 indicators, represented as binary data , , (Table 3 ). The value (or 0) means that disease i has (or has not) symptom l.
Before applying the MDS algorithm we start by “normalizing” the quantitative data to the interval [0, 1], i.e., . For the qualitative data, we apply and , meaning that and . In this way we avoid having some features saturating the numerical values.
We proceed by constructing the vectors of features , yielding a µ-dimensional space that embeds all quantitative and qualitative data. This is equivalent to the m-dimensional space defined previously for disease comparison.
In the next subsections we use two indices to compare the preprocessed data, namely the Canberra distance, , and the cosine correlation, . Other indices can be adopted, but these two are sufficient to explain the working concepts. We then apply the MDS technique and interpret the generated maps. Fig. 1 depicts a synoptic diagram of the disease's characteristics and quantification method.
Fig. 1.
Synoptic diagram of the disease's characteristics and quantification method. The indices denote: i—disease; g—quantitative data; h—qualitative data, transmission mode; l—qualitative data, symptoms.
In constructing Table 1, Table 2, Table 3, data were collected from the following sources: Influenza A virus subtype H5N1 commonly known as “Bird Flu” [32], [33], [34], [35]; Chicken Pox (varicella-zoster virus infection) [36], [37], [38], [39]; Chikungunya [40], [41], [42]; Dengue Fever [43], [44]; Ebola [45], [46], [47]; Hepatitis B [48], [49], [50]; Human Immunodeficiency Virus (HIV) and HIV—untreated [51], [52], [53], [54]; Marburg haemorrhagic fever [47], [55]; Measles [56], [57], [58], [59], [60]; Middle East Respiratory Syndrome (MERS) [61], [62], [63]; Mumps [64], [65]; Norovirus [66], [67]; Poliomyelitis [68], [69], [70]; Rabies and Rabies—untreated [71], [72], [73], [74]; Rhinovirus [75], [76], [77]; Rotavirus [78], [79], [80], [81]; Rubella [58], [82]; Severe Acute Respiratory Syndrome (SARS) [61], [83]; Influenza causing seasonal flu [34], [84], [85]; and Smallpox [86], [87].
3.1. MDS analysis based on the Canberra distance
In this subsection we consider the construction of matrix X using a measure based on the Canberra distance, , between diseases i and j :
| (3) |
Given this index, the s × s symmetric matrix, , is then computed and the MDS tool applied. While several MDS criteria were tested, the Sammon criterion revealed good results and was adopted in all calculations. It should be noted that this criterion tries to optimize a cost function that describes how well the pairwise distances in a data set are preserved [88], [89].
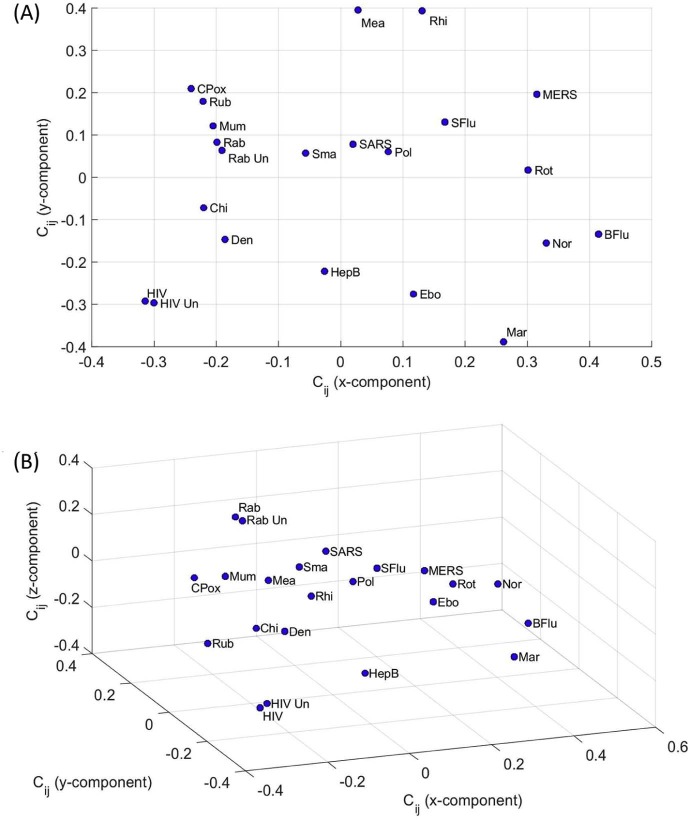
Fig. 2 depicts the 2- and 3-dimensional (2D and 3D) maps produced by MDS. Each point represents a disease, denoted by the corresponding label as shown in Table 1, Table 2, Table 3. We can observe that the Canberra index leads to poor clustering. Nonetheless, we should note that MDS is merely a mathematical clustering and visualization tool and that a physical perspective of the reported results must be found in the light of the comparison index [90]. Therefore, a further explanation about physical mechanisms associated with the results must be envisaged by standard complementary procedures.
Fig. 2.
MDS maps for the Canberra index with representations: (A) 2D; (B) 3D.
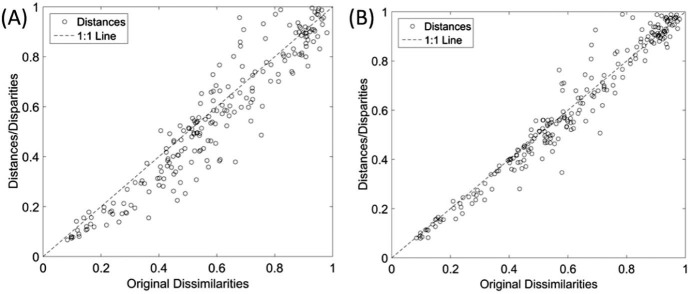
Fig. 3, Fig. 4 depict the Shepard and stress plots, respectively, which represent standard tools for the assessment of the MDS results. The Shepard diagram shows a good distribution of points around the 45 degree line, particularly for the 3D representation, which means a good fit of the distances to the dissimilarities. The stress plot reveals that a three dimensional space describes well the locus of the s = 22 diseases. In fact, the stress diminishes strongly until q = 2, moderately towards q = 3 and weakly. The maximum curvature point of the stress plot is often adopted as the criterion for deciding the dimensionality of the MDS maps. This means that, although four or more dimensions would represent the data slightly more accurately, 3D maps represent a good compromise between accuracy and easiness of visualization.
Fig. 3.
Shepard plots for the Canberra index for representations: (A) 2D; (B) 3D.
Fig. 4.
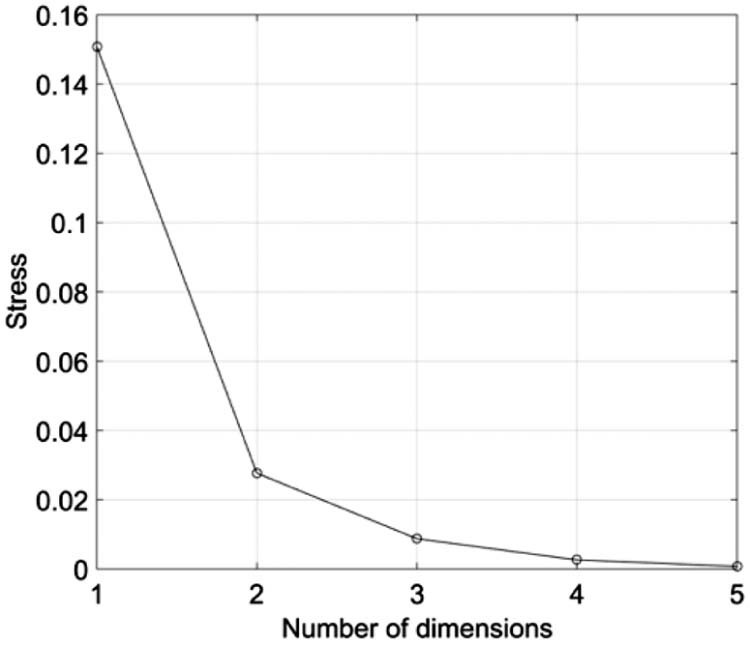
Stress versus q plot for the Canberra index .
3.2. MDS analysis based on the cosine correlation
In this subsection we adopt the cosine correlation, , to construct the matrix X. For each disease pair i and j we have:
| (4) |
where represents weights, specified by the user, which are usually chosen to favour adequate clustering. Given expression (4) the s × s symmetric matrix, , is computed and the MDS is applied.
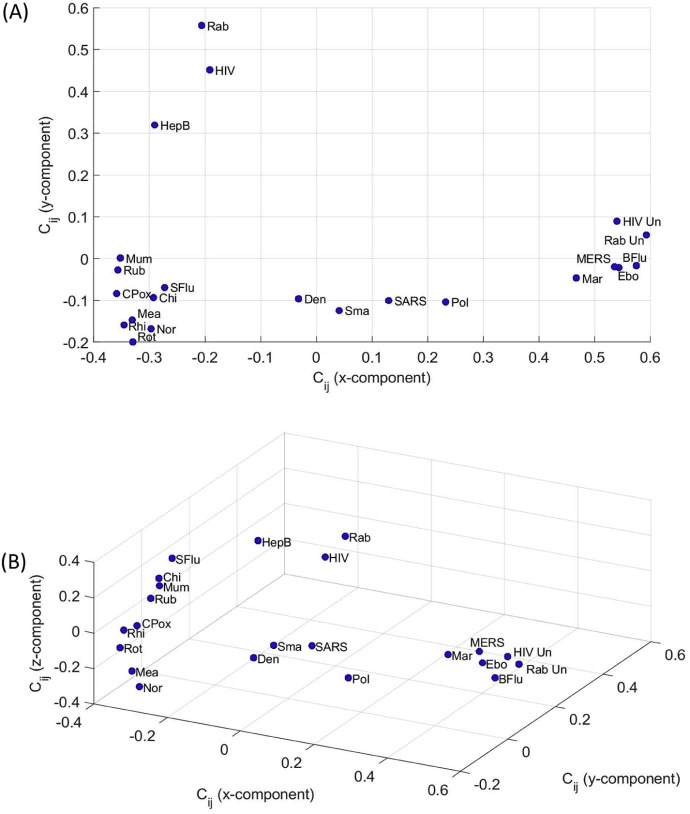
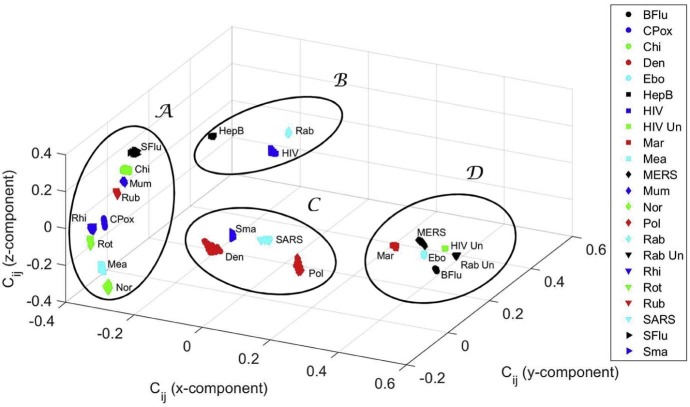
Fig. 5 represents the 2D and 3D maps resulting from the MDS analysis for , αp = 0.5, αq = 2. The Shepard and stress plots are identical to the maps shown in Fig. 3, Fig. 4, revealing, as before, that the MDS results are trustworthy. We observe now the emergence of a different pattern, but the main idea of clustering remains. This observation is usual in MDS charts, where alternative indices capture different characteristics of the phenomena and lead to distinct plots, but allowing the same conclusions. The “best” index is simply the one that produces a MDS map where clusters reflect real-world in a more direct perspective.
Fig. 5.
MDS maps for the cosine correlation with representations: (A) 2D; (B) 3D.
3.3. Clustering analysis
The standard MDS analysis is based on the object groups in the final map. We can rely either in the direct visualization of the plot, or in the implementation of some extra algorithm to extract the clusters.
Bearing this idea in mind, in subsection 3.3.1 we adopt the non-hierarchical clustering algorithm K-means to identify clusters in the MDS map. In subsection 3.3.2 we use hierarchical clustering to confirm the results obtained. In subsection 3.3.3 we analyse the sensitivity of the MDS maps. In subsection 3.3.4 we discuss the results.
We restrict the analysis to the cosine correlation metric since it revealed better results.
3.3.1. K-means clustering
Clustering consists on grouping objects that are, in some sense, similar to each other. The K-means is a non-hierarchical clustering method commonly used in machine learning and data mining [91]. The algorithm starts with a collection of s objects, where each object is a point in a q-dimensional space, and a given number of clusters, K, specified in advance by the user. The K-means groups the s objects into K ≤ s clusters, so as to minimize the objective function given by the sum of distances between the points and the centres of their clusters. The K-means arrives at a solution in which objects within each cluster are as close to each other as possible, and as far from objects in other clusters as possible.
A key issue in K-means is how to determine the correct number of clusters, K. It should be noted that the very notion of “good clustering” is subjective and is a question of point of view. However, we can rely on different indices to measure the quality of the clustering, namely the Davies–Bouldin, the Caliński–Harabasz and the silhouette indices [92], [93], [94].
In this work we adopt the silhouette to compare different solutions. The silhouette value, S, for each object, is a measure of how well each object lies within its cluster. Silhouette values vary in the interval S ∈ [−1, 1]. Silhouette values closer to S = 1 correspond to objects that are very distant from neighbouring clusters and, therefore, they are assigned to the right cluster. If S = 0, then the objects could be assigned to another cluster. When S = −1, then the objects are correctly assigned.
Given the coordinates of the s = 22 objects in the q = 3 dimensional space generated by the MDS, we evaluate the clusters identified by the K-means algorithm when varying the number of clusters in the interval K ∈ [2, 7].
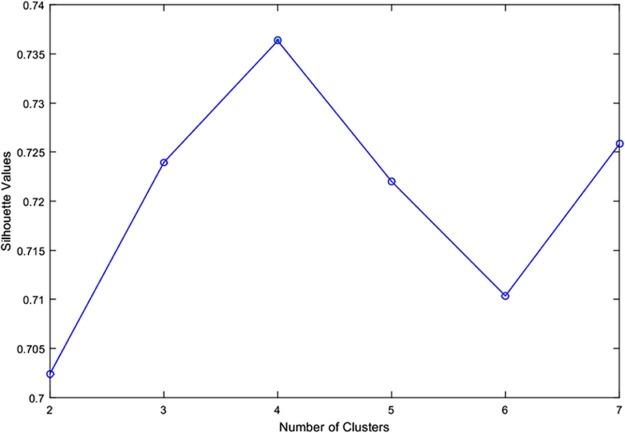
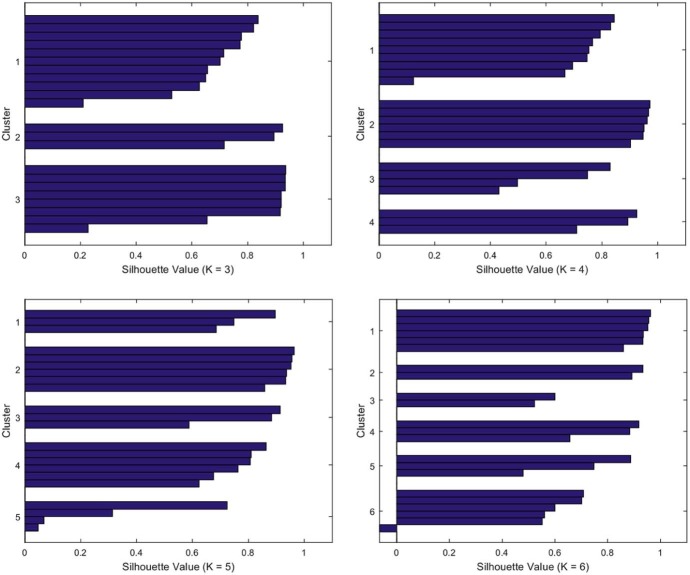
Fig. 6 depicts the silhouette average values versus the number of clusters, K, leading to the optimum value K = 4. Fig. 7 illustrates the shape of the silhouettes obtained for , where we can see that the best shape is obtained for K = 4.
Fig. 6.
Silhouette average values versus number of clusters K, for K ∈ [2, 7].
Fig. 7.
Silhouette shape for .
For K = 4, the K-means generates the clusters , , and , to be discussed in subsection 3.3.4.
3.3.2. Hierarchical clustering
As an alternative approach, not involving the MDS, we use a hierarchical clustering algorithm that is fed directly with matrix .
Fig. 8 depicts the dendrogram generated by successive (agglomerative) clustering and average-linkage method [95], [96]. We cut the tree at the level 0.27, since below this value we see that the clusters became too close from each other. We see that four clusters emerge with this method, confirming the results obtained in the previous subsection. Nevertheless, MDS uses more efficiently the space and produces charts with a more fruitful map for the objects.
Fig. 8.
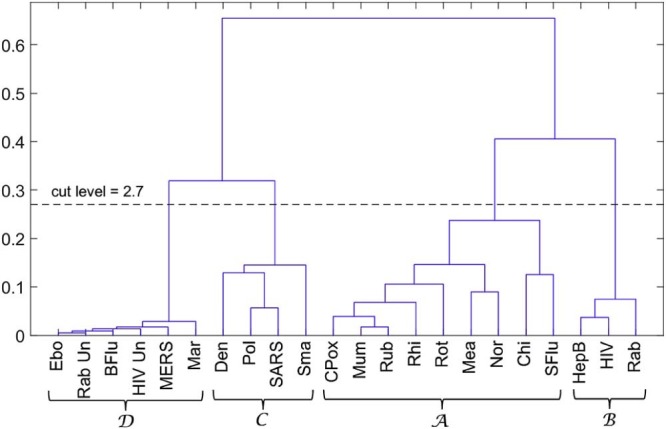
Dendrogram generated by the hierarchical clustering algorithm for the cosine correlation index.
3.3.3. Sensitivity analysis
The s = 22 virus diseases were compared based on quantitative and qualitative features. As qualitative characteristics are subjective, their influence upon the final results needs to be analysed, so as to prevent biased conclusions.
In this line of thought, we vary the weights, {αp, αq}, of the two qualitative features in the interval and we check their influence in the generated MDS map. Each weight is discretized into r distinct values evenly spaced in the intervals and then r × r instances of the s × s dimensional similarity matrix are calculated. We use these matrices as the input for the MDS algorithm that generates r × r intermediate maps of “points” (i.e., one map per {αp, αq} pair). Finally, the charts are processed by means of Procrustes analysis in order to obtain a single global plot of “shapes”, where the “points” of the original maps are optimally superimposed [97].
Procrustes analysis performs linear transformations, namely translation, reflection, orthogonal rotation and scaling, with the objective of minimizing a measure of the difference between the “points” in the original maps. The algorithm (i) chooses one MDS map for reference (by selecting one of the available instances); (ii) superimposes all other MDS instances into the current reference; (iii) computes the mean form of the current set of superimposed maps; (iv) compares the distance between the mean and the reference instances to a given threshold value and, if above, sets the reference to the mean form and continues to step (ii).
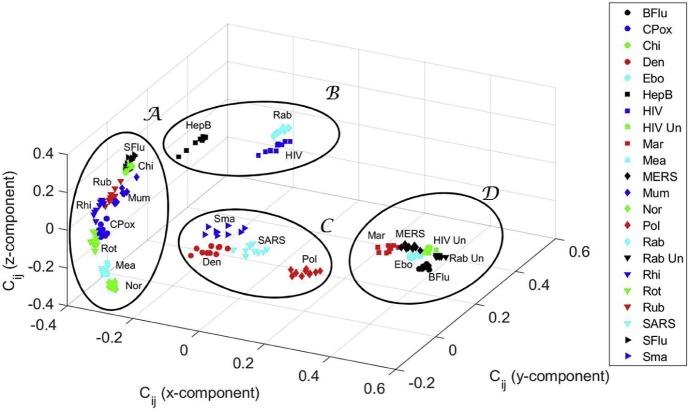
Fig. 9 shows the 3D MDS global map obtained by the Procrustes algorithm, as well as the clusters identified previously. As can be seen, the results are quite robust to large variations in the qualitative features, since the r × r points corresponding to each original object (disease) deviate somehow, but the clusters remain.
Fig. 9.
Three-dimensional MDS global map for the cosine correlation , obtained by Procrustes with .
In a complementary perspective we address in the sequel the sensitivity of the MDS results to quantitative features. In fact, the quantitative values found in the literature diverge slightly, since they depend on the time of the study and on the conditions observed in each particular case, namely environmental conditions (e.g., temperature, humidity, pressure), geographic region, human development, medical assistance, among others.
To assess the sensitivity we add random noise to the values of the quantitative features, with amplitude in the interval ±10% of the values shown in Table 1 (values are limited to zero to avoid negative numbers). In these conditions, we perform ten experiments, generating one MDS map per trial, and then the MDS individual maps are combined using Procrustes.
Fig. 10 illustrates the 3D MDS global map obtained and the corresponding superimposed clusters . We conclude that the method is robust to variations in the values of the quantitative features used in the study.
Fig. 10.
Three-dimensional MDS global map for the cosine correlation , obtained by Procrustes with random variations in the values of the quantitative features.
3.3.4. Discussion
The clusters have interesting medical and epidemiological value. In cluster , we find the Ebola and the Marburg viruses, which can cause serious, or most of the times, a lethal human disease, even with therapeutic interventions. According to the National Institutes of Health (NIH) Guidelines for Research Involving Recombinant or Synthetic Nucleic Acid Molecules (http://osp.od.nih.gov/sites/default/files/NIH_Guidelines.html#_Toc351276292) of the USA, from November 2013, those viruses are classified as Risk Group 4 pathogens. There are no vaccines or effective treatments for their infections. Accordingly, these viruses are manipulated only in Biosafety Level 4 conditions due to their high individual and community risk. They are also considered biological agents with material threat determinations in the scope of bioterrorism, in the USA [98]. Also, the highly infectious agents responsible for MERS (from the Coronaviridae Subfamily) and Bird flu (Influenza A virus subtype H5N1), classified as Risk Group 3, are mapped in . These viruses are recommended to be manipulated with Biosafety Level 3 precautions, indicated for agents that may cause serious or potentially lethal disease. In this cluster, untreated HIV and untreated rabies infections are also present.
In contrast, and distant in the MDS map, we have cluster . Most of the viruses are in Risk Group 2, because they generally do not cause serious or life threatening illness and most of them are readily treated or prevented easily with vaccines. They are manipulated, as most viruses, in Biosafety Level 2 environments. There is the exception of the Chikungunya, an important cause of febrile illness in the world, and now re-emerging as cause of large outbreaks of human disease [99]. The arbovirus (arthropod-borne) alphavirus responsible for this pathology is considered a Risk Group 3 pathogen and requires Biosafety Level 3 precautions [100].
Cluster presents several virus species of different Risk Groups. Polio virus is a Risk Group 2 pathogen as well as the dengue fever virus, an arbovirus. On the other hand, the SARS-associated coronavirus is a pathogen of the Risk Group 3. Furthermore, smallpox, the disease caused by the variola virus, is also present in . Variola is considered a life-threatening disease posing the highest risk to national security due to its potential use as a biological weapon due to the high mortality rates and the major public health impact [98]. The reason is that smallpox was declared eradicated by the World Health Organization (WHO) in 1980, and vaccination, once widely practised, stopped in the same year [98]. Therefore, cluster can be considered as a transition cluster from to . In other words, it is located in the MDS map “equidistant” from and .
Identical reasoning can be applied to cluster . In this cluster are the lentivirus (a subgroup of retrovirus) that causes HIV infection and acquired immunodeficiency syndrome (AIDS), a Risk Group 3 pathogen but generally manipulated with Biosafety Level 2 precautions, and the hepatitis B virus, considered belonging to Risk Group 2, equally transmitted by body fluids, and requiring a Biosafety Level 2 environment. Also considered of the Risk Group 2 is the third pathogen present in , i.e., the virus of Lyssavirus genus of the Rhabdoviridae family that causes rabies. Note that if the diseases caused by HIV and rabies are non-treated, then there is a high lethality in humans. They emerge in cluster of the MDS map.
In conclusion, the MDS map resulted in a new visualization of the complex quantitative and qualitative data of several diseases caused by viruses, and several clusters were organized having some medical and epidemiological interest. In particular, a cluster emerged with viruses like Ebola and MERS, which are responsible for some recent viral outbreaks. In contrast, in the same MDS map, and distant from the previous group, there is a cluster of viruses associated with human diseases that present generally preventive and therapeutic interventions. The development of this methodology may help in understanding the dynamics of viral diseases.
4. Conclusion
This paper addressed the clinical characteristics of 22 viruses. A significant number of quantitative and qualitative characteristics were considered. When handling a large volume of information, we are confronted with the problem of comparing all details, but highlighting the most important properties. Discharging information a priori may lead to incomplete or even biased results. Therefore, embedding all details requires adequate statistical, computational and visualization techniques capable of revealing the main aspects while “filtering” the information with low relevance. The MDS technique adopted in this study proved to produce solid results in accordance with present day knowledge about those infectious agents.
Conflict of interest
The authors declare no conflict of interest.
References
- 1.Bennett J.E., Dolin R., Blaser M.J. Elsevier Health Sciences; Philadelphia: 2014. Mandell, Douglas, and Bennett's Principles and Practice of Infectious Diseases. [Google Scholar]
- 2.Murray P.R., Rosenthal K.S., Pfaller M.A. Elsevier Health Sciences; Philadelphia: 2013. Medical Microbiology. [Google Scholar]
- 3.Borg I., Groenen P.J. Springer Science & Business Media; Springer-Verlag, New York: 2005. Modern Multidimensional Scaling: Theory and Applications. [Google Scholar]
- 4.Cox T.F., Cox M.A. CRC Press; Boca Raton: 2000. Multidimensional Scaling. [Google Scholar]
- 5.Davison M.L. vol. 85. Wiley; New York: 1983. (Multidimensional Scaling). [Google Scholar]
- 6.Fenton M., Pearce P. Multidimensional scaling and tourism research. Annal. Tour. Res. 1988;15(2):236–254. [Google Scholar]
- 7.Lawless H.T., Sheng N., Knoops S.S. Multidimensional scaling of sorting data applied to cheese perception. Food Qual. Prefer. 1995;6(2):91–98. [Google Scholar]
- 8.Torgerson W.S. Wiley; New York: 1958. Theory and Methods of Scaling. [Google Scholar]
- 9.Caballero I.S., Yen J.Y., Hensley L.E., Honko A.N., Goff A.J., Connor J.H. Lassa and Marburg viruses elicit distinct host transcriptional responses early after infection. BMC Genomics. 2014;15(1):960. doi: 10.1186/1471-2164-15-960. [DOI] [PMC free article] [PubMed] [Google Scholar]
- 10.Kim J., Ahn Y., Lee K., Park S.H., Kim S. A classification approach for genotyping viral sequences based on multidimensional scaling and linear discriminant analysis. BMC Bioinformatics. 2010;11(1):434. doi: 10.1186/1471-2105-11-434. [DOI] [PMC free article] [PubMed] [Google Scholar]
- 11.Lacher D.A., Lehmann P.F. Application of multidimensional scaling in numerical taxonomy: analysis of isoenzyme types of Candida species. Ann. Clin. Lab. Sci. 1991;21(2):94–103. [PubMed] [Google Scholar]
- 12.Vukea P.R., Willows-Munro S., Horner R.F., Coetzer T.H. Phylogenetic analysis of the polyprotein coding region of an infectious South African bursal disease virus (IBDV) strain. Infect. Genet. Evol. 2014;21:279–286. doi: 10.1016/j.meegid.2013.11.017. [DOI] [PubMed] [Google Scholar]
- 13.Tenreiro Machado J., Duarte F.B., Duarte G.M. Analysis of financial data series using fractional Fourier transform and multidimensional scaling. Nonlin. Dynam. 2011;65(3):235–245. [Google Scholar]
- 14.Tenreiro Machado J.A., Lopes A.M., Galhano A.M. Multidimensional scaling visualization using parametric similarity indices. Entropy. 2015;17(4):1775–1794. [Google Scholar]
- 15.Cil I. Consumption universes based supermarket layout through association rule mining and multidimensional scaling. Expert Syst. Appl. 2012;39(10):8611–8625. [Google Scholar]
- 16.Corten R. Visualization of social networks in Stata using multidimensional scaling. Stata J. 2011;11(1):52. [Google Scholar]
- 17.Hollemeyer K., Altmeyer W., Heinzle E., Pitra C. Matrix-assisted laser desorption/ionization time-of-flight mass spectrometry combined with multidimensional scaling, binary hierarchical cluster tree and selected diagnostic masses improves species identification of Neolithic keratin sequences from furs of the Tyrolean Iceman Oetzi. Rapid Commun. Mass Spectrom. 2012;26(16):1735–1745. doi: 10.1002/rcm.6277. [DOI] [PubMed] [Google Scholar]
- 18.Lopes A.M., Tenreiro Machado J.A. Analysis of temperature time-series: embedding dynamics into the MDS method. Commun. Nonlinear Sci. Numer. Simul. 2014;19(4):851–871. [Google Scholar]
- 19.Lopes A.M., Tenreiro Machado J.A., Pinto C.M., Galhano A.M. Fractional dynamics and MDS visualization of earthquake phenomena. Comput. Math. Appl. 2013;66(5):647–658. [Google Scholar]
- 20.Tenreiro Machado J.A., Lopes A.M. Analysis and visualization of seismic data using mutual information. Entropy. 2013;15(9):3892–3909. [Google Scholar]
- 21.Chan F., So H.-C. Efficient weighted multidimensional scaling for wireless sensor network localization. IEEE Trans. Signal Process. 2009;57(11):4548–4553. [Google Scholar]
- 22.Ji X., Zha H. 2004. Sensor positioning in wireless ad-hoc sensor networks using multidimensional scaling. In INFOCOM 2004. Twenty-third Annual Joint Conference of the IEEE Computer and Communications Societies, volume 4, pages 2652–2661. IEEE. [Google Scholar]
- 23.Ionescu C.M. Springer Science & Business Media; 2013. The Human Respiratory System: An Analysis of the Interplay between Anatomy, Structure, Breathing and Fractal Dynamics. [Google Scholar]
- 24.Tzagarakis C., Jerde T.A., Lewis S.M., Uǧurbil K., Georgopoulos A.P. Cerebral cortical mechanisms of copying geometrical shapes: a multidimensional scaling analysis of fMRI patterns of activation. Exp. Brain Res. 2009;4(3):369–380. doi: 10.1007/s00221-009-1709-5. [DOI] [PMC free article] [PubMed] [Google Scholar]
- 25.Tenreiro Machado J.A., Costa A.C., Lima M.F. Dynamical analysis of compositions. Nonlin. Dynam. 2011;65(4):399–412. [Google Scholar]
- 26.Tenreiro Machado J.A., Lopes A.M. The persistence of memory. Nonlin. Dynam. 2014;79(1):63–82. [Google Scholar]
- 27.Bronstein M.M., Bronstein A.M., Kimmel R., Yavneh I. Multigrid multidimensional scaling. Numer. Linear Algebra. 2006;13(2–3):149–171. [Google Scholar]
- 28.Kruskal J.B. Multidimensional scaling by optimizing goodness of fit to a nonmetric hypothesis. Psychometrika. 1964;29(1):1–27. [Google Scholar]
- 29.Schiffman S.S., Lance Reynolds M., Young F.W., Douglas Carroll J. Academic Press; New York: 1981. Introduction to Multidimensional Scaling: Theory, Methods, and Applications. [Google Scholar]
- 30.Young F.W. Psychology Press; 2013. Multidimensional Scaling: History, Theory, and Applications. [Google Scholar]
- 31.Stephenson D.B., Dolas-Reyes F.J. Statistical methods for interpreting Monte Carlo ensemble forecasts. Tellus A. 2000;52(3) [Google Scholar]
- 32.Osterhaus A.D.M.E., De Jong J.C., Rimmelzwaan G.F., Claas E.C.J. H5N1 influenza in Hong Kong: virus characterizations. Vaccine. 2002;20:S82–S83. doi: 10.1016/s0264-410x(02)00138-x. [DOI] [PubMed] [Google Scholar]
- 33.Pandit P.S., Bunn D.A., Pande S.A., Aly S.S. Modeling highly pathogenic avian influenza transmission in wild birds and poultry in West Bengal, India. Sci. Rep. 2013;3 doi: 10.1038/srep02175. [DOI] [PMC free article] [PubMed] [Google Scholar]
- 34.Treanor J.J. Mandell, Douglas, and Bennett's Principles and Practice of Infectious Diseases. eighth ed. Saunders; 2014. Influenza (Including Avian Influenza and Swine Influenza) pp. 1815–1839. [Google Scholar]
- 35.Wood J.P., Choi Y.W., Chappie D.J., Rogers J.V., Kaye J.Z. Environmental persistence of a highly pathogenic avian influenza (H5N1) virus. Environ. Sci. Technol. 2010;44(19):7515–7520. doi: 10.1021/es1016153. [DOI] [PubMed] [Google Scholar]
- 36.Helmuth I.G., Poulsen A., Suppli C.H., Mølbak K. Varicella in Europe—a review of the epidemiology and experience with vaccination. Vaccine. 2015;33(21):2406–2413. doi: 10.1016/j.vaccine.2015.03.055. [DOI] [PubMed] [Google Scholar]
- 37.Ross A.H., Lenchner E., Reitman G. Modification of chicken pox in family contacts by administration of gamma globulin. NEJM. 1962;267(8):369–376. doi: 10.1056/NEJM196208232670801. [DOI] [PubMed] [Google Scholar]
- 38.Weeks Wells M., Holla W.A. Ventilation in the flow of measles and chickenpox through a community: progress report, Jan. 1, 1946 to June 15, 1949, airborne infection study, Westchester County Department of Health. J. Am. Med. Assoc. 1950;142(17):1337–1344. doi: 10.1001/jama.1950.02910350007004. [DOI] [PubMed] [Google Scholar]
- 39.Whitley R.J. Mandell, Douglas, and Bennett's principles and Practice of Infectious Diseases. eighth ed. Saunders; 2014. Chickenpox and herpes zoster (varicella-zoster virus) pp. 1731–1737. [Google Scholar]
- 40.Charrel R.N., de Lamballerie X., Raoult D. Chikungunya outbreaks—the globalization of vectorborne diseases. NEJM. 2007;356(8):769. doi: 10.1056/NEJMp078013. [DOI] [PubMed] [Google Scholar]
- 41.Markoff L. Mandell, Douglas, and Bennett's Principles and Practice of Infectious Diseases. eighth ed. Saunders; 2014. Alphavirus; pp. 1865–1874. [Google Scholar]
- 42.Weaver S.C., Forrester N.L. Chikungunya: evolutionary history and recent epidemic spread. Antiviral Res. 2015 doi: 10.1016/j.antiviral.2015.04.016. [DOI] [PubMed] [Google Scholar]
- 43.Endy T.P. Dengue human infection model performance parameters. J. Infect. Dis. 2014;209(Suppl. 2):S56–S60. doi: 10.1093/infdis/jiu112. [DOI] [PMC free article] [PubMed] [Google Scholar]
- 44.Khan A., Hassan M., Imran M. Estimating the basic reproduction number for single-strain dengue fever epidemics. Infect. Dis. Poverty. 2014;3(1):12. doi: 10.1186/2049-9957-3-12. [DOI] [PMC free article] [PubMed] [Google Scholar]
- 45.Althaus C.L. 2014. Estimating the reproduction number of Ebola virus (EBOV) during the 2014 outbreak in West Africa. arXiv preprint arXiv:1408.3505. [DOI] [PMC free article] [PubMed] [Google Scholar]
- 46.Althaus C.L. Ebola: the real lessons from HIV scale-up. Lancet Infect. Dis. 2015;15(5):507–508. doi: 10.1016/S1473-3099(15)70033-2. [DOI] [PubMed] [Google Scholar]
- 47.Geisbert T.W. Mandell, Douglas, and Bennett's Principles and Practice of Infectious Diseases. eighth ed. Saunders; 2014. Marburg and Ebola Hemorrhagic Fevers (Filovirus) pp. 1995–1999. [Google Scholar]
- 48.Hung H.-F., Wang Y.-C., Yen A.M.-F., Chen H.-H. Stochastic model for hepatitis B virus infection through maternal (vertical) and environmental (horizontal) transmission with applications to basic reproductive number estimation and economic appraisal of preventive strategies. Stoch. Environ. Res. Risk Assess. 2014;28(3):611–625. [Google Scholar]
- 49.Mann J., Roberts M. Modelling the epidemiology of hepatitis B in New Zealand. J. Theor. Biol. 2011;269(1):266–272. doi: 10.1016/j.jtbi.2010.10.028. [DOI] [PubMed] [Google Scholar]
- 50.Thio C.L., Hawkins C. Mandell, Douglas, and Bennett's Principles and Practice of Infectious Diseases. eighth ed. Saunders; 2014. Hepatitis B virus and hepatitis delta virus; pp. 1815–1839. [Google Scholar]
- 51.de Goede A.L., Vulto A.G., Osterhaus A.D.M.E., Gruters R.A. Annales Pharmaceutiques Francaises. Elsevier; 2014. Understanding HIV infection for the design of a therapeutic vaccine. Part I: epidemiology and pathogenesis of HIV infection. [DOI] [PubMed] [Google Scholar]
- 52.Fettig J., Swaminathan M., Murrill C.S., Kaplan J.E. Global epidemiology of HIV. Infect. Dis. Clin. North Am. 2014;28(3):323–337. doi: 10.1016/j.idc.2014.05.001. [DOI] [PMC free article] [PubMed] [Google Scholar]
- 53.Reid S., Juma O.A. Minimum infective dose of HIV for parenteral dosimetry. Int. J. STD AIDS. 2009;20(12):828–833. doi: 10.1258/ijsa.2009.009284. [DOI] [PubMed] [Google Scholar]
- 54.Reitz M.S., Gallo R.C. Mandell, Douglas, and Bennett's Principles and Practice of Infectious Diseases. eighth ed. Saunders; 2014. Human immunodeficiency virus; pp. 2054–2065. [Google Scholar]
- 55.Rougeron V., Feldmann H., Grard G., Becker S., Leroy E. Ebola and Marburg haemorrhagic fever. J. Clin. Virol. 2015;64:111–119. doi: 10.1016/j.jcv.2015.01.014. [DOI] [PMC free article] [PubMed] [Google Scholar]
- 56.Durrheim D.N., Crowcroft N.S., Strebel P.M. Measles—the epidemiology of elimination. Vaccine. 2014;32(51):6880–6883. doi: 10.1016/j.vaccine.2014.10.061. [DOI] [PubMed] [Google Scholar]
- 57.Gershon A.A. Mandell, Douglas, and Bennett's Principles and Practice of Infectious Diseases. eighth ed. Saunders; 2014. Measles virus (Rubeola) pp. 1967–1973. [Google Scholar]
- 58.Gershon A.A. Mandell, Douglas, and Bennett's Principles and Practice of Infectious Diseases. eighth ed. Saunders; 2014. Rubella virus (German measles) pp. 1875–1880. [Google Scholar]
- 59.Rota P.A., Liffick S.L., Rota J.S., Katz R.S., Redd S., Papania M. Molecular epidemiology of measles viruses in the United States, 1997–2001. Emerg. Infect. Dis. 2002;8(9):902–908. doi: 10.3201/eid0809.020206. [DOI] [PMC free article] [PubMed] [Google Scholar]
- 60.Schlenker T.L., Bain C., Baughman A.L., Hadler S.C. Measles herd immunity: the association of attack rates with immunization rates in preschool children. JAMA. 1992;267(6):823–826. doi: 10.1001/jama.267.6.823. [DOI] [PubMed] [Google Scholar]
- 61.McIntosh K., Perlman S. Mandell, Douglas, and Bennett's Principles and Practice of Infectious Diseases. eighth ed. Saunders; 2014. Coronaviruses, including Severe Acute Respiratory Syndrome (Sars) and Middle East Respiratory Syndrome (MERS) pp. 1731–1737. [Google Scholar]
- 62.Memish Z.A., Assiri A., Alhakeem R., Yezli S., Almasri M., Zumla A. Middle East respiratory syndrome corona virus, MERS-CoV. Conclusions from the 2nd Scientific Advisory Board Meeting of the WHO Collaborating Center for Mass Gathering Medicine, Riyadh. Int. J. Infect. Dis. 2014;24:51–53. doi: 10.1016/j.ijid.2014.05.001. [DOI] [PMC free article] [PubMed] [Google Scholar]
- 63.van Doremalen N., Bushmaker T., Karesh W.B., Munster V.J. Stability of Middle East respiratory syndrome coronavirus in milk. Emerg. Infect. Dis. 2014;20(7):1263–1264. doi: 10.3201/eid2007.140500. [DOI] [PMC free article] [PubMed] [Google Scholar]
- 64.Litman N., Baum S.G. Mandell, Douglas, and Bennett's Principles and Practice of Infectious Diseases. eighth ed. Saunders; 2014. Mumps virus; pp. 1942–1947. [Google Scholar]
- 65.Rubin S., Eckhaus M., Rennick L.J., Bamford C.G., Paul Duprex W. Molecular biology, pathogenesis and pathology of mumps virus. J. Pathol. 2015;235(2):242–252. doi: 10.1002/path.4445. [DOI] [PMC free article] [PubMed] [Google Scholar]
- 66.Ahmed S.M., Hall A.J., Robinson A.E., Verhoef L., Premkumar P., Parashar U.D. Global prevalence of norovirus in cases of gastroenteritis: a systematic review and meta-analysis. Lancet Infect. Dis. 2014;14(8):725–730. doi: 10.1016/S1473-3099(14)70767-4. [DOI] [PMC free article] [PubMed] [Google Scholar]
- 67.Dolin R., Treanor J.J. Mandell, Douglas, and Bennett's Principles and Practice of Infectious Diseases. eighth ed. Saunders; 2014. Noroviruses and Sapoviruses (Caliciviruses) pp. 2122–2127. [Google Scholar]
- 68.Pirtle E.C., Beran G.W. Virus survival in the environment. Rev. Sci. Tech. 1991;10:733–748. doi: 10.20506/rst.10.3.570. [DOI] [PubMed] [Google Scholar]
- 69.Romero J.R., Modlin J.F. Mandell, Douglas, and Bennett's Principles and Practice of Infectious Diseases. eighth ed. Saunders; 2014. Poliovirus; pp. 2073–2079. [Google Scholar]
- 70.Weinstein L., Shelokov A., Seltser R., Winchell G.D. A comparison of the clinical features of poliomyelitis in adults and in children. N. Engl. J. Med. 1952;246(8):297–302. doi: 10.1056/NEJM195202212460805. [DOI] [PubMed] [Google Scholar]
- 71.Hampson K., Dushoff J., Cleaveland S., Haydon D.T., Kaare M., Packer C. Transmission dynamics and prospects for the elimination of canine rabies. PLoS Biol. 2009;7(3):e1000053. doi: 10.1371/journal.pbio.1000053. [DOI] [PMC free article] [PubMed] [Google Scholar]
- 72.Matouch O., Jaros J., Pohl P. [Survival of rabies virus under external conditions] Vet. Med. (Praha) 1987;32(11):669–674. [PubMed] [Google Scholar]
- 73.Noah D.L., Drenzek C.L., Smith J.S., Krebs J.W., Orciari L., Shaddock J. Epidemiology of human rabies in the United States, 1980 to 1996. Ann. Intern. Med. 1998;128(11):922–930. doi: 10.7326/0003-4819-128-11-199806010-00012. [DOI] [PubMed] [Google Scholar]
- 74.Singh K., Rupprecht C.E., Bleck T. Mandell, Douglas, and Bennett's Principles and Practice of Infectious Diseases. eighth ed. Saunders; 2014. Rabies (Rhabdoviruses) pp. 1984–1994. [Google Scholar]
- 75.Dick E.C., Jennings L.C., Mink K.A., Wartgow C.D., LInborn S. Aerosol transmission of rhinovirus colds. J. Infect. Dis. 1987;156(3):442–448. doi: 10.1093/infdis/156.3.442. [DOI] [PubMed] [Google Scholar]
- 76.Hendley J.O., Gwaltney J.M. Mechanisms of transmission of rhinovirus infections. Epidemiol. Rev. 1988;10(1):242–258. [PubMed] [Google Scholar]
- 77.Turner R.B. Mandell, Douglas, and Bennett's Principles and Practice of Infectious Diseases. eighth ed. Saunders; 2014. Rhinovirus; pp. 2113–2121. [Google Scholar]
- 78.Dormitzer P.R. Mandell, Douglas, and Bennett's Principles and Practice of Infectious Diseases. eighth ed. Saunders; 2014. Rotaviruses; pp. 1854–1864. [Google Scholar]
- 79.Patel M.M., Pitzer V., Alonso W.J., Vera D., Lopman B., Tate J. Global seasonality of rotavirus disease. Pediatr. Infect. Dis. J. 2013;32(4):e134. doi: 10.1097/INF.0b013e31827d3b68. [DOI] [PMC free article] [PubMed] [Google Scholar]
- 80.Pitzer V.E., Atkins K.E., de Blasio B.F., Van Effelterre T., Atchison C.J., Harris J.P. Direct and indirect effects of rotavirus vaccination: comparing predictions from transmission dynamic models. PLoS ONE. 2012;7(8):e42320. doi: 10.1371/journal.pone.0042320. [DOI] [PMC free article] [PubMed] [Google Scholar]
- 81.Tate J.E., Burton A.H., Boschi-Pinto C., Duncan Steele A., Duque J., Parashar U.D. 2008 estimate of worldwide rotavirus-associated mortality in children younger than 5 years before the introduction of universal rotavirus vaccination programmes: a systematic review and meta-analysis. Lancet Infect. Dis. 2012;12(2):136–141. doi: 10.1016/S1473-3099(11)70253-5. [DOI] [PubMed] [Google Scholar]
- 82.Reef S.E., Redd S.B., Abernathy E., Zimmerman L., PIcenogle J. The epidemiological profile of rubella and congenital rubella syndrome in the United States, 1998–2004: the evidence for absence of endemic transmission. Clin. Infect. Dis. 2006;43(Suppl. 3):S126–S132. doi: 10.1086/505944. [DOI] [PubMed] [Google Scholar]
- 83.Poon L.L.M., Guan Y., Nicholls J.M., Yuen K.Y., Peiris J.S.M. The aetiology, origins, and diagnosis of severe acute respiratory syndrome. Lancet Infect. Dis. 2004;4(11):663–671. doi: 10.1016/S1473-3099(04)01172-7. [DOI] [PMC free article] [PubMed] [Google Scholar]
- 84.Shi W., Lei F., Zhu C., Sievers F., Higgins D.G. A complete analysis of HA and NA genes of influenza A viruses. PLoS ONE. 2010;5(12):e14454. doi: 10.1371/journal.pone.0014454. [DOI] [PMC free article] [PubMed] [Google Scholar]
- 85.Weinstein R.A., Bridges C.B., Kuehnert M.J., Hall C.B. Transmission of influenza: implications for control in health care settings. Clin. Infect. Dis. 2003;37(8):1094–1101. doi: 10.1086/378292. [DOI] [PubMed] [Google Scholar]
- 86.Milton D.K. What was the primary mode of smallpox transmission? Implications for biodefense. Front. Cell. Infect. Microbiol. 2012;2 doi: 10.3389/fcimb.2012.00150. [DOI] [PMC free article] [PubMed] [Google Scholar]
- 87.Theves C., Biagini P., Crubezy E. The rediscovery of smallpox. Clin. Microbiol. Infect. 2014;20(3):210–218. doi: 10.1111/1469-0691.12536. [DOI] [PubMed] [Google Scholar]
- 88.Ahrens B. Distance in spatial interpolation of daily rain gauge data. Hydrol. Earth Syst. Sci. 2006;10(2):197–208. [Google Scholar]
- 89.Duarte F.B., Tenreiro Machado J.A., Monteiro Duarte G. Dynamics of the Dow Jones and the NASDAQ stock indexes. Nonlin. Dynam. 2010;61(4):691–705. [Google Scholar]
- 90.Lopes A.M., Tenreiro Machado J.A., Pinto C.M.A., Galhano A.M.S.F. Multidimensional scaling visualization of earthquake phenomena. J. Seismol. 2014;18(1):163–179. [Google Scholar]
- 91.Jain A.K. Data clustering: 50 years beyond k-means. Pattern Recognit. Lett. 2010;31(8):651–666. [Google Scholar]
- 92.Caliński T., Harabasz J. A dendrite method for cluster analysis. Commun. Stat. Theory Methods. 1974;3(1):1–27. [Google Scholar]
- 93.Davies D.L., Bouldin D.W. A cluster separation measure. IEEE Trans. Pattern Anal. Mach. Intell. 1979;2:224–227. [PubMed] [Google Scholar]
- 94.Rousseeuw P.J. Silhouettes: a graphical aid to the interpretation and validation of cluster analysis. J. Comput. Appl. Math. 1987;20:53–65. [Google Scholar]
- 95.Lopes A.M., Tenreiro Machado J.A. Dynamic analysis of earthquake phenomena by means of pseudo phase plane. Nonlin. Dynam. 2013;74(4):1191–1202. [Google Scholar]
- 96.Murtagh F. A survey of recent advances in hierarchical clustering algorithms. Comput. J. 1983;26(4):354–359. [Google Scholar]
- 97.Gower J.C. Generalized Procrustes analysis. Psychometrika. 1975;40(1):33–51. [Google Scholar]
- 98.Borio L.L., Henderson D.A., Hynes N.A. Mandell, Douglas, and Bennett's Principles and Practice of Infectious Diseases. eighth ed. Saunders; 2014. Bioterrorism: an overview; pp. 178–190. [Google Scholar]
- 99.Burt F.J., Rolph M.S., Rulli N.E., Mahalingam S., Heise M.T. Chikungunya: a re-emerging virus. Lancet. 2012;379(9816):662–671. doi: 10.1016/S0140-6736(11)60281-X. [DOI] [PubMed] [Google Scholar]
- 100.Khabbaz R., Bell B.P., Schuchat A., Ostroff S.M., Moseley R., Levitt A. Mandell, Douglas, and Bennett's Principles and Practice of Infectious Diseases. eighth ed. Saunders; 2014. Emerging and reemerging infectious disease threats; pp. 158–177. [Google Scholar]


