

Summary
Background
The shortage of isolation facilities in hospitals was highlighted during the severe acute respiratory syndrome (SARS) pandemic in 2003. Yet, as the nature and scale of future pandemics cannot be adequately estimated, it is difficult to justify construction of sufficient isolation facilities. A fast-track and cost-effective ventilation strategy for the retrofitting of existing general wards could help hospitals deal with patient surges.
Aim
This article reviews the effectiveness of a fast-track, makeshift isolation approach employed during the SARS outbreak which involved installing simple window-mounted exhaust fans to create negative-pressure airflow in hospital general wards.
Methods
Computational fluid dynamics (CFD) was used to assess by simulation whether the approach adopted meets US Centers for Disease and Control and Prevention requirements for properly constructed isolation wards.
Findings
CFD simulation revealed that this makeshift approach could match the ventilation standards of isolation rooms. The approach was certainly effective as no secondary infections were reported in hospitals that used it during SARS.
Conclusions
When there is a shortfall in isolation facilities to accommodate a surge in patients, the proposed ventilation set-up could be quickly and widely implemented by existing general wards.
Keywords: Air ventilation, Computational fluid dynamics, Infection control, Pandemic, Severe acute respiratory syndrome, Surge capacity
Introduction
Hospitals in many countries found it difficult to handle the large numbers of patients requiring isolation during the severe acute respiratory syndrome (SARS) outbreak in 2003.1 General wards were not equipped with the necessary air-control environment to isolate such a widespread infection.2, 3 The nature and scale of future potential pandemics is always difficult to predict, as is the capacity of the required isolation rooms.4 Isolation facilities are costly to build, consume more energy, disrupt smooth operations due to their segregated physical design and occupy valuable hospital space. Nevertheless pandemic outbreaks can reach magnitudes that exceed the maximum capacity of available isolation rooms.5, 6 The challenge for hospitals is to develop adequate surge capacity to isolate known patients or those likely to be infectious by the airborne route in case of an outbreak.
During the SARS outbreak a simple and cost-effective method for constructing isolation rooms was developed whereby makeshift facilities were created in general wards by installing two high-speed, window-mounted exhaust fans in the cubicles to create negative-pressure air flows.7, 8 A number of countries reported the success of makeshift isolation rooms in preventing cross-infection.9, 10
Ventilation requirements for isolation rooms as specified by the US Centers for Disease and Control Prevention (CDC) are ‘To introduce high air ventilation rates for better dilution efficiency’ and ‘To create pressure gradient to prevent air flowing from less clean to clean areas’.11 This paper reports the use of computational fluid dynamics (CFD) to validate whether the makeshift set-up used during SARS could meet these requirements.
Methods
Makeshift isolation strategy
Various countries adopted makeshift arrangements to cater for the influx of patients requiring isolation during SARS.12, 13, 14, 15, 16, 17, 18 The set-up employed in Hong Kong consisted of two window-mounted exhaust fans located high on either side of the external window, delivering more than 12 air changes per hour (Figures 1 and 2 ).19 All windows in the general ward were closed and the ward door was opened. Airflow was directed from the cleaner ward corridor into the ward cubicle and then exhausted outside such that there was little chance of pathogen-laden air flowing into the corridor and other indoor hospital areas.12, 13, 14, 15, 16, 17, 18
Figure 1.
Installation of a window-mounted exhaust fan in a hospital ward. (Reprinted by permission from Annals, Academy of Science Singapore: Dessmon YH Tai, SARS: How to Manage Future Outbreaks? Annals, Academy of Medicine, 2006; 35: 368–373.)
Figure 2.

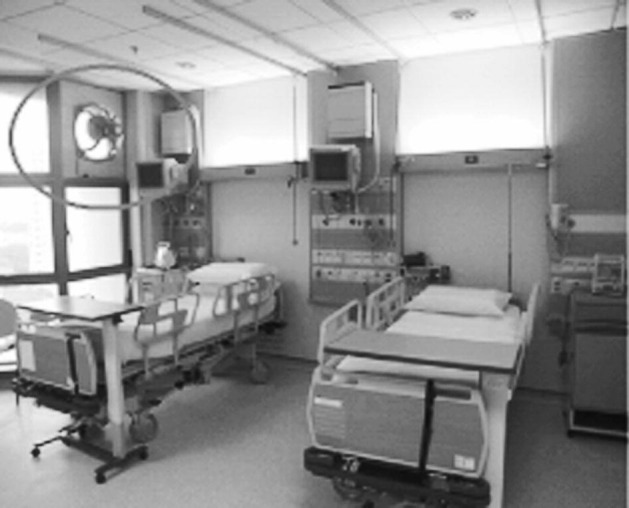
General ward with six patients, two healthcare workers and two window-mounted exhaust fans.
Computational fluid dynamics (CFD) analysis
CFD analyses fluid-flow problems based on mathematical equations known as Navier–Stokes equations.20 By solving these equations with defined boundary conditions it is possible to calculate air movement and predict temperatures and particulate migration in any indoor or outdoor environment.21 These equations are partial differential equations that cannot easily be resolved through analytical means. The numerous iterations required to linearize these equations in CFD involve substantial computer time and memory but CFD has gained popularity as computer technologies have advanced. Results can be presented as three-dimensional colour illustrations covering many types of engineering fluid-flow problems and heat transfers.21
CFD has been used to investigate the ventilation performance of operating room contamination control strategies; to examine surgical suite ventilation systems and to identify further ventilation improvements for operating room environments and air contamination control.22, 23, 24, 25 CFD has also been used to analyse the risk of cross-infection with different general ward ventilation designs and to study the effects of ward ventilation supply and exhaust positioning.26, 27, 28 An abundance of ventilation and airborne contamination research has examined isolation rooms in hospitals with validated results.29, 30 CFD is particularly suitable for these investigations because the collection and analysis of actual airborne samples from wards can be risky and difficult.31 For high-risk studies CFD provides a safe and accurate estimate of the movement of air and contaminants.32
A recent study conducted by the authors provides a more detailed description of CFD.33 This study used CFD to verify a simple and cost-effective ventilation set-up in a general ward, which was shown to match the CDC's standards for isolation facilities. This was a long-term solution, whereas in the current study CFD was used to verify the fast-track, makeshift isolation set-up employed during SARS.
Similar to other studies, CFD ‘FloVent’ software was used to analyse the following:34
-
1.
The ventilation system in a standard hospital isolation room – consisting of negative air pressure control, air inflows from the air handling unit (AHU) and outflows via the air-conditioning exhaust system.33
-
2.
A makeshift isolation room – consisting of a general ward with six patients and two healthcare workers (HCWs), two window-mounted exhaust fans and an AHU; air inflows from the AHU and corridor; and outflows directly via the exhaust fan to the outside atmosphere (Figure 3 ).
Figure 3.

Computational fluid dynamics ‘FloVent’ simulation results showing the associated airflow profiles (makeshift ventilation set-up with window-mounted exhaust fan and air handling unit).
Based on the set-up adopted during SARS the following additional parameters were used:
-
–
a ward cubicle of 6.6 m × 6.4 m × 2.7 m, six patients and two HCWs;
-
–
a window-mounted extraction fan of 305 mm diameter with an airflow extraction rate of 0.45 m3/s; and
-
–
fresh air with two air changes supplied by the AHU of the air-conditioning system.
CFD results were compared with CDC requirements for isolation rooms. The ventilation induced by the two exhaust fans was much stronger than that of the small AHU. This introduced a negative-pressure airflow into the ward, i.e. clean air flowing into the less-clean areas housing patients under isolation. In addition, the two fans extracted air from within the ward cubicle more than 12 times per hour, matching the CDC requirement for isolation rooms.11, 33
Evaluation criteria: ventilation performance
Air change efficiency and contaminant removal effectiveness were used to measure the ventilation effectiveness and microbial movement dynamics. Air change efficiency is measured by the local mean age of the air (LMAA); i.e. the average time in seconds required for air to flow from its supply source to the point of investigation in the indoor environment.35, 36 In this study the LMAA was measured from the supply air inlet point to the internal zones occupied by the patients and HCWs. In general it is desirable to achieve a low LMAA to avoid staleness or stuffiness.
Contaminant (microbial) removal effectiveness (CRE) measures the speed at which contaminants are removed from an internal environment.35, 36 CRE is expressed as the concentration of contaminants at the exhaust point divided by that at the investigation point within the room. A high CRE value means that more indoor contaminants have been brought to the exhaust point than to the area in the vicinity of the patients and HCWs. Similar to other cases, the aim of this study was to maximize the CRE value.37 This study verifies using CFD whether the LMAA and CRE values for the makeshift set-up are similar to those of an isolation room.
Results
The CFD simulation results are shown in Table I : (i) for the isolation room; (ii) for the makeshift set-up with two changes of air-conditioned fresh air.
Table I.
Computational fluid dynamics (CFD) simulation results
| Ventilation system | Total air changes | Fresh air changes | Remark | CRE |
LMAA (s) |
|
|---|---|---|---|---|---|---|
| Exhaust | Patient | Medical staff | ||||
| Airborne isolation room | 12 | 12 | Door closed, with pressure regulation | 0.9568 | 99.893 | 100.41 |
| Makeshift set-up (general ward with exhaust air fans) | 12 | 2 | No door, with air-conditioned fresh air from AHU | 2.1890 | 88.4 | 55.48 |
CRE, contaminant (microbial) removal effectiveness; LMAA, local mean age of the air; AHU, air handling unit.
Figure 3 shows the CFD ‘FloVent’ simulation results with associated airflow profiles for the makeshift set-up. There is no absolute value or target for LMAA and CRE because no research has been carried out in this respect. LMAA and CRE values for the makeshift set-up can only be compared with those for the isolation ward.
Airborne isolation room
Table I shows that the CRE value in the isolation room was 0.9568. The LMAA values in the vicinity of both patients and HCWs were in the region of 100, which is nine times better than those in the normal general wards and similar to those found in a similar study.14
Makeshift set-up with simple exhaust fan installation
As shown in Table I, the CRE of the makeshift set-up (2.1890) was better than that of the standard isolation room (0.9568). The relatively low LMAA value in the makeshift set-up (88.4 s for patients, 55.48 s for HCWs) was also better than that in the isolation ward (99.893 s for patients, 100.41 s for HCWs).
Discussion
A properly constructed isolation room has a CRE value approaching unity, indicating that microbes or contaminants are being drawn out of the ward through the ceiling exhaust outlet.33 Air flows from a clean to a less-clean area, preventing the spread of contaminants into the ward corridor and beyond and thus fulfilling the CDC's isolation control requirements.11
The findings for the makeshift set-up demonstrate that simple installation of local extraction fans can yield ventilation performance comparable to or even better than that of standard isolation rooms. In the makeshift set-up, the high CRE value means that more contaminants are extracted to the exhaust point than to the vicinity of the patients and HCWs. The low LMAA means a shorter duration of the indoor air stream coming into contact with the patients and HCWs, thereby reducing the chance of airborne infection within the ward. Most importantly, air flows from the clean corridor to the less-clean ward cubicle and subsequently to the outside atmosphere, thus preventing infection from spreading through the corridor and beyond to other parts of the hospital.
This study goes some way towards validating a fast-track solution capable of handling patient surges in a pandemic. The CFD findings confirm that a simple makeshift ventilation system can be constructed rapidly to minimize the risk of airborne transmission. This ventilation set-up will render general wards capable of accommodating large influxes of infectious patients during pandemics. Installation of additional exhaust fans is much simpler, cheaper and faster than the retrofitting of general wards into isolation rooms.
Nevertheless the extent to which such makeshift ventilation systems are effective depends on a number of other contributory factors, including patient susceptibility to disease, the internal and external environmental conditions and the physical layout of the ward. In addition, without involving patients in cross-disciplinary research by engineers and medical scientists it is difficult to achieve genuine comparison of infection rates between the makeshift set-up and the standard isolation room.
Recent studies have suggested other cost-effective means of ventilation, such as opening windows to prevent airborne disease transmission, but weather conditions and prevailing wind directions are by no means controllable.38, 39 Thus, the makeshift ventilation design discussed here is a practical and effective alternative when catering for surges in isolation patients during pandemics.
Conflict of interest statement
None declared.
Funding sources
None.
References
- 1.Leung T.F., Ng P.C., Cheng F.W.T. Infection control for SARS in a tertiary paediatric centre in Hong Kong. J Hosp Infect. 2004;56:215–222. doi: 10.1016/j.jhin.2003.11.004. [DOI] [PMC free article] [PubMed] [Google Scholar]
- 2.McDonald L.C., Simor A.E., Su I.J. SARS in healthcare facilities, Toronto and Taiwan. Emerg Infect Dis. 2004;5:777–781. doi: 10.3201/eid1005.030791. [DOI] [PMC free article] [PubMed] [Google Scholar]
- 3.Gamage B., Moore D., Copes R. Protecting health care workers from SARS and other respiratory pathogens: a review of the infection control literature. Am J Infect Control. 2005;33:114–121. doi: 10.1016/j.ajic.2004.12.002. [DOI] [PMC free article] [PubMed] [Google Scholar]
- 4.Fusco F.M., Puro V., Baka A. Isolation rooms for highly infectious diseases: an inventory of capabilities in European countries. J Hosp Infect. 2009;73:15–23. doi: 10.1016/j.jhin.2009.06.009. [DOI] [PMC free article] [PubMed] [Google Scholar]
- 5.Tam J.S., Sellwood C. Avian influenza and the threat of the next human pandemic. J Hosp Infect. 2007;65:10–13. doi: 10.1016/S0195-6701(07)60006-1. [DOI] [PMC free article] [PubMed] [Google Scholar]
- 6.Heymann D.L. Smallpox containment updated: considerations for the 21st century. Int J Infect Dis. 2004;852:515–520. doi: 10.1016/j.ijid.2004.09.005. [DOI] [PMC free article] [PubMed] [Google Scholar]
- 7.Yen M.Y., Lin Y.E., Su I.J. Using an integrated infection control strategy during outbreak control to minimize nosocomial infection of severe acute respiratory syndrome among healthcare workers. J Hosp Infect. 2006;62:195–199. doi: 10.1016/j.jhin.2005.02.011. [DOI] [PMC free article] [PubMed] [Google Scholar]
- 8.Gomersall C.D., Tai D., Loo S. Expanding ICU facilities in an epidemic: recommendations based on experience from the SARS epidemic in Hong Kong and Singapore. Intensive Care Med. 2006;32:1004–1013. doi: 10.1007/s00134-006-0134-5. [DOI] [PubMed] [Google Scholar]
- 9.Yu I., Xie Z.H., Tsoi K. Why did outbreaks of severe acute respiratory syndrome occur in some hospital wards but not others? Clin Infect Dis. 2007;44:1017–1025. doi: 10.1086/512819. [DOI] [PMC free article] [PubMed] [Google Scholar]
- 10.Krumkamp R., Duerr H.P., Reintjes R. Impact of public health interventions in controlling the spread of SARS: modelling of intervention scenarios. Int J Hyg Environ Health. 2009;212:67–75. doi: 10.1016/j.ijheh.2008.01.004. [DOI] [PubMed] [Google Scholar]
- 11.Centers for Disease Control and Prevention . CDC; Atlanta: 2003. Guidelines for environmental infection control in healthcare facilities. [Google Scholar]
- 12.Fung C.P., Hsieh T.L., Tam K.H. Rapid creation of a temporary isolation ward for patients with severe acute respiratory syndrome in Taiwan. Infect Cont Hosp Epidemiol. 2004;25:1026–1032. doi: 10.1086/502339. [DOI] [PubMed] [Google Scholar]
- 13.Chow C.B. Post-SARS infection control in the hospitals and clinics. Paed Resp Rev. 2004;5:289–295. doi: 10.1016/j.prrv.2004.07.006. [DOI] [PMC free article] [PubMed] [Google Scholar]
- 14.Chen W.Q., Ling W.H., Lu C.Y. Which preventive measures might protect health care workers from SARS? BMC Public Health. 2009;9:1–8. doi: 10.1186/1471-2458-9-81. [DOI] [PMC free article] [PubMed] [Google Scholar]
- 15.Liu J.W., Lu S.N., Chen S.S. Epidemiologic study and containment of a nosocomial outbreak of severe acute respiratory syndrome in a medical center in Kaohsiung, Taiwan. Infect Cont Hosp Epidemiol. 2006;27:467–472. doi: 10.1086/504501. [DOI] [PubMed] [Google Scholar]
- 16.Apisarnthanarak A., Warren D.K., Fraser V.J. Issues relevant to the adoption and modification of hospital infection-control recommendations for avian influenza (H5N1 infection) in developing countries. Clin Infect Dis. 2007;45:1338–1342. doi: 10.1086/522538. [DOI] [PMC free article] [PubMed] [Google Scholar]
- 17.Daugherty E.L. Health care worker protection in mass casualty respiratory failure: infection control, decontamination, and personal protective equipment. Resp Care. 2008;53:201–214. [PubMed] [Google Scholar]
- 18.Chaovavanich A., Wongsawat J., Dowell S.F. Early containment of severe acute respiratory syndrome (SARS): experience from Bamrasnaradura Institute, Thailand. J Med Assoc Thai. 2004;87:1182–1186. [PubMed] [Google Scholar]
- 19.Tai D. SARS: how to manage future outbreaks? Ann Acad Med. 2006;35:368–373. [PubMed] [Google Scholar]
- 20.Baker A.J. Hemisphere; Washington, DC: 1983. Finite element computational fluid mechanics. [Google Scholar]
- 21.Li Y., Nielsen P.V. CFD and ventilation research. Indoor Air. 2011;21:442–453. doi: 10.1111/j.1600-0668.2011.00723.x. [DOI] [PubMed] [Google Scholar]
- 22.Colquhoun J., Partridge L. Computational fluid dynamics applications in hospital ventilation design. Indoor Built Environ. 2003;12:81–88. [Google Scholar]
- 23.Wang F.J., Cheng T.J., Lai C.M. Performance investigation for the cleanroom contamination control strategy in an operating room. ASHRAE Trans. 2010;116:74–78. [Google Scholar]
- 24.Memarzadeh F., Manning A.P. Comparison of operating room ventilation systems in the protection of the surgical site. ASHRAE Trans. 2002;108:3–5. [Google Scholar]
- 25.Zhang R., Tu G.B., Ling J.H. Study on biological contaminant control strategies under different ventilation models in hospital operating room. Build Environ. 2007;43:793–803. [Google Scholar]
- 26.Mendez C., Jose S., Villafruela J.M. Optimization of a hospital room by means of CFD for more efficient ventilation. Energy and Building. 2008;40:849–854. [Google Scholar]
- 27.Hathway A, Noakes C, Sleigh A. CFD modeling of a hospital ward: assessing risk from bacteria produced from respiratory and activity sources. Indoor Air, Copenhagen, Denmark: pp. 45–53; 2008.
- 28.Lim T., Cho J., Kim B.S. The influence of ward ventilation on hospital cross infection by varying the location of supply and exhaust air diffuser using CFD. J Asian Building Engng. 2010;9:259–266. [Google Scholar]
- 29.Kumar R., Kumar R., Gupta A. Analysis of the ventilation system of an isolation room for a hospital. Int J Ventilation. 2008;7:139–149. [Google Scholar]
- 30.Cheong K.W.D., Phua S.Y. Development of ventilation design strategy for effective removal of pollutant in the isolation room of a hospital. Build Environ. 2006;41:1161–1170. [Google Scholar]
- 31.Richmond-Bryant J. Transport of exhaled particulate matter in air borne infection isolation rooms. Build Environ. 2009;44:44–45. doi: 10.1016/j.buildenv.2008.01.009. [DOI] [PMC free article] [PubMed] [Google Scholar]
- 32.Murakami S., Kato S., Suyama Y. Numerical and experimental study on turbulent diffusion fields in conventional clean rooms. ASHRAE Trans. 1988;94:469–488. [Google Scholar]
- 33.Yam R., Yuen P.L., Yung R. Rethinking hospital general ward ventilation design using computational fluid dynamics. J Hosp Infect. 2011;77:31–36. doi: 10.1016/j.jhin.2010.08.010. [DOI] [PMC free article] [PubMed] [Google Scholar]
- 34.Memarzh F., Jiang J. Methodology for minimizing risk from airborne organisms in hospital isolation rooms. ASHRAE Trans. 2000;106:731–747. [Google Scholar]
- 35.Brouns C., Waters R. Air Infiltration and Ventilation Centre; Sint-Stevens-Woluwe, Belgium: 1991. A guide to contaminant removal effectiveness. Technical Note AIVC 28.2. [Google Scholar]
- 36.Mundt E., Mathisen H.M., Nielsen P.V. 2004. Ventilation effectiveness. REHVA Guidebook No. 2. Federation of European Heating and Air-conditioning Associations. [Google Scholar]
- 37.Liddament M.W. Air Infiltration and Ventilation Centre; Sint-Stevens-Woluwe, Belgium: 1996. Guide to energy efficiency ventilation. [Google Scholar]
- 38.Qian H., Li Y., Seto W.H. Natural ventilation for reducing airborne infection in hospitals. Build Environ. 2010;45:559–565. doi: 10.1016/j.buildenv.2009.07.011. [DOI] [PMC free article] [PubMed] [Google Scholar]
- 39.Escombe A.R., Oeser C.C., Gilman R.H. Natural ventilation for the prevention of airborne contagion. PloS Med. 2007;4:309–317. doi: 10.1371/journal.pmed.0040068. [DOI] [PMC free article] [PubMed] [Google Scholar]