

Abstract

Despite its growing popularity and use, bottom-up proteomics remains a complex analytical methodology. Its general workflow consists of three main steps: sample preparation, liquid chromatography coupled to tandem mass spectrometry (LC–MS/MS), and computational data analysis. Quality assessment of the different steps and components of this workflow is instrumental to identify technical flaws and avoid loss of precious measurement time and sample material. However, assessment of the extent of sample losses along with the sample preparation protocol, in particular, after proteolytic digestion, is not yet routinely implemented because of the lack of an accurate and straightforward method to quantify peptides. Here, we report on the use of a microfluidic UV/visible spectrophotometer to quantify MS-ready peptides directly in the MS-loading solvent, consuming only 2 μL of sample. We compared the performance of the microfluidic spectrophotometer with a standard device and determined the optimal sample amount for LC–MS/MS analysis on a Q Exactive HF mass spectrometer using a dilution series of a commercial K562 cell digest. A careful evaluation of selected LC and MS parameters allowed us to define 3 μg as an optimal peptide amount to be injected into this particular LC–MS/MS system. Finally, using tryptic digests from human HEK293T cells and showing that injecting equal peptide amounts, rather than approximate ones, result in less variable LC–MS/MS and protein quantification data. The obtained quality improvement together with easy implementation of the approach makes it possible to routinely quantify MS-ready peptides as a next step in daily proteomics quality control.
Introduction
Mass spectrometry (MS)-based proteomics is a key technology in modern life sciences, with a wide scope of applications for protein research. Due to technological advances in liquid chromatography (LC) and MS instrumentation, current LC–MS/MS systems perform at high sensitivity, resolution, and speed.1−4 These improvements, coupled to robust bioinformatic pipelines, now allow routine in-depth proteome measurements at high confidence, explaining the success of the major proteomics applications today: quantitative measurements of proteomes by so-called shotgun proteomics, identification of protein interaction partners by affinity purification MS (AP-MS), and mapping of some of the most common post-translational modification (PTM) sites.
LC–MS/MS systems are inherently prone to fluctuations in performance. Whether an ion source that gets transiently unstable in the course of an analytical run, a mass analyzer with a drift in accuracy, or a chromatographic column whose stationary phase progressively deteriorates, the different components of an LC–MS/MS system vary during the operation time.5 Therefore, continuous monitoring is required to diagnose technical flaws and schedule maintenance interventions. For a very long time, however, guidelines and standardized methods to assess the quality of MS-based proteomics data were lacking. Over the last decade, great progress has been made in proteomics quality control. On the one hand, various reference sample formulations have been designed and are now commercialized as standards to carry out quality control (QC) analysis.5,6 On the other hand, a number of metrics to assess LC–MS/MS performance have been developed,7,8 in particular, for standard workflows of bottom-up data-dependent analysis. Examples of QC metrics that inform about the liquid chromatography step are full-width at half-maximum (FWHM) of the eluting peptide peak and retention time drifts of eluting peptides, which monitor the integrity of the chromatographic column and the applied gradient. In turn, mass spectrometer QC can be done through examination of mass accuracy, dynamic range, and ion injection time. Importantly, various software tools for MS-based proteomics QC have been created,9 which allow extraction and visualization of QC metrics from analytical runs performed on standard samples. One such example is a cloud-based quality control system QCloud that allows following instrument performance over time on a user-friendly web interface.10
Of utmost importance for the success of a proteomic experiment is the QC assessment at the sample preparation level, where the major sources of variation arise from (1) artificial and thus unwanted in vitro protein/peptide modifications, (2) incomplete protein digestion, (3) protein contamination introduced by users or present in reagents, and (4) sample losses during sample transfer, enrichment steps, elution, and reconstitution. While the extent at which the first three types of variation compromise the quality of an analytical run can be quantified (provided that the correct identification search settings are used), no standardized QC procedures exist that account for analyte losses after proteolytic digestion. Indeed, while the extracted amount of protein material from cell or tissue samples is typically determined by standard assays immediately upon lysis and/or protein extraction, or prior to digestion (Figure 1), no such established quantification procedures exist at the peptide level. An exception would be the bicinchoninic acid (BCA) method using a peptide digest sample standard, but its dependence on calibration and the consumption of large sample volumes make it lengthy and costly. Of particular note, even when additional modifications, enrichment steps, or cleaning procedures take place after digestion, which will inevitably introduce additional sample losses and variability, peptide quantification before the actual LC–MS/MS analysis is generally not performed.
Figure 1.
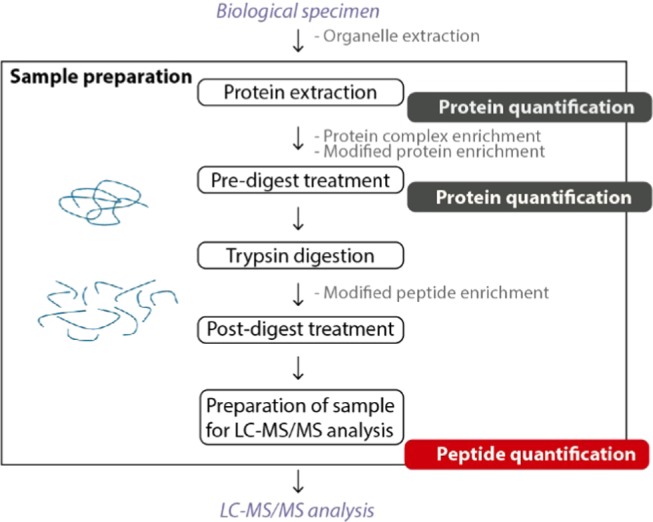
Schematic outline of the sample preparation and quantification steps in a generic bottom-up proteomics experiment. Peptide concentration is usually estimated based on protein quantification before proteolytic digestion (dark gray), but standard methods for performing this quantification at the peptide level, right before LC–MS/MS (red), would be highly desirable. Optional steps of the protocol are written in gray.
LC–MS/MS runs carried out with insufficient amounts of peptides result in ion signals below the detection limit of the mass spectrometer, leading to low(er) numbers of peptide and protein identifications. In this respect, low signal-to-noise ratios of peptide signals also reduce the reliability of peptide quantification, as peak integration is more difficult for such low signals. Although analysis can be repeated by injecting more adequate sample amounts, this increases the overall analysis time and associated costs and is not always possible for low-quantity or low-volume samples. Equally troublesome is the injection of excessive amounts of peptide material, termed column overloading. Such column saturation leads to peak tailing and retention time shifts,11−15 leading to poorer peptide separation and higher ionization competition, also reducing the number of identified and quantified peptides.16 In some cases, this saturation can even lead to the obstruction of the column, which causes backpressure build-up, in turn increasing the variability between repeated analyses of similar samples.
Efforts to standardize procedures and minimize sample losses during sample preparation led to the development of simplified uniform protocols, including protocols in which all predigestion steps, such as lysis, protein reduction, and alkylation, are performed in a single volume.17−19 Solid-phase extraction (SPE) to purify and concentrate peptides has also become a common practice at the end of the sample preparation protocol. Furthermore, automated sample preparation workflows20,21 or robotized systems start to become available, which allow accurate liquid handling, temperature control, and precise timing of processing steps.22,23 Some of these methods can be performed in miniaturized settings, which are advantageous when working with clinical or other low-abundance samples where analyte amounts are scarce.22,24
Even when optimized sample preparation protocols are in place, straightforward QC assessment at the peptide level would be highly desirable for monitoring sample losses, leading to injecting optimal peptide amounts for LC–MS/MS analysis. For such a procedure to be aligned with a miniaturized, high-throughput mass spectrometry workflow, it should allow (1) batchwise processing, (2) low sample consumption, and (3) execution just before LC–MS/MS analysis in the loading solvent used. Here, we present a procedure that complies with these requirements, based on peptide quantification directly in MS-loading buffer, in a microvolume, microfluidic, UV–visible spectrophotomer that can process several samples simultaneously. Using this procedure, we determined the optimal amount of peptides to be injected for shotgun measurements on our LC–MS/MS setup. Finally, we demonstrated that the application of this procedure for the control of sample loading improves LC–MS/MS and protein quantitation reproducibility.
Results and Discussion
The introduction of a peptide purification step prior to LC–MS/MS analysis24 in routine in proteomics laboratories opened an opportunity to accurately determine peptide concentrations. Such a peptide purification step, typically based on solid-phase extraction (SPE), removes buffer components (like chaotropes, certain detergents, reducing/alkylating reagents, and trypsin) that interfere with LC–MS/MS analysis. As these components often absorb UV light, for a long time, they prevented routine, fast, and accurate peptide quantification, often leading to the analysis of suboptimal peptide amounts by LC–MS/MS. The high purity of peptides obtained after SPE led us to explore the possibility to quantify MS-ready peptide samples using a new-generation UV–visible spectrophotometer.
Simple Application for Accurate Quantification of MS-Ready Peptide Samples
The Lunatic instrument, from Unchained Labs, is a microfluidic spectrophotometer that performs DNA, RNA, protein, and peptide quantifications in batch, consuming only 2 μL of sample. Determination of peptide concentrations happens accurately by a proprietary software application that, from an acquired UV–visible absorbance spectrum, discriminates the signal coming from the UV-light-absorbing amino acids from those of usual contaminants (e.g., nucleic acids, cofactors). The “MS-peptide Quant” application quantifies peptides by taking into account the 280 nm molar extinction coefficient and the molecular weight of the average peptide species in a sample.
The ability to quantify complex peptide mixtures was verified using dilution series of commercial protein digests from yeast, ranging in concentration between 10 ng/μL and 1 μg/μL, based on the theoretical peptide quantity as reported by the vendor. Comparison between the theoretical concentration values and the measured ones in four independent replicate dilutions showed a high linear correlation (R2 > 0.98) and a slope very close to 1 (t-test p-value = 0.19), demonstrating the instrument’s high accuracy (Figure 2). Meanwhile, it was noticed that peptide solutions with concentrations below 50 ng/μL gave absorbance measurements lower than 0.03, the lower absorbance limit at which the analyte concentration can be accurately assessed according to the instrument specifications. Therefore, it was concluded that solutions of peptides with concentrations between 50 ng/μL and 1 μg/μL are within the dynamic range of the instrument and can thus be accurately measured. This concentration range is well suited for MS-ready samples, for which LC–MS/MS experiments typically consume peptide quantities between 100 ng and 5 μg, contained in a volume of a few microliters.
Figure 2.

Dynamic quantification range of the microfluidic spectrophotometer for complex peptide mixtures. Yeast peptide digest solutions with concentrations ranging from 10 ng/μL to 1.0 μg/μL (black dots) can be accurately measured, as shown by a strong correlation between the theoretical and measured peptide concentration values. Below 50 ng/μL (red dots), peptide measurements are no longer reliable, as absorbance values reach the lower limit of detection of the spectrophotometer. Dots represent measurements of four independent replicate dilutions.
We next compared peptide mixture quantification on our microfluidic device with quantification on a NanoDrop, a reference instrument among the class of microvolume spectrophotometers, which has also been used for measurements of MS-ready peptide samples.25−27 In particular, we performed A280 measurements of five samples of HEK293 tryptic digests and compared across-instrument mean and coefficients of variation (CV) values. This analysis showed that quantification estimates differ slightly between instruments, with those from Lunatic always laying below those of NanoDrop (8–19% lower means across the five samples, Mann–Whitney U test p-value < 0.05) (Figure S2). Furthermore, in terms of precision, this was visibly higher in Lunatic relative to NanoDrop (55–81% lower CV across the five samples).
In summary, together with its accuracy for the measurement of peptide solutions at commonly used concentration ranges, peptide quantitation with the Lunatic instrument presents a unique set of characteristics that make it particularly attractive over other quantification methods for MS-ready bottom-up proteomics samples (e.g., Bradford, Lowry, BCA, Pierce 660 nm, tryptophan fluorescence,28 and other A280 methods). It is a quick and easy method that can be performed in batch. It only implies a very low, 2 μL, sample consumption. It is based on UV light absorbance at 280 nm, an intrinsic property of aromatic amino acids, thus requiring no calibration curve, unlike colorimetric reaction-based assays like Bradford or BCA. Finally, with this instrument, it is possible to reach a higher level of precision than with other reference spectrophotometers also performing A280-based peptide quantification.
Determination of an Optimal Peptide Amount for LC–MS/MS Analysis
The ideal peptide amount to use for LC–MS/MS to have a maximum throughput and identification rate, while keeping a good analyte separation, will largely depend on the characteristics of the LC–MS/MS system, namely, on its chromatographic column loading capacity. If the exact sample concentration would be known, it would be possible to always work with optimal sample amounts and thus consistently get high-quality LC–MS/MS runs.
Therefore, taking advantage of peptide quantification by the microfluidic spectrophotometer, we set out to determine the most suitable sample loading for an LC–MS/MS setup routinely used in our laboratory: a 40 cm LC column packed in the needle with 1.9 μm C18 beads coupled to a Q Exactive HF mass spectrometer.
Starting from a commercial tryptic digest of a K562 cell lysate, we prepared 10 different samples, from which 5 μL, containing peptide amounts ranging from 0.06 to 12 μg, was injected for LC–MS/MS analysis using a 2.5 h gradient. The experiment was repeated to generate data for two independent series of replicates analyzed on two different LC columns (Figures 3 and S3).
Figure 3.

Quality control metrics from LC–MS/MS analysis of 10 different amounts of a trypsin-digested K562 cell extract. (a) Theoretical and measured peptide amounts for two independent experiments. In both experiments, all measured values were lower than predicted, pointing to peptide losses during sample solution preparation. (b) Bar plots indicating the numbers of identified peptide and proteins per analytical run. Colors represent the results of two replicate series analyzed on two different LC columns. (c) Representative heatmap visualizing the intensities of quantified proteins in each of the 10 analytical runs measured using LC column 1. Missing values are shown in gray. Based on numbers of identified and quantified proteins a rather broad window ranging from 1.49 to 5.20 μg of peptides was found as an optimal injection amount. (d) Scatter plots of average MS2 ion injection time, median peak area, and median signal-to-noise ratio (S/N) of identified peptides in each analytical run. (e) Scatter plots of the median peak area of hydrophilic, intermediate hydrophobic, and hydrophobic identified peptides. For both replicate series, from around 2–3 μg, peak areas decline steeply for hydrophilic peptides, while they go up progressively for hydrophobic peptides, two types of peptide classes having a lower and higher affinity for the used precolumn, respectively. Colors represent the results of two replicate series analyzed on two different LC columns. Loss curve fitting was used to generate the connecting lines. Based on the loss of hydrophilic peptides, 3 μg was defined as an optimal peptide injection amount for this particular LC–MS/MS setup (dashed lines).
All peptide concentration measurements were lower than predicted (Figure 3a). Likely, these deviations arose mostly from peptide losses during peptide resuspension of the K562 digest, as additional losses during the preparation of serially diluted samples were minor (R2 > 0.99 for the comparison of theoretical vs measured sample concentrations). We also noticed that peptide quantification of #Dilution 1 and 2, having theoretical concentrations of 0.013 and 0.025 μg/μL, respectively, returned negative values. These clearly inaccurate measurements were performed below the limit of detection of the spectrophotometer.
To find an optimal peptide amount to inject into our LC–MS/MS setup, we evaluated the rates of identified and quantified proteins. To this end, the LC–MS/MS data were searched with MaxQuant29 and identified proteins were quantified by the MaxLFQ algorithm30 (Figures 3b,c and S3 and Table S1). The number of identified peptides reached a maximum between 1.49 and 3.28 μg and showed a marked decrease for higher peptide amounts (18–20% reduction in the number of identified peptides for the 10.99 μg samples), likely due to column overloading. In turn, identified and quantified protein numbers increased with the injected peptide amount until 3.28–5.20 μg, above which they started to level off and the same trend was seen for individual proteins (Figure S3). Based on these numbers, a rather broad window ranging from approximately 1.49–5.20 μg of peptides was found as an optimal peptide injection amount for our LC–MS/MS setup.
In an attempt to further narrow down this window, we evaluated selected LC and MS parameters. The efficient time consumption of a mass spectrometer is, among other things, reflected by the ion injection time. The closer to ideal the amount of material presented to the mass spectrometer is, the lower the injection time will be. Figure 3d (left panel) shows that MS2 ion injection time reached an optimal minimum around an average amount of 3.28 μg of injected peptides. We also assessed the two LC parameters signal-to-noise (S/N) ratio of chromatographic peaks and peak areas. Figure 3d (right panel) shows that the average S/N ratio increased with increasing peptide amounts and again leveled off at an average sample amount of about 3.28 μg. Analysis of the median peak area of all identified peptides showed a maximum between 5.20 and 7.08 μg for the two replicate experiments (Figure 3d, middle). When overloading a reversed-phase C18 column, one expects peak tailing, with a concomitant increase of the average peak area due to repulsion effects of same-charge ions.13−15 The observed leveling off and even decrease in the peak area at higher loads though contradicted this expectation. To explore this further, we split peptides according to their retention time interval in three parts: early eluting peptides (hydrophilic, n = 126), late eluting peptides (hydrophobic, n = 178), and the ones eluting in between (mid eluting/intermediate hydrophobic peptides, n = 2304) (Figure S1). Such partitioning procedure revealed that the registered decrease in peak areas was due to a steep decline of hydrophilic peptides peak areas (Figure 3e) starting from 2–3 μg of sample due to the use of a trapping column in our LC–MS/MS setup, whose capacity did not allow retention of the most hydrophilic peptides for higher sample amounts, leading to this trend for hydrophilic peptides loss.
The disadvantage of losing hydrophilic peptides does not overrule the advantages of using a trapping column though if void volumes are avoided.31 Therefore, based on the loss of hydrophilic peptides for amounts above 2.86 and 2.63 μg for replicate series 1 and 2, respectively (peptide amounts that correspond to the peak maxima in the hydrophilic peptides peak area plot), together with the stabilization of the other parameters also around these sample amounts, we now routinely use 3 μg of peptides as an optimal injection amount on this particular LC–MS/MS setup.
By running a series of LC–MS/MS analysis, covering a range of known peptide sample amounts, and performing a follow-up evaluation of the numbers of identified and quantified features, as well as of a few LC and MS parameters, we were able to identify 3 μg as an optimal amount of injected peptides for our LC–MS/MS setup. This procedure could be applied to any other system and as such be of great use in proteomics laboratories. Indeed, knowledge about the most adequate sample amounts to use is currently not known for most systems. As a workaround to deal with this lack of information, it is common to either inject different concentrations of the same sample or else to perform short off-line analytical runs to fine-tune sample loading for a given sample.32 However, these strategies are time- and cost-ineffective and often consume higher amounts of precious sample material than the simple UV-based procedure described here.
Control over Peptide Amount Injections Effectively Stabilizes LC–MS/MS and Protein Quantitation Reproducibility
During sample preparation, it is common to make the protein amounts for all samples of a batch even before proceeding to the digestion step. This will generate very equivalent MS samples that can then be injected for LC–MS/MS using equal volumes. We decided to evaluate whether, in comparison to that approach, performing peptide quantification prior to MS and concomitantly adjusting injection volumes to account for small differences in samples concentrations would have an impact on the reproducibility of LC–MS/MS and, in particular, of quantitation data.
To this end, we analyzed five tryptic digests of HEK293 cells, prepared in parallel starting from five different cell pellets. On the first set of analytical runs, we corrected for the peptide amounts loaded based on measured sample concentration, having injected exactly 3.0 μg of peptide mixture for all five replicates. In contrast, on the second set of runs of the same samples, we injected a fixed volume, corresponding to the average used for the first experiment. After calculating the peptide loadings for this second experiment, we realized there was a difference of 1 μg between the lowest and highest concentrations of the sample (2.5 and 3.55 μg, respectively). These differences are quite substantial and show the importance of accurate peptide quantitation of MS-ready samples. Even with the automation of sample preparation, which should alleviate heterogeneity between samples, peptide quantitation could always be kept as a quality check step.
For both sets, the previously used MS and LC parameters were examined (Figure 4a). Strikingly, while all MS injection time, peak area, and S/N noise ratio values were close to each other in the experiment with the “corrected” sample amounts, these showed a much higher spread in the second experiment where each analytical run had a different sample amount. Indeed, the standard deviation for the MS2 injection time, peak area, and S/N ratio had a tenfold, threefold, and twofold increase, respectively, for the “noncorrected” experiment relative to the corrected experiment (Figure 4a).
Figure 4.

Comparison of LC–MS/MS and protein quantification reproducibility for two sets of analytical runs on trypsin-digested Hek293T cell extracts. (a) Plots of the average MS2 injection time, median peak area, and median signal-to-noise ratio values are shown for the identified peptides in each of five replicates from the corrected and “noncorrected” groups of samples. For each data point, the exact injected peptide amount based on quantification on the microfluidic spectrophotometer is shown on the right. Vertical bars represent the mean ± standard deviation. (b) Density plots and boxplots showing the distribution of the coefficients of variation (CV) of raw intensities (left) and (normalized) maxLFQ intensities (right) for all proteins quantified in the ten analytical runs (n = 2677). For both raw and normalized protein intensities, a shift to higher CV values was found for the noncorrected samples (Mann–Whitney U test p-value < 2.2 × 10⁻¹⁶ for the shift in both raw and normalized distributions).
Finally, we checked whether this higher analytical reproducibility also resulted in a more precise protein quantification. To this end, we looked at the distribution of the coefficients of variation (CV) of raw protein intensity values from corrected replicates versus those from noncorrected replicates. In addition, we compared the CV distributions for label-free quantitation (LFQ) protein intensity values obtained after normalization by the MaxLFQ algorithm. As expected, CV values for the non-normalized intensities were significantly lower for the corrected experiment (Figure 4b, Mann–Whitney U test p-value < 2.2 × 10⁻¹⁶). However, a shift toward lower CV values was also observed for the normalized LFQ intensities of the corrected experiment (Mann–Whitney U test p-value < 2.2 × 10⁻¹⁶), indicating that computational normalization cannot fully compensate for differences in injection amounts. Such a reduction in the dispersion of protein quantification estimates can potentially improve the sensitivity for detecting peptide and protein regulation. Together, these data show that working consistently with equal peptide amounts results in increased reproducibility LC–MS/MS and protein quantification data, even in combination with the normalization of protein intensities during data analysis.
Conclusions
In the present work, we describe a simple procedure to quantify MS-ready peptides using a microfluidic UV–visible spectrophotometer. This instrument, with its integrated peptide quantification software application, constitutes an accurate and easy-to-use device for the implementation of peptide quantification in proteomics laboratories and facilities. Through careful control of the injected peptide amount on a commonly used LC–MS/MS setup, we show how this procedure can provide a constant quality boost to MS-based proteome analyses. The application of this methodology on a routine basis can drastically reduce time and sample losses by avoiding reruns after the injection of suboptimal peptide amounts.
Methods
Sample Preparation
HEK293 cells (5 × 5 × 106) were harvested, washed 3 times in phosphate-buffered saline (PBS), and resuspended in lysis buffer (8 M urea; 20 mM HEPES, pH 8.0). Samples were sonicated by three pulses of 15 s, interspaced by 1 min pauses on ice, at an intensity output of 15 W, and centrifuged for 15 min at 20 000g at room temperature to remove insoluble components. The protein concentration in the supernatants of each sample was measured using a Bradford assay (Bio-Rad), and equal protein amounts (500 μg each) were used for further analysis. Proteins were reduced with 5 mM dithiothreitol (DTT) (Sigma-Aldrich) for 30 min at 55 °C. Alkylation was performed by the addition of 10 mM iodoacetamide (Sigma-Aldrich) for 15 min at room temperature in the dark. The samples were diluted with 20 mM N-(2-hydroxyethyl)piperazine-N′-ethanesulfonic acid (HEPES), pH 8.0, to a urea concentration of 4 M, and proteins were pre-digested with 5 μg of endoLysC (Wako, 129–02541) (1/100, w/w) for 4 h at 37 °C. All samples were further diluted with 20 mM HEPES, pH 8.0, to a final urea concentration of 2 M, and proteins were digested with 5 μg of trypsin (V5111, Promega) (1/100, w/w) overnight at 37 °C. Peptides were then purified on a SampliQ SPE C18 cartridge (Agilent), vacuum-dried, and kept at −20 °C until further use.
Peptide Concentration Measurements
Quantification of peptide mixtures was based on the UV absorbance of aromatic amino acids at 280 nm (A280), on the following spectrophotometer models: a Lunatic microfluidic device (Unchained Labs) and NanoDrop ND-1000 (Thermo Fisher Scientific). In the case of Lunatic, peptide concentrations were determined by the instrument’s MS-peptide Quant tool, while the “A280” application was used with NanoDrop, with the sample type option set to “1 Abs = 1 mg/mL”.
Linear Dynamic Range Determination
The linear dynamic range for measurement of complex peptide mixtures on the microfluidic spectrophotometer was determined on a group of eight solutions prepared from a 1.0 μg/μL stock of a commercial yeast protein digest (Promega, V7461), dissolved in loading solvent (0.1% trifluoroacetyl (TFA) in acetonitrile/water, 2:98 (v/v)). Measurements of solutions in the 1.0 μg/μL to 10 ng/μL concentration range (used concentrations were 0.010, 0.025, 0.050, 0.100, 0.250, 0.500, 0.750, and 1.000 μg/μL) were done in quadruplicate, from four yeast protein digest vials, and at least two readouts per solution were taken.
Comparison of Peptide Quantification in Distinct Microvolume Spectrophotometers
Quantification of peptide mixtures in the two microvolume spectrophotometers was carried out on five samples of HEK293 tryptic digest (n = 10 repeated measurements each sample). Sample means and coefficients of variation (CV) were compared.
Assessment of Optimal Loading Amount
A commercially available K562 cell digest (Promega, V6951) was used to create a twofold dilution series ranging from 0.013 to 2.4 μg/μL. Peptide amounts ranging from 0.06 μg up to 12 μg were loaded on an LC–MS/MS system. In parallel, the actual sample concentration values were assessed with the MS-peptide Quant method (see Figure 3a). The same experiment was repeated using a new K562 cell vial to prepare the dilution series and a different analytical column.
Assessment of LC–MS/MS Analysis Quality under Controlled Sample Loading Conditions
Five HEK293 protein digest samples were resuspended in 30 μL of MS-loading solvent (0.1% TFA in acetonitrile/water, 2:98 (v/v)) and measured with MS-peptide Quant. Two sets of LC–MS/MS analytical runs followed. In the first one, 3.0 μg of peptide mixture from each sample was loaded onto the LC–MS/MS system, while in the second one, the same sample volume was used for all five injections, resulting in peptide amounts ranging from 2.50 to 3.55 μg (detailed in the Results section).
LC–MS/MS Analysis
From each sample, 5 μL was introduced into an LC–MS/MS system through an Ultimate 3000 RSLC nano LC (Thermo Fisher Scientific, Bremen, Germany) in-line connected to a Q Exactive HF mass spectrometer (Thermo Fisher Scientific). The sample mixture was first loaded on a trapping column (made in-house, 100 μm internal diameter (I.D.) × 20 mm, 5 μm beads C18 Reprosil-HD, Dr. Maisch, Ammerbuch-Entringen, Germany). After flushing from the trapping column, the sample was loaded on an analytical column (made in-house, 75 μm I.D. × 400 mm, 1.9 μm beads C18 Reprosil-HD, Dr. Maisch) packed in the needle (pulled in-house). Peptides were loaded with the loading solvent (0.1% TFA in acetonitrile/water, 2:98 (v/v)) and eluted with a nonlinear 150 min gradient of 2–56% solvent B (0.1% formic acid in water/acetonitrile, 20:80 (v/v)) at a flow rate of 250 nL/min. This was followed by a 15 min wash reaching 99% solvent B and re-equilibration with solvent A (0.1% formic acid). The column temperature was kept constant at 50 °C (CoControl 3.3.05, Sonation).
The mass spectrometer was operated in data-dependent, positive ionization mode, automatically switching between MS and MS/MS acquisition for the 16 most abundant peaks in a given MS spectrum. The source voltage was set to 3.0 kV, and the capillary temperature was 250 °C. Full-scan MS spectra (375–1500 m/z, AGC target 3 × 10⁶ ions, maximum ion injection time of 45 ms) were acquired at a resolution of 60 000 (at 200 m/z) in the orbitrap analyzer, followed by up to 16 tandem MS scans (resolution 15 000 at 200 m/z) of the most intense ions fulfilling predefined selection criteria (AGC target, 1 ×10⁵ ions; maximum ion injection time, 60 ms; isolation window, 1.5 m/z; fixed first mass, 145 m/z; spectrum data type, centroid; underfill ratio, 2%; intensity threshold, 1.3 × 10⁴; exclusion of unassigned, singly, and >7 charged precursors; peptide match preferred; exclude isotopes on; and dynamic exclusion time, 12 s). The higher collisional dissociation (HCD) collision energy was set to 28% of the normalized collision energy and the polydimethylcyclosiloxane background ion at 445.12002 Da was used for internal calibration (lock mass).
Data Analysis
Data analysis was performed with MaxQuant software (version 1.6.1.0).29 The Andromeda search engine was used with default settings, including PSM, peptide, and protein false discovery rate set at 1% and match between runs disabled. Spectra were searched against the UniProt reference proteome release 2018_01 (UP000005640_9606, containing 21007 human protein entries) with a mass tolerance for precursor and fragment ions of 4.5 and 20 ppm, respectively. The oxidation of methionine residues and acetylation of protein N-termini were defined as variable modifications, while carbamidomethylation of cysteine residues was set as a fixed modification. Proteins with at least one unique or razor peptide were retained and then quantified by the MaxLFQ algorithm integrated into the MaxQuant software.30 A minimum ratio count of two unique or razor peptides was required for quantification. Further data analysis was performed with the Perseus software (version 1.6.1.3) after loading the protein groups file from MaxQuant. The number of protein identifications was given by the number of protein groups obtained after filtering out protein groups only identified by site, reverse database hits, and potential contaminants. The number of peptide identifications was obtained after the exclusion of reverse database hits and potential contaminants. Quantified proteins were the subset of identified proteins with positive LFQ intensities. Heat maps were prepared from matrices of log 2-transformed LFQ protein expression values, after filtering for at least three valid values over all samples. Proteins were displayed according to the order of groups defined by hierarchical clustering using Euclidean distances and average linkage settings.
The chromatographic parameters signal-to-noise (S/N) ratio and peak area were obtained using the moFF algorithm,33 executed on each analytical run. Peak areas were approximated by the area of a triangle of base equal to the peak width (in minutes) and height given by the peak’s apex intensity. The MS2 injection time was retrieved from MaxQuant’s MS/MS scans table. This analysis was done on peptide-to-spectrum matches from features detected in every analytical run from each experiment. Peptides were partitioned according to hydrophobicity by the following way: hydrophilic peptides were those eluting until 50 min of the LC gradient (1.6–12.3% acetonitrile), intermediate hydrophobic peptides were eluted between 50 and 110 min (12.3–26.6% acetonitrile), and hydrophobic peptides were eluted after 110 min (26.6–79.2% acetonitrile) (Figure S1).
The mass spectrometry proteomics data have been deposited to the ProteomeXchange Consortium (http://proteomecentral.proteomexchange.org) via the PRIDE partner repository with the identifier 10.6019/PD014524.
Acknowledgments
The authors thank Lisa Adamiak and Dina Finan from Unchained Labs for technical advice and sharing information about the Lunatic instrument specifications.
Glossary
Abbreviations
- LC–MS/MS
liquid chromatography–tandem mass spectrometry
- LFQ
label-free quantification
Supporting Information Available
The Supporting Information is available free of charge at https://pubs.acs.org/doi/10.1021/acsomega.0c00080.
Figure S1, Schematic plot showing the percent solvent B gradient and total ion current along retention time from a representative LC–MS/MS run of the sample amount optimization experiment; Figure S2, comparison of peptide quantification in Lunatic relative to NanoDrop microvolume spectrophotometer; Figure S3: trends in protein quantification with increasing sample loadings: (a) heatmap visualizing the intensities of quantified proteins in each of the 10 analytical runs measured using LC column 2 (missing values are shown in gray) and (b) association between protein signals and peptide sample amount; and Table S1, numbers of identified and quantified peptide and protein groups for the two replicate series of K562 analytical runs (PDF)
Author Contributions
K.P., T.M., F.I., K.G., A.S., and J.P. conceptualized the study and designed the experiments. K.P. and T.M.M. prepared the yeast and K562 cell peptide dilution samples. K.B. prepared the HEK293 proteome digests. J.P. performed the LC–MS/MS measurements. T.M., A.S., A.A., and J.P. analyzed the data. T.M. wrote the manuscript with input from F.I., K.G., and L.M. All authors revised the final manuscript.
The authors would like to acknowledge the VIB Tech Watch Fund for supporting early access to innovative technology platforms. L.M., K.G. and F.I. acknowledge support by the EPIC-XS consortium, project number 823839, funded by the Horizon 2020 programme of the European Union, and F.I. acknowledges support by FWO-SBO Project S006617N.
The authors declare no competing financial interest.
Supplementary Material
References
- Meier F.; Brunner A.-D.; Koch S.; Koch H.; Lubeck M.; Krause M.; Goedecke N.; Decker J.; Kosinski T.; Park M. A.; et al. Online Parallel Accumulation-Serial Fragmentation (PASEF) with a Novel Trapped Ion Mobility Mass Spectrometer. Mol. Cell. Proteomics 2018, 17, 2534–2545. 10.1074/mcp.TIR118.000900. [DOI] [PMC free article] [PubMed] [Google Scholar]
- Bache N.; Geyer P. E.; Bekker-Jensen D. B.; Hoerning O.; Falkenby L.; Treit P. V.; Doll S.; Paron I.; Muller J. B.; Meier F.; et al. A Novel LC System Embeds Analytes in Pre-Formed Gradients for Rapid, Ultra-Robust Proteomics. Mol. Cell. Proteomics 2018, 17, 2284–2296. 10.1074/mcp.TIR118.000853. [DOI] [PMC free article] [PubMed] [Google Scholar]
- Espadas G.; Borràs E.; Chiva C.; Sabidó E. Evaluation of Different Peptide Fragmentation Types and Mass Analyzers in Data-Dependent Methods Using an Orbitrap Fusion Lumos Tribrid Mass Spectrometer. Proteomics 2017, 17, 1600416 10.1002/pmic.201600416. [DOI] [PubMed] [Google Scholar]
- Kelstrup C. D.; Bekker-Jensen D. B.; Arrey T. N.; Hogrebe A.; Harder A.; V. Olsen J. Performance Evaluation of the Q Exactive HF-X for Shotgun Proteomics. J. Proteome Res. 2018, 17, 727–738. 10.1021/acs.jproteome.7b00602. [DOI] [PubMed] [Google Scholar]
- Tabb D. L. Quality Assessment for Clinical Proteomics. Clin. Biochem. 2013, 46, 411–420. 10.1016/j.clinbiochem.2012.12.003. [DOI] [PMC free article] [PubMed] [Google Scholar]
- Bittremieux W.; Tabb D. L.; Impens F.; Staes A.; Timmerman E.; Martens L.; Laukens K. Quality Control in Mass Spectrometry-Based Proteomics. Mass Spectrom. Rev. 2018, 697–711. 10.1002/mas.21544. [DOI] [PubMed] [Google Scholar]
- Rudnick P. A.; Clauser K. R.; Kilpatrick L. E.; Tchekhovskoi D. V.; Neta P.; Blonder N.; Billheimer D. D.; Blackman R. K.; Bunk D. M.; Cardasis H. L.; et al. Performance Metrics for Liquid Chromatography-Tandem Mass Spectrometry Systems in Proteomics Analyses. Mol. Cell. Proteomics 2010, 9, 225–241. 10.1074/mcp.M900223-MCP200. [DOI] [PMC free article] [PubMed] [Google Scholar]
- Bittremieux W.; Walzer M.; Tenzer S.; Zhu W.; Salek R. M.; Eisenacher M.; Tabb D. L. The Human Proteome Organization–Proteomics Standards Initiative Quality Control Working Group: Making Quality Control More Accessible for Biological Mass Spectrometry. Anal. Chem. 2017, 89, 4474–4479. 10.1021/acs.analchem.6b04310. [DOI] [PubMed] [Google Scholar]
- Bittremieux W.; Valkenborg D.; Martens L.; Laukens K. Computational Quality Control Tools for Mass Spectrometry Proteomics. Proteomics 2017, 17, 1600159 10.1002/pmic.201600159. [DOI] [PubMed] [Google Scholar]
- Chiva C.; Olivella R.; Borràs E.; Espadas G.; Pastor O.; Solé A.; Sabidó E. QCloud: A Cloud-Based Quality Control System for Mass Spectrometry-Based Proteomics Laboratories. PLoS One 2018, 13, e0189209 10.1371/journal.pone.0189209. [DOI] [PMC free article] [PubMed] [Google Scholar]
- Rieux L.; Lubda D.; Niederländer H. A. G.; Verpoorte E.; Bischoff R. Fast, High-Efficiency Peptide Separations on a 50-Mm Reversed-Phase Silica Monolith in a NanoLC–MS Set-Up. J. Chromatogr. A 2006, 1120, 165–172. 10.1016/j.chroma.2006.01.038. [DOI] [PubMed] [Google Scholar]
- Rieux L.; Sneekes E.-J.; Swart R.. How Sample Loadability ofthe NanoLC Column Influences Protein Identification in LCMSProteomics Studies https://assets.thermofisher.com/TFS-Assets/CMD/posters/PO-70145-Sample-Loadability-Protein-Identification-PO70145-EN.pdf.
- Johnson D.; Boyes B.; Orlando R. The Use of Ammonium Formate as a Mobile-Phase Modifier for LC-MS/MS Analysis of Tryptic Digests. J. Biomol. Tech. 2013, 24, 187–197. 10.7171/jbt.13-2404-005. [DOI] [PMC free article] [PubMed] [Google Scholar]
- McCalley D. V. Rationalization of Retention and Overloading Behavior of Basic Compounds in Reversed-Phase HPLC Using Low Ionic Strength Buffers Suitable for Mass Spectrometric Detection. Anal. Chem. 2003, 75, 3404–3410. 10.1021/ac020715f. [DOI] [PubMed] [Google Scholar]
- McCalley D. V. The Challenges of the Analysis of Basic Compounds by High Performance Liquid Chromatography: Some Possible Approaches for Improved Separations. J. Chromatogr. A 2010, 1217, 858–880. 10.1016/j.chroma.2009.11.068. [DOI] [PubMed] [Google Scholar]
- Hinzke T.; Kouris A.; Hughes R.-A.; Strous M.; Kleiner M. More Is Not Always Better: Evaluation of 1D and 2D-LC-MS/MS Methods for Metaproteomics. Front. Microbiol. 2019, 10, 238 10.3389/fmicb.2019.00238. [DOI] [PMC free article] [PubMed] [Google Scholar]
- Kulak N. A.; Pichler G.; Paron I.; Nagaraj N.; Mann M. Minimal, Encapsulated Proteomic-Sample Processing Applied to Copy-Number Estimation in Eukaryotic Cells. Nat. Methods 2014, 11, 319–324. 10.1038/nmeth.2834. [DOI] [PubMed] [Google Scholar]
- Moggridge S.; Sorensen P. H.; Morin G. B.; Hughes C. S. Extending the Compatibility of the SP3 Paramagnetic Bead Processing Approach for Proteomics. J. Proteome Res. 2018, 17, 1730–1740. 10.1021/acs.jproteome.7b00913. [DOI] [PubMed] [Google Scholar]
- Batth T. S.; Tollenaere M. A. X.; Rüther P.; Gonzalez-Franquesa A.; Prabhakar B. S.; Bekker-Jensen S.; Deshmukh A. S.; Olsen J. V. Protein Aggregation Capture on Microparticles Enables Multipurpose Proteomics Sample Preparation. Mol. Cell. Proteomics 2019, 18, 1027–1035. 10.1074/mcp.TIR118.001270. [DOI] [PMC free article] [PubMed] [Google Scholar]
- Guryča V.; Roeder D.; Piraino P.; Lamerz J.; Ducret A.; Langen H.; Cutler P. Automated Sample Preparation Platform for Mass Spectrometry-Based Plasma Proteomicsand Biomarker Discovery. Biology (Basel) 2014, 3 (1), 205–219. 10.3390/biology3010205. [DOI] [PMC free article] [PubMed] [Google Scholar]
- Fu Q.; Kowalski M. P.; Mastali M.; Parker S. J.; Sobhani K.; van den Broek I.; Hunter C. L.; Van Eyk J. E. Highly Reproducible Automated Proteomics Sample Preparation Workflow for Quantitative Mass Spectrometry. J. Proteome Res. 2018, 17, 420–428. 10.1021/acs.jproteome.7b00623. [DOI] [PMC free article] [PubMed] [Google Scholar]
- Zhu Y.; Piehowski P. D.; Zhao R.; Chen J.; Shen Y.; Moore R. J.; Shukla A. K.; Petyuk V. A.; Campbell-Thompson M.; Mathews C. E.; et al. Nanodroplet Processing Platform for Deep and Quantitative Proteome Profiling of 10-100 Mammalian Cells. Nat. Commun. 2018, 9, 882 10.1038/s41467-018-03367-w. [DOI] [PMC free article] [PubMed] [Google Scholar]
- Kulak N. A.; Geyer P. E.; Mann M. Loss-Less Nano-Fractionator for High Sensitivity, High Coverage Proteomics. Mol. Cell. Proteomics 2017, 16, 694–705. 10.1074/mcp.O116.065136. [DOI] [PMC free article] [PubMed] [Google Scholar]
- Peng J.; Tang F.; Zhou R.; Xie X.; Li S.; Xie F.; Yu P.; Mu L. New Techniques of On-Line Biological Sample Processing and Their Application in the Field of Biopharmaceutical Analysis. Acta Pharm. Sin. B 2016, 6, 540–551. 10.1016/j.apsb.2016.05.016. [DOI] [PMC free article] [PubMed] [Google Scholar]
- Bekker-Jensen D. B.; Kelstrup C. D.; Batth T. S.; Larsen S. C.; Haldrup C.; Bramsen J. B.; Sørensen K. D.; Høyer S.; Ørntoft T. F.; Andersen C. L.; et al. An Optimized Shotgun Strategy for the Rapid Generation of Comprehensive Human Proteomes. Cell Syst. 2017, 4, 587–599.e4. 10.1016/j.cels.2017.05.009. [DOI] [PMC free article] [PubMed] [Google Scholar]
- Batth T. S.; Tollenaere M. A. X.; Rüther P. L.; Gonzalez-Franquesa A.; Prabhakar B. S.; Bekker-Jensen S. H.; Deshmukh A. S.; Olsen J. V. Protein Aggregation Capture on Microparticles Enables Multi-Purpose Proteomics Sample Preparation. Mol. Cell. Proteomics 2019, 18, 1027–1035. 10.1074/mcp.TIR118.001270. [DOI] [PMC free article] [PubMed] [Google Scholar]
- Greco T. M.; Miteva Y.; Conlon F. L.; Cristea I. M. Complementary Proteomic Analysis of Protein Complexes. Methods Mol. Biol. 2012, 917, 391–407. 10.1007/978-1-61779-992-1_22. [DOI] [PMC free article] [PubMed] [Google Scholar]
- Wiśniewski J. R.; Gaugaz F. Z. Fast and Sensitive Total Protein and Peptide Assays for Proteomic Analysis. Anal. Chem. 2015, 87, 4110–4116. 10.1021/ac504689z. [DOI] [PubMed] [Google Scholar]
- Cox J.; Mann M. MaxQuant Enables High Peptide Identification Rates, Individualized p.p.b.-Range Mass Accuracies and Proteome-Wide Protein Quantification. Nat. Biotechnol. 2008, 26, 1367. 10.1038/nbt.1511. [DOI] [PubMed] [Google Scholar]
- Cox J.; Hein M. Y.; Luber C. A.; Paron I.; Nagaraj N.; Mann M. Accurate Proteome-Wide Label-Free Quantification by Delayed Normalization and Maximal Peptide Ratio Extraction, Termed MaxLFQ. Mol. Cell. Proteomics 2014, 13, 2513–2526. 10.1074/mcp.M113.031591. [DOI] [PMC free article] [PubMed] [Google Scholar]
- Mitulović G.; Smoluch M.; Chervet J.-P.; Steinmacher I.; Kungl A.; Mechtler K. An Improved Method for Tracking and Reducing the Void Volume in Nano HPLC–MS with Micro Trapping Columns. Anal. Bioanal. Chem. 2003, 376, 946–951. 10.1007/s00216-003-2047-2. [DOI] [PubMed] [Google Scholar]
- Pynn C.; Samonig M.; Krssakova G.; Mechtler K.; Decrop W.; Swart R.. Capillary-flow LC-UV sample qualitycontrol for low-flow LC-MS based proteomics https://assets.thermofisher.com/TFS-Assets/CMD/Technical-Notes/tn-72602-lc-uv-ms-low-flow-proteomics-tn72602-en.pdf.
- Argentini A.; Goeminne L. J. E.; Verheggen K.; Hulstaert N.; Staes A.; Clement L.; Martens L. MoFF: A Robust and Automated Approach to Extract Peptide Ion Intensities. Nat. Methods 2016, 13 (12), 964–966. 10.1038/nmeth.4075. [DOI] [PubMed] [Google Scholar]
Associated Data
This section collects any data citations, data availability statements, or supplementary materials included in this article.