

Summary
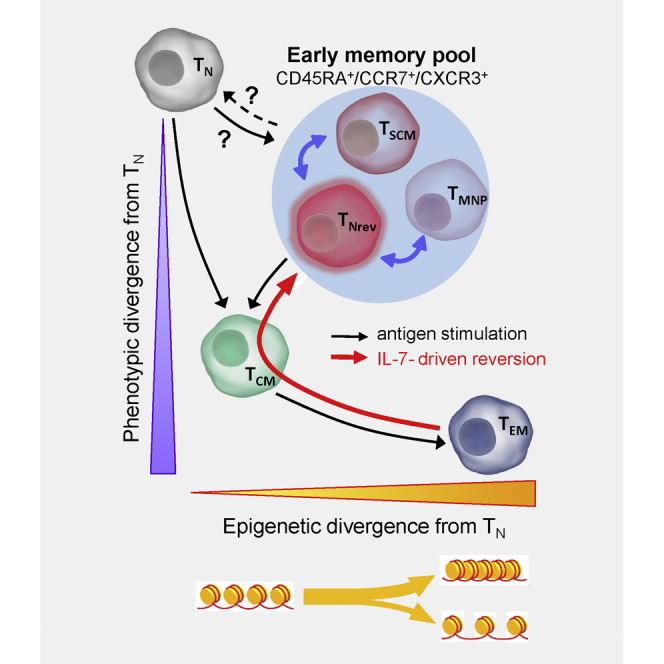
Primary stimulation of T cells is believed to trigger unidirectional differentiation from naive to effector and memory subsets. Here we demonstrate that IL-7 can drive the phenotypic reversion of recently differentiated human central and effector memory CD8+ T cells into a naive-like phenotype.
These “naive-revertant” cells display a phenotype similar to that of previously reported stem cell memory populations and undergo rapid differentiation and functional response following secondary challenge. The chromatin landscape of reverted cells undergoes substantial epigenetic reorganization with increased accessibility for cytokine-induced mediators such as STAT and closure of BATF-dependent sites that drive terminal differentiation. Phenotypic reversion may at least partly explain the generation of “stem cell memory” CD8+ T cells and reveals cells within the phenotypically naive CD8+ T cell pool that are epigenetically primed for secondary stimulation. This information provides insight into mechanisms that support maintenance of T cell memory and may guide therapeutic manipulation of T cell differentiation.
Subject Areas: Biological Sciences, Molecular Biology, Immunology
Graphical Abstract
Highlights
-
•
γ-chain cytokines revert newly differentiated CD8+ T cells to a naive-like phenotype
-
•
These “naive-revertant” are primed for secondary challenge
-
•
Their chromatin landscape is reminiscent of memory cells
-
•
Specific signaling pathways and transcription factors are involved
Biological Sciences; Molecular Biology; Immunology
Introduction
The development of T cell memory is essential for long-term health but it remains uncertain how this population is maintained over the many decades of human lifespan. Current models of CD8+ T cell differentiation propose a unidirectional and irreversible pathway whereby initial antigen stimulation triggers sequential differentiation of naive (TN) cells into central memory (TCM), effector memory (TEM), and effector (TEff) T cells (Klebanoff et al., 2006). T cells gradually acquire increasing effector function but this is associated with a progressive reduction in the capacity for differentiation and self-renewal, i.e., “stemness.” In settings of persistent antigenic stimulations T cells may progressively lose effector functions and proliferative capacity such that they eventually become exhausted.
Two subsets of phenotypically naive CD8+ T cells with features of memory cells have recently been described. “T-memory stem cells” (TSCM), which display enhanced capacity for self-renewal and multipotent proliferative potential (Gattinoni et al., 2011), are believed to be minimally differentiated and located between TN and TCM in the differentiation pathway (Gattinoni et al., 2017). “Memory T cells with naive phenotype” (TMNP) also exhibit broad polyfunctional capability (Pulko et al., 2016) and are thought to be functionally imprinted at an early stage of differentiation between CD8+ TN and TCM subsets. Despite sharing many characteristics, TSCM and TMNP differ in their extended phenotype and it is uncertain if they represent distinct and stable subsets or derive from a common precursor with phenotypic plasticity. Although CD8+ TSCM can be produced in vitro by activating TN cells in the presence of interleukin (IL)-7, IL-21, and the glycogen synthase-3β inhibitor TWS119 9 (Sabatino et al., 2016), the physiological mechanisms leading to the generation of both these cells and TMNP are largely unknown.
Given the importance of cytokines as key regulators of T cell-mediated immunity, we analyzed the effect of different cytokines on T cell differentiation after primary stimulation, using T cells from human cord blood (CB), which are unlikely to have encountered antigen and therefore have a very low frequency of TSCM (Gattinoni et al., 2011). We observed that recently differentiated CD8+ memory T cells can undergo lineage reversion to a naive-like phenotype when exposed to γ-chain cytokines and that these naive-revertant cells share extensive phenotypic and functional characteristics with both TSCM and TMNP. This work describes a new pathway of T cell differentiation and provides a unifying theory for the generation of T cells with a “naive-memory” profile.
Results
IL-7 Induces Recently Differentiated CD8+ Memory T Cells to Revert to a Naive-like Phenotype
CB mononuclear cells (CBMCs) were activated with anti-CD3 plus IL-2, and the differentiation stage of CD8+ T cells was evaluated by CD45RA and CCR7 co-expression (Klebanoff et al., 2006). As expected, activation induced an expansion of TCM (CD45RA−/CCR7+) and TEM (CD45RA−/CCR7-) subsets with a concurrent reduction in TN (CD45RA+/CCR7+) (Figures 1A and 1B). TEff (CD45RA+/CCR7-) were not generated in significant number and were not considered further.
Figure 1.

IL-7 Induces Reversion of Recently Differentiated Memory CD8+ T Cells to a Naive-like Phenotype
(A) Flow cytometric analysis of phenotypic changes in CD8+ T cells after activation and successive incubation with 25 ng/mL IL-7. CBMCs were activated with anti-CD3 plus IL-2, and when the percentage of CD8+ TN dropped below 20%, in this case day 5, cultures were maintained in IL-7. Numbers indicate the percentage of cells in each quadrant. Single representative experiment out of 50.
(B) Kinetics of phenotype reversion of CD8+ T cells from the 50 different CB samples. Each symbol represents one sample. The shaded area indicates the interval of time when IL-7 was added for the first time.
(C) CD8+ T cell proliferation after activation and IL-7 administration. CBMCs were stained with CFSE either before activation (left panels) or at day 9, during phenotype reversion (right panels). At the indicated time points, cell phenotype and CFSE content were assessed for TN (light gray dots) and TCM (dark gray dots). Dashed lines indicate basal content in CFSE. Single representative experiment out of three.
(D) Flow cytometry evaluation of IL-7-dependent phenotype reversion in recently differentiated TCM and TEM. After activation TCM and TEM were negatively selected. The two cell subpopulations were then incubated with IL-7 and monitored for phenotype changes over time. Single representative experiment out of three, for each subset.
(E) The effect of different cytokines on phenotype reversion. CBMCs were activated, and when the percentage of CD8+ TN dropped below 20% the indicated cytokines were added. The percentage of the cells in the different subsets is shown when the percentage of CD8+ TN reached the nadir (upper panel) and afterward, when it reached the plateau (lower panel). Data from six samples. Paired t test analysis between the TN levels at nadir and plateau. ∗∗ = p < 0.001.
(F) Viability of cells incubated with different cytokines. Activated CBMCs were incubated from day 4 with each cytokine or medium, and CD8+ T cell viability was evaluated by flow cytometry using 7-AAD uptake. Data are represented as means ± 1SD of three samples.
(G) The kinetics of phenotype reversion of CD8+ T cells activated with different artificial stimuli. Data are represented as means ± 1SD of three samples. Paired t test analysis between the TN levels at nadir and plateau. ∗ = p < 0.05, ∗∗ = p < 0.001.
(H) The kinetics of phenotype reversion of CD8+ T cells undergoing successive cycles of activation/IL-7 incubation. Newly generated CD8+ TNrev cells were twice re-stimulated with PHA and induced to revert twice with IL-7 when the percentage of TN dropped below 20%. Single representative experiment out of three.
(I) Flow cytometry analysis of phenotype changes of CD8+ TNrev upon activation with the cognate antigen. CB T lymphocytes were activated, retrovirally transduced with the SSC-TCR, and induced to revert their phenotype with IL-7 (left panels). Afterward, cells were incubated with peptide-pulsed DCs (central panels). IL-7 was then added again, driving the transduced cells to revert their phenotype (right panels). Plots were gated on CD8+ T cells. The upper panels show the percentage of transduced (black dots) and non-transduced (gray dots) CD8+ T cells.
In order to investigate the role of cytokines in determining the fate of recently differentiated memory CD8+ T cells, IL-7 was added to the culture medium when the proportion of CD8+ TN dropped below 20% of the CD8+ population, typically around 1 week after activation (6.7 ± 1.9 days, mean ±1 SD, n = 50). No further activation stimulation was given. In the first 3 days following addition of IL-7 the percentage of CD8+ TN continued to diminish, reaching a nadir of 8.4% ± 6.40 (Figure 1B). However, with continuing IL-7 incubation the great majority of CD8+ T cells started to re-express CD45RA and reverted back to a phenotype resembling TN and characterized by co-expression of CD45RA, CCR7, CD62L, and CD27 and loss of CD45RO expression (Figures 1A and S1A). We termed these cells that reverted to a naive-like phenotype as “T naive-revertant” (TNrev). This re-acquisition of a naive-like phenotype by CD8+ memory T cells reached a plateau by 13–28 days after initial activation (20 ± 4.7 days) and typically represented over 70% of the CD8+ T cell population (mean 71% ± 12, range 45%–95%). As such, this value was only slightly below the mean of 87% of CD8+ TN at day 0 (±5.8, range 74–98). All samples followed a similar pattern, although there was variation both in the time taken to reach the peak TNrev level and in the magnitude of the TNrev population at plateau (Figure 1B). These differences in the percentage of cells with naive phenotype between day 0 and nadir, and between nadir and plateau, were highly significant (p = 1.99 × 10−50 and p = 2.69 × 10−38, respectively, by paired t test).
To demonstrate that the phenotypic reversion of differentiated T cells was not due to selective death or proliferation of individual T cell subsets, we enumerated the cells within each cell subset and monitored their proliferation. The total number of all cell subsets before and after reversion remained largely unchanged (Table S1), and no cell proliferation was detected after the addition of IL-7 and during the period of phenotypic reversion (Figure 1C). To further confirm that the phenomenon was due to modulation of cellular phenotype, recently differentiated CD8+ TCM and TEM were purified, incubated with IL-7, and tracked. Phenotype reversion was again demonstrated for over 80% of the purified TCM and TEM (Figure 1D).
TNrev May Undergo Several Rounds of Differentiation and Reversion
We next assessed whether this property was unique to IL-7 or shared by other cytokines. Recently differentiated CBMCs were incubated with single and multiple combinations of the γ-chain cytokines IL-2, IL-7, IL-15, IL-4, and IL-21. IL-6, an inflammatory cytokine, was also incorporated.
Phenotypic reversion was observed with several of these cytokines, but IL-7 was the most potent agent (Figure 1E). Interestingly, CD8+ T cells cultured with IL-6 or IL-21 were driven toward a more differentiated phenotype with a substantial increase in TEff cells. No synergistic effect was observed when IL-7 was administered together with IL-2, IL-4, or IL-15. In addition, the ability of individual cytokines to promote dedifferentiation to TNrev cells was correlated with their ability to maintain CD8+ T cell survival in vitro (Figure 1F), whereas IL-6, IL-21, or medium alone led to substantial cell death. This suggests that reversion may be a default physiological program of recently differentiated CD8+ T cells when a survival stimulus is provided.
Phenotypic reversion also takes place following differentiation induced by mitogenic stimuli other than soluble anti-CD3 (Figure 1G). The percentage of differentiated CD8+ T cells undergoing IL-7-dependent phenotype reversion after activation with phytohemagglutinin (PHA) and staphylococcus enterotoxin B (SEB) was similar to those following activation with anti-CD3. Activation with CD3/CD28 beads led to a smaller proportion of differentiated cells reverting to a naive phenotype, but we were unable to fully remove the beads, some of which were still attached to the cells when IL-7 was added, and it is likely that the resulting continuous antigen stimulation explains the lesser reversion achieved. However, the kinetics of reversion were similar demonstrating that co-stimulation does not prevent phenotypic reversion.
We further assessed whether cells could undergo more than one cycle of phenotypic reversion. Since serial rounds of anti-CD3 stimulation led to a high rate of cell death, PHA was used for two further rounds of activation, each followed by IL-7 incubation (Figure 1H). Phenotypic reversion was observed after each cycle of activation and IL-7 treatment, indicating that CD8+ TN can undergo repeated cycles of differentiation and reversion.
In order to demonstrate that phenotypic reversion is also possible after activation with cognate antigen, CBMCs were transduced with a gene encoding a T cell receptor (TCR) specific for a peptide from the Epstein-Barr virus (EBV) LMP2 protein (Frumento et al., 2013). Following activation and retroviral transduction, cells acquired a predominantly TCM/TEM phenotype but reverted to TNrev when incubated with IL-7. Cells were then re-challenged with peptide-pulsed autologous dendritic cells (DCs) and underwent differentiation again to CD8+ TEM within 5 days (Figure 1I). At this point IL-7 was re-added, and after a further 9 days a second reversion to TNrev was attained, demonstrating that phenotypic reversion is also possible after stimulation with cognate antigen presented by professional antigen-presenting cells.
CD8+ TNrev Proliferate and Differentiate Rapidly into Functional Effector Cells following Secondary Stimulation
As TNrev are antigen-experienced cells that have previously undergone differentiation and expansion we were interested to assess their proliferative potential when compared with primary TN. After re-stimulation TNrev differentiated into memory subsets more rapidly than TN and exhibited a higher proliferation rate (Figures 2A and 2B). TNrev also rapidly acquired effector function, and when EBV-specific TCR-transduced TNrev were re-stimulated with peptide-pulsed DCs and driven to a TEM phenotype the cells expressed perforin and granzyme B (Figure 2C) and exerted cytolytic activity against target cells (Figure 2D).
Figure 2.

CD8+ TNrev Cells Have Excellent Differentiation and Proliferative Potential and the Amplitude of Reversion Depends on the Cell Source
(A) Flow cytometry analysis of phenotype changes in CD8+ TNrev and TN cells from the same CB sample following stimulation with PHA. Single representative experiment out of three.
(B) Flow cytometry analysis of the proliferation of CD8+ TNrev and TN cells. Cells from the samples shown in the panel above were stained with CFSE at day 0 and activated with PHA. The CFSE content in the two cell subsets is shown at the indicated time points. Dashed lines represent basal content of CFSE. Single representative experiment out of three.
(C) Flow cytometry analysis of perforin and granzyme B expression by the re-stimulated TCR-transduced CD8+ TNrev. The intracellular expression of perforin and granzyme B were assessed in TNrev cells transduced with the SSC-TCR after re-stimulating the cells twice with cognate peptide-pulsed DCs.
(D) Cytotoxic assay of re-stimulated, SSC-specific TCR-transduced TNrev. The T cells were incubated in a standard 51Cr cytolytic assay with target cells consisting of HLA A∗1101-transduced T2 cells loaded with either 1 μg/mL (diamonds), 10 ng/mL (squares) or 1 ng/mL (triangles) of SSC peptide. The peptide solvent, i.e., DMSO, was used as control (crosses). The percentage of target cell killing at different E:T ratios is indicated.
(E) TN cells were isolated from CBMCs and PBMCs, activated with PHA, and then incubated with IL-7. The percentage of cells in the different subsets was measured by flow cytometry at the indicated time points. Data are represented as mean ± 1SD of five CB samples and eight PB samples. Analysis by paired t test.
(F) Differential accessibility of peak regions identified in PB TN cells versus CB TN cells. The x axis indicates Log2 fold change, and the y axis indicates –Log10 p value of all peaks. Colored points indicate differentially accessible chromatin sites with inaccessible sites as blue and accessible sites as red. Data are from three CB and three PB samples.
(G) TF-binding motif enrichments at DACs more accessible in TN from PB and from CB. Significant (FDR<0.1) pathway enrichments identified within DEG lists from TNrev.
(H) CD8+ TN, and TCM and TEM, were isolated from adult PB, activated with PHA, and incubated with IL-7 from day 5. The percentage of cells in the different subsets was measured by flow cytometry at the indicated time points. Data are represented as mean ± 1SD of three samples. Paired t test.
T Cells from Cord Blood and Adult Donors Differ in Degree of Reversion and Chromatin Accessibility
In order to demonstrate that phenotypic reversion phenomenon is not just restricted to T cells from CB we next enriched CD8+ and CD4+ TN cells from the blood of adult donors and compared their ability to revert to TNrev following in vitro activation (Figure 2E). Although the vast majority of CB-derived CD8+ T cells could be induced to revert to TNrev, this was seen in less than half of naive CD8+ T cells from peripheral blood (PB) of adult donors. The reduced degree of reversion in PB cells could not be related to differences in basal phenotype as these were identical in TN cells from CB and PB (Figure S1B). Instead, a remarkable difference was found in the chromatin landscape of TN from the two sources (Figure 2F), which is predicted to influence a range of biological processes (Figure S2A). Compared with TN from PB, TN from CB showed increased accessibility to sites binding transcription factors (TFs), in particular those from the basic region/leucine zipper motif (bZIP) family, of which BATF was the one with the highest number of open binding sites (Figure 2G). Moreover, TNrev showed more open chromatin regions annotated as regulatory sites for genes involved in TCR signaling (Figure S2B).
Only recently differentiated TCM and TEM were able to undergo reversion and not established TCM (CCR7+/CD45RA−) and TEM (CCR7-/CD45RA−) CD8+ T cells from adult blood (Figure 2H). This indicates that, despite similar phenotype, the capacity for IL-7-induced dedifferentiation is observed only within recently differentiated TCM and TEM and is relatively less efficient in adult donors.
Figure 3.

CD8+ TNrev Can Acquire Phenotypic and Functional Characteristics of Other Early Memory T Cell Subsets and Are Present In Vivo
(A) The expression of the markers that discriminate early TNrev from TN and recently differentiated TCM was measured by flow cytometry. Single representative experiment out of three.
(B) Kinetics of CD25 and CD127 expression by CD8+ TNrev in the presence of either IL-2 or IL-7. After phenotype reversion had occurred, cells were either maintained in 25 ng/mL IL-7 or switched to culture in 30 U/mL IL-2. The absence of one cytokine led to increased expression of its cognate receptor. The mean fluorescence intensity (MFI) is shown. Data are represented as means ± 1SD of three samples. Unpaired t test analysis between the MFI levels at day 28, ∗ = p < 0.05.
(C) Kinetics of the expression of discriminatory markers for early TNrev cells. The MFI was measured at different time points during activation and reversion. Data are represented as means ± 1SD of three samples.
(D) Scheme of the differences in phenotype between the memory CD8+ T cell subsets showing naive-like phenotype.
(E) TNrev were re-stimulated with PMA plus ionomycin, and the percentages of cells expressing granzyme B, IFNγ, TNF-α, and combinations thereof were measured after 3 and 14 h. Data are represented as mean of three samples.
(F) Cells with the TNrev signature are present among the TN from tonsils, but not from PB. The expression of CD95 and integrin β7 was measured gating CCR7+/CD45RA+ CD8+ T cells from tonsils of seven patients with recurrent acute tonsillitis or from PB of seven unrelated healthy individuals.
TNrev Phenotype Overlaps with TSCM and TMNP during In Vitro Culture
Using available data (Christensen et al., 2001, Hendriks et al., 2003, Hermiston et al., 2003, Ishida et al., 1992, Kim et al., 2006, O'Shea et al., 1992, Zehnder et al., 1992) we identified 28 membrane-bound proteins that exhibit a differential pattern of expression following T cell activation and differentiation. Antibodies against these proteins were then used to contrast the phenotypic profile of TN and TNrev. The pattern of expression of integrin β7, CD25, CD127, CD95, CXCR3, and CD49d was found to discriminate between these two subsets (Figure 3A). Interestingly, CD95 and CXCR3 are also distinct markers of TSCM (Gattinoni et al., 2011) and CD49d is a marker of TMNP (Pulko et al., 2016). TNrev and TCM are clearly distinguished by CCR7 and CD45RA expression, but additional differences were also found in the expression of CD25, CD45RO, CD69, CD95, CD120b, CD122, and PTK7 (Figures 3A and S3). These differences demonstrate that the phenotypic correlates of reversion extend substantially beyond differential expression of CCR7 and CD45RA.
We next went on to investigate the relationship between TNrev cells and TSCM and TMNP subsets. In particular we were interested in the stability of the TNrev phenotype and how this could be modulated by culture conditions. CD8+ TNrev cells had a very similar phenotype to TSCM and TMNP, and all three expressed a common profile of CD45RA+/CCR7+/CD27+/CD62L+/CD45RO−/CXCR3+/CD31+/CD122lo. Indeed, the only difference between early TNrev and the other two subsets was that both TMNP and TSCM express the IL-7 receptor (CD127) and TSCM lack expression of the IL-2 receptor (CD25), whereas TNrev exhibit a CD127lowCD25high phenotype. However, expression of the receptors for IL-7 and IL-2 is down-regulated on T cells in the presence of their respective cytokines (Minami et al., 1993, Park et al., 2004, Vranjkovic et al., 2007). When TNrev were deprived of IL-7 and maintained in IL-2 for 2 weeks they adopted a phenotype almost indistinguishable from TSCM and TMNP with rapid decrease in CD25 expression and progressive increase in CD127 expression (Figure 3B). After an additional 2 weeks of culture with IL-2 there was further progressive loss of CD49d, CD95, CXCR3, and integrin β7 (Figure 3C) such that late TNrev acquire a phenotype approaching that of primary TN, although their epigenetic signature clearly identifies them as a different population. We were unable to monitor the cells further due to increased cell death. These results suggest that the cytokine milieu and the time since activation account for the modest phenotypic diversity between TNrev, TSCM, and TMNP (Figure 3D). TNrev also share functional characteristics with TMNP as the latter cells express granzyme B and secrete IFNγ and TNF-α after re-stimulation with phorbol myristate acetate (PMA) plus ionomycin (Pulko et al., 2016). Resting TNrev also became polyfunctional after the same treatment, r (Figure 3E).
To assess the in vivo relevance of phenotypic reversion we also looked for the presence of cells with the TNrev signature in the blood and secondary lymphoid tissue (tonsils) of adult donors. CD8+ T cells with a CCR7+CD45RA+ naive phenotype and expression of CD95 and integrin β7 were present within tonsil but were not seen in blood (p = 0.017, unpaired t test, Figure 3F). The population of memory T cells within tonsil had a CD95low and integrin β7− phenotype (Figure S4) and was clearly distinguishable from the putative TNrev.
Substantial Chromatin Reorganization Is Observed during Differentiation from TN to TEM and This Is Partially Retained following Reversion
Epigenetic modifications have a profound regulatory influence on CD8+ T cell differentiation and function (Henning et al., 2018, Moskowitz et al., 2017). We next used ATAC-seq to investigate the profile of chromatin landscape remodeling during T cell differentiation and reversion. ATAC-seq analysis was performed on purified TN, TCM, TEM, and TNrev CD8+ populations following in vitro culture. ATAC-seq read density profiles at phenotype-defining genes such as CCR7 and GZMB were compatible with lineage-specific expression (Figure S5).
Differentially accessible chromatin sites (DACs) were identified within memory subsets and contrasted with the profile in naive cells (Figures 4A and S6A). The majority of epigenetic modifications were acquired relatively late in differentiation during transition from TCM to TEM. In particular, only 26 DACs developed during transition from naive to central memory cells but this increased markedly to 5,829 with further differentiation to TEM. Interestingly, 51% of these DACs were lost during reversion to TNrev but 2,830 DACs still remained within TNrev cells (Figures 4A and 4B). Read density distributions at TEM and TNrev DACs further indicate that the chromatin landscape of TNrev cells retains similarity to TEM cells (Figures 4C and 4D) and is supported by principal component analysis of sample-wise chromatin accessibility, which identified unique groups for the TN, TCM, and TEM populations and alignment of TNrev with the memory subtypes (Figure S6B).
Figure 4.

Chromatin Landscape Changes during Differentiation from TN to TCM and TEM and Reversion to TNrev
(A) Pairwise comparisons of chromatin accessibility at peak regions. The x axes indicate Log2 fold change, and the y axes indicate unadjusted –Log10 p value of all peaks. Colored points indicate differentially accessible chromatin sites with inaccessible sites as blue and accessible sites as red.
(B) DACs count for accessible and inaccessible regions in comparison with TN are shown for TCM, TEM, and TNrev.
(C) Tracking from TN to TNrev the accessibility of DACs becoming inaccessible (TN to TEM closing)/accessible (TN to TEM opening) upon differentiation to TEM.
(D)Tracking from TN to TNrev the accessibility of DACs becoming inaccessible (TN to TNrev closing)/accessible (TN to TNrev opening) upon reversion to TNrev. The y axis is chromatin accessibility in units of rlog normalized mapped reads at the peak site.
(E) Overlaps of differentially accessible sites. Overlaps of DACs more accessible in TCM/TEM/TNrev compared with TN (left) and DACs less accessible in TCM/TEM/TNrev compared with TN (right).
We next investigated the balance of open and closed chromatin during differentiation and reversion. A relative increase in the number of inaccessible chromatin regions was observed during differentiation with 4,316 closed and 1,299 open DACs in TEM compared with TN (Figure 4E). This profile was retained within the TNrev population with values of 2,194 and 617 DACs, respectively. The great majority of DACs within TNrev were shared with the TEM population, although 216 and 546 regions were uniquely open and closed, respectively, within this subtype.
Biochemical Pathways Associated with Reversion Can Be Identified by Epigenomic and Transcriptional Analysis of T Cell Subsets
In order to examine the relationship between chromatin landscape and gene expression, DAC regions were next annotated with the gene whose transcriptional start site was nearest to the peak summit. As anticipated, differential chromatin accessibility was observed at genes encoding phenotypic markers that discriminate T cell subsets including CD25, CD127, integrin β7, and CXCR3 (Figure 5A).
Figure 5.

Chromatin Accessibility Identifies Biochemical Pathways Specific for TN and TNrev
(A) ATAC-seq signal tracks at selected markers that discriminate early TNrev from TN and recently differentiated TCM. Gene diagrams (bottom) show alternative transcripts with black boxes indicating exons. Each subset signal is aggregated across the constituent samples, n = 4(TN), 3(TCM), 3(TEM), 4(TNrev). The y axes are in units of reads per million mapped reads.
(B) DAC sites in TNrev versus TN cells. Normalized mapped read density (RPKM) of aggregated TN (n = 4) and TNrev (n = 4) mapped ATAC-seq reads at differentially accessible chromatin sites (centered on peak summit, extended +/− 5 kbp).
(C) Pathways significantly enriched (adjusted p value <0.1) in genes closest to TN accessible or TNrev accessible DACs.
(D) Efficiency of reversion in the presence of ATRA. The percentage of CD8+ TNrev was recorded at day 24 from activation in three CBMC samples. Unpaired t test.
(E) After activation CBMCs were incubated with the indicated combination of IL-7 25 (ng/mL), ATRA (10−8M), and BMS (493 3 × 10⁻⁶M). Data are from three CBMC samples. One-way ANOVA.
Genomic regions enrichment of annotations (GREAT) analysis (Table S2) revealed that the 1,648 DAC sites that became closed in TEM, and were not reopened in TNrev, were enriched for pathways related to TCR signaling in naive T cells and CXCR4-mediated signaling. Sites that were opened during reversion of TEM to TNrev showed enrichment for IL-7 signal transduction and Lck/Fyn-mediated initiation of TCR activation, whereas the 546 DAC sites uniquely closed in TNrev were enriched for pathways involved in generation of T cell cytotoxicity.
To further interrogate the differences between true TN and TNrev cells we combined DAC analysis with transcriptional analysis of the two populations. In total 2,830 DAC regions had been identified between the two subtypes, 622 of which were more accessible in TNrev and 2,208 less accessible (Figure 5B). These regions were annotated with the gene whose transcriptional start site was nearest to the peak summit. Pathway enrichment analysis with g:Profiler highlighted that genes becoming less accessible in TNrev included those that regulate the major differentiation pathways for Th1, Th2, and Th17 cells (Figure 5C). Genes associated with retinol metabolism became markedly more accessible in TNrev and is of note given the pleiotropic effects on retinoic acid on T cell differentiation (Beijer et al., 2013). Indeed, escalating doses of all-trans retinoic acid (ATRA) progressively inhibited reversion of IL-7-treated CD8+ T cells (Figure 5D) and this was blocked by a pan-retinoic acid receptor antagonist (Figure 5E).
Transcriptional analysis confirmed that RNA expression levels were strongly associated with ATAC-seq read density at transcription start sites and enhancer regions (Figure 6A), and enrichment analysis of gene sets annotated at TNrev DACs confirmed strong relationship between chromatin accessibility and expression level (Figure 6B). Transcriptome analysis revealed 2,841 differentially expressed genes including major immune regulators such as FOS, JUN, KIT, and IL2RA (Figures 6C and 6F and Table S3). Moreover, 32 of the 104 genes within the Notch signaling pathway were differentially regulated in TNrev (Figures 6D and 6G). Gene set enrichment analysis (GSEA) of regions closest to Notch signaling genes confirmed an enrichment in accessible chromatin regions in TNrev cells (Figure 6E) particularly in the HDAC2 and HDAC9-associated regions.
Figure 6.

Chromatin Accessibility and Transcriptome Profiles of TN and TNrev
(A) Average mapped read density profiles (centered on TSS (top) and enhancer regions (bottom) generated from aggregated TN (left) and TNrev (right) ATAC-seq reads. Profiles are for genes identified from transcriptome analysis to be expressed at low, medium, and high levels in TN and TNrev cells, respectively.
(B) Enrichment score (ES) for gene expression changing coordinately with chromatin accessibility. ES of genes closest to TNrev accessible (red) and TN accessible (green) DACs, vertical bars indicate position of such genes on the axis of fold change in expression (ranking from most down-regulated in TNrev to most up regulated in TNrev).
(C) Microarray analysis was performed on three CD8+ TN samples and on the respective CD8+ TNrev cells. Pairwise comparison of gene expression in TN versus TNrev cells showing –Log2 p value versus Log2 fold change of all genes. Colored points indicate differentially expressed genes that are down-regulated in TNrev (blue) and up-regulated in TNrev (orange).
(D) The genes in the Notch pathway (yellow dots) that are significantly down-regulated and up-regulated in TNrev are labeled.
(E) Barcode plot from GSEA analysis showing ES of Notch signaling genes within sites ranked by chromatin accessibility. Vertical bars indicate position of such genes on the axis of fold change in chromatin accessibility, ranking from most inaccessible in TNrev to most up accessible in TNrev.
(F) As in (A) but for aggregated TNrev (left) and TMem (right) ATAC-seq reads.
(G) RNA-seq analysis was performed on four TMem samples (two TCM and two TEM) and on the respective CD8+ TNrev cells. Pairwise comparison of gene expression in TN versus TNrev cells showing –Log2 p value versus Log2 fold change of all genes. Colored points indicate differentially expressed genes that are down-regulated in TNrev (blue) and up-regulated in TNrev (orange).
Comparative transcriptional analysis of TNrev with memory T cells (TMem) (Figures S7A–S7C) also confirmed RNA expression to be associated with ATAC-seq read density (Figure 6F), and pairwise comparison revealed 447 genes down-regulated in TNrev including several involved in T cell cytolytic activity such as GZMB, GZMH, and GNLY. In contrast, 267 genes were up-regulated and included proteins that support cell survival and act to block cell differentiation, such as CISH, NPDC1, HSF4, and OSM (Figure 6G). Interrogation of the transcriptomes of TNrev, TMem, and TN subsets allowed identification of 97 signature genes specific for TNrev (Figures 7A and 7B) and pathways enriched in genes that were differentially regulated in this subset (Figure 7C). These include a number of intracellular signaling pathways, such as JAK-STAT and the RUNX-dependent regulation of WNT signaling. Comparison of TF transcripts in TNrev and TMem (Figure S8) showed differences in the expression of TFs related to stemness and generation of TSCM (Gattinoni et al., 2012, Kondo et al., 2018).
Figure 7.

Transcriptional Signatures of TNrev Cells
(A) Intersections of DEGs identified from differential expression analysis of TNrev versus TMem and TNrev versus TN.
(B) Heatmap of the top 40 TNrev signature genes. Z-scores were calculated for each gene from RNA-seq (left) and Microarray (right) datasets independently.
(C) Significant (FDR<0.1) pathway enrichments identified within DEG lists from TNrev versus TMem and TNrev versus TN.
(D) TF-binding motif enrichments at DACs more accessible compared with TN. Motif enrichments were calculated on the following DACs: 4 shared in TCM, TEM and TNrev; 890 in TEM; 401 shared in TEM and TNrev; 216 in TNrev.
(E) TF-binding motif enrichments at DACs less accessible compared with TN. Motif enrichments were calculated on the following DACs: 14 shared in TCM, TEM, and TNrev; 2,868 in TEM; 1,648 shared in TEM and TNrev; 546 in TNrev.
(F) Expression of TFs with binding motifs enriched in loci that are uniquely open in TNrev cells. The x axis indicates fold change in TF expression, and the y axis indicates -log10 p value of TF-binding motif enrichment in loci uniquely more accessible in TNrev cells. Increasing dot size indicates increasingly significant difference in TF expression and color indicates TF family.
(G) As in (D) but for TFs with binding motifs enriched in loci uniquely closed after reversion to TNrev.
Reversion Is Associated with Opening of Binding Sites for RUNX and STAT Transcription Factors and Closure of Sites that Bind BATF
TFs can instigate chromatin remodeling and act as important regulators of differentiation. As such, we next assessed the relative enrichment of TF-binding motifs within genomic regions that became differentially open or closed in the different cell subsets. DACs that became more accessible in TEM were enriched in binding motifs for five TF complexes, including PU.1/IRF, COUP-TFII, and zinc finger members, and these open sites were largely retained during reversion to TNrev cells (Figures 7D and 7E). In contrast, many TF-binding motifs became less accessible upon differentiation to TEM although this profile was not strongly retained in the TNrev subset.
Finally, in order to gain insight into the potential regulators of reversion we focused on the relative access of TFs for regions of chromatin that were uniquely open or closed in TNrev cells. Strikingly, chromatin regions containing binding motifs for ET1, RUNX1, and RUNX2, as well as STAT1, STAT4, and STAT5, all became more accessible during reversion, although transcriptional activity from RUNX1 and RUNX2 genes was suppressed in the revertant population (Figure 7F and Table S4). In contrast, there was substantial closure of chromatin regions containing binding motifs for BATF and ZNF189 (Figure 7G and Table S4), which is of particular note given the importance of BATF in driving PD-1-mediated T cell exhaustion (Wherry, 2011).
Discussion
There is increasing appreciation of the importance of cellular plasticity (Blanpain and Fuch, 2014), and reversion of mature cells into stem cells has been confirmed in some organ systems (Stange et al., 2013, Tata et al., 2013). Here we show that extensive phenotypic reversion of effector CD8+ T cells to naive phenotype can occur within the human immune system. Reversion was mediated primarily by IL-7, which is expressed by a range of stromal cells within secondary lymphatic organs and is therefore available to support reversion following local antigen-driven activation (Huang and Luther, 2012). Indeed, cells with a TNrev phenotype were located within human tonsil. An interesting observation was that the addition of IL-7 markedly decreased apoptosis, suggesting that reversion may be a “default” pathway of recently activated TN cells in the presence of appropriate survival signals (Hong et al., 2012, Mackall et al., 2011, Surh and Sprent, 2008).
The finding sheds light on the potential relationship between the TSCM, TMNP, and TNrev populations. These three groups share a common core phenotype exemplified by expression of CD45RA, CCR7, and CXCR3. CD45RA regulates the signaling threshold in T lymphocytes (Hermiston et al., 2003, Irles et al., 2003), and CCR7 permits entry into secondary lymphoid tissue, whereas CXCR3 plays a fundamental role in extravasation of CD8+ T cells into inflammatory sites (Cole et al., 1998, Mikucki et al., 2015, Peperzak et al., 2013). The naive-memory phenotype therefore generates an antigen-specific memory pool, which retains the ability to enter lymphoid tissue but has developed heightened responsiveness to re-challenge and may gain rapid access to tissue sites.
Interestingly, the major differences in the phenotype of TNrev, TSCM, and TMNP relate to expression of the IL-7 and IL-2 receptors and these were modulated on TNrev according to the local concentration of IL-2 and IL-7 (Minami et al., 1993, Park et al., 2004, Vranjkovic et al., 2007). TSCM also express CD95+, whereas TMNP express CD49d, and we observed that both receptors are down-regulated during prolonged incubation, with CD95 expression falling more rapidly than CD49d expression. As such, we would suggest that the three populations represent a spectrum of naive-memory cells that are generated by reversion and display modest phenotypic diversity that varies according to cytokine concentration and time since activation. Indeed, phenotypic transition of TEM to TCM populations has been observed in murine systems (Wherry et al., 2003), and reversion from TEM to TCM and from these subsets to TSCM was described in patients following hematopoietic stem cell transplant (Cieri et al., 2015).
This work builds on the work of Cieri et al. who previously demonstrated the generation of TSCM from naive cells after T cell engagement in the presence of IL-7. However, in that study the cytokine was included in culture from the start of activation. We certainly do not rule out the possibility that TMNP and TSCM may also be generated by additional mechanisms such as direct differentiation from TN (Cieri et al., 2013, Lugli et al., 2013, Sabatino et al., 2016, Zanon et al., 2017) and CD8+ TSCM have also been induced in vitro by activation of T cells in the presence of a glycogen synthase-3β inhibitor (Sabatino et al., 2016). Engagement of the Notch pathway in memory T cells also generates TSCM-like CD8+ and CD4+ T cells (Kondo et al., 2017), and we found a number of genes in the Notch pathway to be differently expressed between TN and TNrev (Figure 6D). Furthermore, IL-7 can further enhance with Notch signaling to induce a TN-like phenotype in recently activated CD8+ T cells (Kondo et al., 2018). These findings suggest that notch engagement and IL-7 may represent two alternative mechanisms to generate TSCM-like cells.
Importantly, we observed that TNrev cells were able to undergo several rounds of reversion in vitro, and as such this process may be important in protection from both acute and chronic infectious agents. Indeed, it is now clear that a substantial proportion of antigen-experienced T cells is contained within the apparent “naive” CD8+ T cell pool (Ellefsen et al., 2002, Remmerswaal et al., 2012). Longer-term culture of TNrev led to progressive down-regulation of integrin β7 and CXCR3, but it is uncertain if they can ultimately acquire a phenotype indistinguishable from that of primary TN.
Most of our work was performed on T cells from CB, which contains very few memory or effector cells. We did observe phenotypic reversion using TN cells from adult donors, although the relative proportion of cells that underwent reversion was sharply reduced and may reflect the decreased number of open chromatin sites and binding sites for TF in adult PB. Interestingly, the epigenetic landscape of CD8+ T cells in older people is globally biased toward a differentiated phenotype (Moskowitz et al., 2017) with a reduction in chromatin accessibility that is most apparent at the IL-7R locus (Ucar et al., 2017).
Phenotypic reversion may help to explain the paradox of preservation of the human TN pool during aging despite in vivo analyses and mathematical modeling suggesting that thymic output is insufficient for its maintenance (den Braber et al., 2012, Hakim et al., 2005, Murray et al., 2003). Interestingly, it was found that the TSCM/TN ratio in PB increases with age (Li et al., 2019), suggesting that during aging naive-memory cells replace TN and sustain immunological memory.
Epigenetic regulation maintains the equilibrium between self-renewal and differentiation of stem cells and regulates tissue homeostasis throughout life. As such we were keen to understand how the chromatin landscape was modified following T cell activation and if these changes were reversible during phenotypic reversion to TNrev. Interestingly, this was largely not the case and TNrev cells retained an epigenetic profile that was similar to effector cells. As such, TNrev become “epigenetically primed” for secondary activation at the same time as they undergo phenotypic reversion to a naive-memory phenotype. The chromatin modifications within TNrev are likely to explain their ability to rapidly differentiate and acquire effector function in response to secondary stimulation and reveal a discrepancy between the degree of phenotypic and epigenetic reversion. This may partly explain the decrease in chromatin accessibility in phenotypically naive CD8+ T cells in older people (Ucar et al., 2017). Furthermore, the observation that the chromatin landscape of TNrev is much more extensively modified than that of TCM provides further confirmation that they have undergone sequential differentiation and reversion rather than minimal differentiation from TN.
Analysis of the distribution of TF-binding sites within differentially accessible chromatin regions can help to identify potential transcriptional regulators of differentiation. A striking observation was that many chromatin regions containing binding sites for BATF became closed during reversion. BATF is an essential regulator of CD8+ differentiation (Kurachi et al., 2014), and PD-1 engagement on T cells can drive BATF-dependent terminal differentiation (Quigley et al., 2010).
Reversion may play a potential role in limiting T cell exhaustion in both physiological and pathological settings, and it is noteworthy that the chromatin region containing the IL-7R gene becomes poorly accessible in exhausted CD8+ cells (Scott-Browne et al., 2016). In contrast, chromatin regions enriched for binding sites of several TFs, including RUNX, STAT, and ETS family members, became more accessible within revertant subsets. Stat1 and Stat4 signaling regulate T cell responses to interferon and cytokine signaling (Gil et al., 2006, Nguyen et al., 2002, Thierfelder et al., 1996), STAT5 is critical in maintaining effector CD8 T cell responses (Tripathi et al., 2010), and over-representation of ETS motifs in chromatin accessible regions has been observed previously in naive T cells (Moskowitz et al., 2017). As such the “epigenetic priming” of naive-memory subsets appears to reflect an increased sensitivity to interferon and cytokines within the local microenvironment but protection from terminal differentiation.
Cytokine-driven reversion of recently activated CD8+ T cells thus uncovers a novel pathway for T cell differentiation and provides a unifying hypothesis for the existence of a naive-memory pool that contains TSCM, TMNP, and TNrev populations. We also show that the chromatin structure of naive-revertant cells is substantially reorganized in comparison with the naive pool and as such they are epigenetically “primed for secondary activation. These observations will help to guide studies of fundamental mechanisms that regulate T cell differentiation and should also be of considerable value for optimal generation of naive-memory cells for adoptive T cell immunotherapy as less differentiated cells have been associated with superior engraftment, persistence, and antitumor activity (Hinrichs et al., 2011, Klebanoff et al., 2011).
Limitations of the Study
A few limitations should be considered when interpreting our data. Although we identified cells with the phenotype of TNrev cells in human tonsil, it will be of interest to assess further if these are generated directly in vivo. In addition, it will be important to pursue parallel studies within animal models to interrogate potential mechanisms of phenotypic reversion.
Methods
All methods can be found in the accompanying Transparent Methods supplemental file.
Acknowledgments
We thank Yvonne Caffrey and the staff of the NHS Cord Blood Bank, Colindale, UK, for providing CB units; Richard Brain and the staff of the Blood Donor Center, NHSBT, Birmingham, UK, for providing blood samples; and David Briggs and the staff of Cellular and Molecular Therapies, NHSBT, Birmingham, UK, for laboratory support. We thank Steve Lee for providing the construct for TCR gene transduction and Paul Murray and Eszter Nagy for providing mononuclear cells from tonsils. We also thank Peter Cockerill, Sarah Bevington, and Celina Whalley for suggestions on ATAC sequencing. We are grateful to Dr Geoff Brown for advice on the use of ATRA. RNA-seq was carried out by Edinburgh Genomics, The University of Edinburgh, Edinburgh, UK. Genomics is partly supported through core grants from NERC (R8/H10/56), MRC (MR/K001744/1), and BBSRC (BB/J004243/1). This work was supported by grants from Bloodwise (12052), MRC (MR/K021192/1, MR/N000919/1 and MC PC 15079), and NIHR UK (RP-PG-0310-10003).
Author Contributions
G.F. designed and performed experiments, interpreted the data, and wrote the paper; K.V. performed the ATAC-seq experiments and wrote the paper; W.C. analyzed microarray data and ATAC-seq data and wrote the paper; A.W. performed part of flow cytometry experiments; Z.N. analyzed microarray data; S.K. performed gene expression analysis; G.A. advised on experiments and edited the paper; P.M. and F.E.C. interpreted the data, supervised the study, and wrote the paper.
Declaration of Interests
The authors declare no competing interests.
Published: April 24, 2020
Footnotes
Supplemental Information can be found online at https://doi.org/10.1016/j.isci.2020.100989.
Contributor Information
Paul Moss, Email: p.moss@bham.ac.uk.
Frederick E. Chen, Email: frederick.chen@nhs.net.
Data and Code Availability
All relevant data are available from the authors upon request. RNA sequencing data have been deposited in Gene Expression Omnibus, accession number GSE114812.
Supplemental Information
References
- Beijer M., Molenaar R., Goversek G., Mebius R.E., Kraal G., den Haan J.M. A crucial role for retinoic acid in the development of Notch-dependent murine splenic CD8- CD4- and CD4+ dendritic cells. Eur. J. Immunol. 2013;43:1608–1616. doi: 10.1002/eji.201343325. [DOI] [PubMed] [Google Scholar]
- Blanpain C., Fuch E. Stem cell plasticity. Plasticity of epithelial stem cells in tissue regeneration. Science. 2014;344:1242281. doi: 10.1126/science.1242281. [DOI] [PMC free article] [PubMed] [Google Scholar]
- Christensen J.E., Andreasen S.O., Christensen J.P., Thomsen A.R. CD11b expression as a marker to distinguish between recently activated effector CD8+ T cells and memory cells. Int. Immunol. 2001;13:593–600. doi: 10.1093/intimm/13.4.593. [DOI] [PubMed] [Google Scholar]
- Cieri N., Camisa B., Cocchiarella F., Forcato M., Oliveira G., Provasi E., Bondanza A., Bordignon C., Peccatori J., Ciceri F. IL-7 and IL-15 instruct the generation of human memory stem T cells from naive precursors. Blood. 2013;121:573–584. doi: 10.1182/blood-2012-05-431718. [DOI] [PubMed] [Google Scholar]
- Cieri N., Oliveira G., Greco R., Forcato M., Taccioli C., Cianciotti B., Valtolina V., Noviello M., Vago L., Bondanza A. Generation of human memory stem T cells after haploidentical T-replete hematopoietic stem cell transplantation. Blood. 2015;125:2865–2874. doi: 10.1182/blood-2014-11-608539. [DOI] [PubMed] [Google Scholar]
- Cole K.E., Strick C.A., Paradis T.J., Ogborne K.T., Loetscher M., Gladue R.P., Lin W., Boyd J.G., Moser B., Wood D.E. Interferon-inducible T cell alpha chemoattractant (I-TAC): a novel non-ELR CXC chemokine with potent activity on activated T cells through selective high affinity binding to CXCR3. J. Exp. Med. 1998;187:2009–2021. doi: 10.1084/jem.187.12.2009. [DOI] [PMC free article] [PubMed] [Google Scholar]
- den Braber I., Mugwagwa T., Vrisekoop N., Westera L., Mögling R., de Boer A.B., Willems N., Schrijver E.H., Spierenburg G., Gaiser K. Maintenance of peripheral naive T cells is sustained by thymus output in mice but not humans. Immunity. 2012;36:288–297. doi: 10.1016/j.immuni.2012.02.006. [DOI] [PubMed] [Google Scholar]
- Ellefsen K., Harari A., Champagne P., Bart P.A., Sékaly R.P., Pantaleo G. Distribution and functional analysis of memory antiviral CD8 T cell responses in HIV-1 and cytomegalovirus infections. Eur. J. Immunol. 2002;32:3756–3764. doi: 10.1002/1521-4141(200212)32:12<3756::AID-IMMU3756>3.0.CO;2-E. [DOI] [PubMed] [Google Scholar]
- Frumento G., Zheng Y., Aubert G., Raeiszadeh M., Lansdorp P.M., Moss P., Lee S.P., Chen F.E. Cord blood T cells retain early differentiation phenotype suitable for immunotherapy after TCR gene transfer to confer EBV specificity. Am. J. Transpl. 2013;13:45–55. doi: 10.1111/j.1600-6143.2012.04286.x. [DOI] [PubMed] [Google Scholar]
- Gattinoni L., Lugli E., Ji Y., Pos Z., Paulos C.M., Quigley M.F., Almeida J.R., Gostick E., Yu Z., Carpenito C. A human memory T cell subset with stem cell-like properties. Nat. Med. 2011;17:1290–1297. doi: 10.1038/nm.2446. [DOI] [PMC free article] [PubMed] [Google Scholar]
- Gattinoni L., Klebanoff C.A., Restifo N.P. Paths to stemness: building the ultimate antitumour T cell. Nat. Rev. Cancer. 2012;12:671–684. doi: 10.1038/nrc3322. [DOI] [PMC free article] [PubMed] [Google Scholar]
- Gattinoni L., Speiser D.E., Lichterfeld M., Bonini C. T memory stem cells in health and disease. Nat. Med. 2017;23:18–27. doi: 10.1038/nm.4241. [DOI] [PMC free article] [PubMed] [Google Scholar]
- Gil M.P., Salomon R., Louten J., Biron C.A. Modulation of STAT1 protein levels: a mechanism shaping CD8 T-cell responses in vivo. Blood. 2006;107:987–993. doi: 10.1182/blood-2005-07-2834. [DOI] [PMC free article] [PubMed] [Google Scholar]
- Hakim F.T., Memon S.A., Cepeda R., Jones E.C., Chow C.K., Kasten-Sportes C., Odom J., Vance B.A., Christensen B.L., Mackall C.L. Age-dependent incidence, time course, and consequences of thymic renewal in adults. J. Clin. Invest. 2005;115:930–939. doi: 10.1172/JCI22492. [DOI] [PMC free article] [PubMed] [Google Scholar]
- Hendriks J., Xiao Y., Borst J. CD27 promotes survival of activated T cells and complements CD28 in generation and establishment of the effector T cell pool. J. Exp. Med. 2003;198:1369–1380. doi: 10.1084/jem.20030916. [DOI] [PMC free article] [PubMed] [Google Scholar]
- Henning A.N., Roychoudhuri R., Restifo N.P. Epigenetic control of CD8+ T cell differentiation. Nat. Rev. Immunol. 2018;18:340–356. doi: 10.1038/nri.2017.146. [DOI] [PMC free article] [PubMed] [Google Scholar]
- Hermiston M.L., Xu Z., Weiss A. CD45: a critical regulator of signaling thresholds in immune cells. Annu. Rev. Immunol. 2003;21:107–137. doi: 10.1146/annurev.immunol.21.120601.140946. [DOI] [PubMed] [Google Scholar]
- Hinrichs C.S., Borman Z.A., Gattinoni L., Yu Z., Burns W.R., Huang J., Klebanoff C.A., Johnson L.A., Kerkar S.P., Yang S. Human effector CD8+ T cells derived from naive rather than memory subsets possess superior traits for adoptive immunotherapy. Blood. 2011;117:808–814. doi: 10.1182/blood-2010-05-286286. [DOI] [PMC free article] [PubMed] [Google Scholar]
- Hong C., Luckey M.A., Park J.H. Intrathymic IL-7: the where, when, and why of IL-7 signaling during T cell development. Semin. Immunol. 2012;24:151–158. doi: 10.1016/j.smim.2012.02.002. [DOI] [PMC free article] [PubMed] [Google Scholar]
- Huang H.Y., Luther S.A. Expression and function of interleukin-7 in secondary and tertiary lymphoid organs. Semin. Immunol. 2012;24:175–189. doi: 10.1016/j.smim.2012.02.008. [DOI] [PubMed] [Google Scholar]
- Irles C., Symons A., Michel F., Bakker T.R., van der Merwe P.A., Acuto O. CD45 ectodomain controls interaction with GEMs and Lck activity for optimal TCR signaling. Nat. Immunol. 2003;4:189–197. doi: 10.1038/ni877. [DOI] [PubMed] [Google Scholar]
- Ishida Y., Agata Y., Shibahara K., Honjo T. Induced expression of PD-1, a novel member of the immunoglobulin gene superfamily, upon programmed cell death. EMBO J. 1992;11:3887–3895. doi: 10.1002/j.1460-2075.1992.tb05481.x. [DOI] [PMC free article] [PubMed] [Google Scholar]
- Kim E.Y., Priatel J.J., The S.J., The H.S. TNF receptor type 2 (p75) functions as a costimulator for antigen-driven T cell responses in vivo. J. Immunol. 2006;176:1026–1035. doi: 10.4049/jimmunol.176.2.1026. [DOI] [PubMed] [Google Scholar]
- Klebanoff C.A., Gattinoni L., Restifo N.P. CD8+ T-cell memory in tumor immunology and immunotherapy. Immunol. Rev. 2006;211:214–224. doi: 10.1111/j.0105-2896.2006.00391.x. [DOI] [PMC free article] [PubMed] [Google Scholar]
- Klebanoff C.A., Gattinoni L., Restifo N.P. Sorting through subsets: which T-cell populations mediate highly effective adoptive immunotherapy? J. Immunother. 2011;35:651–660. doi: 10.1097/CJI.0b013e31827806e6. [DOI] [PMC free article] [PubMed] [Google Scholar]
- Kondo T., Morita R., Okuzono Y., Nakatsukasa H., Sekiya T., Chikuma S., Shichita T., Kanamori M., Kubo M., Koga K. Notch-mediated conversion of activated T cells into stem cell memory-like T cells for adoptive immunotherapy. Nat. Commun. 2017;8:15338. doi: 10.1038/ncomms15338. [DOI] [PMC free article] [PubMed] [Google Scholar]
- Kondo T., Imura Y., Chikuma S., Hibino S., Omata-Mise S., Ando M., Akanuma T., Iizuka M., Sakai R., Morita R. Generation and application of human induced-stem cell memory T cells for adoptive immunotherapy. Cancer Sci. 2018;109:2130–2140. doi: 10.1111/cas.13648. [DOI] [PMC free article] [PubMed] [Google Scholar]
- Kurachi M., Barnitz R.A., Yosef N., Odorizzi P.M., Di Iorio M.A., Lemieux M.E., Yates K., Godec J., Klatt M.G., Regev A. The transcription factor BATF operates as an essential differentiation checkpoint in early effector CD8+ T cells. Nat. Immunol. 2014;15:373–383. doi: 10.1038/ni.2834. [DOI] [PMC free article] [PubMed] [Google Scholar]
- Li M., Yao D., Zeng X., Kasakovski D., Zhang Y., Chen S., Zha X., Li Y., Xu L. Age related human T cell subset evolution and senescence. Immun. Ageing. 2019;16:24. doi: 10.1186/s12979-019-0165-8. [DOI] [PMC free article] [PubMed] [Google Scholar]
- Lugli E., Dominguez M.H., Gattinoni L., Chattopadhyay P.K., Bolton D.L., Song K., Klatt N.R., Brenchley J.M., Vaccari M., Gostick E. Superior T memory stem cell persistence supports long-lived T cell memory. J. Clin. Invest. 2013;123:594–599. doi: 10.1172/JCI66327. [DOI] [PMC free article] [PubMed] [Google Scholar]
- Mackall C.L., Fry T.J., Gress R.E. Harnessing the biology of IL-7 for therapeutic application. Nat. Rev. Immunol. 2011;11:330–342. doi: 10.1038/nri2970. [DOI] [PMC free article] [PubMed] [Google Scholar]
- Mikucki M.E., Fisher D.T., Matsuzaki J., Skitzki J.J., Gaulin N.B., Muhitch J.B., Ku A.W., Frelinger J.G., Odunsi K., Gajewski T.F. Non-redundant requirement for CXCR3 signalling during tumoricidal T-cell trafficking across tumour vascular checkpoints. Nat. Commun. 2015;6:7458. doi: 10.1038/ncomms8458. [DOI] [PMC free article] [PubMed] [Google Scholar]
- Minami Y., Kono T., Miyazaki T., Taniguchi T. The IL-2 receptor complex: its structure, function, and target genes. Annu. Rev. Immunol. 1993;11:245–268. doi: 10.1146/annurev.iy.11.040193.001333. [DOI] [PubMed] [Google Scholar]
- Moskowitz D.M., Zhang D.W., Hu B., Le Saux S., Yanes R.E., Ye Z., Buenrostro J.D., Weyand C.M., Greenleaf W.J., Goronzy J.J. Epigenomics of human CD8 T cell differentiation and aging. Sci. Immunol. 2017;2:eaag0192. doi: 10.1126/sciimmunol.aag0192. [DOI] [PMC free article] [PubMed] [Google Scholar]
- Murray J.M., Kaufmann G.R., Hodgkin P.D., Lewin S.R., Kelleher A.D., Davenport M.P., Zaunders J.J. Naive T cells are maintained by thymic output in early ages but by proliferation without phenotypic change after age twenty. Immunol. Cell. Biol. 2003;81:487–495. doi: 10.1046/j.1440-1711.2003.01191.x. [DOI] [PubMed] [Google Scholar]
- Nguyen K.B., Watford W.T., Salomon R., Hofmann S.R., Pien G.C., Morinobu A., Gadina M., O'Shea J.J., Biron C.A. Critical role for STAT4 activation by type 1 interferons in the interferon-gamma response to viral infection. Science. 2002;297:2063–2066. doi: 10.1126/science.1074900. [DOI] [PubMed] [Google Scholar]
- O'Shea J.J., McVicar D.W., Bailey T.L., Burns C., Smyth M.J. Activation of human peripheral blood T lymphocytes by pharmacological induction of protein-tyrosine phosphorylation. Proc. Natl. Acad. Sci. U S A. 1992;89:10306–10310. doi: 10.1073/pnas.89.21.10306. [DOI] [PMC free article] [PubMed] [Google Scholar]
- Park J.H., Yu Q., Erman B., Appelbaum J.S., Montoya-Durango D., Grimes H.L., Singer A. Suppression of IL7Ralpha transcription by IL-7 and other prosurvival cytokines: a novel mechanism for maximizing IL-7-dependent T cell survival. Immunity. 2004;21:289–302. doi: 10.1016/j.immuni.2004.07.016. [DOI] [PubMed] [Google Scholar]
- Peperzak V., Veraar E.A., Xiao Y., Babala N., Thiadens K., Brugmans M., Borst J. CD8+ T cells produce the chemokine CXCL10 in response to CD27/CD70 costimulation to promote generation of the CD8+ effector T cell pool. J. Immunol. 2013;191:3025–3036. doi: 10.4049/jimmunol.1202222. [DOI] [PubMed] [Google Scholar]
- Pulko V., Davies J.S., Martinez C., Lanteri M.C., Busch M.P., Diamond M.S., Knox K., Bush E.C., Sims P.A., Sinari S. Human memory T cells with a naive phenotype accumulate with aging and respond to persistent viruses. Nat. Immunol. 2016;17:966–975. doi: 10.1038/ni.3483. [DOI] [PMC free article] [PubMed] [Google Scholar]
- Quigley M., Pereyra F., Nilsson B., Porichis F., Fonseca C., Eichbaum Q., Julg B., Jesneck J.L., Brosnahan K., Imam S. Transcriptional analysis of HIV-specific CD8+ T cells shows that PD-1 inhibits T cell function by upregulating BATF. Nat. Med. 2010;16:1147–1151. doi: 10.1038/nm.2232. [DOI] [PMC free article] [PubMed] [Google Scholar]
- Remmerswaal E.B., Havenith S.H., Idu M.M., van Leeuwen E.M., van Donselaar K.A., Ten Brinke A., van der Bom-Baylon N., Bemelman F.J., van Lier R.A., Ten Berge I.J. Human virus-specific effector-type T cells accumulate in blood but not in lymph nodes. Blood. 2012;119:1702–1712. doi: 10.1182/blood-2011-09-381574. [DOI] [PubMed] [Google Scholar]
- Sabatino M., Hu J., Sommariva M., Gautam S., Fellowes V., Hocker J.D., Dougherty S., Qin H., Klebanoff C.A., Fry T.J. Generation of clinical-grade CD19-specific CAR-modified CD8+ memory stem cells for the treatment of human B-cell malignancies. Blood. 2016;128:519–528. doi: 10.1182/blood-2015-11-683847. [DOI] [PMC free article] [PubMed] [Google Scholar]
- Scott-Browne J.P., López-Moyado I.F., Trifari S., Wong V., Chavez L., Rao A., Pereira R.M. Dynamic changes in chromatin accessibility occur in CD8+ T cells responding to viral infection. Immunity. 2016;45:1327–1340. doi: 10.1016/j.immuni.2016.10.028. [DOI] [PMC free article] [PubMed] [Google Scholar]
- Stange D.E., Koo B.K., Huch M., Sibbel G., Basak O., Lyubimova A., Kujala P., Bartfeld S., Koster J., Geahlen J.H. Differentiated troy(+) chief cells act as reserve stem cells to generate all lineages of the stomach epithelium. Cell. 2013;155:357–368. doi: 10.1016/j.cell.2013.09.008. [DOI] [PMC free article] [PubMed] [Google Scholar]
- Surh C.D., Sprent J. Homeostasis of naive and memory T cells. Immunity. 2008;29:848–862. doi: 10.1016/j.immuni.2008.11.002. [DOI] [PubMed] [Google Scholar]
- Tata P.R., Mou H., Pardo-Saganta A., Zhao R., Prabhu M., Law B.M., Vinarsky V., Cho J.L., Breton S., Sahay A. Dedifferentiation of committed epithelial cells into stem cells in vivo. Nature. 2013;503:218–223. doi: 10.1038/nature12777. [DOI] [PMC free article] [PubMed] [Google Scholar]
- Thierfelder W.E., van Deursen J.M., Yamamoto K., Tripp R.A., Sarawar S.R., Carson R.T., Sangster M.Y., Vignali D.A., Doherty P.C., Grosveld G.C. Requirement for Stat4 in interleukin-12-mediated responses of natural killer and T cells. Nature. 1996;382:171–174. doi: 10.1038/382171a0. [DOI] [PubMed] [Google Scholar]
- Tripathi P., Kurtulus S., Wojciechowski S., Sholl A., Hoebe K., Morris S.C., Finkelman F.D., Grimes H.L., Hildeman D.A. STAT5 is critical to maintain effector CD8+ T cell responses. J. Immunol. 2010;185:2116–2124. doi: 10.4049/jimmunol.1000842. [DOI] [PMC free article] [PubMed] [Google Scholar]
- Ucar D., Márquez E.J., Chung C.H., Marches R., Rossi R.J., Uyar A., Wu T.C., George J., Stitzel M.L., Palucka A.K. The chromatin accessibility signature of human immune aging stems from CD8+ T cells. J. Exp. Med. 2017;214:3123–3144. doi: 10.1084/jem.20170416. [DOI] [PMC free article] [PubMed] [Google Scholar]
- Vranjkovic A., Crawley A.M., Gee K., Kumar A., Angel J.B. IL-7 decreases IL-7 receptor alpha (CD127) expression and induces the shedding of CD127 by human CD8+ T cells. Int. Immunol. 2007;19:1329–1339. doi: 10.1093/intimm/dxm102. [DOI] [PubMed] [Google Scholar]
- Wherry E.J. T cell exhaustion. Nat. Immunol. 2011;12:492–499. doi: 10.1038/ni.2035. [DOI] [PubMed] [Google Scholar]
- Wherry E.J., Teichgräber V., Becker T.C., Masopust D., Kaech S.M., Antia R., von Andrian U.H., Ahmed R. Lineage relationship and protective immunity of memory CD8 T cell subsets. Nat. Immunol. 2003;4:225–234. doi: 10.1038/ni889. [DOI] [PubMed] [Google Scholar]
- Zanon V., Pilipow K., Scamardella E., De Paoli F., De Simone G., Price D.A., Martinez Usatorre A., Romero P., Mavilio D., Roberto A. Curtailed T-cell activation curbs effector differentiation and generates CD8+ T cells with a naturally-occurring memory stem cell phenotype. Eur. J. Immunol. 2017;47:1468–1476. doi: 10.1002/eji.201646732. [DOI] [PMC free article] [PubMed] [Google Scholar]
- Zehnder J.L., Hirai K., Shatsky M., McGregor J.L., Levitt L.J., Leung L.L. The cell adhesion molecule CD31 is phosphorylated after cell activation. Down-regulation of CD31 in activated T lymphocytes. J. Biol. Chem. 1992;267:5243–5249. [PubMed] [Google Scholar]
Associated Data
This section collects any data citations, data availability statements, or supplementary materials included in this article.
Supplementary Materials
Data Availability Statement
All relevant data are available from the authors upon request. RNA sequencing data have been deposited in Gene Expression Omnibus, accession number GSE114812.