

Abstract
The spike (S) protein of severe acute respiratory syndrome coronavirus (SARS-CoV) is important for vaccine development. A truncated S protein of the TW1 strain, STR2 (88 kDa), carrying three S fragments (S74–253, S294–739, and S1129–1255) was investigated to study the influences of intron and exon splicing enhancers to improve STR2 protein expression in mammalian cells. Our results showed that STR2 protein expression with the use of an 138 base-pair intron addition increased by 1.9-, 2.5-, and 4.1-fold in Vero E6, QBI-293A cells, and CHO/dhFr− cells (dihydrofolate reductase [dhfr] gene deficient CHO cells), respectively. Using the exon splicing enhancers, including a bidirectional splicing enhancer (BSE) or an exon splicing enhancer derived from the EDA alternative exon of the fibronectin gene (EDA ESE), were also found to increase STR2 protein expression in CHO/dhFr− cells by 1.7- and 2.6-fold. Nevertheless, combination of the intron and the exon splicing enhancers resulted in suppressing the intron-enhancing e STR2 protein expression in in CHO/dhFr− cells. Our studies also demonstrated the STR2 protein was mainly as the Endo H-sensitive glycoprotein (115 kDa) expressed in Vero E6, QBI-293A, and CHO/dhFr− cells. However, only a minor form of the Endo H-resistant glycoproteins (∼130 kDa) was detected in CHO/dhFr− cells. Taken together, our results indicated that intron had a better enhancing effect on STR2 protein expression than exon splicing enhancers, and the expression of ∼130 kDa STR2 glycoprotein was enhanced by the intron addition into the expression vector construct. Results of the present study can provide an optimal strategy to enhance SARS-CoV S protein expression in mammalian cells and may contribute to the development of SARS-CoV subunit vaccine.
Keywords: Mammalian cell expression, SARS-CoV, Spike protein, Intron, Exon splicing enhancers
1. Introduction
Severe acute respiratory syndrome (SARS) is an infectious viral disease that caused by a newly emerged coronavirus (SASR-CoV) [1], [2], [3]. SARS-CoV is a large RNA virus that contains four structural proteins: spike (S), membrane (M), envelope (E), and nucleocapsid (N) proteins. The S protein is responsible for receptor binding and membrane fusion, and is the most important vaccine target. The S protein can be divided into putative S1 (residues 17–680) and S2 (residues 727–1195) domain by sequence alignment [4]. S1 is presumably a globular domain that binds to ACE-2 through the receptor binding domain (residues 318–510) while S2 domain contains fusion peptide and heptad repeat motifs that mediate membrane fusion [4], [5].
The SARS-CoV S protein is a highly glycosylated protein, with 23 putative N-linked glycosylation sites [6]. The predicted size of S protein is around 139 kDa, but it is glycosylated to ∼170 kDa in ER and further processed into ∼180 kDa in Golgi complex [5]. The presence of N-linked glycans on S protein is necessary for rabbit antiserum recognition which suggested the importance of N-linked glycosylation on correct S protein structure formation [5].
The SARS-CoV S protein has been the main target for SARS-CoV vaccine development. As previously reported, intranasal or intramuscular inoculation of highly attenuated modified vaccina virus Ankara (MVA) that expressed full-length S protein could induce neutralization antibody production and elicit protective immunity in BALB/c mice [7]. Another report had indicated that recombinant attenuated parainfluenza type 3 vector that expressed S instead of E, M, and N protein could induce neutralizing antibody and provide protective immunity against SARS-CoV challenging, which suggested that S was the only significant protective antigen among all SARS-CoV structure proteins [8]. Moreover, the SARS-CoV S protein fragments: residues 318–510 (receptor-binding domain) [9], residues 485–625 [10], and residues 803–828 that fused with thioredoxin (Trx) or glutathione-S-transferase (GST) [11] were found to induce neutralizing antibody production in immunized animals. These results suggested that the S protein is an excellent vaccine target, since it could induce strong neutralization antibody response and provide protection against virus challenging in immunized animals.
In this study, the mammalian cell expression of a truncated S protein, STR2, which contains receptor binding region [9] and an exposed domain (residues 485–625) [11] that can induce neutralization antibody production was investigated. The highly glycosylated nature of S protein render mammalian cell to be a suitable expression system, since it have the advantage of carrying out complex post-translational modification. However, the recombinant protein expression level of mammalian cell is much lower than other systems, while sufficient protein production is required for vaccine development. Therefore, several different strategies for improving STR2 protein expression in mammalian cells were investigated in this report, including intron addition and the application of exon splicing enhancers.
As the intron and its splicing out was known to enhance each step of RNA metabolism, including transcription, poly(A) tail addition, mRNA exportation, translation, and translated protein stability [12], hence we first studied the intron-enhancing effect on STR2 protein expression. On the other hand, the exon splicing enhancers (ESEs) are known to be specific binding sequences for Serine/Arginine-rich proteins (SR proteins) that relate to the control of alternative splicing [13]. It has been demonstrated that some SR proteins, after binding to ESE, could assist the exportation of attached mRNA [14], [15] or enhance mRNA translation [16]. Two ESEs, bidirectional splicing enhancer [17] and the ESE of fibronectin EDA exon (EDA ESE) [18], were selected, and analyzed for their influence on STR2 protein expression. Results of the present study can provide an optimal strategy to enhance SARS-CoV S protein expression in mammalian cells and may contribute to the development of SARS-CoV subunit vaccine.
2. Materials and methods
2.1. Cell lines and media
QBI-293A cells (QIAGEN) were grown in minimum essential medium (MEM) (Invitrogen) supplemented with 10% horse serum (Invitrogen). Vero E6 cells (ATCC CRL-1586) were grown in MEM supplemented with 10% fetal bovine serum (FBS) (Invitrogen). CHO/dhFr− (dhfr deficient) cells (ATCC CRL-9096) were maintained in minimum essential medium alpha medium (MEMα) with ribonucleosides and deoxyribonucleosides (Invitrogen), supplemented with 10% FBS. All growth mediums were supplemented with 100 units/ml penicillin/streptomycin (P/S). Cell lines were routinely maintained at 37 °C with 5% CO2.
2.2. Expression vectors construction
Three PCR obtained fragments of SARS-CoV TW1 S gene: D1 (nucleotide 220–699), D2 (nucleotide 880–2216), TM (nucleotide 3385–3765) were ligated into pcDNA4/TO/MycHisA (Invitrogen) by BamHI/EcoR1 (D1), EcoRI/HindIII (D2), and HindIII/NotI (TM) restriction enzyme sites to generate pSΔS Both D2 and TM PCR fragments were preceded by GGGGGCGGGGGTGGAGGTGGTGGC, which could be translated into eight glycine residues within STR2 protein. Igκ-chain leader sequence obtained from PCR using pSecTag A as template was also ligated into pSΔS by Aflll and BamHI sites to generate pS.
The 138 bp intron of pIRES (Clontech) that obtained (bases 887–1024) by PCR amplification with primers IVS-f: GCTTAAGCAGGTAAGTATCAAGGTTA CAAG and IVS-r: GGGTACCACCTGTGGAGAGAAAGGCAAAGT was inserted into pS by Aflll and KpnI sites to generate pIS. Two DNA fragments containing Igκ leader sequence following by bidirectional splicing enhancer (BSE) (GACGACGAGGATGAAGAG) (Igκ-BSE) or EDA ESE (GAAGAAGAC) (Igκ-EDA) was obtained by PCR using SIG-f, GGGTACCGCCACCATGGAGACAGACAC as forward primer, and SIG-BSE-r, GGGATCCCTCTTCATCCTCGTCGTCGTCACCAGTGGAACCTGGAA or SIG-EDA-r, GGGATCCGTCTTCTTCGTCACCAGTGGAACCTGGAA as reverse primers. Igκ-BSE and Igκ-EDA were ligated into pS or pIS by KpnI and BamHI sites, and plasmids pSBS, pSES, pISBS, pISES which contain BSE or EDA ESE in the open reading frame of STR2 were generated.
Constructs with EDA ESE placed in the 5′-UTR of STR2 was also generated. Three DNA fragments with the sequence of EDA ESE added either in front, after, or at both side of intron were obtained by PCR amplification by different combination of following primers: EDA-IVS-f: GCTTAAGGAAGAAGACCAGGTAAGTATCAAGGTTACAAG; EDA-IVS-r: GGGTACCGTCTTCTTCACCTGTGGAGAGAAAGGCAAAGT, IVS-f and IVS-r. The three DNA fragments were ligated into the 5′-UTR of STR2 in pS by Aflll and KpnI to generate pEIS, pIES, and pEIES. PCR fragment with Igκ leader sequence proceeding with EDA ESE sequence (EDA-Igκ) was also obtained by PCR using EDA-SIG-f: GCTTAAGGAAGAAGACGCCACCATGGAGACA GACAC and SIG-r: GGGATCCGTCACCAGTGGAAC as primers. The DNA fragment EDA-Igκ was ligated into pS by Aflll and BamHI sites to generate pES.
2.3. Transient expression in mammalian cells
For transient expression experiments, CHO/dhFr−, VeroE6, and QBI-293A cells was transfected by ExGen 500 in vitro transfection reagent (Fermentas). Following the manufacturer's instructions, 3 μg DNA was used for cells that had been grown to 70–80% confluency in six-well plate. After 48 h, the cells were harvested and analyzed by SDS-PAGE and Western blot.
2.4. Western blot analysis
After separating on SDS-polyacrylamide gel (8 or 10%), proteins were electroblotted onto a nitrocellulose membrane (Millipore). R8-AE01, rabbit serum raised against SARS-CoV S, M, and E peptides, was used as primary antibody (1:1000 dilution). The alkaline phosphatase-conjugated AffiniPure Goat Anti-Rabbit IgG (Jackson ImmunoResearch) (1:5000 dilution) was used as secondary antibody in the detection.
2.5. Real-time reverse transcription-polymerase chain reaction (RT-PCR)
Total RNA extraction from transfected cells was performed using Trizol reagent (Invitrogen) according to the manufacturer's instructions. First strand cDNA was synthesized by Oligo(dT) primers and Superscript II RT (Invitrogen). Real time RT-PCR was conducted by using SYBR Green (Applied Biosystem) analysis where 200 ng cDNA of each sample was used as template. The transcripts containing region I (nucleotides 70–293) and region II (nucleotides 955–1178) in STR2 gene were monitored for quantitative comparison through real-time RT-PCR. The primers used for regions I and II analysis were s1-forward: GCCACCATGCATACGTTTGG; s1-reverse: CCCATGGGTTTAGAAACAGC; s2-forward: TTCATGGGTTGTGTCCTTGC; and s2-reverse: CCAATGCCAGTAGTGGTGTA. The primers for β-actin, the internal control used in real-time RT-PCR analysis, were b-forward: GTTTGAGACCTTCAACACCCCA and b-reverse: TGCCAATGGTGATGACCTGGC. The real-time RT-PCR analysis was performed on an ABI PRISM 7700 sequence detection system and the quantification of relative RNA amount was calculated by the ΔΔCt method. Each sample was analyzed in triplicates and the level of total RNA transcript was normalized to the β-actin control.
2.6. In vivo RNA stability
CHO/dhFr− cells were transfected with 1 μg pS and pIS vectors per 6 × 10⁴ cells. Actinomycin D (100 μg/mL final, Calbiochem) was added to the medium 48 h post-transfection. At each specified time, the total RNA was extracted using Trizol reagent and analyzed by real-time RT-PCR as described above.
2.7. Transcriptional elongation rate
Elongation rate of transcription was determined by using HeLaScribe nuclear extract in vitro transcription system (Promega). The in vitro reaction was initiated by adding ribonucleotides and terminated using Stop Solution according to the manufacturer's instructions. And then, total RNA was extracted with phenol:chloroform:isoamyl alcohol (25:24:1) and reverse transcribed as cDNA using specific reverse primers for region I and region II, and analyzed by real-time PCR. The amounts of RNA transcript containing region I or region II separately detected by real-time RT-PCR with respect to time were plotted as the transcription curves. The time difference of the initial appearance of RNA between region I and region II was obtained from the transcription curves. The elongate rate (nucleotide/s) was calculated as the number of the time difference of the initial appearance of RNA divided by the nucleotide distance between region I and region II.
2.8. PNGase F and Endo H digestion
The cell lysates were diluted in 0.5% SDS and 1% β-mercaptoethanol and denatured at 100 °C for 10 min. PNGase F (New England BioLab) digestion was carried out in 50 mM sodium phosphate (pH 7.5), 1% NP-40 at 37 °C for 1 h. Endo H digestion (New England BioLab) was performed in 50 mM sodium citrate (pH 5.5) at 37 °C for 1 h. Enzyme treated samples were analyzed by 8% SDS-PAGE and Western blotting.
3. Results
3.1. Construction and expression of SARS-CoV SFL and STR2 in mammalian cells
Three different constructs of SARS-CoV TW1 strain S protein were expressed in CHO cells: (i) the full-length cDNA (SFL; pSFL) and (ii) the cDNA of a longer truncated form (STR1, pLS) (iii) the cDNA of a shorter truncated form (STR2, pS) (Fig. 1 ). The STR1 construct contains four S protein fragments: D1 (S74–253), D2 (S294–739), D3 (S713–1113), and TM (S1129–1255) while STR2 construct lacks of D3 fragment. The results showed that STR2 instead of SFL and STR1 could be expressed in CHO/dhFr− cells, the STR2 protein was recognized by rabbit anti-SARS-CoV polycolonal serum (R8-AE01), giving a protein band around 115 kDa in Western blots (Fig. 2 ).
Fig. 1.

Construction of pSFL and pS vectors. SFL consisted of full length spike protein with C′-terminal HSV and His tag for antibody recognition. STR2 started with an Igκ signal sequence that was followed by three S protein fragments D1, D2, and TM.
Fig. 2.

Western blot analysis of the expression of SFL and STR2 protein in CHO/dhFr− cells. SFL and STR2 containing vectors were transient transfected into CHO/dhFr− cell. No SFL expression could be detected while a strong ∼110 kDa band could be observed in the cell lysate of STR2 transfected cell.
3.2. The effects of intron addition on STR2 expression
In order to investigate the influence of intron addition on STR2 expression in mammalian cells, pIS was constructed by adding an 138 bp intron in the 5′-UTR of STR2 (Fig. 3A), and both pS and pIS were transient transfected into three mammalian cell lines: CHO/dhFr− cells, Vero E6 cells, and 293 cells (Fig. 3B). Cell lines transfected with pIS construct had higher STR2 expression than those transfected with pS construct (Fig. 3B). The intensity of intron enhancing effect in the three cell lines was about 4.1-, 1.9-, and 2.5-fold in CHO/dhFr− cells, Vero E6 cells, and QBI-293A cells, respectively (Fig. 3C). STR2 was mainly expressed as ∼115 kDa protein in the three cell lines (Fig. 3B). However, a weak ∼130 kDa band could also be observed in CHO/dhFr− cells that transfected with pIS (Fig. 3B).
Fig. 3.
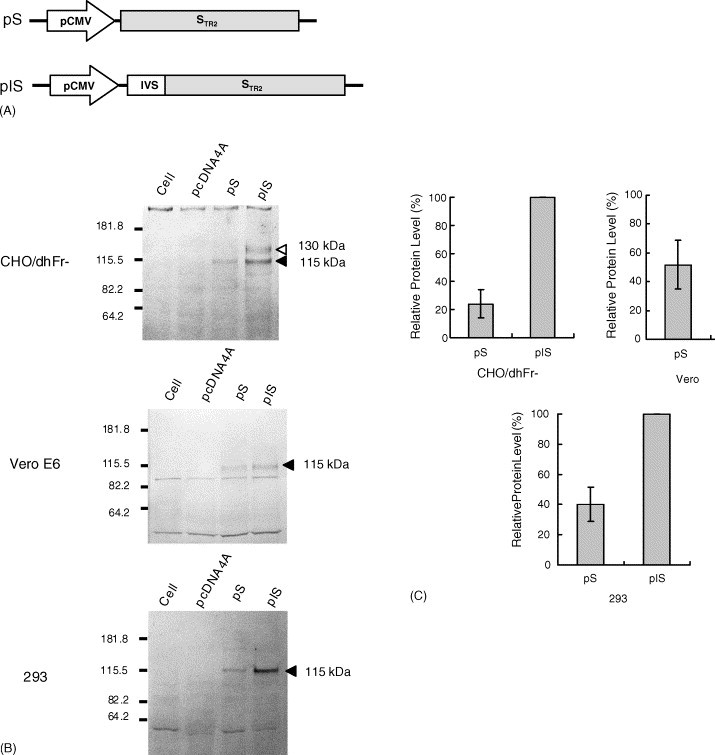
The influence of intron addition on STR2 protein expression. (A) The 138 bp intron obtained from pIRES was inserted into pS vector within the 5′-UTR of STR2 gene to generate pIS. (B) Western blot analysis of STR2 protein expression in pS and pIS transient transfected cell lysate. (C) GelPro 3.0 quantification result of ∼115 kDa band on Western blot result.
To further investigate the intron-dependent enhancement in STR2 expression, total RNA transcript, in vivo RNA stability, and the RNA elongation rate were measured for the intron-containing (pIS) and non-intron containing (pS) constructs. Total RNA transcripts obtained from the pIS-transfected CHO/dhFr− cells were 30% higher than that from the pS-transfected CHO/dhFr− cells (Fig. 4A). Therefore, the intron-dependent STR2 expression in mammalian cells correlated with a higher level of RNA transcript accumulation in vivo. To further investigate the mechanism(s) of how the intron possess the ability to enhance RNA transcript accumulation, we further measured the in vivo RNA stability between the pIS-transfected and pS-transfected CHO/dhFr− cells. After treating with actinomycin D, the total RNA transcripts were extracted at each specified time to measure RNA decay quantified by real-time RT-PCR analysis. The results indicated that the RNA transcripts obtained from pIS-tranfected CHO/dhFr− cells as compared to that from pS-tranfected CHO/dhFr− cells exhibited similar rates for RNA decay (Fig. 4B). These two RNA transcripts exhibited half-lives of ∼7 h. Furthermore, the difference of the initial appearance time between region I and region II for the intron-containing construct was 28.3 s (41.7 s for region II and 13.4 s for region I) (pIS construct in Fig. 4C). The difference of the initial appearance time between region I and region II for pS construct was 31.3 s (36.2 s for region II and 4.9 s for region I) (Fig. 4C). The corresponding RNA elongation rate, as calculated as the difference of initial appearance time divided by the nucleotide distance (885 nucleotide residues between region I and region II), was 31.3 nucleotide/s for the intron-containing construct and 28.3 nucleotide/s for the intronless construct. Therefore, a higher elongation rate was observed for the intron-containing construct, indicating that a higher RNA elongation rate accounts for, or at least in parts, the increased RNA transcript accumulation for the intron-dependent STR2 protein expression in mammalian cells.
Fig. 4.

The influence of intron on RNA transcript. (A) Quantification of total RNA levels from CHO/dhFr− cells transfected by pS and pIS vectors. The amounts of RNA transcript of STR2 were normalized to β-actin RNA and the averages of three independent experiments were plotted; error bars represent standard deviation. (B) Time course for STR2 RNA decay in CHO/dhFr− cells transfected by pS and pIS vectors in the presence of actinomycin D. Data presented in percentage of the total STR2 RNA. (C) Transcription curves of pIS and pS vectors using HeLa cell extract transcription system.
3.3. The effects of exon splicing enhancer addition on STR2 expression
The enhancing effects of two chosen exon splicing enhancers, EDA ESE and BSE, on the mammalian cell expression of STR2 protein were investigated. Either EDA ESE or BSE was first inserted into the open reading frame of STR2 gene, right behind the Igκ signal sequence (pSBS and pSES). A 138 bp intron was further added in the 5′-UTR of STR2 to generate pISBS and pISES (Fig. 5A). Expression vectors of pS, pIS, pSBS, pSES, pISBS, and pISES were transfected into CHO/dhFr− cell and the expression of STR2 proteins were analyzed by Western blotting (Fig. 5B). The results indicated that BSE or EDA ESE alone was able to enhance STR2 protein expression without the use of intron. The enhancing effect of EDA ESE was 1.5-fold better than BSE as quantified on the relative intensity of ∼115 kDa protein band (Fig. 5C). However, when either BSE or EDA ESE was coupling with an intron (pISBS and pISES), the STR2 expression levels were slightly lower than pIS (Fig. 5C). Approximately 38% (pISBS) and 27% (pISES) reduction in STR2 expression was observed when compared to the construct only containing the 138 bp intron (pIS) (Fig. 5C). Therefore, BSE and EDA ESE could not work with the 138 bp intron to enhance STR2 expression.
Fig. 5.

The influence of ESE on STR2 protein expression. (A) Construction of pSBS, pSES, pISBS, and pISES vectors. (B) Both pSBS and pSES vectors have higher STR2 expression than pS while pISBS and pISES have lower STR2 expression than pIS. (C) GelPro 3.0 quantification result of ∼115 kDa band on Western blot result.
To further investigate whether the combination of intron and ESE may work differently as ESE located in 5′-UTR instead of ORF, EDA ESE was added either in front (pEIS), after (pIES), or on both sides of the 138 bp intron (pEIES) in 5′-UTR of STR2 (Fig. 6A). At the mean time, a plasmid with only EDA ESE placed in the 5′-UTR of STR2 (pES) was used as a control (Fig. 6A). Expression vectors of pS, pIS, pEIS, pIES, pEIES, and pES were transient transfected into CHO/dhFr− cells, and the STR2 protein expression efficiency of each construct was determined by Western blot analysis (Fig. 6B).
Fig. 6.

The influence of 5′-UTR EDA ESE on STR2 protein expression. (A) Construction of, pEIES, pEIS, pIES, and pES expression vectors. (B) Cells transfected with pES have higher STR2 expression level when compared with pS, whereas neither pEIS, pIES, or pEIES have higher STR2 protein level than pIS. (C) GelPro 3.0 quantification result of ∼115 kDa band on Western blot result.
Similar to the result of inserting EDA ESE in the STR2 open reading frame, EDA ESE sequence alone (pES) resulted in ∼2.8-fold increase in 115 kDa STR2 expression as compared to pS (Fig. 6B and C). However, the ∼115 kDa STR2 expression by pEIS, pIES, and pEIES were approximately 30%, 25%, and 40% lower than pIS (Fig. 6C). The results suggested that neither of these constructs with ESE have better enhancing effect in than STR2 protein expression than adding intron alone.
3.4. The glycosylation pattern of STR2 within CHO/dhFr− cells
The predicted molecular weight of STR2 was 88.56 kDa, however, when pIS was transient transfected into CHO/dhFr− cells, the major expressed STR2 was at molecular weight around ∼115 kDa, whereas minor amount of ∼130 kDa STR2 glycoproteins could also be detected (Fig. 7 ). Since the STR2 protein sequence contains 15 putative N-link glycosylation sites, the increase in STR2 protein molecular weight might result from the addition of N-glycan during post-translational modification processes. In order to biochemically demonstrate the glycosylation pattern of STR2 expressed in CHO cells, peptide N-glycosidase F (PNGase F) and Endo H treatment were used for the following investigation. When pIS transfected cell lysate was treated with PNGase F, both ∼115 and ∼130 kDa bands were digested into a single ∼88 kDa band, which represented the predicted unglycosylated molecular weight of STR2 protein (Fig. 7). This indicated that the ∼115 and ∼130 kDa proteins were indeed glycoproteins. Additionally, when the pIS transfected cell lysate was digested with Endo H, the ∼115 kDa band was disappeared while the ∼130 kDa band remain unaffected (Fig. 7). Therefore, STR2 was mainly expressed as Endo H-sensitive form (∼110 kDa) while a minor part of Endo H-resistant form could also be produced.
Fig. 7.

The N-linked glycosylation pattern of STR2 protein. (A) The glycosylation pattern of STR2 protein in pIS transient transfected cells. The major ∼115 kDa band was Endo H-sensitive while the minor ∼130 kDa was Endo H-resistant. (B) PNGase F and Endo H digestion of STR2 protein that produced in stable cell clones.
4. Discussion
Although the S gene of SARS-CoV contains no introns, the expression of its truncated form, STR2, in mammalian cells was greatly enhanced by the intron addition (Fig. 3B and C). This finding consists with a previous report, which stated that the expression of naturally intronless gene, such as c-jun, could be enhanced by intron addition [19]. Intron and its spliced out processes are highly related to every step of RNA metabolism: transcription, poly(A) tail addition, mRNA translocation into cytoplasm, and translation, and intron works to improve each above-mentioned step [12]. We discovered that, no matter it was CHO/dhFr− cells, Vero E6 cells, or 293 cells, an 138 bp intron from pIRES vector could significantly improve STR2 expression. However, the intensity of intron enhancing effect on STR2 expression was different, 4.1-fold increase of ∼115 kDa STR2 expression can be observed in CHO/dhFr− cells, 1.9-fold in Vero E6 cells, and 2.5-fold in 293 cells (Fig. 3C). Similar result was reported that the intensity of intron enhancing effect on CAT gene expression is quite diverse in different cell lines [19].
The intron-dependent enhancement of STR2 protein expression in CHO/dhFr− cells was further investigated by measuring total RNA level, in vivo RNA stability, and RNA elongation rate in this study. The results indicated that the intron-dependent STR2 protein expression in mammalian cells correlated with a higher level of total RNA accumulation as determined by quantitative RT-PCR (Fig. 4A). The increased RNA levels by the intron-containing construct is not due to the in vivo RNA stability (Fig. 4B) but from the increase of RNA elongation rate (Fig. 4C). Although other mechanisms may also account for the increased RNA transcript by intron addition such as pre-mRNA or mature mRNA stabilization, poly(A) tail addition, nucleocytoplasmic translocation, translation efficiency [12], our present study has demonstrated that the increase of RNA elongation rate accounted for, or at least in parts, the intron-dependent STR2 protein expression in mammalian cells.
Notably, the used of an intron could result in the production of a higher glycosylated STR2 (∼130 kDa) protein in CHO/dhFr− but not in 293 or Vero E6 cells (Fig. 3B). It might be that intron did not directly lead to the formation of ∼130 kDa STR2 protein, instead, higher STR2 protein production in CHO/dhFr− cell might spontaneously leads to the production of ∼130 kDa STR2 protein. The higher ∼130 kDa STR2 protein expression efficiency in CHO/dhFr− cells among others might result from the difference in endoplasmic reticulum quality control strictness in the three cell lines.
When exon splicing enhancers (ESE), such as BSE or EDA ESE, was placed right behind the Igκ signal sequence of STR2, the results showed 1.7-fold (BSE) or 2.6-fold (EDA ESE) increase of STR2 expression (Fig. 5C). When the position of EDA ESE was changed into the 5′-UTR of STR2 gene, 2.8-fold increase of STR2 expression can be observed (Fig. 6C). The EDA ESE was reported to increase luciferase expression by 3.7-fold through its interaction with SF2/ASF, a shuttling SR protein that capable of recruiting ribosome to mRNA [16]. It was also reported that the shuttling SR proteins, such as SF2/ASF, act as transportation adaptors and assist mRNA exportation into cytoplasm by interacting with TAP/NXF1 protein [15]. Both BSE and EDA ESE were reported to interact with shuttling SR proteins such as 9G8 and SF2/ASF, and the interaction might lead to the observed STR2 protein expression enhancing effect [17], [20]. Better STR2 protein expression enhancing efficiency of EDA ESE (2.6-fold) than BSE (1.7-fold) was observed (Fig. 5C). It is possible that the different enhancing ability of EDA ESE and BSE is due to the different binding preference to different SR proteins, such as 9G8, SF2/ASF, and SC35, of the two sequences.
The result indicated that although BSE and EDA ESE themselves had enhancing effect, the STR2 expression vector coupling BSE or EDA ESE with an intron resulted in reduced STR2 expression compared to the construct with intron alone. The suppression of intron enhancing effect was unaffected by the position of EDA ESE, in ORF or 5′-UTR of STR2 gene. Since the presence of BSE in adenovirus E1 A mRNA was found to activate the usage of a weak 3′ splice site [17]. Other ESEs such as drosophila doublesex (dsx) repeat element (dsxRE) was also reported to activate the recognition of a weak, sex-specific 3′-splice site [21]. Therefore, it was possible that the presence of BSE or EDA ESE might activate certain cryptic splice sites within STR2 sequence, and therefore resulted in reduced STR2 expression due to aberrant splicing.
The STR2 protein, with 15 putative N-linked glycosylation sites in its sequence, is a highly glycosylated protein. The majority of mammalian cell expressed STR2 protein has molecular weight around 115 kDa, and the ∼115 kDa glycoproteins were sensitive to Endo H treatment (Fig. 7). Surprisingly, a minor band represented ∼130 kDa glycoprotein, which was found to be resistant to Endo H treatment, was also detected in CHO/dhFr− cells while transient transfection of intron containing construct, indicating a different N-glycan pattern that favor Golgi complex processing (Fig. 7). The main question is why did the major glycosylation form of STR2 protein lie in ∼115 kDa instead of ∼130 kDa? One of the possible answers might be the extensive quality control process of nascent protein in ER [22]. Enzyme or chaperones in ER would recognize the properties of non-native protein, such as abnormal exposure of hydrophobic regions, unpaired cysteine residues, and the tendency of aggregation, and result in the ER retention of a given protein[22]. Although the truncated nature of STR2 renders it easily expressed than its full-length counterpart, linking different S protein fragment together might result in the disruption of nature structure or creation of new structures that cannot be approved by ER quality control system.
Nevertheless, discovering of Endo H-resistant STR2 suggested that it is possible to improve STR2 glycosylation into more complex state. It has been reported that lowering the temperature during protein production can increase correct folding and secretion [23]. Furthermore, small molecular chemical chaperons have been discovered, such as glycerol, dimethylsulphoxide and trimethylamine N-oxide [24], [25], which can carry out nonspecific, folding-promoting effect by stabilize native or native-like structure and preventing protein aggregation [22]. It will be quite interesting to know whether those molecules are able to increase glycosylation complexity of STR2 proteins that produced by amplified cell clones. Moreover, culture conditions such as the availability of glucose and glutamine [26], [27], the concentration of ammonia [28], the supply of oxygen [29], and the percentage of serum [30] can also affect the complexity of attached N-linked glycans on produced recombinant proteins. Therefore, optimization of the culture condition for stable CHO cell clones can also be carried out to improve the production of fully glycosylated STR2 proteins.
The STR2 protein contains receptor binding region and residue 485–625 of SARS-CoV S protein that was know to induce neutralizing antibody production in experimental animals, and is therefore an appropriate vaccine candidate. This study provides several possible ways for improving truncated S protein, STR2, production in mammalian cell and may contribute to the development of successful mammalian cell based recombinant SARS-CoV vaccine.
Acknowledgments
This work was supported by the National Science Council grant NSC94-2214-E-007-014 and the National Health Research Institutes, Taiwan.
References
- 1.Drosten C., Gunther S., Preiser W., van der Werf S., Brodt H.R., Becker S. Identification of a novel coronavirus in patients with severe acute respiratory syndrome. N Engl J Med. 2003;348(20):1967–1976. doi: 10.1056/NEJMoa030747. [DOI] [PubMed] [Google Scholar]
- 2.Ksiazek T.G., Erdman D., Goldsmith C.S., Zaki S.R., Peret T., Emery S. A novel coronavirus associated with severe acute respiratory syndrome. N Engl J Med. 2003;348(20):1953–1966. doi: 10.1056/NEJMoa030781. [DOI] [PubMed] [Google Scholar]
- 3.Peiris J.S., Lai S.T., Poon L.L., Guan Y., Yam L.Y., Lim W. Coronavirus as a possible cause of severe acute respiratory syndrome. Lancet. 2003;361(9366):1319–1325. doi: 10.1016/S0140-6736(03)13077-2. [DOI] [PMC free article] [PubMed] [Google Scholar]
- 4.Spiga O., Bernini A., Ciutti A., Chiellini S., Menciassi N., Finetti F. Molecular modelling of S1 and S2 subunits of SARS coronavirus spike glycoprotein. Biochem Biophys Res Commun. 2003;310(1):78–83. doi: 10.1016/j.bbrc.2003.08.122. [DOI] [PMC free article] [PubMed] [Google Scholar]
- 5.Song H.C., Seo M.Y., Stadler K., Yoo B.J., Choo Q.L., Coates S.R. Synthesis and characterization of a native, oligomeric form of recombinant severe acute respiratory syndrome coronavirus spike glycoprotein. J Virol. 2004;78(19):10328–10335. doi: 10.1128/JVI.78.19.10328-10335.2004. [DOI] [PMC free article] [PubMed] [Google Scholar]
- 6.Rota P.A., Oberste M.S., Monroe S.S., Nix W.A., Campagnoli R., Icenogle J.P. Characterization of a novel coronavirus associated with severe acute respiratory syndrome. Science. 2003;300(5624):1394–1399. doi: 10.1126/science.1085952. [DOI] [PubMed] [Google Scholar]
- 7.Bisht H., Roberts A., Vogel L., Bukreyev A., Collins P.L., Murphy B.R. Severe acute respiratory syndrome coronavirus spike protein expressed by attenuated vaccinia virus protectively immunizes mice. Proc Natl Acad Sci USA. 2004;101(17):6641–6646. doi: 10.1073/pnas.0401939101. [DOI] [PMC free article] [PubMed] [Google Scholar]
- 8.Buchholz U.J., Bukreyev A., Yang L., Lamirande E.W., Murphy B.R., Subbarao K. Contributions of the structural proteins of severe acute respiratory syndrome coronavirus to protective immunity. Proc Natl Acad Sci USA. 2004;101(26):9804–9809. doi: 10.1073/pnas.0403492101. [DOI] [PMC free article] [PubMed] [Google Scholar]
- 9.He Y., Zhou Y., Liu S., Kou Z., Li W., Farzan M. Receptor-binding domain of SARS-CoV spike protein induces highly potent neutralizing antibodies: implication for developing subunit vaccine. Biochem Biophys Res Commun. 2004;324(2):773–781. doi: 10.1016/j.bbrc.2004.09.106. [DOI] [PMC free article] [PubMed] [Google Scholar]
- 10.Zhou T., Wang H., Luo D., Rowe T., Wang Z., Hogan R.J. An exposed domain in the severe acute respiratory syndrome coronavirus spike protein induces neutralizing antibodies. J Virol. 2004;78(13):7217–7226. doi: 10.1128/JVI.78.13.7217-7226.2004. [DOI] [PMC free article] [PubMed] [Google Scholar]
- 11.Zhang H., Wang G., Li J., Nie Y., Shi X., Lian G. Identification of an antigenic determinant on the S2 domain of the severe acute respiratory syndrome coronavirus spike glycoprotein capable of inducing neutralizing antibodies. J Virol. 2004;78(13):6938–6945. doi: 10.1128/JVI.78.13.6938-6945.2004. [DOI] [PMC free article] [PubMed] [Google Scholar]
- 12.Le Hir H., Nott A., Moore M.J. How introns influence and enhance eukaryotic gene expression. Trends Biochem Sci. 2003;28(4):215–220. doi: 10.1016/S0968-0004(03)00052-5. [DOI] [PubMed] [Google Scholar]
- 13.Cartegni L., Chew S.L., Krainer A.R. Listening to silence and understanding nonsense: exonic mutations that affect splicing. Nat Rev Genet. 2002;3(4):285–298. doi: 10.1038/nrg775. [DOI] [PubMed] [Google Scholar]
- 14.Huang Y., Steitz J.A. Splicing factors SRp20 and 9G8 promote the nucleocytoplasmic export of mRNA. Mol Cell. 2001;7(4):899–905. doi: 10.1016/s1097-2765(01)00233-7. [DOI] [PubMed] [Google Scholar]
- 15.Huang Y., Gattoni R., Stevenin J., Steitz J.A. SR splicing factors serve as adapter proteins for TAP-dependent mRNA export. Mol Cell. 2003;11(3):837–843. doi: 10.1016/s1097-2765(03)00089-3. [DOI] [PubMed] [Google Scholar]
- 16.Sanford J.R., Gray N.K., Beckmann K., Caceres J.F. A novel role for shuttling SR proteins in mRNA translation. Genes Dev. 2004;18(7):755–768. doi: 10.1101/gad.286404. [DOI] [PMC free article] [PubMed] [Google Scholar]
- 17.Bourgeois C.F., Popielarz M., Hildwein G., Stevenin J. Identification of a bidirectional splicing enhancer: differential involvement of SR proteins in 5′ or 3′ splice site activation. Mol Cell Biol. 1999;19(11):7347–7356. doi: 10.1128/mcb.19.11.7347. [DOI] [PMC free article] [PubMed] [Google Scholar]
- 18.Caputi M., Casari G., Guenzi S., Tagliabue R., Sidoli A., Melo C.A. A novel bipartite splicing enhancer modulates the differential processing of the human fibronectin EDA exon. Nucleic Acids Res. 1994;22(6):1018–1022. doi: 10.1093/nar/22.6.1018. [DOI] [PMC free article] [PubMed] [Google Scholar]
- 19.Lu S., Cullen B.R. Analysis of the stimulatory effect of splicing on mRNA production and utilization in mammalian cells. RNA. 2003;9(5):618–630. doi: 10.1261/rna.5260303. [DOI] [PMC free article] [PubMed] [Google Scholar]
- 20.Cramer P., Caceres J.F., Cazalla D., Kadener S., Muro A.F., Baralle F.E. Coupling of transcription with alternative splicing: RNA pol II promoters modulate SF2/ASF and 9G8 effects on an exonic splicing enhancer. Mol Cell. 1999;4(2):251–258. doi: 10.1016/s1097-2765(00)80372-x. [DOI] [PubMed] [Google Scholar]
- 21.Inoue K., Hoshijima K., Higuchi I., Sakamoto H., Shimura Y. Binding of the Drosophila transformer and transformer-2 proteins to the regulatory elements of doublesex primary transcript for sex-specific RNA processing. Proc Natl Acad Sci USA. 1992;89(17):8092–8096. doi: 10.1073/pnas.89.17.8092. [DOI] [PMC free article] [PubMed] [Google Scholar]
- 22.Ellgaard L., Helenius A. Quality control in the endoplasmic reticulum. Nat Rev Mol Cell Biol. 2003;4(3):181–191. doi: 10.1038/nrm1052. [DOI] [PubMed] [Google Scholar]
- 23.Denning G.M., Anderson M.P., Amara J.F., Marshall J., Smith A.E., Welsh M.J. Processing of mutant cystic fibrosis transmembrane conductance regulator is temperature-sensitive. Nature. 1992;358(6389):761–764. doi: 10.1038/358761a0. [DOI] [PubMed] [Google Scholar]
- 24.Brown C.R., Hong-Brown L.Q., Biwersi J., Verkman A.S., Welch W.J. Chemical chaperones correct the mutant phenotype of the delta F508 cystic fibrosis transmembrane conductance regulator protein. Cell Stress Chaperones. 1996;1(2):117–125. doi: 10.1379/1466-1268(1996)001<0117:ccctmp>2.3.co;2. [DOI] [PMC free article] [PubMed] [Google Scholar]
- 25.Sato S., Ward C.L., Krouse M.E., Wine J.J., Kopito R.R. Glycerol reverses the misfolding phenotype of the most common cystic fibrosis mutation. J Biol Chem. 1996;271(2):635–638. doi: 10.1074/jbc.271.2.635. [DOI] [PubMed] [Google Scholar]
- 26.Chapman A.E., Calhoun J.Ct. Effects of glucose starvation and puromycin treatment on lipid-linked oligosaccharide precursors and biosynthetic enzymes in Chinese hamster ovary cells in vivo and in vitro. Arch Biochem Biophys. 1988;260(1):320–333. doi: 10.1016/0003-9861(88)90456-0. [DOI] [PubMed] [Google Scholar]
- 27.Nyberg G.B., Balcarcel R.R., Follstad B.D., Stephanopoulos G., Wang D.I. Metabolic effects on recombinant interferon-gamma glycosylation in continuous culture of Chinese hamster ovary cells. Biotechnol Bioeng. 1999;62(3):336–347. doi: 10.1002/(sici)1097-0290(19990205)62:3<336::aid-bit10>3.0.co;2-n. [DOI] [PubMed] [Google Scholar]
- 28.Yang M., Butler M. Effects of ammonia and glucosamine on the heterogeneity of erythropoietin glycoforms. Biotechnol Prog. 2002;18(1):129–138. doi: 10.1021/bp0101334. [DOI] [PubMed] [Google Scholar]
- 29.Kunkel J.P., Jan D.C., Jamieson J.C., Butler M. Dissolved oxygen concentration in serum-free continuous culture affects N-linked glycosylation of a monoclonal antibody. J Biotechnol. 1998;62(1):55–71. doi: 10.1016/s0168-1656(98)00044-3. [DOI] [PubMed] [Google Scholar]
- 30.Gawlitzek M., Valley U., Nimtz M., Wagner R., Conradt H.S. Characterization of changes in the glycosylation pattern of recombinant proteins from BHK-21 cells due to different culture conditions. J Biotechnol. 1995;42(2):117–131. doi: 10.1016/0168-1656(95)00065-x. [DOI] [PubMed] [Google Scholar]