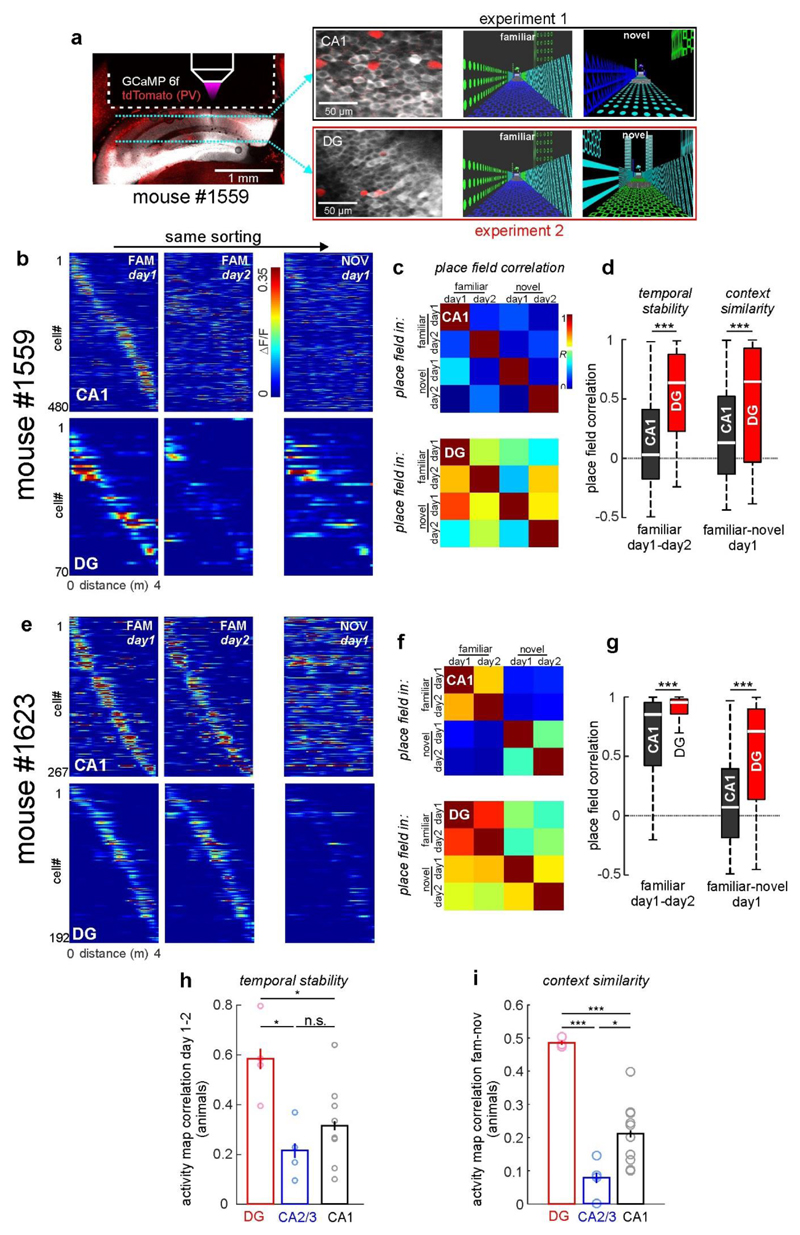
Extended Data Figure 7. Differential stability and context discrimination properties of principal cells in CA1 and DG are not due to interindividual differences.
(a) Experimental schematic: Left, fluorescence image of GCaMP6f (white) and td-Tomato in PV cells (red) in a post mortem coronal brain section. Dotted line indicates position of the imaging window. In this particular mouse, recordings were made from CA1-PYR or DG-GCs in separate, sequential experiments (exemplary image planes are shown in middle images). For each experiment, the same familiar and a different novel context (right) were used. Thereby, the coding properties of PYR and GCs of the same animal could be compared. (b) Calcium activity over distance for CA1- PYR (top) and DG-GCs (bottom) with place fields on the familiar track are shown sorted for their peak activity on day 1 in the familiar context. Middle images show the same cells with the same sorting on day 2 in the familiar context and on day 1 in the novel context (right). (c) Mean cellular activity map correlations over two days and contexts as indicated on the x-axis. Data sampled only for place cells recorded in the selected mouse. Each row shows mean correlation values for cells that had a place field on the day and track indicated on the y-axis. (d) Left, Correlations of activity maps in the familiar context between days plotted for cells that had a place field in the familiar context. Cells were sampled only from measurements in this particular mouse. Right, activity map correlations between the familiar and novel context on day 1 for all cells that had a place field in the familiar context on that day. Note: Stability over time as well as activity map similarity between contexts are significantly higher for GCs when compared to CA1-PYR of the same animal. (e-f) Same as in (b-d), but calculated separately on cells from another mouse. (h) Activity map correlations between day 1 and 2 were calculated for familiar-context place cells and averaged for each animal that had a minimum of 20 such place cells (open circles). The means of these per-animal averages (bars) were compared statistically. (i) Same as in (h), but for activity map correlations between the familiar and novel context on day 1. Note: Higher temporal stability and higher inter-context similarity are a feature of GCs that is consistently observed in different animals. (h,i) * p<0.05, ** p<0.01, *** p<0.001, n.s. not significant; one-way ANOVA with Holm-Sidak test. Error bars denote ±SEM. (d,g) Boxes: 25th to 75th percentiles; white bars: median; whiskers, 99% range.

