Abstract
G protein-coupled receptors (GPCRs) constitute a large class of cell surface receptors that recognize a wide array of ligands and mediate a diverse spectrum of signaling pathways. Measuring their surface expression in cellular context is a critical aspect of studying their signaling pathways and cellular outcomes. Upon addition of agonist, GPCRs typically undergo internalization and traffic from the plasma membrane to endosomal compartments. Although radioligand binding has been the primary assay to measure GPCR surface expression and internalization, whole-cell ELISA has now emerged as a powerful alternative approach. Here, we present a step-by-step whole-cell ELISA protocol for measuring relative surface expression and agonist-induced internalization of GPCRs containing engineered N-terminal epitope tag and recombinantly expressed in heterologous cells.
1. Introduction
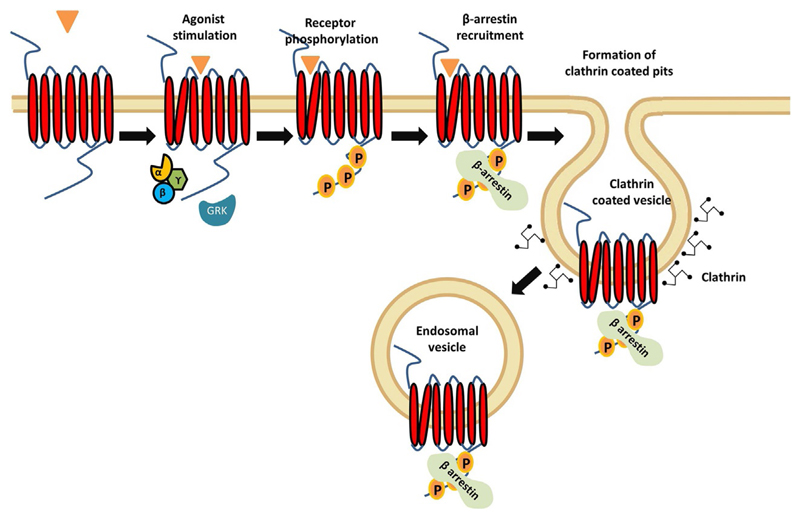
There are about 800 different members in the GPCR family of which approximately 200 or so are functionally well characterized in terms of their endogenous ligands, transducer coupling preference and downstream signaling pathways (Bockaert & Pin, 1999; Isberg et al., 2017; Pandy-Szekeres et al., 2018; Pierce, Premont, & Lefkowitz, 2002). GPCRs are involved in diverse spectrum of cellular and physiological events, and they also constitute one of the most extensively studied classes of drug targets (Chaturvedi et al., 2018; Hauser, Attwood, Rask-Andersen, Schioth, & Gloriam, 2017; Hauser et al., 2018; Isberg et al., 2017; Kumari, Ghosh, & Shukla, 2015). Agonist stimulation typically results in activation and coupling of GPCRs to heterotrimeric G proteins and a class of multifunctional adaptor proteins known as β-arrestins (βarrs). One of the key functions of βarrs is to mediate agonist-induced internalization (endocytosis) of GPCRs through clathrin-dependent endocytotic machinery (DeGraff, Gagnon, Benovic, & Orsini, 1999; Gagnon, Kallal, & Benovic, 1998; Gaidarov, Krupnick, Falck, Benovic, & Keen, 1999; Goodman et al., 1996, 1998; Kang, Tian, & Benovic, 2014) (Fig. 1). Majority of these receptors, if not all, also interact with β-arrestins (βarrs) upon agonist-stimulation, and undergo subsequent internalization (Gurevich & Gurevich, 2015; Kang et al., 2014; Peterson & Luttrell, 2017; Ranjan, Dwivedi, Baidya, Kumar, & Shukla, 2017).
Fig. 1.
A simplified schematic depicting agonist-induced endocytosis of GPCRs. Binding of an agonist results in activation of the receptor and coupling of heterotrimeric G proteins. This is followed by the phosphorylation of receptor tail (carboxyl-terminus) and recruitment of β-arrestins to the receptor. Subsequently, the receptor is internalized through the formation of clathrin coated vesicles which results in a decrease in receptor density at the cell surface.
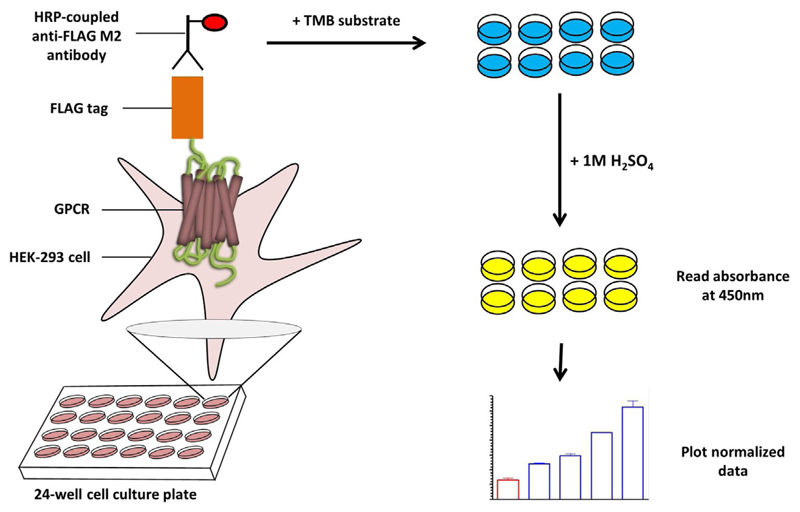
As GPCRs primarily reside in the plasma membrane, measuring their surface expression is often a key experimental step in biochemical and cellular studies of any receptor system. For example, careful assessment of surface level is a prerequisite when comparing different mutants with respect to their transducer coupling and downstream signaling. Similarly, measuring receptor endocytosis is one of the key readouts when investigating the effect of different ligands, mutants or other manipulations for a given receptor system. Although radioligand binding can be a powerful method to precisely and quantitatively measure receptor surface expression and endocytosis, there are numerous technical and logistic challenges associated with this method. Whole-cell ELISA provides a robust alternative to measure surface expression and agonist-induced GPCR internalization at least for N-terminally epitope tagged receptors expressed in heterologous cells (Fig. 2). The following protocol is based on experiments carried out in our laboratory wherein we have measured surface expression levels and agonist-induced endocytosis of several different GPCRs (Ghosh et al., 2017; Kumari et al., 2016, 2017).
Fig. 2.
A schematic representation of whole-cell ELISA based assay for GPCR surface expression and endocytosis. HEK-293 cells expressing FLAG-tagged receptors are immobilized onto a 24-well cell culture plate. Incubation of cells with the HRP-coupled anti-FLAG M2 antibody leads to the binding of antibody to the FLAG epitope at the N-terminus of the receptor. Upon addition of TMB solution which contains a chromogenic substrate for HRP, a light blue color appears in the wells. The reaction is stopped by adding 1 M H2SO4 which results in the appearance of light yellow color. Absorbance of the solution is measured at 450 nm.
2. Materials
-
-
Cell culture related plastic ware and equipment (100mm plate, 24 well plates, micro-tips, sterile pipettes, laminar flow cabinet, CO2 incubator, steripette)
-
-
Cell culture media and related consumables (Dulbecco's Modified Eagle Medium, DMEM; Fetal Bovine Serum, FBS; Penicillin-Streptomycin solution, Pen-Strep; Trypsin-EDTA; Phosphate Buffer Saline, PBS)
-
-
HEK-293 cells, expression plasmid construct with the gene encoding GPCR of interest, DNA transfection reagent (PEI, Polyethyleneimine)
-
-
Receptor ligands
-
-
Multichannel pipettes
-
-
1 × Tris Buffer Saline (50mM Tris pH 7.5, 150mM NaCl)
-
-
Bovine Serum Albumin (1% BSA (w/v) prepared in 1 × TBS)
-
-
HRP conjugated Anti-FLAG M2 Antibody (1:2000 prepared in 1% BSA+1 × TBS, M2-HRP Sigma)
-
-
One-Solution Microwell TMB (GenScript, Cat. No. M0078)
-
-
1M H2SO4
-
-
96-well Flat bottom microtest plate
-
-
Janus Green B solution (0.2% (w/v))
-
-
Poly-d-Lysine (0.01%)
-
-
Paraformaldehyde (PFA) (4% prepared in TBS)
-
-
Multimode Plate Reader with appropriate setting to measure absorbance at 450 and 595 nm
3. Methods
3.1. General Cell Culture And Maintenance
-
-
Please refer to the chapter "Measuring agonist-induced ERK MAP kinase phosphorylation for G protein-coupled receptors" by Kumari, Dwivedi, Baidya, and Shukla in the same volume for general guidelines of cell culture and maintenance.
3.2. Transfection And Seeding Of Cells For Surface Elisa
-
3.2.1
Count the cells, seed approximately 2–3 × 10⁶ cells into 100mm cell culture plates and put them in CO2 incubator. Observe the cells the next day under the microscope; they should be approximately 50–70% confluent and ready for transfection.
-
3.2.2
For a typical transfection in a 100mm cell culture plate, mix 7μg of expression plasmid DNA and 21 μL of PEI in 300 μL of serum-free DMEM. Mix thoroughly and incubate at room temperature for 10–15 min. In the meantime, replace the media in cell culture plates with serum-free DMEM. Subsequently, add the transfection mixture to cells drop-wise and incubate the plate in the CO2 incubator at 37 °C for 6–8h.
-
3.2.3
Afterward, change the media with complete DMEM (containing FBS and Pen-Strep) and incubate the plates for an additional 12–18 h in the CO2 incubator.
-
3.2.4
Whole-cell ELISA based surface expression and endocytosis assay is typically carried out in 24-well cell culture plates. In order to ensure that cells do not detach during ELISA, 24-well plates should be coated with Poly-d-Lysine. For this, add 200 μL of 0.01% Poly-d-Lysine in each well of 24 well-plates and incubate the plate for 15 min. Afterward, remove Poly-d-Lysine, wash the wells three times with 0.5 mL PBS and let it dry for approximately 2 h.
-
3.2.5
After 20–24h post-transfection, count the cells, seed approximately 0.1–0.2 × 10⁶ cells (in a volume of 300–500 μL) in each well of 24-well cell culture plate and incubate it for an additional 20–24 h in the CO2 incubator.
Note
-
[A]
It is advisable to not leave the transfected cells in serum-free media with transfection mixture for more than 6–8 h. This may result in detachment of cells and toxicity. It is also advisable to pre-warm the cell culture media, Trypsin-EDTA to room-temperature or 37 °C before use.
3.3. Whole-Cell Elisa
-
3.3.1
The key difference between measuring the surface expression and endocytosis is the stimulation of cells with ligands in the latter. In other words, whole-cell ELISA essentially measures the remaining receptor at the cell surface after ligand-stimulation and the difference in the surface level before and after stimulation reflects receptor endocytosis. In addition, cells are serum starved before measuring endocytosis to minimize any constitutive internalization.
-
3.3.2
For serum starvation in endocytosis assay, replace the complete DMEM media with serum-free DMEM for 8–12 h followed by incubation with desired concentration of ligand for appropriate time-point at 37 °C.
For simply measuring surface expression, directly proceed to the next step as outlined below.
-
3.3.3
Place the cell culture plates on ice, aspirate the media completely and wash the cells once with ice-cold TBS (1 ×) to remove any residual media and/or unbound ligand.
-
3.3.4
Add 300–400 μL of 4% PFA (paraformaldehyde) per well to fix the cells, incubate on ice for 15–20 min followed by three 400–500 μL washes with TBS (1 ×).
-
3.3.5
Add 300–400μL of 1% BSA solution prepared in 1 × TBS to block the non-specific binding sites of the antibody and incubate the plate at room-temperature for 1–2h.
-
3.3.6
Afterward, remove BSA from the wells, add 200–250 μL of HRP-coupled anti-FLAG M2 antibody (at a dilution of 1:2000–5000 prepared in TBS and supplemented with 1% BSA) and incubate the plate at room-temperature for 1–2 h. It is advisable to cover the plate with aluminum foil as HRP may be sensitive to light exposure.
-
3.3.7
Remove the antibody, wash the cells three times with 400–500μL of TBS and then add 150–200 μL of TMB-ELISA substrate solution. The reaction of TMB ELISA substrate with HRP generates light blue color which may take 1–2min to be visible. Stop the reaction by transferring 100 μL of this colored solution to another 96-well plate containing 100 μL 1M H2SO4. Addition of H2SO4 results in a yellow colored solution indicating that the reaction is stopped.
-
3.3.8
Measure the absorbance of the yellow colored solution at 450nm in a micro-plate reader.
-
3.3.9
A key step in this assay is the normalization of the signal intensity across different wells (i.e., different experimental conditions such as ligands, constructs). This is typically carried out using a subsequent Janus Green staining step which stains mitochondria in the cells.
-
3.3.10
Carefully aspirate the TMB substrate solution from the wells, wash twice with 400–500 μL of TBS followed by addition of 150–200μL of Janus Green solution (0.2% w/v) and incubation at room temperature for 10–15 min.
-
3.3.11
Wash off the excess stain with milli Q water (typically four times with 0.5–1 mL), add 750–800 μL of 0.5 N HCl and shake the plate gently to elute the bound stain from the cells. Elution of Janus Green results in the appearance of a purple color. Take 100–200 μL of this solution in another flat bottom 96-well plate and read the absorbance at 595 nm using a micro-plate reader.
-
3.3.12
A ratio of the absorbance at 450 and 595 nm (A 450/A 595) yields a normalized expression level of the receptor at the cell surface. For endocytosis experiment, the difference between A450/A595 without ligand-stimulation and with ligand stimulation at a particular time-point reflects the endocytosis. Surface expression and receptor endocytosis can be presented as either fold-change or % response.
Note
-
[A]
Handle the 24-well cell culture plate carefully as rough handling may lead to uneven detachment of cells from different wells, especially before the cells are fixed with PFA.
-
[B]
It is also advisable to prepare all the solutions (including TBS, antibody dilution, PFA) fresh.
-
[C]
For the endocytosis experiment, if the ligand stock is prepared in DMSO, it should be diluted such that the final DMSO concentration does not exceed 0.1% when added to the cells. Higher DMSO concentration may be toxic to the cells.
-
[D]
TMB ELISA substrate solution is typically stored at 4 °C and it is advisable to warm it up to room-temperature before use.
4. Expected Results
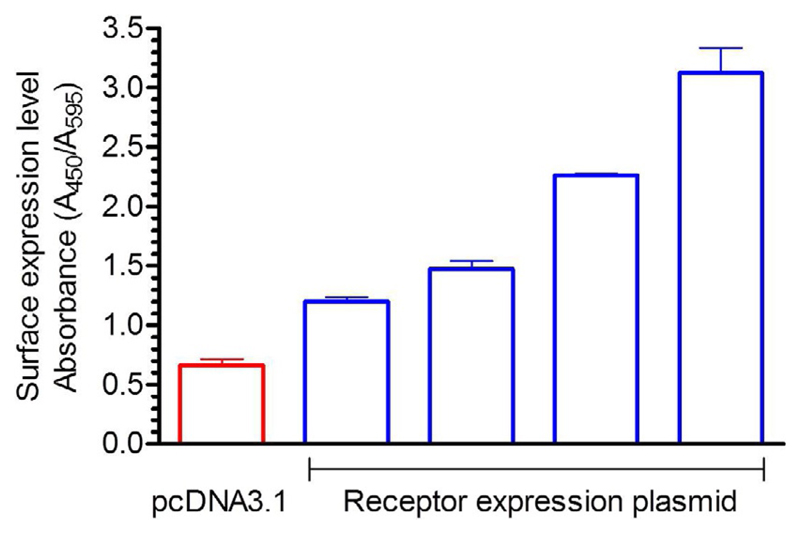
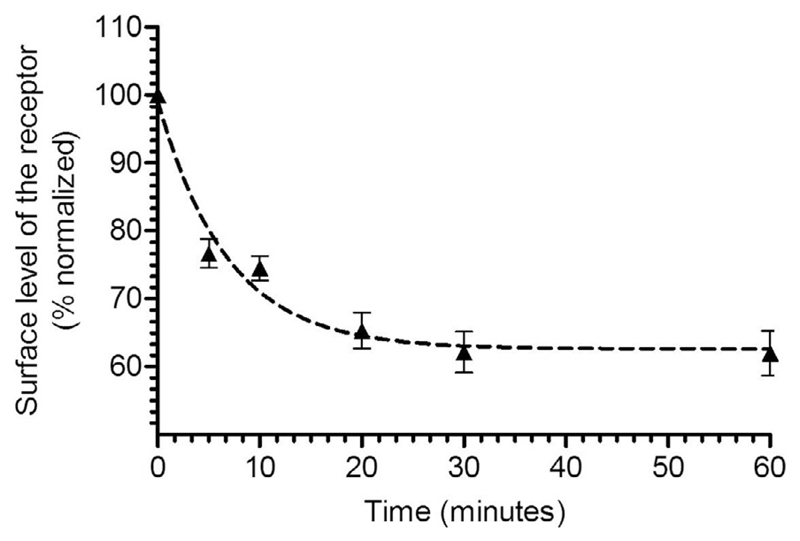
It is expected that the signal (i.e., A 450/A 595) for receptor expression condition will be significantly higher than the control (i.e., empty pcDNA3.1 vector transfection). In a typical plasmid titration experiment, one should observe a correlation between the amount of DNA transfected and surface expression level and a typical profile for the surface expression experiment is presented in Fig. 3. A typical profile for the agonist-induced endocytosis experiment is presented in Fig. 4.
Fig. 3.
Atypical result of the whole-cell ELISA based assay to measure surface expression of a GPCR. HEK-293 cells in 100mm cell culture plate were transfected with either empty vector (pcDNA3.1, 3.5 μg) or increasing concentrations (0.5, 1.0, 2.0, 3.5 μg) of a FLAG-tagged GPCR (C5aRl cloned in pcDNA3.1 with N-terminal FLAG tag) using PEI. 24h post-transfection, they were seeded into 24-well cell culture plates. The surface expression level of the receptor was measured 48h post-transfection using HRP-coupled anti-FLAG M2 antibody following the whole-cell ELISA protocol. The ratio of absorbance at 450 and 595nm in arbitrary units is presented in the figure.
Fig. 4.
A typical example of agonist-induced GPCR internalization measured by whole-cell ELISA. HEK-293 cells expressing a chimeric β2-adrenergic receptor (referred to as β2V2R) were stimulated with 1 μM agonist (BI-167107) for indicated time-points. Subsequently, the receptor density at the cell surface was measured using whole-cell ELISA and plotted after normalization.
This figure is adapted from a previously published paper from our own laboratory: Kumari, P., Srivastava, A., Banerjee, R., Ghosh, E., Gupta, P., Ranjan, R., et al. (2016). Functional competence of a partially engaged GPCR-beta-arrestin complex. Nature Communications, 7, 13416.
5. Troubleshooting
| Potential Problem | Possible Reason | Suggested Solution |
|---|---|---|
| Surface expression of the receptor is not detected | There may be an issue with DNA construct or DNA transfection | Confirm the complete sequence of the DNA plasmid and double check its purity and integrity. Optimize the transfection condition by varying the DNA:PEI ratio and cell confluence |
| Endocytosis of the receptor is not detected | Ligand-stimulation may be sub-optimal | Prepare fresh stock of the ligand and confirm the appropriate concentration for stimulation |
6. Additional Notes
-
6.1
Surface expression and pattern of internalization varies significantly for different GPCRs, and therefore, the protocol presented here may require additional optimization depending on the receptor of interest.
-
6.2
Transient expression of GPCRs is typically suitable for endocytosis experiments; however, some of the receptors expressing at lower levels may require generation of stable cell lines.
-
6.3
When comparing the internalization pattern of different mutants of given GPCRs, it is advisable to first normalize their surface expression levels to be reasonably comparable.
-
6.4
The protocol presented here is based on the detection of N-terminally FLAG-tagged GPCRs; however, it should be directly applicable to receptors tagged differently (e.g., HA tag).
-
6.5
Although this protocol is based on using HRP-coupled anti-FLAG M2 antibody, other antibodies coupled to fluorophores or biotin or other similar detection reagents can also be used.
-
6.6
If reliable and well-validated antibodies against the N-terminal epitopes or extracellular epitopes are available, this protocol can also be adapted for endogenous GPCRs although a smaller signal to noise window will be expected.
Acknowledgments
We thank the members of our laboratory for critical reading of the manuscript. We also thank Eshan Ghosh for establishing and optimizing the protocol in our laboratory. The research program in our laboratory is supported by the DBT Wellcome Trust India Alliance (Intermediate Fellowship to A.K.S.—IA/I/14/1/501285), Department of Biotechnology, Government of India (Innovative Young Biotechnologist Award to A.K.S.—BT/08/IYBA/2014-3), LADY TATA Memorial Trust Young Researcher Award to A.K.S., Science and Engineering Research Board (SERB) (SB/SO/BB-121/2013), Council of Scientific and Industrial Research (CSIR) (37[1637]14/EMR-II). A.K.S. is an EMBO Young Investigator.
References
- Bockaert J, Pin JP. Molecular tinkering of G protein-coupled receptors: An evolutionary success. The EMBO Journal. 1999;18:1723–1729. doi: 10.1093/emboj/18.7.1723. [DOI] [PMC free article] [PubMed] [Google Scholar]
- Chaturvedi M, Schilling J, Beautrait A, Bouvier M, Benovic JL, Shukla AK. Emerging paradigm of intracellular targeting of G protein-coupled receptors. Trends in Biochemical Sciences. 2018;43:533–546. doi: 10.1016/j.tibs.2018.04.003. [DOI] [PMC free article] [PubMed] [Google Scholar]
- DeGraff JL, Gagnon AW, Benovic JL, Orsini MJ. Role of arrestins in endocytosis and signaling of alpha2-adrenergic receptor subtypes. The Journal of Biological Chemistry. 1999;274:11253–11259. doi: 10.1074/jbc.274.16.11253. [DOI] [PubMed] [Google Scholar]
- Gagnon AW, Kallal L, Benovic JL. Role of clathrin-mediated endocytosis in agonist-induced down-regulation of the beta2-adrenergic receptor. The Journal of Biological Chemistry. 1998;273:6976–6981. doi: 10.1074/jbc.273.12.6976. [DOI] [PubMed] [Google Scholar]
- Gaidarov I, Krupnick JG, Falck JR, Benovic JL, Keen JH. Arrestin function in G protein-coupled receptor endocytosis requires phosphoinositide binding. The EMBO Journal. 1999;18:871–881. doi: 10.1093/emboj/18.4.871. [DOI] [PMC free article] [PubMed] [Google Scholar]
- Ghosh E, Srivastava A, Baidya M, Kumari P, Dwivedi H, Nidhi K, et al. A synthetic intrabody-based selective and generic inhibitor of GPCR endocytosis. Nature Nanotechnology. 2017;12:1190–1198. doi: 10.1038/nnano.2017.188. [DOI] [PMC free article] [PubMed] [Google Scholar]
- Goodman OB, Jr, Krupnick JG, Santini F, Gurevich VV, Penn RB, Gagnon AW, et al. Beta-arrestin acts as a clathrin adaptor in endocytosis of the beta2-adrenergic receptor. Nature. 1996;383:447–450. doi: 10.1038/383447a0. [DOI] [PubMed] [Google Scholar]
- Goodman OB Jr, Krupnick JG, Santini F, Gurevich VV, Penn RB, Gagnon AW, et al. Role of arrestins in G-protein-coupled receptor endocytosis. Advances in Pharmacology. 1998;42:429–433. doi: 10.1016/s1054-3589(08)60780-2. [DOI] [PubMed] [Google Scholar]
- Gurevich VV, Gurevich EV. Arrestins: Critical players in trafficking of many GPCRs. Progress in Molecular Biology and Translational Science. 2015;132:1–14. doi: 10.1016/bs.pmbts.2015.02.010. [DOI] [PMC free article] [PubMed] [Google Scholar]
- Hauser AS, Attwood MM, Rask-Andersen M, Schioth HB, Gloriam DE. Trends in GPCR drug discovery: New agents, targets and indications. Nature Reviews Drug Discovery. 2017;16:829–842. doi: 10.1038/nrd.2017.178. [DOI] [PMC free article] [PubMed] [Google Scholar]
- Hauser AS, Chavali S, Masuho I, Jahn LJ, Martemyanov KA, Gloriam DE, et al. Pharmacogenomics of GPCR drug targets. Cell. 2018;172:41–54.e19. doi: 10.1016/j.cell.2017.11.033. [DOI] [PMC free article] [PubMed] [Google Scholar]
- Isberg V, Mordalski S, Munk C, Rataj K, Harpsoe K, Hauser AS, et al. GPCRdb: An information system for G protein-coupled receptors. Nucleic Acids Research. 2017;45 doi: 10.1093/nar/gkw1218. 2936. [DOI] [PMC free article] [PubMed] [Google Scholar]
- Kang DS, Tian X, Benovic JL. Role of beta-arrestins and arrestin domain-containing proteins in G protein-coupled receptor trafficking. Current Opinion in Cell Biology. 2014;27:63–71. doi: 10.1016/j.ceb.2013.11.005. [DOI] [PMC free article] [PubMed] [Google Scholar]
- Kumari P, Ghosh E, Shukla AK. Emerging approaches to GPCR ligand screening for drug discovery. Trends in Molecular Medicine. 2015;21:687–701. doi: 10.1016/j.molmed.2015.09.002. [DOI] [PubMed] [Google Scholar]
- Kumari P, Srivastava A, Banerjee R, Ghosh E, Gupta P, Ranjan R, et al. Functional competence of a partially engaged GPCR-beta-arrestin complex. Nature Communications. 2016;7 doi: 10.1038/ncomms13416. 13416. [DOI] [PMC free article] [PubMed] [Google Scholar]
- Kumari P, Srivastava A, Ghosh E, Ranjan R, Dogra S, Yadav PN, et al. Core engagement with beta-arrestin is dispensable for agonist-induced vasopressin receptor endocytosis and ERK activation. Molecular Biology of the Cell. 2017;28:1003–1010. doi: 10.1091/mbc.E16-12-0818. [DOI] [PMC free article] [PubMed] [Google Scholar]
- Pandy-Szekeres G, Munk C, Tsonkov TM, Mordalski S, Harpsoe K, Hauser AS, et al. GPCRdb in 2018: Adding GPCR structure models and ligands. Nucleic Acids Research. 2018;46:D440–D446. doi: 10.1093/nar/gkx1109. [DOI] [PMC free article] [PubMed] [Google Scholar]
- Peterson YK, Luttrell LM. The diverse roles of arrestin scaffolds in G protein-coupled receptor signaling. Pharmacological Reviews. 2017;69:256–297. doi: 10.1124/pr.116.013367. [DOI] [PMC free article] [PubMed] [Google Scholar]
- Pierce KL, Premont RT, Lefkowitz RJ. Seven-transmembrane receptors. Nature Reviews Molecular Cell Biology. 2002;3:639–650. doi: 10.1038/nrm908. [DOI] [PubMed] [Google Scholar]
- Ranjan R, Dwivedi H, Baidya M, Kumar M, Shukla AK. Novel structural insights into GPCR-beta-arrestin interaction and signaling. Trends in Cell Biology. 2017;27:851–862. doi: 10.1016/j.tcb.2017.05.008. [DOI] [PubMed] [Google Scholar]


