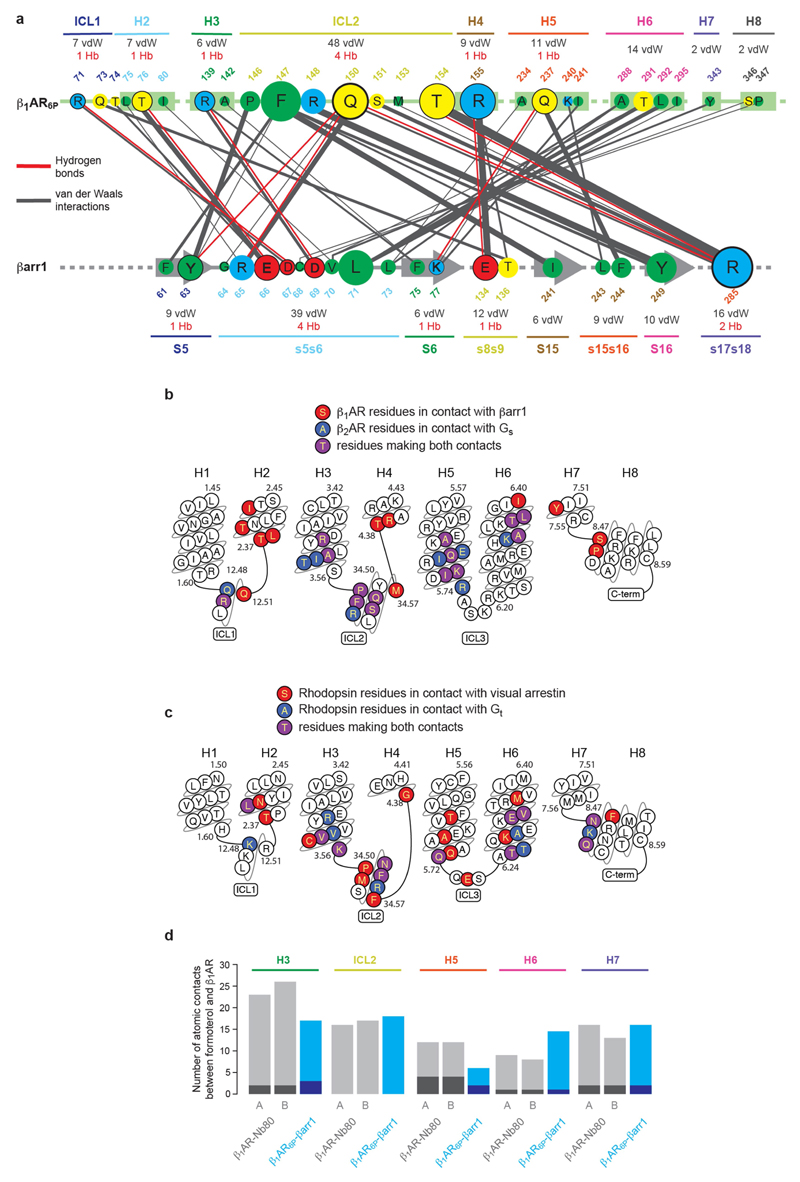
Extended Data Fig. 7. β1AR6P–βarr1 and formoterol–β1AR6P contacts, and comparison with other complexes.
a, interactions between amino acid residues in β1AR6P and βarr1. The size of the circle depicting the residue is proportional to the number of van der Waals interactions (grey lines) and hydrogen bonds (red lines) made, with residues in circles outlined in black making potential hydrogen bonds. Secondary structure elements are shown with the total number of interactions they make. The thickness of lines making contacts is proportional to the number of contacts made. b, Residues are depicted in β1AR6P that make contact (≤3.9 Å) with βarr1 (red) and residues in β2AR (PDB ID: 3SN6) that make contact to Gs (blue); purple residues make contacts in both structures. The sequence of turkey β1AR is depicted. c, Residues in human rhodopsin that make contact with either visual arrestin or transducin (Gt). Plots were made using GPCRdb. d, The number of atomic contacts between the ligand formoterol and secondary structure elements in β1AR is depicted; grey bars, β1AR–Nb80 complex; blue bars, β1AR6P–βarr1 complex. Light regions correspond to the number of van der Waals interactions and dark regions correspond to the number of hydrogen bonds. Data for chain A and chain B in the crystal unit cell of the β1AR–Nb80 complex are shown separately (A and B).

