Abstract
The cytokine IFN-γ produced by tumor-reactive T cells is a key effector molecule with pleiotropic effects during anti-tumor immune responses. While IFN-γ production is targeted at the immunological synapse, its spatiotemporal activity within the tumor remains elusive. Here, we report that while IFN-γ secretion requires local antigen recognition, IFN-γ diffuses extensively to alter the tumor microenvironment in distant areas. Using intravital imaging and a reporter for STAT1 translocation, we provide evidence that T cells mediate sustained IFN-γ signaling in remote tumor cells. Furthermore, tumor phenotypic alterations required several hours of exposure to IFN-γ, a feature that disfavored local IFN-γ activity over diffusion and bystander activity. Finally, single-cell RNA-seq data from melanoma patients also suggested bystander IFN-γ activity in human tumors. Thus, tumor-reactive T cells act collectively to create large cytokine fields that profoundly modify the tumor microenvironment.
Introduction
IFN-γ is a key soluble effector molecule during anti-tumor immune responses. Mice deficient for IFN-γ production are prone to develop spontaneous or carcinogen-induced tumors, highlighting the crucial importance of IFN-γ during immunosurveillance 1, 2, 3. IFN-γ also plays an important role during tumor immunotherapy as the benefit of anti-Programmed Death 1 (PD-1) therapy in mice has been shown to be dependent on IFN-γ production by CD8+ T cells and the associated IL-12 production by dendritic cells 4. Moreover, in melanoma patients, acquired resistance to anti-CTLA-4 therapy has been associated with mutations in IFN-γ signaling 5.
Several mechanisms have been described to explain the beneficial impact of IFN-γ in the tumor microenvironment. For example, IFN-γ can exert direct cytotoxic or cytostatic effects on tumor cells 6, 7, contribute to tumor senescence 8 and tumor ferroptosis 9. In addition, IFN-γ signaling on stromal cells can lead to reduced angiogenesis in the tumor bed, limiting nutrients and dioxygen access 7, 10. IFN-γ signaling can also lead to Major Histocompatibility Complex (MHC) class I upregulation thereby increasing tumor sensitivity to CD8+ T cell-mediated lysis 11. Finally, IFN-γ orchestrates the recruitment of Natural Killer (NK) cells, T cells and invariant NK T (iNKT) cells to the tumor by triggering CXCL9, CXCL10 and CXCL11 production 12.
Conversely, intratumoral IFN-γ may have detrimental effects on the outcome of anti-tumor immune responses. In this respect, it has been reported that IFN-γ increases tumor cell genomic instability 13, a process that may favor tumor escape from the immune pressure. IFN-γ can also induce the expression of ligands for inhibitory receptors such as Programmed Death-Ligand 1 (PD-L1) and PD-L2 on stromal and tumor cells 14, contributing to the inhibition of tumor-infiltrating T cells 15, 16. IFN-γ could also induce the deletion of tumor-reactive T cells by favoring activation-induced cell death 17. Finally, long term IFN-γ exposure has been associated with deep transcriptomic changes in tumor cells that can contribute to the failure of immune checkpoint blockade therapy 18.
Despite our understanding of molecular and cellular mechanisms triggered by IFN-γ, we are critically lacking informations on the spatiotemporal activity of this cytokine in the tumor microenvironment. Quantitative rules regulating cell-cell communication are only starting to be considered 19 but are essential to understand complex immune responses. Fundamental questions remain to be addressed. Does IFN-γ act primarily in discrete areas or more widely in the tumor microenvironment? How is IFN-γ spatial activity shaped by the number of cytokine-producing T cells? What is the duration of IFN-γ exposure required to alter tumor cell function and phenotype? It is well established that IFN-γ is secreted by T cells in a directional manner towards the immunological synapse formed with target cells 20. Upon TCR stimulation, IFN-γ production is also thought to be a brief (few hours long) event 21, 22. Although these two features are expected to favor a local activity of IFN-γ around the sites of cytokine production, the extent of IFN-γ diffusion in tissue has yet to be fully understood. Indeed, using in vitro settings, it has been shown that the immunological synapse does not perfectly restrict IFN-γ secretion, which accounts for bystander activity of IFN-γ in cells that are not in contact with cytokine-producing T cells 23. Evidence for bystander IFN-γ activity have also been reported in vivo in the mesenteric lymph node following Toxoplasma gondii infection 24 and in the dermis infected with Leishmania major 25. Yet, the extent and functional consequences of IFN-γ diffusion in the microenvironment of distinct tumor types remain unclear.
Here, we investigated the spatiotemporal activity of IFN-γ in the tumor microenvironment using B cell lymphoma and melanoma models. Using distinct approaches including mosaic tumors and intravital imaging with a real-time reporter of Signal Transducer and Activator of Transcription 1 (STAT1) nuclear translocation, we show that IFN-γ signaling occurs with extensive bystander activity throughout the tumor microenvironment, affecting both tumor and infiltrating immune cells. Although STAT1 activity in tumor cells was sustained, it did not require continuous interaction with T cells, confirming the extensive bystander activity of intratumoral IFN-γ. We provide evidence that prolonged IFN-γ exposure is in fact needed to alter tumor cell phenotype. Our results support a model in which IFN-γ regulates the tumor microenvironment by acting as a widespread and sustained cytokine field whose concentration is dependent on the collective T cell activity.
Results
T cell-derived IFN-γ profoundly modifies the tumor microenvironment
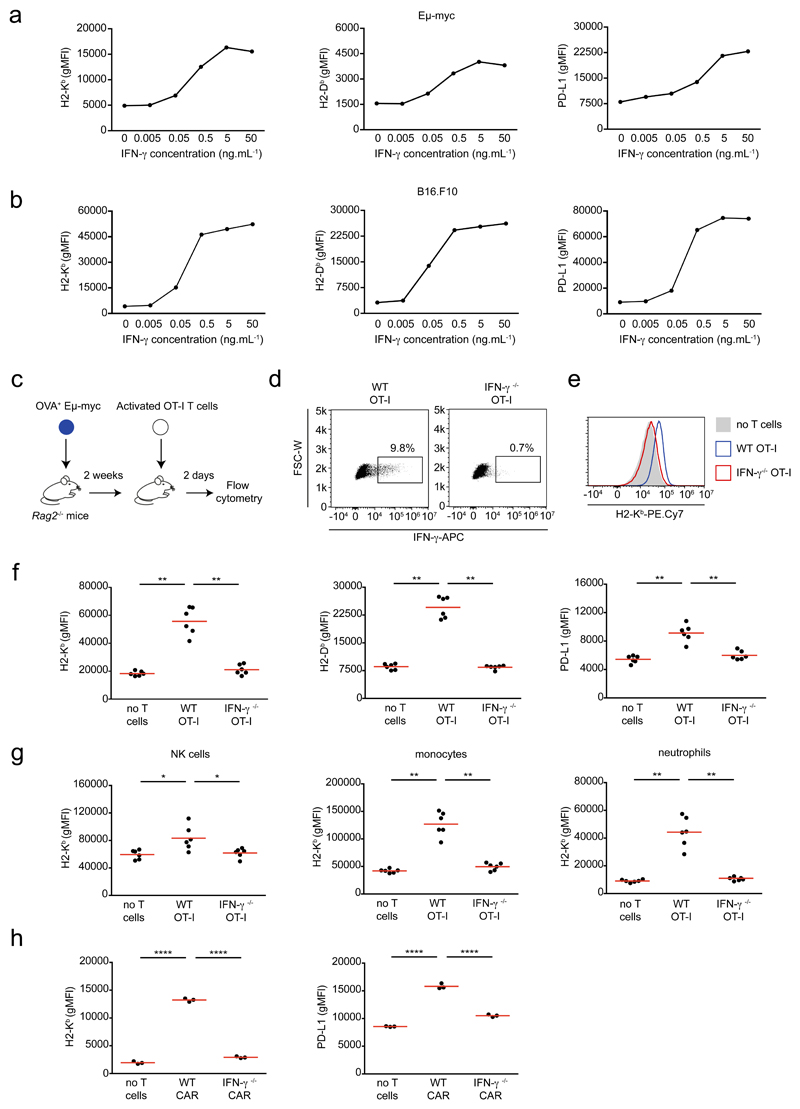
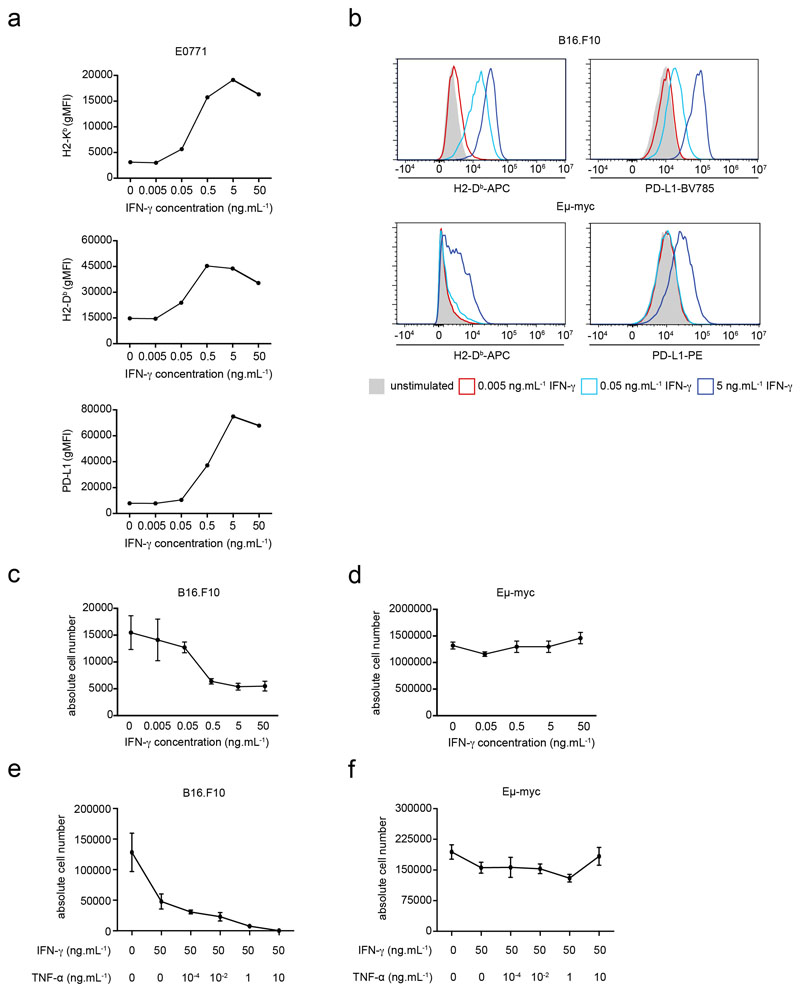
In order to characterize how intratumoral IFN-γ acts on tumor cells, we examined in distinct tumor cell lines the expression of several markers, including MHC class I and PD-L1 upon exposure to various concentrations of IFN-γ. Using models for Myc-driven B cell lymphoma (Eμ-myc) 26, melanoma (B16.F10)27 and mammary tumor (E0771)28 we observed a dose-dependent upregulation of these markers for all cell lines (Fig. 1a-b, Extended data Fig. 1a). Phenotype changes upon IFN-γ treatment followed an analog, rather than a digital, pattern with a concentration-dependent shift in expression of the whole population rather than a bimodal distribution (Extended data Fig. 1b). At high concentration, IFN-γ also induced substantial cell death of B16.F10 tumor cells and an even more pronounced effect when combined with TNF-α (Extended data Fig. 1c, e). By contrast, IFN-γ did not induce substantial cell death of Eμ-myc cells either alone or in combination with TNF-α, highlighting the diversity of tumor response to this cytokine (Extended data Fig. 1d, f).
Figure 1. T cell-derived IFN-γ induces phenotypic changes in the tumor micro-environment.
a-b IFN-γ induces phenotypic changes in tumor cells in vitro. Eμ-myc B lymphoma (a) or B16.F10 melanoma (b) cells were stimulated with indicated IFN-γ concentrations in vitro for 24h. H2-Kb (left), H2-Db (middle) and PD-L1 (right) surface expression was then analyzed by flow cytometry. Each dot represents the mean of 3 technical replicates. Representative of 2 (B16.F10) or 3 (Eμ-myc) independent experiments. c-g T cell-derived IFN-γ increases MHC class I and PD-L1 levels in tumor and tumor-infiltrating immune cells. c Experimental set-up. Rag2-/- mice were injected i.v with OVA-expressing Eμ-myc B lymphoma cells. On day 12-13, in vitro activated WT or IFN-γ -deficient OT-I CD8+ T cells were injected i.v. Two days later, the recipient bone marrow was harvested and analyzed by flow cytometry. d Intracellular IFN-γ staining was performed in the absence of in vitro restimulation. Dot plots showing IFN-γ production by intratumoral WT OT-I T cells but not IFN-γ -deficient OT-I T cells. Data are representative of n=6 mice per group. e Representative example of histograms showing H2-Kb surface expression on tumor cells isolated from the bone marrow of mice that were left untreated (filled grey) or injected with either WT OT-I T cells (line, blue) or IFN-γ -deficient OT-I T cells (line, red). Data are representative of two independent experiments with n=6 mice per group. f H2-Kb (left), H2-Db (middle) and PD-L1 (right) surface expression on tumor cells isolated from mice treated or not with the indicated OT-I T cell population, as assessed by flow cytometry. Each dot represents one mouse. Red lines indicate mean values. Data are representative of two independent experiments with n=6 mice per group. (** P< 0.01, two-tailed Mann Whitney U-test). g H2-Kb surface expression on NK cells (left), monocytes (middle) and neutrophils (right) isolated from mice treated or not with the indicated OT-I T cells, as assessed by flow cytometry. Red lines indicate mean values. Data are representative of two independent experiments with n=6 mice per group. (* P<0.05, ** P< 0.01, two-tailed Mann Whitney U-test). h Recipients with established Eμ-myc B cell lymphoma were treated with anti-CD19 CAR T cells and analyzed 2 days later. H2-Kb (left) and PD-L1 (right) surface expression on tumor cells isolated from mice left untreated or treated with WT or IFN-γ -deficient CAR T cells. Red lines indicate mean values. Data are representative of 2 independent experiments with n=3 mice per group. (****, P<0.0001, ANOVA, with Tukey's test for multiple comparisons).
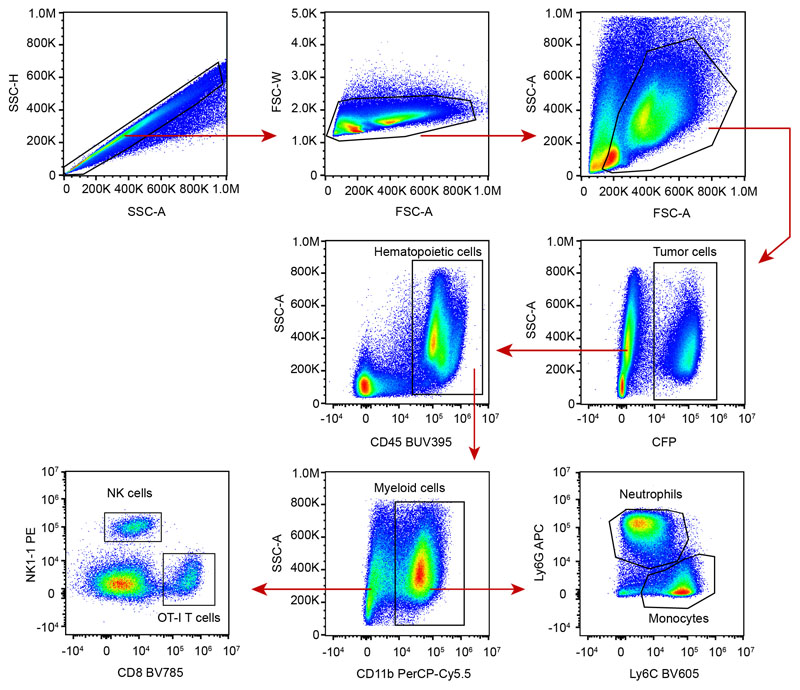
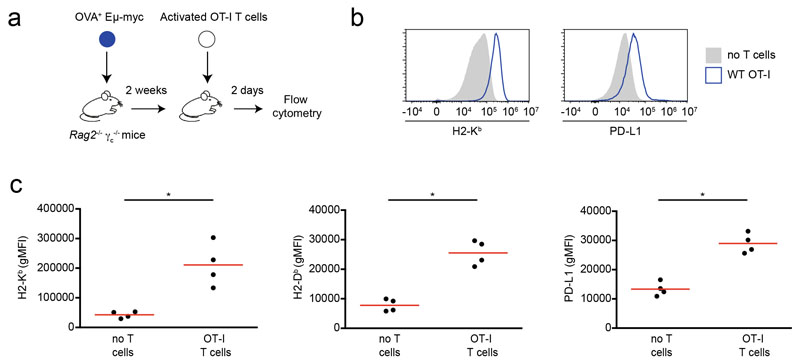
To test whether these phenotypic changes also occur in response to intratumoral T cell-derived IFN-γ in vivo, we adoptively transferred OT-I CD8+ T cells into Rag2-/- mice bearing ovalbumin+ (OVA+) Eμ-myc lymphomas and analyzed tumor phenotype in the bone marrow, a primary site of tumor growth (Fig. 1c, Extended data Fig. 2). We used recipients devoid of endogenous T cells to better control the source of IFN-γ production. A fraction of OT-I T cells at the tumor site was found to produce IFN-γ (Fig. 1d). As shown in Fig. 1e-f, the presence of T cells resulted in an increased expression of MHC class I and PD-L1 on tumor cells. Phenotypic changes were also detected in tumor infiltrating immune cells that expressed increased levels of MHC class I on their surface (Fig. 1g). All these effects appeared to be dependent on T cell -derived IFN-γ as they were abolished when IFN-γ-deficient OT-I T cells were transferred. Importantly, these results were recapitulated in Rag2-/-γc-/- recipients that lack NK cells, suggesting that T cell-derived IFN-γ is sufficient to directly mediate phenotypic changes in tumor cells (Extended data Fig. 3). To extend these findings in a setting of Chimeric Antigen Receptor (CAR) T cell therapy, we analyzed the phenotypic changes in lymphoma cells upon transfer of either IFN-γ sufficient or deficient anti-CD19 CAR T cells. The presence of WT but not IFN-γ-deficient CAR T cells resulted in a substantial increase in MHC class I and PD-L1 expression (Fig. 1h). Altogether, these results indicate that IFN-γ produced by T or CAR T cells have a broad impact on tumor and infiltrating immune cells.
Tumor-infiltrating T cells selectively accumulate and arrest in tumor areas with cognate antigen expression
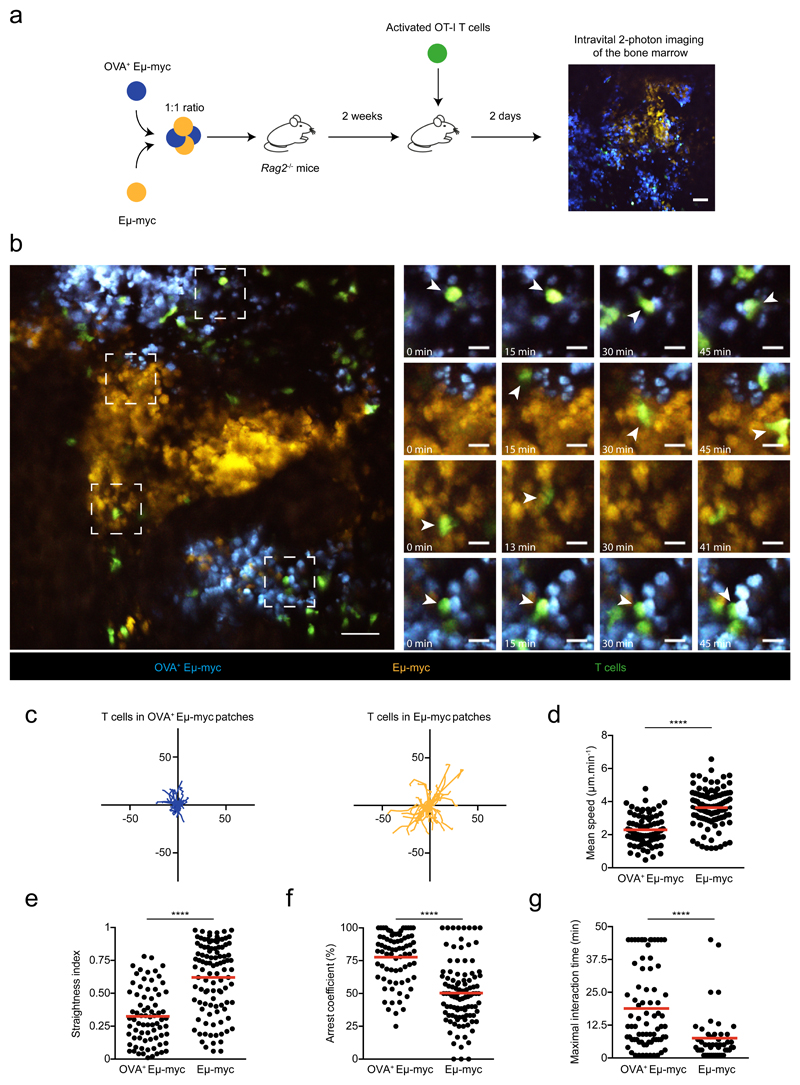
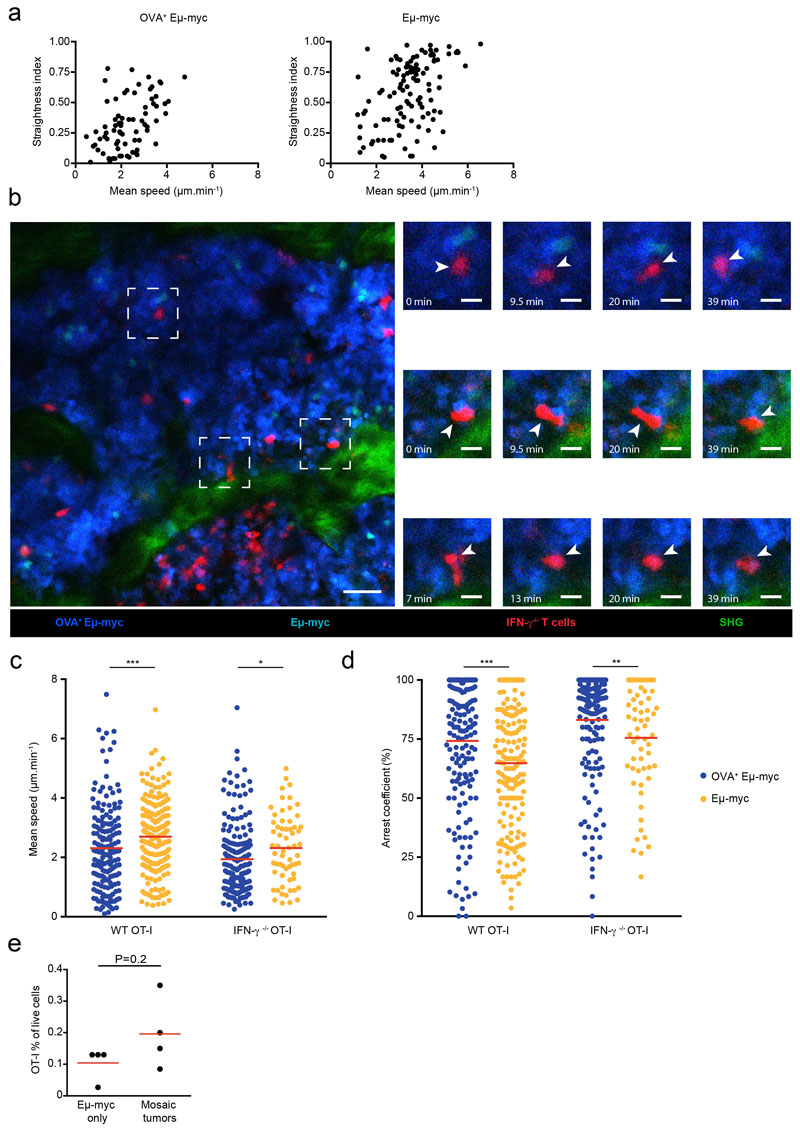
Production of IFN-γ by T cells has been associated with stable interactions with antigen-presenting targets 22. However, it is unclear whether IFN-γ produced by T cells acts on engaged targets, on their close neighbors or more extensively in the tumor microenvironment. To address this question, we thought to create mosaic tumors in which only selective regions express a tumor antigen in order to spatially restrict IFN-γ production (Fig. 2a). We took advantage of our previous observation that tumor subclones tend to grow as anatomically segregated patches to create these disparate environments 29. When we injected a mixture of antigen-positive (OVA+) and antigen-negative Eμ-myc tumors expressing distinct fluorescent proteins, we observed tumors patches with typical radius of 100-500 μm in the bone marrow (Fig. 2b). Using intravital imaging, we found that the majority of OT-I T cells selectively accumulated and arrested in antigen-positive areas where they displayed reduced velocity, increased confinement and formed long-lasting interactions with tumor cells (Fig. 2b-g, Extended data Fig. 4, and movie S1). The remaining T cells seen in antigen-negative tumor areas were rapidly migrating with no evidence for prolonged interactions (Fig. 2b-g, Extended data Fig. 4 and movie S1). Some of the stable contacts with antigen-positive tumors most likely represent sites of cytokine secretion as previous studies have linked T cell arrest to IFN-γ secretion 22. Even if it remains formally possible that migrating T cells also release small amounts of cytokine, the increased T cell numbers and residence time in antigen-positive areas would imply higher cytokine release in these regions. Of note, T cell arrest in antigen-positive areas was by large IFN-γ-independent as prolonged interactions were also observed with IFN-γ-deficient T cells (Extended data Fig. 4). In sum, this strategy provides a mean to spatially control cognate interactions leading to IFN-γ production by T cells and to assess the occurrence of long-distance effects in antigen-negative areas.
Figure 2. Tumor antigen expression drives the selective accumulation and arrest of intratumoral T cells.
a Experimental set-up. Rag2-/- mice were injected with a 1:1 mixture of OVA-expressing and non-expressing Eμ-myc B lymphoma cells, labeled with CFP and YFP, respectively. On day 12-13, mice were injected with activated GFP+ OT-I T cells. Two days later, intravital imaging of the bone marrow was performed. Scale bar: 50μm b-g CD8+ OT-I T cells specifically accumulate and arrest in antigen-expressing cellular patches of mosaic tumors. b Left. Representative image of OVA+ (blue) or OVA- (orange) tumor patches infiltrated with OT-I T cells (green). Scale bar: 50 μm. Right. Time lapse images (corresponding to the dashed squares) showing OT-I T cells (pointed by arrows) forming stable contacts with OVA+ Eμ-myc cells but not with OVA- Eμ-myc cells. Scale bar: 15 μm. Representative of two independent experiments with n=3 mice in each experiment. c Individual tracks of OT-I T cells located either in OVA+ tumor patches (blue) or OVA- tumor patches (orange). Numbers indicate distance in μm. d-f Graphs show mean speed (d), straightness (e) and arrest coefficient (f) of individual OT-I T cells located in OVA+ or OVA- tumor patches. Only tracks that were at least 5 min long were considered. g Maximal duration of interaction of individual OT-I T cells with OVA+ or OVA- Eμ-myc cells measured during 45 min long movies. Results in c-g are from 5 movies obtained in two independent experiments with 3 mice per experiment. In d-g, each dot represents one individual track (n=75 OT-I tracks in OVA+ tumor patches, n= 103 OT-I tracks in OVA- tumor patches). Red lines indicate mean values. (****, P<0.0001, two-tailed Mann Whitney U-test).
Strong bystander activity of T cell-derived IFN-γ in the tumor microenvironment
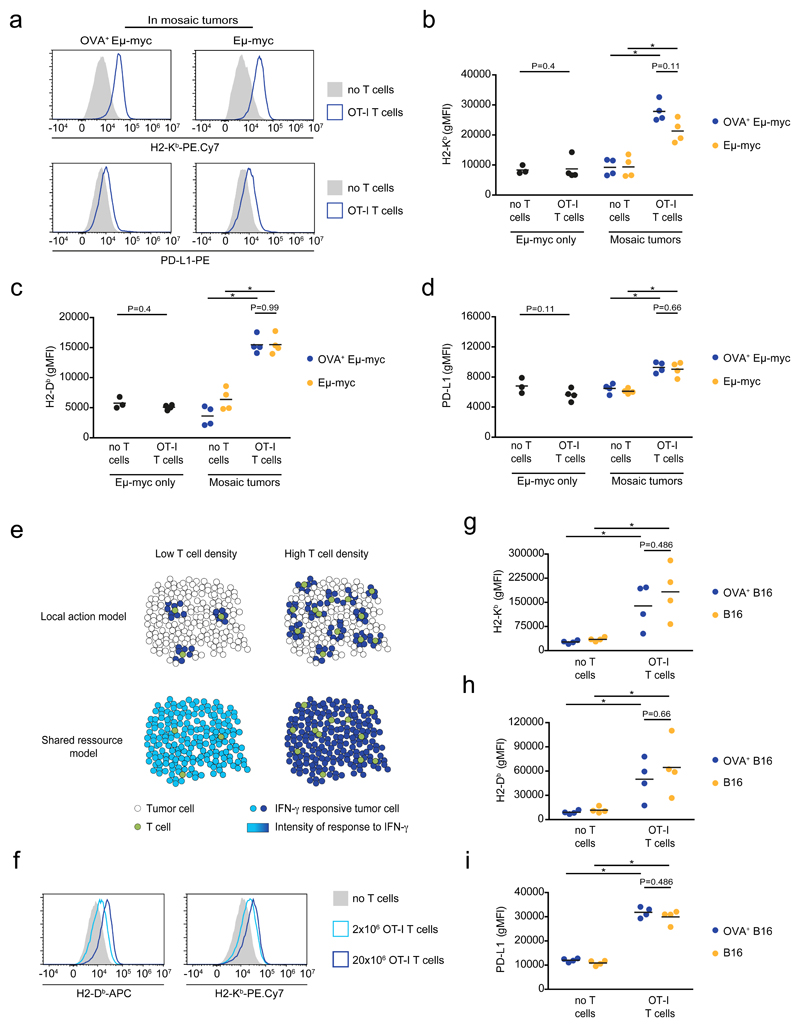
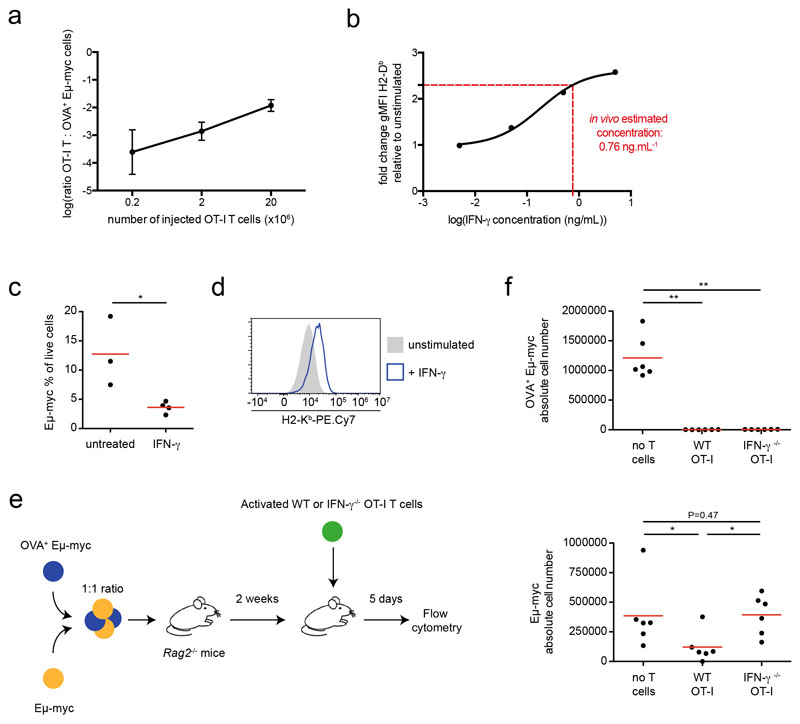
Using the aforementioned set-up, we asked how T cells impact the phenotype of tumor cells located in antigen-positive versus antigen-negative areas. Since IFN-γ is necessary and sufficient for MHC class I and PD-L1 upregulation, we relied on these readouts as a proxy for IFN-γ activity. We first used the Eμ-myc lymphoma model. When OT-I T cells were transferred in mice bearing antigen-negative tumors only, no changes in MHC class I and PD-L1 levels were observed (Fig. 3b-d) despite the presence of T cells in the tumor microenvironment (Extended data Fig. 4e). This confirmed that local antigen restimulation is required for IFN-γ production. In mosaic tumors, the presence of T cells resulted in an increased expression of MHC class I and PD-L1. Importantly, both antigen-positive and antigen-negative tumor cells upregulated these markers to the same extent (Fig. 3a-d). The widespread effects mediated by IFN-γ could be due to the activity of numerous T cells, each of them acting on a limited number of bystander cells (Fig. 3e). Alternatively, efficient diffusion of IFN-γ may result in a relatively uniform intratumoral cytokine concentration leading to a homogeneous response which intensity depends on the number of producing T cells (Fig. 3e). To distinguish between these two possibilities, we repeated our experiments with different numbers of T cells. We reasoned that if T cells act on a limited number of tumor cells, lowering the number of T cells should reduce the frequency of responding tumor cells without affecting the intensity of their response (best modeled by a bimodal distribution in tumor cell response) (Fig. 3e). By contrast, if IFN-γ primarily acts as a shared resource, reducing the number of T cells should decrease the intensity of the response in all cells (unimodal distribution of tumor cell response). Supporting the latter hypothesis, we found that a 10-fold decrease in the number of transferred T cells resulted in a homogeneous reduction in MHC class I upregulation (Fig. 3f). Altogether, these experiments support the idea that IFN-γ diffuses extensively in the tumor microenvironment. As a result, the collective activity of IFN-γ producing T cells generate a widespread field of IFN-γ whose concentration dictates phenotypic changes across the whole tumor. We measured that when transferring 20x106 T cells the ratio of OVA+ Eμ-myc to OT-I T cells was approximately 100:1. By comparing the fold increase in MHC class I levels observed in vivo to that seen in vitro (Fig. 1a), we estimated that this T cell density resulted in an intratumoral concentration of IFN-γ of around 1 ng/mL (Extended data Fig. 5a-b). This is obviously a rough estimate as several parameters could potentially differ between the in vitro and in vivo settings (such as cytokine consumption or basal IFN-γR expression). To test whether the activity of IFN-γ may influence tumor fate, we first assessed the effect of systemic IFN-γ delivery. We observed phenotypic changes in tumor cells suggesting effective diffusion in vivo and most importantly found reduced tumor burden in the bone marrow of treated mice (Extended data Fig. 5c-d). This result suggests, that in contrast to what was seen in vitro with Eμ-myc cells, IFN-γ exerts a negative effect on tumor development in vivo. This discrepancy may originate from an indirect effect of IFN-γ on host cells or from changes in IFN-γR expression/signaling on tumor cells in vivo. To test how T cell-derived IFN-γ may affect tumor growth in vivo, we relied on our mosaic tumor system and compared the impact of T cell-derived IFN-γ on the growth of both antigen positive and negative tumors. When recipient mice were transferred with IFN-γ competent T cells, we noted that antigen-positive (OVA+) cells were eliminated but also that the antigen-negative tumor was partly controlled (Extended data Fig. 5e-f). This partial control was lost upon transfer of IFN-γ deficient T cells (Extended data Fig. 5e-f), supporting the idea that bystander IFN-γ activity may help limit tumor growth in vivo.
Figure 3. Extensive bystander IFN-γ activity in the tumor microenvironment.
a-f Bystander activity of IFN-γ in the tumor microenvironment of B cell lymphomas. Rag2-/- mice were injected with either Eμ-myc alone or a 1:1 mixture of Eμ-myc and OVA-expressing Eμ-myc B lymphoma cells (labeled with different fluorescent proteins). On day 12-13, recipients were injected with OT-I T cells or left untreated. Two days later, the bone marrow of the mice was recovered and analyzed by flow cytometry. a Representative histograms of H2-Kb and PD-L1 surface expression on OVA-expressing (left) or non-expressing (right) Eμ-myc B lymphoma cells isolated from mice bearing mosaic tumors and injected with OT-I T cells (blue line) or left untreated (filled grey). Data are representative of 3 independent experiments with n=4 mice per group in each experiment. b-d H2-Kb, H2-Db and PD-L1 surface expression on tumor cells from mice injected with Eμ-myc cells only (black) or a 1:1 mixture of OVA-expressing (blue) and non-expressing (orange) Eμ-myc cells. Each dot represents one mouse. Black lines indicate mean values. Data are representative of 3 independent experiments with n=4 mice per group in each experiment. (* P<0.05, two-tailed Mann Whitney U-test). e Proposed models for IFN-γ diffusion in the tumor microenvironment. See text for details. f Representative histograms of surface expression of H2-Db and H2-Kb on OVA-expressing tumor cells isolated from mice either left untreated (filled grey) or injected with 2x10⁶ (light blue line) or 20x106 (dark blue line) OT-I T cells. Data are representative of n=5 mice per group. g-i Bystander activity of IFN-γ in solid tumors. Rag2-/- mice were injected with a 1:1 mixture B16 and OVA-expressing B16 cells (labeled with different fluorescent proteins). After one week, recipients were injected with OT-I T cells or left untreated. Two days later, tumors were digested and analyzed by flow cytometry. H2-Kb, H2-Db and PD-L1 surface expression on tumor cells from mice injected with a mixture of OVA-expressing (blue) and non-expressing (orange) B16.F10 cells. Each dot represents one mouse. Black lines indicate mean values. Data are representative of 2 independent experiments with n=4 mice per group in each experiment. (* P<0.05, two-tailed Mann Whitney U-test).
To extend these findings to solid tumors, we generated mosaic tumors using the B16.F10 melanoma model. In this set-up, we again observed the hallmarks of IFN-γ signaling in both antigen-positive (OVA+ B16) and antigen-negative (B16) cells in the presence of T cells (Fig. 3g-i). Thus, extensive bystander activity of T cell-derived IFN-γ is a property that also pertains to solid tumors.
Widespread and sustained STAT1 signaling in the tumor microenvironment
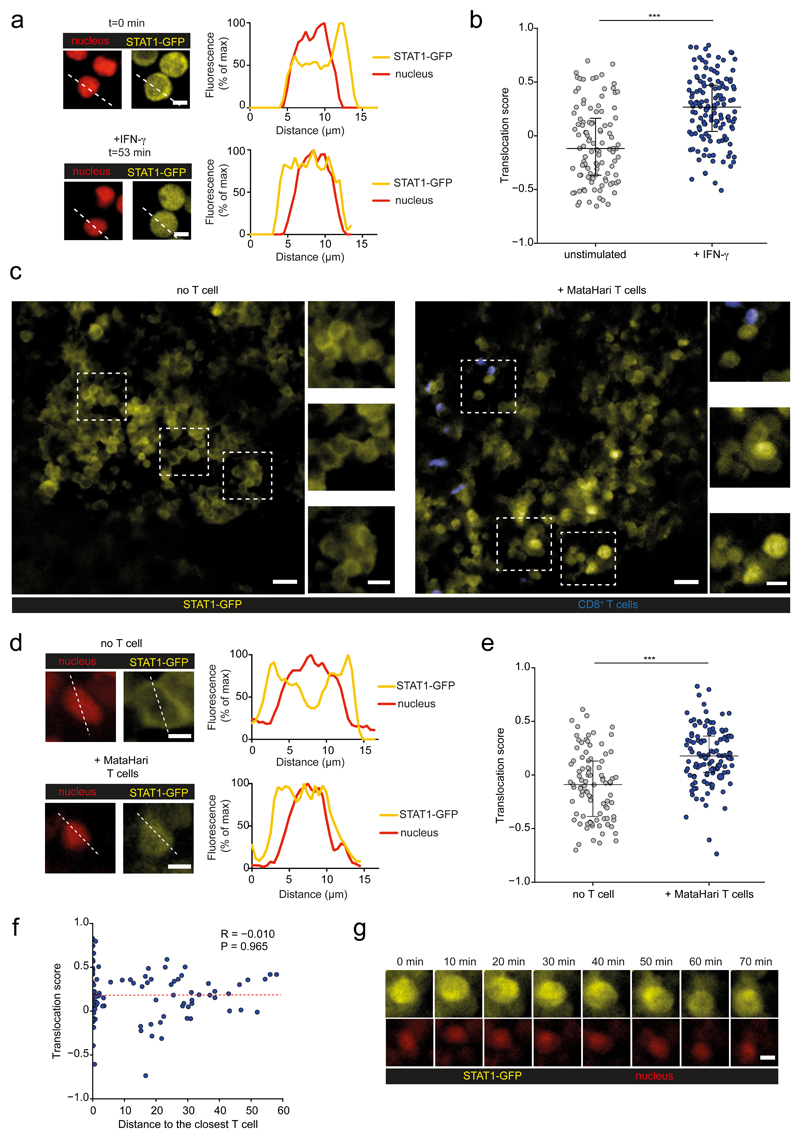
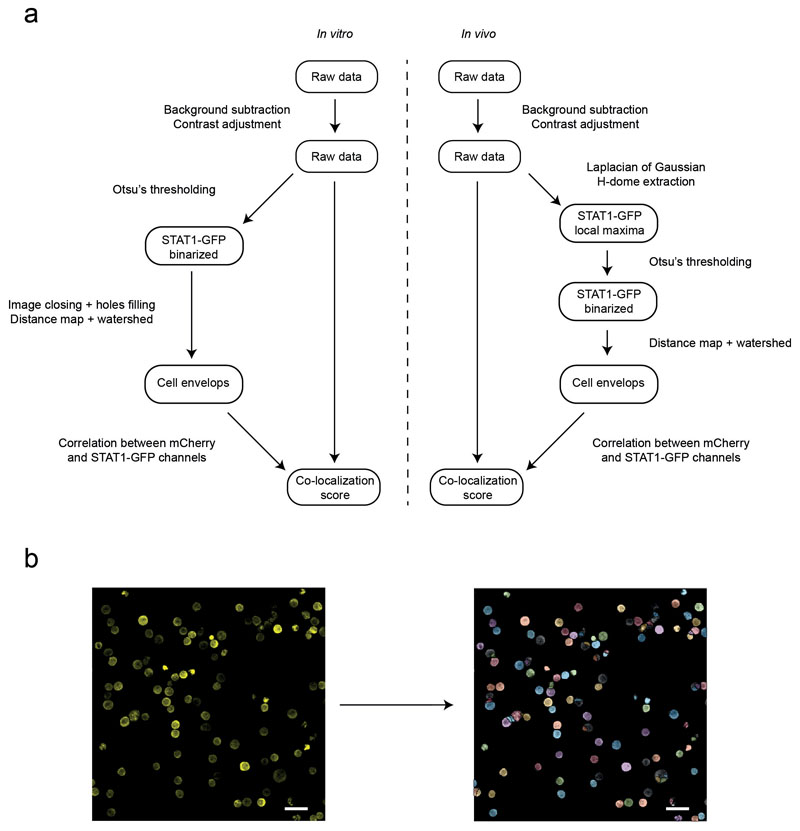
The observed bystander changes in tumor phenotype prompted us to better characterize the spatiotemporal dynamics of IFN-γ signaling in the tumor microenvironment. We focused on STAT1 translocation in tumor cells, as this represents an early event after cytokine exposure. To this end, we generated a fluorescent reporter combining a STAT1-GFP fusion protein and a nuclear mCherry protein, and introduced this probe into Eμ-myc lymphoma cells. As expected, in the absence of stimulation, STAT1-GFP was cytoplasmic and excluded from the nucleus (Fig. 4a). Upon in vitro addition of IFN-γ, a more uniform (cytoplasmic and nuclear localization) distribution of STAT1-GFP was rapidly observed confirming the translocation of a fraction of the STAT1-GFP pool (Fig. 4a). To quantify STAT1 translocation in multiple cells, we designed an automated image analysis procedure based on the detection of cell and nuclear shape and computing of Pearson correlation coefficients between STAT1-GFP and nuclear mCherry signals (Extended data Fig. 6). With this strategy, statistically distinct translocation scores were observed for cells in the presence or absence of IFN-γ (Fig. 4b).
Figure 4. T cells mediate widespread and sustained STAT1 activity in the tumor microenvironment.
a-b Male Eμ-myc B lymphoma cells were transduced to express a STAT1-GFP reporter and a nuclear mCherry protein. Measurement of STAT1 activity on Eμ-myc B cells cultured in the absence or presence of recombinant IFN-γ. a Images and graphs depict the quantification of STAT1-GFP (yellow) and nuclear mCherry (red) fluorescence intensity across the indicated lines for a representative cell prior to (upper panels) or after (lower panels) IFN-γ exposure. Scale bar, 5 μm. b Translocation score was computed automatically for cells prior to or after IFN-γ exposure. Each dot represents one cell (unstimulated n=106 cells, IFN-γ n=135 cells). (***, P<0.001, two-sided Tukey range test). Error bars indicate mean±SD. c-g Recipient female Rag2-/- mice were injected with H-Y+ Eμ-myc B lymphoma cells expressing the STAT1-GFP reporter and a nuclear mCherry protein. After 3 weeks, activated CD8+ T cells bearing the anti-H-Y MataHari TCR were injected i.v. Three days later, recipients were subjected to intravital imaging of the bone marrow. c-e Detection of nuclear STAT1-GFP in T cell-infiltrated tumors. c Representative two-photon images (scale bar: 20μm), highlighting three specific regions (insets, scale bar: 10μm) of the tumor in mice transferred or not with MataHari T cells. d Quantification of STAT1-GFP (yellow) and nuclear mCherry (red) fluorescence intensity across the indicated line for a representative tumor cell in mice left untreated (upper panels) or transferred with MataHari T cells (lower panels). Scale bar, 5 μm. e Translocation score was computed automatically from two-photon images obtained in mice left untreated (no T cells) or transferred with MataHari T cells. Each dot represents one tumor cell (no T cell n=92 cells, MataHari T cells n=115 cells). (***, P<0.001, two-sided Tukey range test). Error bars indicate mean±SD. f STAT1 translocation in tumor cells is largely independent of the distance to the nearest T cells. The translocation score is graphed for each tumor cell as a function of the calculated distance to the nearest T cell. Each dot represents one cell (n=115 cells; R represents Pearson's correlation coefficient, statistical significance was assessed using a Fisher test). g STAT1-GFP translocation is sustained in vivo. Representative time-lapse images showing the maintenance of STAT1-GFP translocation during the imaging period (scale bar: 5μm). Data shown in b-g are representative of two independent experiments with 3 mice per group in each experiment.
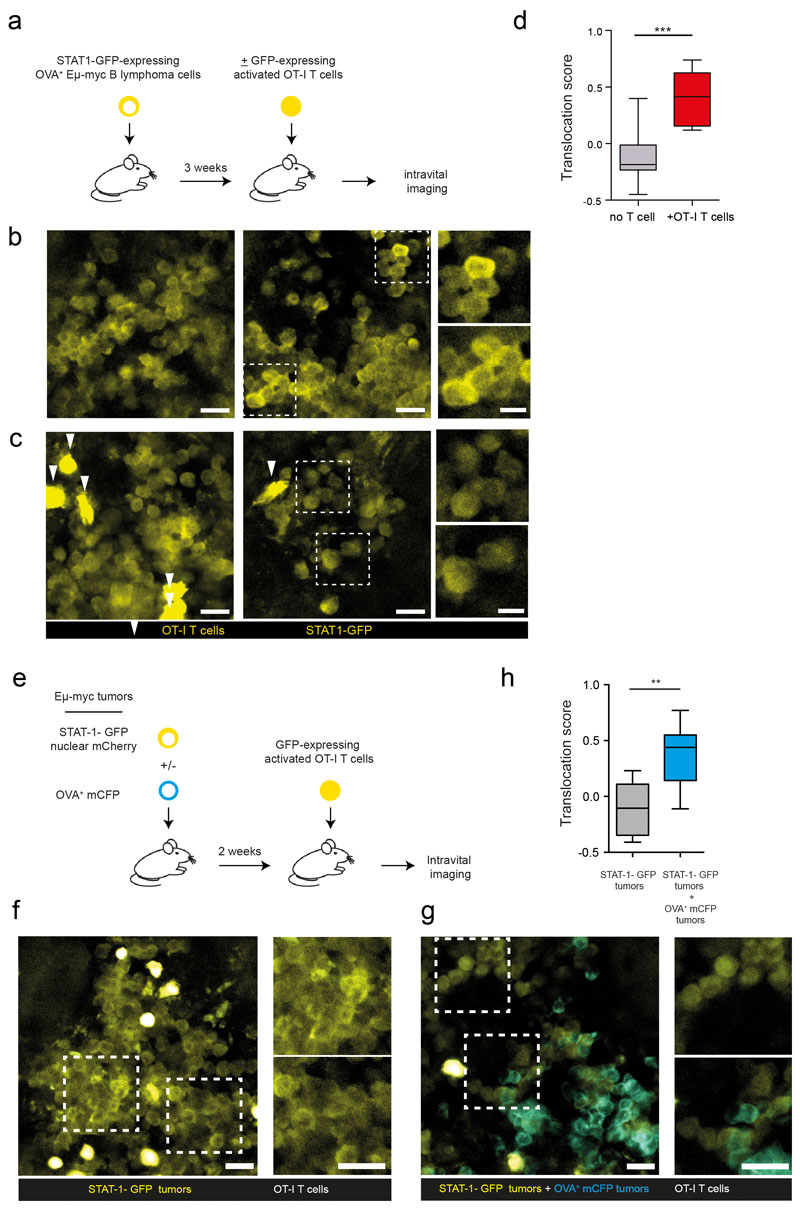
We therefore used these distinct patterns of STAT1 localization to identify cells with ongoing cytokine signaling in vivo by two-photon imaging. In a first model, we analyzed the response of H-Y+ B cell lymphoma in response to MataHari effector CD8+ T cells which express a H-Y specific transgenic TCR. In female Rag2-/- mice with established tumor expressing the fluorescent reporter, we predominantly observed a cytoplasmic-only distribution of STAT1-GFP, suggesting an absence of IFN-γ signaling (Fig. 4c-e). However, in mice that were also transferred with tumor-reactive MataHari effector CD8+ T cells, we observed evidence of cytokine signaling in a large number of tumor cells as detected by STAT1 translocation. This was evident from two-photon images (Fig. 4c-d) and confirmed by automated computing of STAT1 translocation scores (Fig. 4e). Importantly, STAT1 translocation was widespread and detected in tumor cells irrespective of whether they were contacting T cells or not. Consistently, there was no correlation between STAT1 translocation score in individual tumor cells and distance to the nearest T cells (Fig. 4f). Nuclear STAT1-GFP typically persisted throughout the imaging experiments (typically 1-2 hr) suggesting sustained signaling (Fig. 4g, Movie S2). To extend these results, we repeated these experiments in a second model relying on OVA+ Eμ-myc B cell lymphoma and OT-I CD8+ T cells. In this set-up also, nuclear STAT1-GFP was detected in the vast majority of tumor cells when OT-I effector CD8+ T cells were transferred but not in the absence of T cells (Extended data Fig. 7a-d, Movie S3). To further demonstrate the ability of T cell-derived IFN-γ to signal in distant tumor cells, we created mosaic tumors containing antigen-negative tumor that expressed the STAT1-GFP reporter and fluorescently labeled antigen-positive tumor cells. As shown in Extended data Fig. 7e-h, we detected increased STAT1 activity in antigen-negative tumor cells when T cells and antigen-positive tumor cells were present as compared to controls lacking antigen-positive tumor cells.
These results establish that STAT1 activity occurs at the tissue level rather than in discrete spots and indicate that STAT1 translocation does not require ongoing interactions with effector T cells.
Sustained IFN-γ signaling is required for alteration of tumor cell phenotype
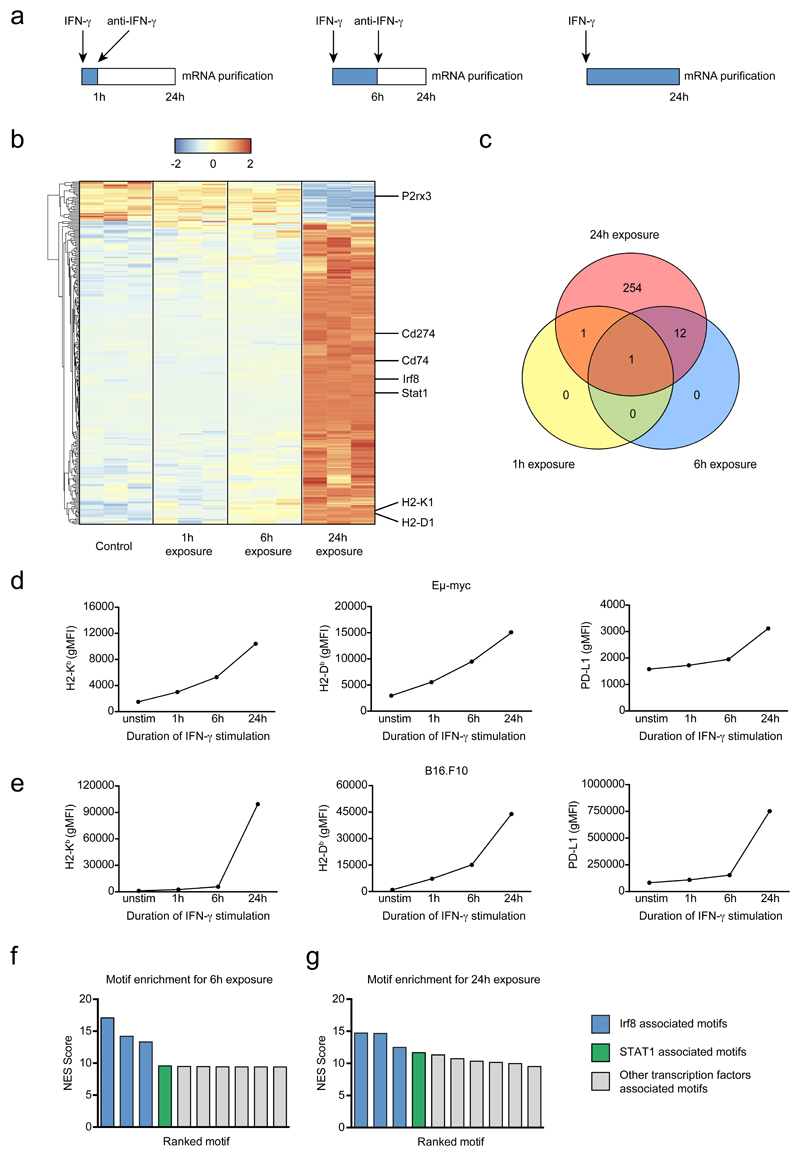
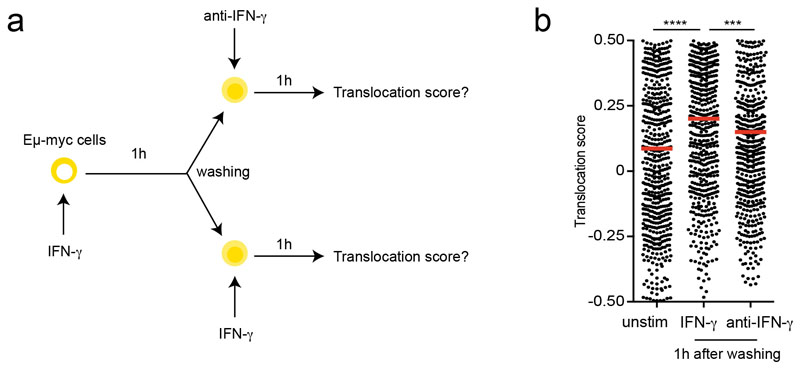
Early events of IFN-γ signaling including STAT1 phosphorylation and STAT1 translocation are typically detected within minutes of cytokine exposure 30. However, it is unclear whether transient or prolonged exposure to IFN-γ is required to alter tumor cell phenotype. We therefore designed an experiment in which Eμ-myc B lymphoma cells are cultured for a fixed period of time (24h) but exposed to IFN-γ during this period for variable amounts of time (by washing out the cytokine and adding a blocking anti-IFN-γ mAb to prevent any residual effects). RNAseq was then performed for these different stimulation patterns (Fig. 5a). We confirmed that sustained IFN-γ exposure resulted in prolonged STAT1 translocation (Extended data Fig. 8). As shown in Fig. 5b-c, the core of the response that included well-known IFN-γ responsive genes (Cd74, Cd274, H2-K1, H2-D1…), required at least 6-24h of cytokine exposure. Notably, cells exposed to IFN-γ for one hour were barely distinguishable for unstimulated cells. We confirmed these findings at the protein level for H2-Kb, H2-Db and PD-L1 using flow cytometry (Fig. 5d). In these settings, 6-24h of cytokine exposure was needed for substantial upregulation of these molecules. The need for long-lasting cytokine exposure was not restricted to B lymphoma cells as we observed a similar requirement for B16.F10 melanoma cells (Fig. 5e). Altogether, these results suggested that sustained exposure to IFN-γ is needed to drive phenotypic changes in tumor cells, including MHC class I and PD-L1 upregulation. Our transcriptomic analysis also revealed a strong enrichment of IRF8 and STAT1 motifs and that the expression of both transcription factors, IRF8 and STAT1, increased in response to IFN-γ (Fig. 5f-g). This raises the possibility that a two-step signaling activation, in which STAT1 and IRF8 upregulation by IFN-γ subsequently potentiates the cellular response to this cytokine, accounts for the requirement for sustained cytokine exposure.
Figure 5. Sustained signaling is required to alter tumor cell phenotype.
a Experimental set-up. Eμ-myc B lymphoma cells were stimulated with 5 ng.mL-1 IFN-γ. At 1h or 6h, the stimulation was blocked by adding 50 μg.mL-1 anti-IFN-γ mAb. At 24h, cells were recovered for mRNA sequencing. b Heatmap of differentially expressed genes. Gene expression is normalized by row. c Venn diagrams of differentially expressed genes between the various stimulated and control samples. d-e Tumor cells were stimulated with 5 ng.mL-1 IFN-γ. At 1h or 6h, the stimulation was blocked by adding 50 μg.mL-1 anti-IFN-γ mAb. At 24h, cells were recovered and analyzed by flow cytometry. Graphs represent H2-Kb (left), H2-Db (middle) and PD-L1 (right) surface expression after indicated durations of stimulation on Eμ-myc (d) and B16.F10 (e) models. Each dot represents the mean of 3 technical replicates. Representative of 3 independent experiments. f-g Normalized Enrichment Score of the ten most enriched motifs for the differentially expressed genes between 6h-stimulated (f) and 24h-stimulated (g) samples and control samples.
Probing IFN-γ activity in human melanoma
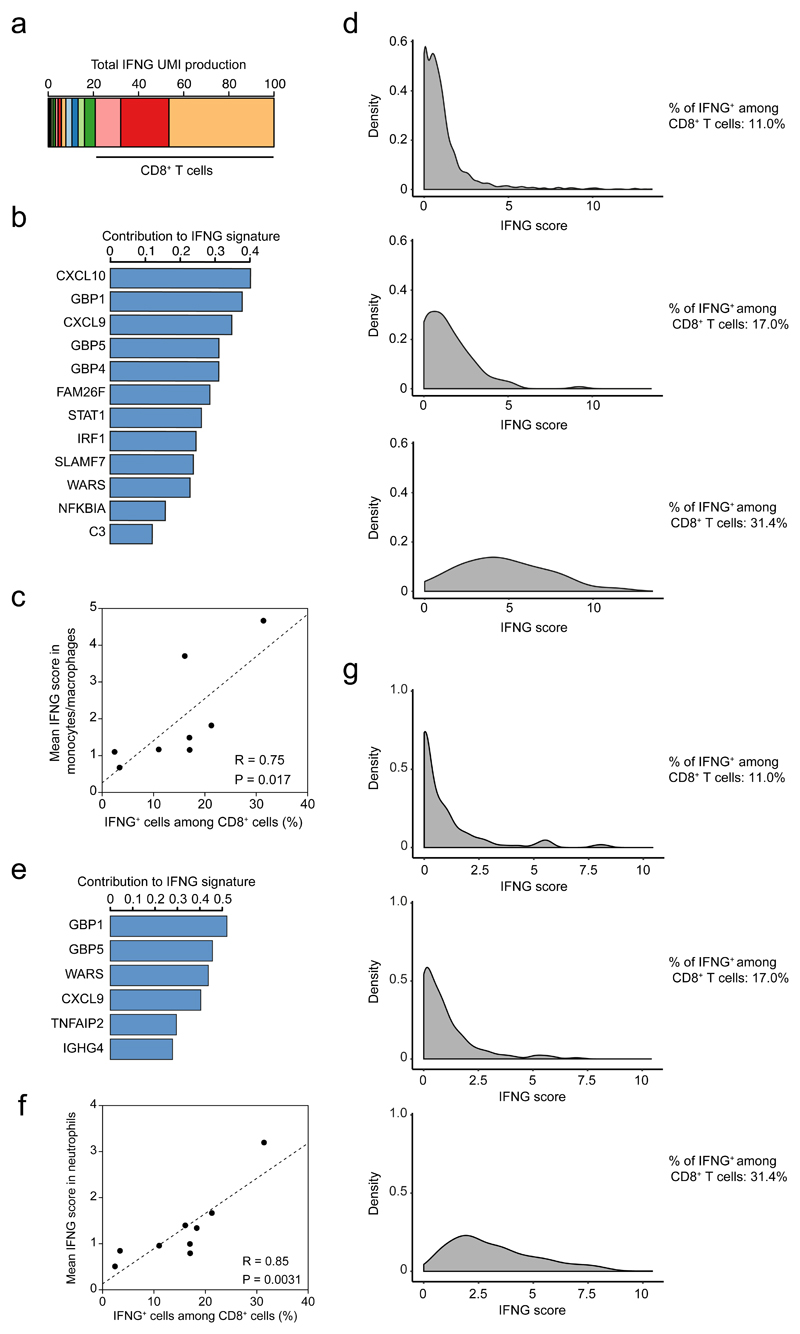
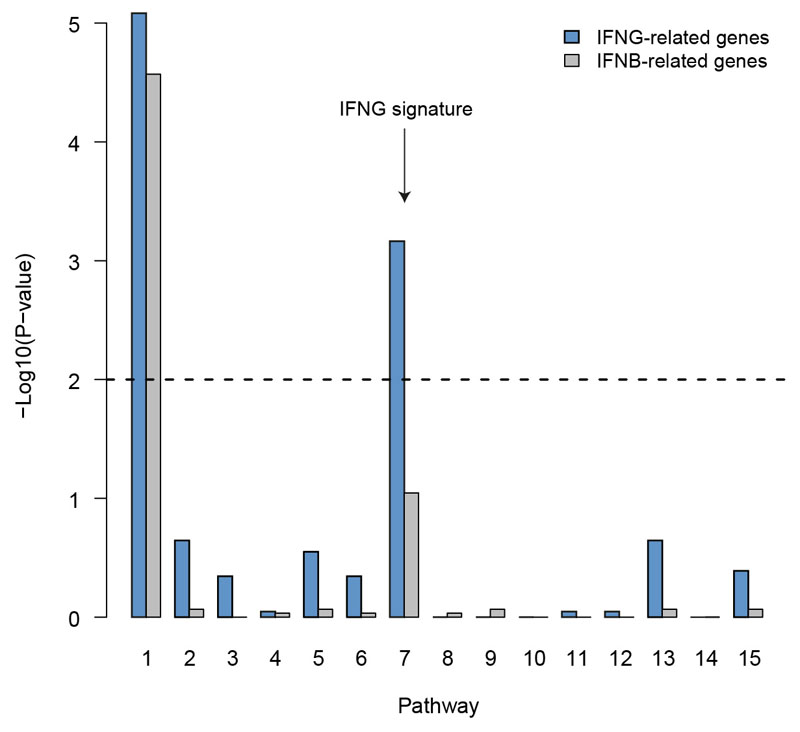
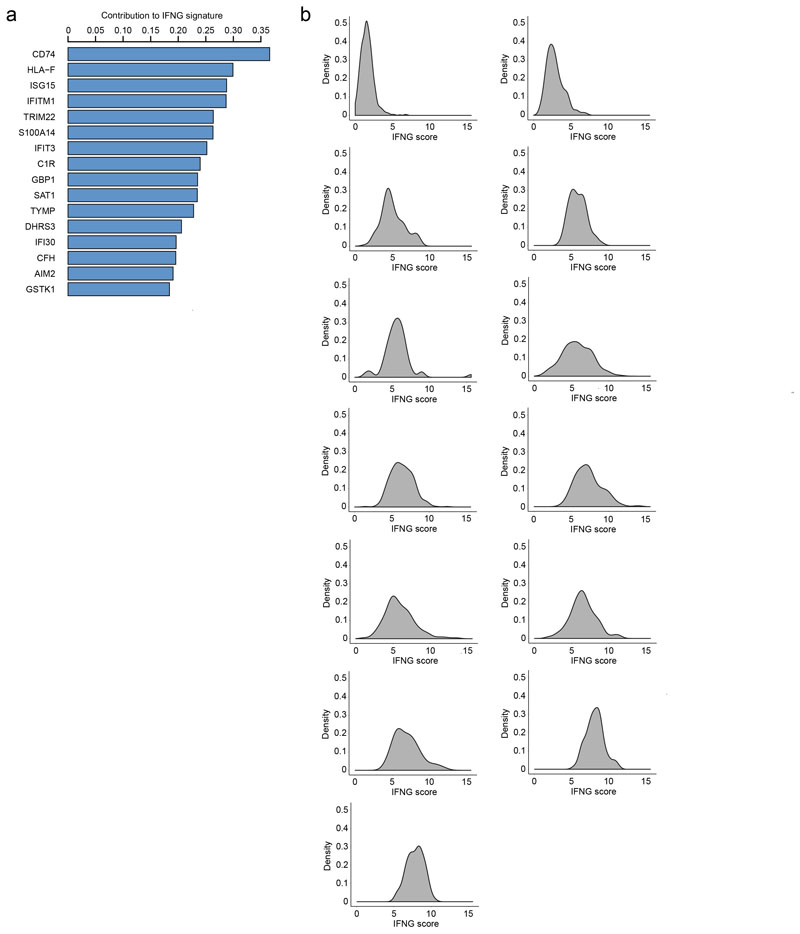
To test whether bystander IFN-γ activity also occurs in human tumors, we re-analyzed single-cell RNA-seq data from the immune infiltrate of 8 non-treated melanoma patients31. Overall, we found that CD8+ T cells were the main producers of IFN-γ as more than 80% of all IFN-γ mRNA molecules were specific to those cells (Fig. 6a). We decided to investigate the impact of IFN-γ production on the tumor microenvironment by focusing on the monocyte/macrophage population as a sensor of intratumoral IFN-γ. Of note, the low number of tumor cells present in the samples precluded us from performing the same analysis on those cells. By performing over-dispersion analysis32, we identified one module (noted as pathway 7, Extended data Fig. 9) specifically enriched in IFN-γ responsive gene (Fig. 6b). Remarkably, the mean IFN-γ signature in monocyte/macrophages was significantly correlated (R=0.91, p=0.0018, Fig. 6c) with the frequency of IFN-γ producing CD8+ T cells. Similarly, when repeating the analysis with intratumoral neutrophils, we observed an IFN-γ signature that was correlated with the fraction of IFN-γ producing T cells (Fig. 6e-f). These data suggest that, as observed in our mouse models, IFN-γ signals in multiple cell types of the tumor microenvironment. The observation that neutrophils, which are not typical tumor antigen-presenting cells, also harbor the IFN-γ signature suggests that they have received IFN-γ signals in a bystander fashion.
Figure 6. Assessing IFN-γ bystander activity in human melanoma samples.
Measurement of IFNG signature in the tumor microenvironment of melanoma patients using single-cell RNA-seq. a Contribution of distinct cell clusters to IFNG production. Data are compiled from all patients analyzed (n=8). b Gene contribution to the IFNG signature in the monocyte/macrophage cluster. c Association between the percentage of IFNG+ cells among CD8+ cells and the IFNG score in monocytes/macrophages. (R represents Pearson's correlation coefficient, statistical significance was assessed using a Fisher test). d Distribution of IFNG signature in monocytes/macrophages from three different patients harboring distinct indicated frequencies of IFNG+ CD8+ T cells. e Gene contribution to the IFNG signature in the neutrophil cluster. f Association between the percentage of IFNG+ cells among CD8+ cells and the IFNG score in neutrophils. (R represents Pearson's correlation coefficient, statistical significance was assessed using a Fisher test). g Distribution of IFNG signature in neutrophils from three different patients harboring distinct indicated frequencies of IFNG+ CD8+ T cells.
We also noted that in patients with a high density of IFN-γ producing T cells, the distribution of IFN-γ signature on monocyte and neutrophils appeared unimodally shifted toward higher values (Fig. 6g). This observation is compatible with relatively uniform IFN-γ activity in the tumor which was also observed in head and neck squamous cell carcinoma patients, as analyzed by single cell RNA sequencing in tumor cells (Extended data Fig. 10). Future studies assessing the spatial distribution of IFN-γ responsive gene in relation to T cell infiltration will help refine our understanding of cytokine propagation and signaling in human tumors.
Discussion
In the present study, we established the spatiotemporal dynamics of intratumoral T cell-derived IFN-γ in models of B cell lymphoma and melanoma. We provided evidence that the collective activity of effector T cells together with cytokine diffusion drive a tumor-wide response. Moreover, the formation of a sustained field of IFN-γ was required to alter tumor cell phenotype.
The range of cytokine activity is dependent on the production rate and levels, diffusion and consumption by other cells 19. Our results support the idea that T cell production of IFN-γ generates a widespread cytokine field shared by the majority of tumor cells and infiltrating immune cells. MHC class I expression was uniformly upregulated in the tumor microenvironment even in cells located at distance (>100 μm) from the sites of cognate T cell interactions, a feature that may favor tumor lysis by cytotoxic T cells. Conversely, the expression of the inhibitory ligand PD-L1 was also upregulated by IFN-γ in a bystander fashion. Thus, both potentially beneficial and deleterious effects of IFN-γ appeared to be regulated by a cytokine field, rather than by very discrete cytokine hotspots.
At first, these results may appear at odds with the well-established notion that IFN-γ is 20 33 34 produced by T cells at the immunological synapse with target cells 20, 33, 34, a phenomenon that should generate high local concentrations of IFN-γ at sites of antigen recognition and create extensive heterogeneity in cell responses. Our finding that prolonged exposure to IFN-γ is required to alter tumor cell phenotype likely provides an explanation for this apparent contradiction as these hotspots of cytokine will likely dissipate due to diffusion well before they have the time to generate a local biological effect.
A direct consequence for this mode of action is that the activity of IFN-γ will be determined at the tissue level by the overall number of cytokine-producing cells. In this model, the collective activity of T cells is essential as it determines the overall cytokine concentration and the extent of tumor cell response, in a manner resembling quorum sensing. Such a collective mode of action was recently described for nitric oxide-producing macrophages, where a single macrophage has a negligible intrinsic activity but a high number of NO-producing macrophages regulates activity at the tissue level in both NO-producing and non-producing cells 35, 36.
It has recently been shown that IFN-γ can bind to phosphatidylserine on the surface of tumor cells and be slowly released to prolong inflammation 30. Such mechanism, termed catch-and-release may favor the formation of relatively stable cytokine fields by temporally averaging cytokine availability in the tumor microenvironment. Binding of IFN-γ on the extracellular matrix should also achieve similar effects. It will be important to determine whether other cytokines rely on a similar global mode of signaling and assess how the superimposition of distinct cytokine fields may translate into complex biological responses at the tissue level, in particular in the context of tumor microenvironment. This is in particular relevant for TNF-α that can act synergistically with IFN-γ to induce tumor cell death. Cytokine consumption plays an important role in shaping the spatial range of cytokine activity 37 and may generate fields of different sizes for distinct cytokines, possibly creating functional heterogeneity in the tissue.
In summary, our work provides new insights into the spatiotemporal activity of intratumoral IFN-γ with important implication for anti-tumor immune responses. Single-cell RNA sequencing, as illustrated here, but also spatial transcriptomics 38, 39, 40 will help estimate the range of cytokine activity in human tumors. Finally, the use of systems immunology, together with the development of new probes to image cytokine propagation and activity in vivo, will be essential to establish the rules of cytokine-mediated communication at steady-state or during disease pathogenesis.
Methods
Mice and cell lines
6-8-week-old C57BL/6 mice were purchased from Charles River. Rag2-/-, Rag2-/-γc-/-, Rag1-/- OT-I TCR, UBC-GFP Rag1 -/- OT-I TCR, CFP (CFP expressed under the actin promoter), Rag2-/- MataHari TCR and Ifng-/- mice were bred and crossed in our animal facility. All experiments were performed in agreement with relevant guidelines and regulations and approved by the Institut Pasteur Committee on Animal Welfare (CETEA) under protocol code 170038. A lymphoma cell line was isolated from tumor-bearing male Eμ-myc transgenic mice 26, that develop spontaneous Burkitt-like lymphomas. This cell line was retrovirally transduced to express either CFP, GFP, YFP, mCFP, mCherry-NLS fluorescent proteins, ovalbumin, or STAT1-GFP fusion protein (all cloned in MSCV backbone). B16.F10 (B16) melanoma cells were kindly provided by Guy Shakhar.
Flow cytometry and antibodies
For ex vivo analyses, femurs and tibias were isolated from Eμ-myc tumor-bearing mice. Bone marrow cells were extracted by flushing the bones with PBS supplemented with 1mM EDTA and 0,5% FBS (FACS Buffer), and single-cell suspensions were prepared by filtering the cells through 70 μm cell strainers. For B16 tumor-bearing mice, tumors were harvested and cells were recovered by digesting the tumors with collagenase/DNAse for 30 min at 37°C, before crushing them on 70 μm cell strainers. All cells were then stained in FACS Buffer, supplemented with 4% normal mouse and rat sera and/or 10 μg.mL-1 anti-mouse CD16/32 (Fc Block), using a combination of fluorescent or biotin-labeled monoclonal antibodies among : CD8 (53-6.7, BD Biosciences), CD11b (M1/70, BioLegend), CD45 (30-F11, BD Biosciences), H2-Kb (AF6-88.5, BioLegend), H2-Db (KH95, BioLegend), Ly6C (HK1.4, BioLegend), Ly6G (1A8, BioLegend), NK1.1 (PK136, BioLegend), PD-L1 (10F.9G2 or MIH5, BioLegend or BD Biosciences respectively). IFN-γ intracellular stainings were performed using the Cytofix/Cytoperm kit (BD Biosciences) according to the manufacturer’s guidelines, and XMG1.2 mAb (eBiosciences). IFN-γ expression was assayed in the presence of 1 μg.mL-1 Brefeldin A. Samples were analyzed using a BD FACSCanto II or a Cytoflex LX (Beckman Coulter) flow cytometer. Data analysis was performed using FlowJo v10.4.1 (Tree Star).
Tumor models and T cell adoptive transfer
B cell lymphomas were established by injecting 1x10⁶ Eμ-myc cells intravenously in the indicated recipients. Melanoma tumors were established by inoculating 2x10⁶ B16 cells sub-cutaneously. Splenocytes from MataHari TCR transgenic mice or OT-I TCR transgenic mice were isolated and red blood cells were removed by ACK lysis. One third of the cells was then pulsed with 50μM of H-2Db–restricted Uty246-254 peptide (WMHHNMLDI) or H-2Kb–restricted OVA257–264 peptide (SIINFEKL) for 2 hours in RPMI medium 1640-Glutamax™ at 37°C. The rest of the cells was incubated at 37°C in complete medium supplemented with 50 μg.mL-1 gentamycin. The two populations were then mixed and cultured for 2 to 3 days. Cells were then subjected to Ficoll gradient centrifugation to remove dead cells and cultured in complete medium containing human interleukin-2 (25 IU/mL; Roche or R&D). For proper in vitro activation, IFN-γ-deficient T cells were supplemented with 100 ng.mL-1 IFN-γ (Invitrogen). Cells were used on days 4-8, at which time >95% were CD8+ T cells. When indicated, T cells were retrovirally transduced to express mCherry as described 41. Tumor-bearing mice were adoptively transferred with cultured T cells by intravenous injection of 20x106 cells. For experiments using CAR T cells, B cell lymphoma injection, conditioning and CAR T cell transfer were performed as previously described 41.
Intravital two-photon imaging
Bone marrow imaging was performed as described 41. Mice were anaesthetized with a mixture of xylazine (Rompun®, 10 mg/kg) and ketamine (Imalgène®, 100 mg/kg), which was replenished hourly. During imaging, the mice temperature was maintained at 37°C with a heating pad. Two-photon imaging was performed with an upright microscope FVMPE-RS (OLYMPUS) and a 25x/1.05 NA water-dipping objective (OLYMPUS). Excitation was provided by an Insight deep see dual laser (Spectra physics) tuned at 920 or 960 nm. The following filters were used for fluorescence detection: CFP (483/32), GFP (520/35), YFP (542/27), background (593/35) and mCherry (624/40). To create time-lapse sequences, we typically scanned a 30 to 40 μm-thick volume of tissue at 5 μm Z-steps and 60s intervals.
Image analysis
Movies were processed and analyzed with Imaris software (Bitplane) or Fiji software (ImageJ 1.50 i). Movies and figures based on two-photon microscopy are shown as 2D maximum intensity projections of 3D data. For optimal contrast rendering, GFP was pseudo-colored in yellow in some images. Contact durations were calculated manually based on close apposition between a given T cell and a tumor cell. To perform an un-biased analysis of STAT1-GFP translocation, we developed an in-house Matlab® script that first automatically detects cell envelope and cell nuclei and then computes a translocation score. Briefly both STAT1-GFP and nuclear mCherry channels are first binarized using Otsu's method. Image closing with a circular structuring element is then applied to the STAT1-GFP binarized image, followed by a filling of the holes. Euclidean distance transform is then applied to both binarized images before using watershed segmentation tool to segment the contiguous cells. For each identified cell, Pearson correlation between STAT1-GFP and mCherry signal is computed and considered as a good proxy for STAT1-GFP translocation (translocation score). This strategy was applied to both in vitro and in vivo data, however due to the increased background signal in in vivo images, we added a step of contrast enhancement before image binarization: first a Laplacian Of Gaussian (LOG) filter with a sigma parameter of size equal to the estimated size of the cells is used, followed by the extraction of the local peak with a h-dome transform 42. Whenever the automated segmentation was not sufficiently accurate, we performed manual cell segmentation and computed the Pearson correlation coefficient using the ROI manager and coloc2 Fiji plugins.
mRNA sequencing and analysis
mRNA sequencing was performed on cultured Eμ-myc cells (New York Genome Center). mRNAs were extracted using the RNeasy® Mini Kit (Qiagen) according to the manufacturer's guidelines. RNA sequencing libraries were prepared using the TruSeq Stranded mRNA Library Preparation Kit in accordance with the manufacturer's instructions. Briefly, 500ng of total RNA was used for purification and fragmentation of mRNA. Purified mRNA underwent first and second strand cDNA synthesis. cDNA was then adenylated, ligated to Illumina sequencing adapters, and amplified by PCR (using 10 cycles). Final libraries were evaluated using fluorescent-based assays including PicoGreen (Life Technologies) or Qubit Fluorometer (invitrogen) and Fragment Analyzer (Advanced Analytics) or BioAnalyzer (Agilent 2100) and were sequenced on an Illumina HiSeq2500 sequencer (v4 chemistry) using 2 x 125bp cycles.
rRNA abundance was measured by mapping with Bowtie2. Quality control was performed using Picard and RSeQC. The reads were aligned with STAR (version 2.5.2a), and genes annotated in Gencode vM16 were quantified with featureCounts (v1.4.3-p1). Normalization and differential expression was done with the Bioconductor package DESeq2 (v1.18.1).
Differential expression analysis as well as normalization were performed using the DESeq2 package (version 1.18.1) on R (version 3.4.3). Analysis was performed according to the recommendation of the package with the same parameter excepting the log2 fold change shrinkage method parameter that was set to 'apeglm'. A gene was considered as significantly differentially expressed if its corresponding adjusted p-value was lower than 0.01 and its absolute shrinked log2 fold change bigger than 1. Expression heatmap was performed using the pheatmap package with Ward's criterion used for the hierarchical clustering.
Enrichment of specific Transcription Factor (TF) binding motifs in the promoter of up-regulated genes was performed using the iRegulon Cytoscape plugin 43. Mus musculus was chosen as the reference species and all other parameters were set to default except the putative regulatory region and motif ranking databases that were set to '500 bp upstream'.
Single cell RNA-Seq Data Clustering and Analysis
The two single cell RNA-Seq datasets were downloaded on Gene Expression Omnibus repository (accession numbers GSE123139 and GSE103322 for the Melanoma and HNSCC data respectively). Annotations were loaded using the GEOquery package (version 2.48.0). As the HNSCC data were already processed (provided as Log(TPM+1) data), we used two slightly different settings for data pre-processing. In the case of the melanoma data, we processed as follows. In order to avoid removing populations of small-sized cells, a relatively low UMI threshold (350 UMIs) was used in the first instance to filter out low quality cells. Genes with less than 300 UMIs expressed were also removed to reduce computation cost and time. The filtered data were then analyzed using PAGODA2 pipeline (https://github.com/hms-dbmi/pagoda2) 44. Expression values and variance were scaled as described in 44. It is important to note that while the first version of PAGODA was relying on gene set analysis to perform cell clustering, PAGODA2 performs most of the analytical steps without any gene set analysis. The general approach used is similar to the one described at https://github.com/hms-bmi/pagoda2/blob/master/vignettes/pagoda2.walkthrough.oct2018.md/. First gene variance was corrected and highly variable genes identified using the adjustVariance function (gam.k=10). The 100 first components of Principal Component Analysis based on the 3000 most variable genes were then computed using the calculatePcaReduction function. Then a K-Nearest-Neighbors (KNN) graph was computed based on the PCA reduction through the makeKnnGraph function (k=30). Cosine distance was used at this stage to increase the robustness of the analysis. Lastly Louvain community detection clustering was performed on the KNN graph using the getKnnClusters function and the multilevel.community functions from the igraph R package. Once the cells were clustered, we identified all genes that were significantly expressed by cells from a given cluster compared to all other cells identified using the PAGODA2 function getDifferentialGenes that performs Kruskal-Wallis test, with default parameters (corrected Z-score > 3, upregulated.only=TRUE). Using this gene list, we annotated the various cell cluster based on the specific expression of well-known immune marker (CD3, CD8A, TRBC2 etc..). Low dimensional embedding of the data was performed using UMAP algorithm 45. The uwot package implementation was used (https://github.com/jlmelville/uwot). PCA dimensionality reductions computed using PAGODA2 was used as input data. N_neighbors parameter was set to 40, spread parameter to 4 and cosine metric was used. In the case of the HNSCC, the data were already normalized and were loaded into a Pagoda2 object with parameter 'modelType' set to 'raw'. For the next steps of the analysis, the 50 first PCs were used, the 1000 most variables genes were selected, K parameter was set to 15 and cosine distance used.
Analysis of Over-Dispersed Pathways
In order to detect biologically meaningful gene modules/pathways in a robust manner, we performed pathway over-dispersion analysis using de-novo gene-sets. We first selected a given cell population and performed gene expression and variance normalization on the raw UMI counts as described above. The variable genes were selected using the getOdGenes function from PAGODA2 package with the 200 top genes selected. These genes were then grouped into 15 pathways using hierarchical clustering (Ward linkage and correlation-based distance). Over-dispersion of these pathways was computed using the testPathwayOverdispersion function from the same package with default parameters. Gene set enrichment was performed through a binomial test (binom.test function, alternative = 'greater') using the 200 most variable genes as the reference 'universe'. The 'HALLMARK INTERFERON ALPHA RESPONSE' and 'HALLMARK INTERFERON GAMMA RESPONSE' gene sets were downloaded from the GSEA website (http://software.broadinstitute.org/gsea/msigdb/cards). Multiple testing correction was performed using the Benjamini-Hochberg method (p.adjust R function).
Association between IFNG score and IFNG production
In the case of melanoma dataset, the macrophage population was identified as the C1Q/APOE expressing cluster. IFNG score was computed using the testPathwayOverdispersion function as described above for the macrophage population and it mean value computed for each patient. Neutrophils identified as the S100A8/S100A9/Lyz expressing cluster. Patients with less than 25 macrophages or neutrophils were removed from the analysis. The fraction of IFNG-expressing CD8+ T cells among T cells was computed by computing the number of cells annotated as coming from a 'CD3' gating that belongs to a CD8+ T cell RNA-seq cluster and has more than zero UMI coming from the IFNG gene. Association between the two was assessed using a simple linear regression model (lm R function). Significance of the association was checked using Fisher's test (anova R function). Correlation was estimated with the cor R function. For head and neck squamous cell carcinoma samples, patients with less than 50 tumor cells in the dataset were removed from the analysis.
Statistics and reproducibility
All statistical tests were performed using GraphPad Prism v.6. Points in graphs indicate individual mice, and lines indicate means. In bar graphs, bars indicate means, and error bars indicate sample standard deviation (SD). Statistical tests employed are detailed in figure legends. No statistical method was used to predetermine sample size. No data were excluded from the analyses. The experiments were not randomized. The investigators were not blinded to allocation during the experiments and outcome assessment.
Reporting Summary
Further information on research design is available in the Nature Research Reporting Summary linked to this article.
Extended Data
Supplementary Material
Acknowledgments
We thank members of the Bousso laboratory for critical review of the manuscript. We acknowledge the mouse facility and Technology Core of the Center for Translational Science (CRT) at Institut Pasteur for support in conducting this study. The work was supported by Institut Pasteur, Inserm, a Starting (Lymphocytecontact) and an Advanced grant (ENLIGHTEN) from the European Research Council (P.B) and by the Bristol-Myers Squibb Foundation for Research in Immuno-Oncology.
Footnotes
Data availability
The data that support the findings of this study are available from the corresponding author upon reasonable request. RNA-seq data reported in this paper are deposited in NCBI Gene Expression Omnibus (GEO) database (GSE140191). Previously published human single-cell RNA sequencing data that were re-analysed here are available under accession codes GSE123139 and GSE103322. All other data supporting the findings of this study are available from the corresponding author on reasonable request.
Code availability
The code for automated quantification of STAT1 translocation is available on GitHub (https://github.com/PierreBSC/IFNG_Cancer_project)
Author contributions
R.T., I.M., M.C., F.L., Z.G., B.B., C.C conducted the experiments. R.T., I.M., M.C. and Ph.B. designed the experiments, I.A., B.S. contributed to sequencing analysis, R.T., I.M., M.C., Pierre.B., and Ph.B. analyzed the data and wrote the manuscript.
Competing interests statement
The authors declare no competing interests.
References
- 1.Kaplan DH, et al. Demonstration of an interferon gamma-dependent tumor surveillance system in immunocompetent mice. Proc Natl Acad Sci US A. 1998;95:7556–7561. doi: 10.1073/pnas.95.13.7556. [DOI] [PMC free article] [PubMed] [Google Scholar]
- 2.Street SE, Cretney E, Smyth MJ. Perforin and interferon-gamma activities independently control tumor initiation, growth, and metastasis. Blood. 2001;97:192–197. doi: 10.1182/blood.v97.1.192. [DOI] [PubMed] [Google Scholar]
- 3.Dunn GP, Koebel CM, Schreiber RD. Interferons, immunity and cancer immunoediting. Nat Rev Immunol. 2006;6:836–848. doi: 10.1038/nri1961. [DOI] [PubMed] [Google Scholar]
- 4.Garris CS, et al. Successful Anti-PD-1 Cancer Immunotherapy Requires T Cell-Dendritic Cell Crosstalk Involving the Cytokines IFN-gamma and IL-12. Immunity. 2018;49:1148–1161 e1147. doi: 10.1016/j.immuni.2018.09.024. [DOI] [PMC free article] [PubMed] [Google Scholar]
- 5.Gao J, et al. Loss of IFN-gamma Pathway Genes in Tumor Cells as a Mechanism of Resistance to Anti-CTLA-4 Therapy. Cell. 2016;167:397–404 e399. doi: 10.1016/j.cell.2016.08.069. [DOI] [PMC free article] [PubMed] [Google Scholar]
- 6.Chin YE, et al. Cell growth arrest and induction of cyclin-dependent kinase inhibitor p21 WAF1/CIP1 mediated by STAT1. Science. 1996;272:719–722. doi: 10.1126/science.272.5262.719. [DOI] [PubMed] [Google Scholar]
- 7.Ikeda H, Old LJ, Schreiber RD. The roles of IFN gamma in protection against tumor development and cancer immunoediting. Cytokine Growth Factor Rev. 2002;13:95–109. doi: 10.1016/s1359-6101(01)00038-7. [DOI] [PubMed] [Google Scholar]
- 8.Braumuller H, et al. T-helper-1-cell cytokines drive cancer into senescence. Nature. 2013;494:361–365. doi: 10.1038/nature11824. [DOI] [PubMed] [Google Scholar]
- 9.Wang W, et al. CD8(+) T cells regulate tumour ferroptosis during cancer immunotherapy. Nature. 2019;569:270–274. doi: 10.1038/s41586-019-1170-y. [DOI] [PMC free article] [PubMed] [Google Scholar]
- 10.Kammertoens T, et al. Tumour ischaemia by interferon-gamma resembles physiological blood vessel regression. Nature. 2017;545:98–102. doi: 10.1038/nature22311. [DOI] [PMC free article] [PubMed] [Google Scholar]
- 11.Meunier MC, et al. T cells targeted against a single minor histocompatibility antigen can cure solid tumors. Nat Med. 2005;11:1222–1229. doi: 10.1038/nm1311. [DOI] [PubMed] [Google Scholar]
- 12.Groom JR, Luster AD. CXCR3 ligands: redundant, collaborative and antagonistic functions. Immunol Cell Biol. 2011;89:207–215. doi: 10.1038/icb.2010.158. [DOI] [PMC free article] [PubMed] [Google Scholar]
- 13.Takeda K, et al. IFN-gamma is required for cytotoxic T cell-dependent cancer genome immunoediting. Nat Commun. 2017;8 doi: 10.1038/ncomms14607. 14607. [DOI] [PMC free article] [PubMed] [Google Scholar]
- 14.Garcia-Diaz A, et al. Interferon Receptor Signaling Pathways Regulating PD-L1 and PD-L2 Expression. Cell Rep. 2017;19:1189–1201. doi: 10.1016/j.celrep.2017.04.031. [DOI] [PMC free article] [PubMed] [Google Scholar]
- 15.Dong H, et al. Tumor-associated B7-H1 promotes T-cell apoptosis: a potential mechanism of immune evasion. Nat Med. 2002;8:793–800. doi: 10.1038/nm730. [DOI] [PubMed] [Google Scholar]
- 16.Freeman GJ, et al. Engagement of the PD-1 immunoinhibitory receptor by a novel B7 family member leads to negative regulation of lymphocyte activation. J Exp Med. 2000;192:1027–1034. doi: 10.1084/jem.192.7.1027. [DOI] [PMC free article] [PubMed] [Google Scholar]
- 17.Pai CS, et al. Clonal Deletion of Tumor-Specific T Cells by Interferon-gamma Confers Therapeutic Resistance to Combination Immune Checkpoint Blockade. Immunity. 2019;50:477–492 e478. doi: 10.1016/j.immuni.2019.01.006. [DOI] [PMC free article] [PubMed] [Google Scholar]
- 18.Benci JL, et al. Tumor Interferon Signaling Regulates a Multigenic Resistance Program to Immune Checkpoint Blockade. Cell. 2016;167:1540–1554 e1512. doi: 10.1016/j.cell.2016.11.022. [DOI] [PMC free article] [PubMed] [Google Scholar]
- 19.Altan-Bonnet G, Mukherjee R. Cytokine-mediated communication: a quantitative appraisal of immune complexity. Nat Rev Immunol. 2019;19:205–217. doi: 10.1038/s41577-019-0131-x. [DOI] [PMC free article] [PubMed] [Google Scholar]
- 20.Huse M, Lillemeier BF, Kuhns MS, Chen DS, Davis MM. T cells use two directionally distinct pathways for cytokine secretion. Nat Immunol. 2006;7:247–255. doi: 10.1038/ni1304. [DOI] [PubMed] [Google Scholar]
- 21.Helmstetter C, et al. Individual T helper cells have a quantitative cytokine memory. Immunity. 2015;42:108–122. doi: 10.1016/j.immuni.2014.12.018. [DOI] [PMC free article] [PubMed] [Google Scholar]
- 22.Honda T, et al. Tuning of antigen sensitivity by T cell receptor-dependent negative feedback controls T cell effector function in inflamed tissues. Immunity. 2014;40:235–247. doi: 10.1016/j.immuni.2013.11.017. [DOI] [PMC free article] [PubMed] [Google Scholar]
- 23.Sanderson NS, et al. Cytotoxic immunological synapses do not restrict the action of interferon-gamma to antigenic target cells. Proc Natl Acad Sci USA. 2012;109:7835–7840. doi: 10.1073/pnas.1116058109. [DOI] [PMC free article] [PubMed] [Google Scholar]
- 24.Perona-Wright G, Mohrs K, Mohrs M. Sustained signaling by canonical helper T cell cytokines throughout the reactive lymph node. Nature immunology. 2010;11:520–526. doi: 10.1038/ni.1866. [DOI] [PMC free article] [PubMed] [Google Scholar]
- 25.Müller AJ, et al. CD4+ T cells rely on bystander effector activity to control local infection. Immunity. 2012 [Google Scholar]
- 26.Harris AW, et al. The E mu-myc transgenic mouse. A model for high-incidence spontaneous lymphoma and leukemia of early B cells. The Journal of experimental medicine. 1988;167:353–371. doi: 10.1084/jem.167.2.353. [DOI] [PMC free article] [PubMed] [Google Scholar]
- 27.Hart IR. The selection and characterization of an invasive variant of the B16 melanoma. Am J Pathol. 1979;97:587–600. [PMC free article] [PubMed] [Google Scholar]
- 28.Sugiura K, Stock CC. Studies in a tumor spectrum. I. Comparison of the action of methylbis (2-chloroethyl)amine and 3-bis(2-chloroethyl)aminomethyl-4-methoxymethyl -5-hydroxy-6-methylpyridine on the growth of a variety of mouse and rat tumors. Cancer. 1952;5:382–402. doi: 10.1002/1097-0142(195203)5:2<382::aid-cncr2820050229>3.0.co;2-3. [DOI] [PubMed] [Google Scholar]
- 29.Milo I, et al. The immune system profoundly restricts intratumor genetic heterogeneity. Sci Immunol. 2018;3 doi: 10.1126/sciimmunol.aat1435. [DOI] [PubMed] [Google Scholar]
- 30.Oyler-Yaniv J, et al. Catch and Release of Cytokines Mediated by Tumor Phosphatidylserine Converts Transient Exposure into Long-Lived Inflammation. Mol Cell. 2017;66:635–647 e637. doi: 10.1016/j.molcel.2017.05.011. [DOI] [PMC free article] [PubMed] [Google Scholar]
- 31.Li H, et al. Dysfunctional CD8 T Cells Form a Proliferative, Dynamically Regulated Compartment within Human Melanoma. Cell. 2019;176:775–789 e718. doi: 10.1016/j.cell.2018.11.043. [DOI] [PMC free article] [PubMed] [Google Scholar]
- 32.Fan J, et al. Characterizing transcriptional heterogeneity through pathway and gene set overdispersion analysis. Nat Methods. 2016;13:241–244. doi: 10.1038/nmeth.3734. [DOI] [PMC free article] [PubMed] [Google Scholar]
- 33.Kupfer A, Mosmann TR, Kupfer H. Polarized expression of cytokines in cell conjugates of helper T cells and splenic B cells. Proc Natl Acad Sci US A. 1991;88:775–779. doi: 10.1073/pnas.88.3.775. [DOI] [PMC free article] [PubMed] [Google Scholar]
- 34.Egen JG, et al. Intravital imaging reveals limited antigen presentation and T cell effector function in mycobacterial granulomas. Immunity. 2011;34:807–819. doi: 10.1016/j.immuni.2011.03.022. [DOI] [PMC free article] [PubMed] [Google Scholar]
- 35.Olekhnovitch R, Ryffel B, Muller AJ, Bousso P. Collective nitric oxide production provides tissue-wide immunity during Leishmania infection. The Journal of clinical investigation. 2014 doi: 10.1172/JCI72058. [DOI] [PMC free article] [PubMed] [Google Scholar]
- 36.Postat J, Olekhhnovitch R, Lemaïtre F, Bousso P. A metabolism-based quorum sensing mechanism contributes to termination of inflammatory responses. Immunity. 2018;49 doi: 10.1016/j.immuni.2018.07.014. 654665. [DOI] [PubMed] [Google Scholar]
- 37.Oyler-Yaniv A, et al. A Tunable Diffusion-Consumption Mechanism of Cytokine Propagation Enables Plasticity in Cell-to-Cell Communication in the Immune System. Immunity. 2017;46:609–620. doi: 10.1016/j.immuni.2017.03.011. [DOI] [PMC free article] [PubMed] [Google Scholar]
- 38.Stahl PL, et al. Visualization and analysis of gene expression in tissue sections by spatial transcriptomics. Science. 2016;353:78–82. doi: 10.1126/science.aaf2403. [DOI] [PubMed] [Google Scholar]
- 39.Shah S, Lubeck E, Zhou W, Cai L. seqFISH Accurately Detects Transcripts in Single Cells and Reveals Robust Spatial Organization in the Hippocampus. Neuron. 2017;94:752–758 e751. doi: 10.1016/j.neuron.2017.05.008. [DOI] [PubMed] [Google Scholar]
- 40.Wang X, et al. Three-dimensional intact-tissue sequencing of single-cell transcriptional states. Science. 2018;361 doi: 10.1126/science.aat5691. [DOI] [PMC free article] [PubMed] [Google Scholar]
- 41.Cazaux M, et al. Single-cell imaging of CAR T cell activity in vivo reveals extensive functional and anatomical heterogeneity. J Exp Med. 2019 doi: 10.1084/jem.20182375. [DOI] [PMC free article] [PubMed] [Google Scholar]
- 42.Vincent L. Morphological grayscale reconstruction in image analysis: applications and efficient algorithms. IEEE Trans Image Process. 1993;2:176–201. doi: 10.1109/83.217222. [DOI] [PubMed] [Google Scholar]
- 43.Janky R, et al. iRegulon: from a gene list to a gene regulatory network using large motif and track collections. PLoS Comput Biol. 2014;10:e1003731. doi: 10.1371/journal.pcbi.1003731. [DOI] [PMC free article] [PubMed] [Google Scholar]
- 44.Lake BB, et al. Integrative single-cell analysis of transcriptional and epigenetic states in the human adult brain. Nature biotechnology. 2018;36:70–80. doi: 10.1038/nbt.4038. [DOI] [PMC free article] [PubMed] [Google Scholar]
- 45.McInnes L, Healy J, Melville J. UMAP: uniform manifold approximation and projection for dimension reduction. arXiv: 1802.03426. 2018 [Google Scholar]
Associated Data
This section collects any data citations, data availability statements, or supplementary materials included in this article.


