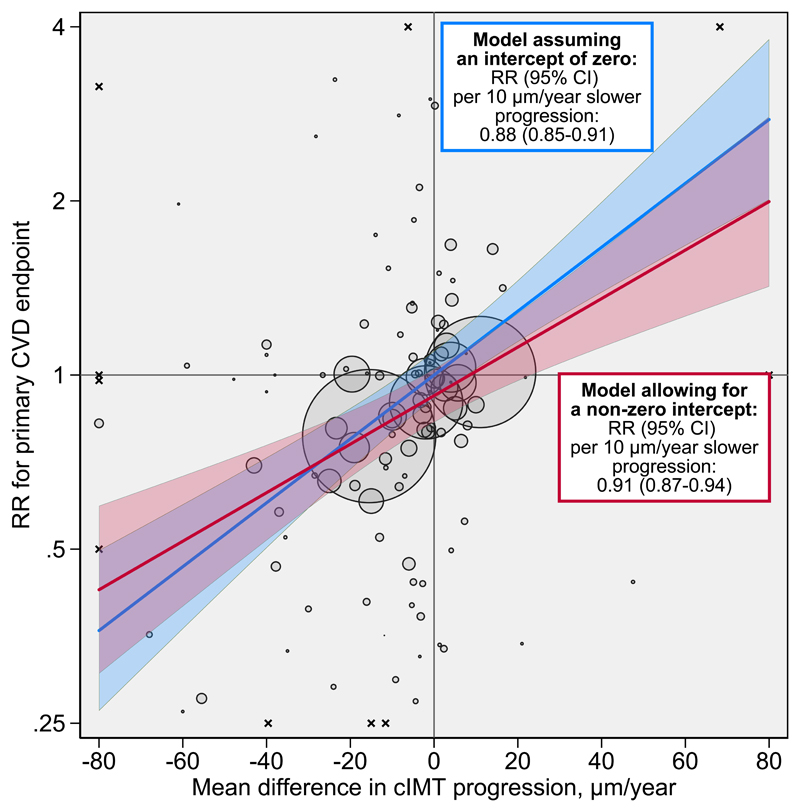
Figure 1. Intervention effects on cIMT progression plotted against intervention effects on risk for the primary CVD endpoint.
The intercept of the primary model was 0.92 (95% CI 0.87-0.97). Each bubble represents a trial. Trials with point estimates outside of this area are indicated with the symbol x. The areas of the bubbles are proportional to the inverse variance of the log relative risk for the primary CVD endpoint. The shaded areas around lines-of-fit are 95% prediction intervals. For purpose of presentation, the graph area was limited to -80 to 80 μm/year on the horizontal axis and 0.25 to 4 on the vertical axis. Abbreviations: CI=credible interval. cIMT=carotid intima-media thickness. CVD=cardiovascular disease. RR=relative risk.

