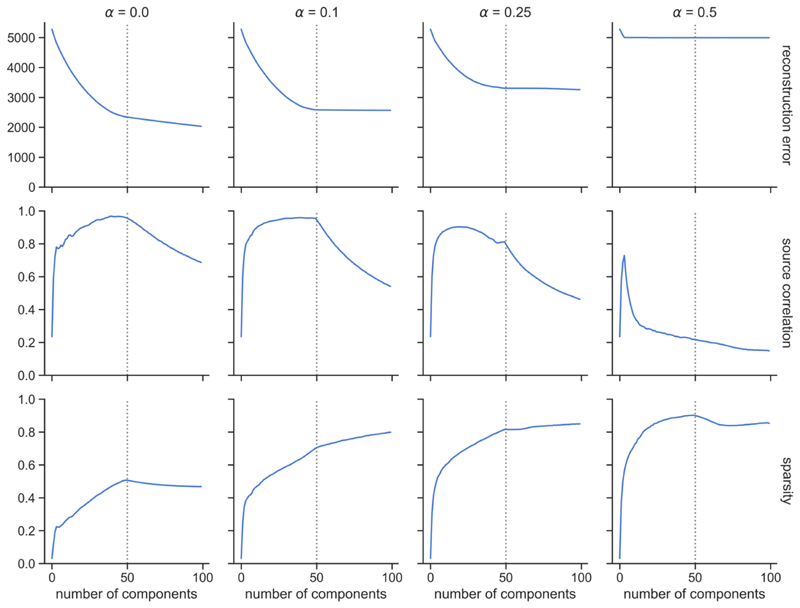
Figure 3.
Simulation experiment to assess the effect of L1-norm regularisation on NMF. The degree of regularisation increases from left to right across the plots (a = 0.0, 0.1, 0.25, 0.5). Different metrics are shown from top to bottom: reconstruction error, correlation between derived components and underlying sources, sparsity of components. The true number of underlying sources (K = 50) is denoted by a vertical dashed line. Noise variance was σ2 = 0.05. Results are shown averaged over 100 noisy realisations of the data.

