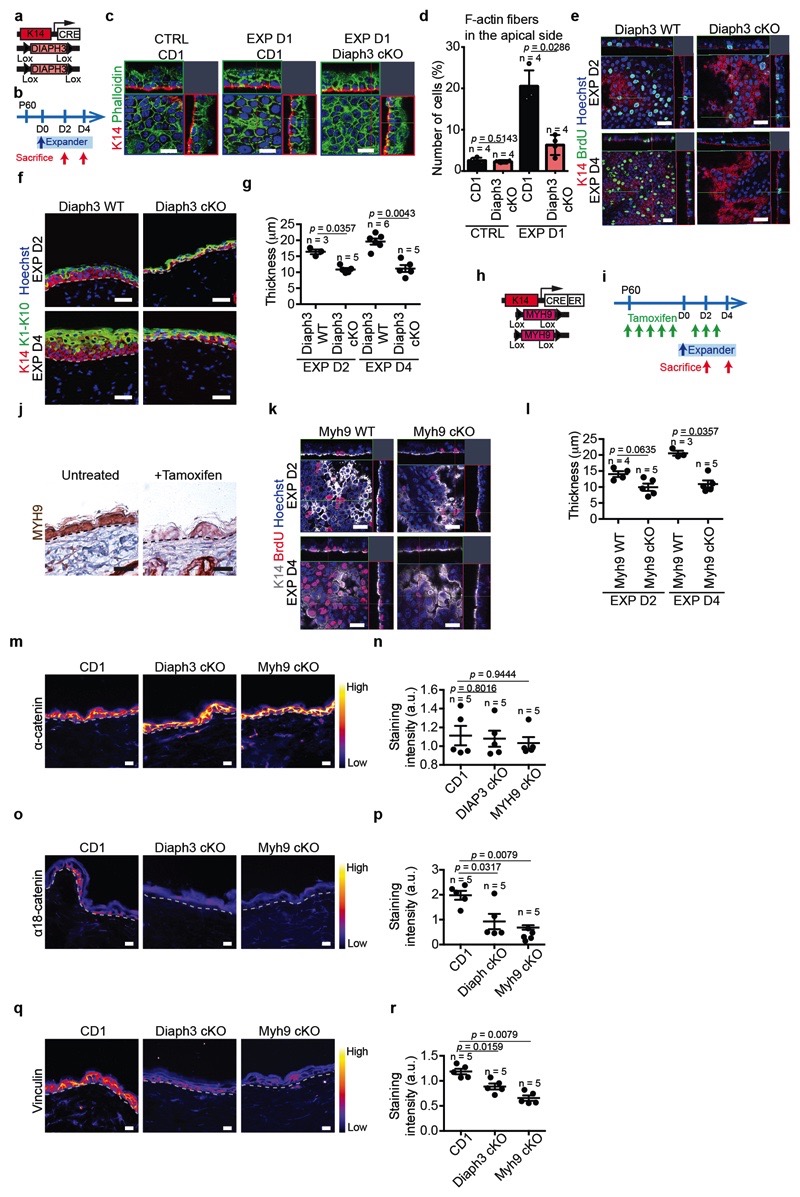
Extended Data Figure 9. Cell contractility in stretch-mediated tissue expansion.
a, Scheme of the genetic strategy to delete Diaph3 in the epidermis. b, Protocol to delete Diaph3 during stretch-mediated tissue expansion. c, Orthogonal views of confocal analysis of immunostaining for K14 (red) marking basal cells and Phalloidin (green) to visualize F-actin and Hoechst for nuclei (blue) in whole mounts of IFE in CTRL from a CD1 mouse, EXP D1 from a CD1 or KI4CRE DIAPH3fl/fl (Diaph3 cKO) mouse. Scale bar, 10 μm. d, Percentage of cells with F-actin fibers in the apical side of basal cells related to c (n = 4 mice per condition). e, Orthogonal views of confocal analysis of immunostaining for K14 (red) marking basal cells, BrdU (green) and Hoechst for nuclei (blue) in whole mounts of IFE from K14CRE DIAPH3fl/+ (Diaph3 WT) and KI4CRE DIAPH3fl/fl (Diaph3 cKO) mice during expansion. Scale bar, 20 μm. Epidermal Diaph3 cKO were born at a Mendelian ratio and did not present obvious pathological phenotypes. n=3 independent experiments. f, Immunostaining for the basal marker K14 (red) and the suprabasal markers K1 and K10 (green) in Diaph3 WT and Diaph3 cKO mice in EXP D2 and EXP D4. Scale bar, 20um. g, Epidermal thickness of Diaph3 WT and Diaph3 cKO mice in EXP D2 and EXP D4 (three measurements taken with ImageJ on two sections per mouse, n = at least 3 mice for the different conditions). h, Scheme of the genetic strategy to delete Myh9 in the epidermis. i, Protocol to delete Myh9 during stretch-mediated tissue expansion. j, Immunohistochemistry for MYH9 in untreated and Tamoxifen induced K14CREER MYH9fl/fl mice. Scale bar, 20um. n=3 independent experiments. k, Orthogonal views of confocal analysis of immunostaining for K14 (white), BrdU (red) and Hoechst for nuclei (blue) in whole mounts of IFE in Myh9 WT and Myh9 cKO mice during expansion. Scale bar, 20 [jm. 1, Epidermal thickness of Myh9 WT and Myh9 cKO mice in EXP D2 and EXP D4 (three measurements taken with ImageJ on two sections per mouse, n = at least 3 mice for the different conditions). m-r, Analysis of adherens-junctions in Diaph3 cKO and Myh9 cKO mice. m, o, q, Representative images of adherens junction (AJ) component α-catenin (m), the α18 tension sensitive form of α-catenin (α18-cathenin) (o) and Vinculin (q), colour-coded for the signal intensity with ImageJ. Protein expression is visualized as a colour gradient going from black to yellow, with black as indicator of no expression and yellow as indicator of maximal expression. Dashed lines indicate the basal lamina. Scale bar, 10 μm. n, p, r, Quantification of the average integrated density signal for α-catenin (m), α18-cathenin (o) and Vinculin (q). Each data point is the average of 3 sections per mouse (n=5 mice per condition). d, g, l, n, p, r, Two-tailed Mann–Whitney test, mean + s.e.m.

