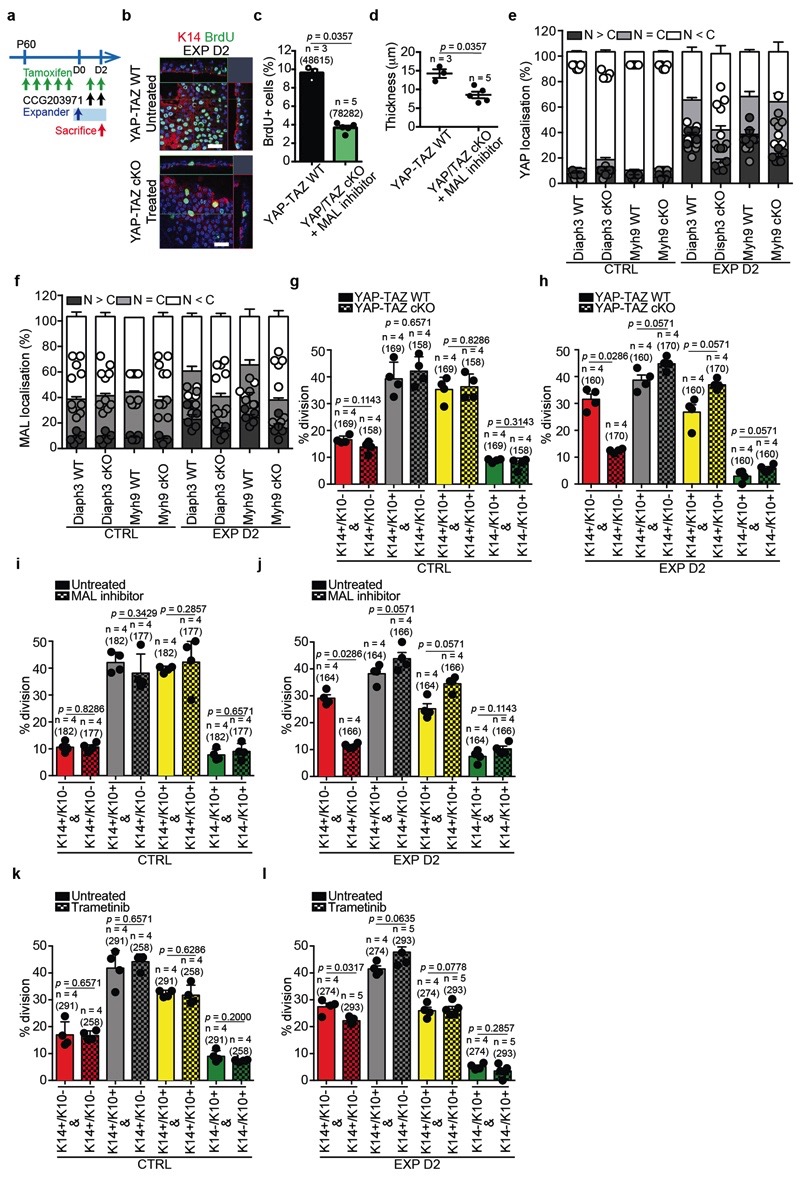
Extended Data Figure 11. Pathways associated with stretch-mediated tissue expansion.
a, Protocol used to delete YAP and TAZ and to inhibit MAL with CCG203971 treatment in K14CREER YAP-TAZfl/fl mice in EXP D2. b, Orthogonal views of immunostaining for K14 (red) to mark basal cells, BrdU (green) and Hoechst for nuclei (blue) on whole mounts of IFE in YAP-TAZ WT untreated mice and YAP-TAZ cKO mice treated with the MAL inhibitor at 2 days after the expander placement. Scale bar, 20 μm. c, Proportion of BrdU positive cells in untreated YAP-TAZ WT mice (48615 cells from 3 mice) and in YAP-TAZ cKO mice treated with the MAL inhibitor (78282 cells from 5 mice). Two-tailed Mann–Whitney test, mean + s.e.m. d, Epidermal thickness of YAP-TAZ WT untreated (n=3) and YAP-TAZ cKO treated with the MAL inhibitor in EXP D2 (n=5), three measurements taken with ImageJ on two sections per mouse. Two-tailed Mann–Whitney test, mean + s.e.m. e, f, Quantification of YAP1 (e) and MAL (f) subcellular localization, presented as mean and s.e.m. in CTRL and EXP D2. N > C, more protein in nucleus than in cytoplasm, N = C, similar level of protein in nucleus than in cytoplasm, N < C, less protein in nucleus than in cytoplasm (n=150 cells per condition). g, h, Percentage of the type of divisions in CTRL (g) and EXP D2 (h) in YAP-TAZ WT mice and YAP-TAZ cKO mice based on the short-term BrdU tracing and staining as in Extended Data Fig. 4h. i, j, Percentage of the type of divisions in CTRL (i) and EXP D2 (j) in Untreated mice and with MAL inhibitor based on the short-term BrdU tracing and staining as in Extended Data Fig. 4h. k, l, Percentage of the type of divisions in CTRL (k) and EXP D2 (l) in Untreated mice and with Trametinib based on the short-term BrdU tracing and staining as in Extended Data Fig. 4h. g-l, The number of counted divisions is indicated in parenthesis from n=number of mice. Two-tailed Mann–Whitney test, mean + s.e.m.

