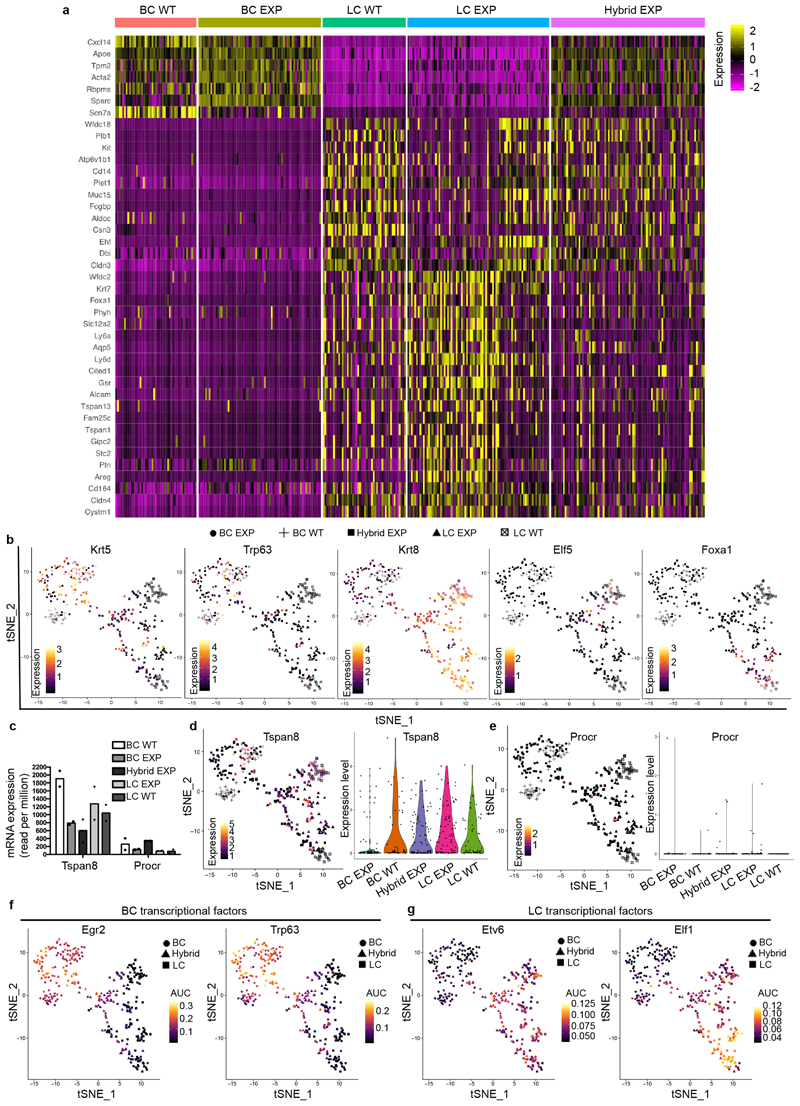
Extended Data Fig. 6. Single-cell transcriptional profiling reveals the hybrid features of CD29high EpCAMhigh cells associated with LC-ablation-induced BC multipotency.
a Heat map of normalized scRNa-seq expression. Rows represent marker genes (ROC AUC >0.7 and log fold change >0.25) for clusters discovered through unsupervised clustering (resolution = 0.2) and columns represent individual cells, grouped by lineage and treatment condition. Colour values in the heat map represent normalized and scaled expression values. These data show the hybrid basal and luminal signature of the CD29high EpCAMhigh cells (Hybrid EXP) after LC ablation. b, t-SNE plots illustrating the expression of markers for BC and LC lineages (n = 337 cells). c, Graph showing the mRNA expression (read per million) of Tspan8 and Procr. n = 2 independent experiments. d, t-SNE and violin plots illustrating the expression for Tspan8. These data show that Tspan8 is expressed at similar levels in the different MG populations under physiological conditions and after LC ablation (n = 337 cells). e, t-SNE and violin plots illustrating the expression for Procr. These data show that Procr is expressed at very low levels in the different MG populations under physiological conditions and is not increased after LC ablation (n = 337 cells). For t-SNE plots, data points represent individual cells, the colour scaling represents the expression level of the respective marker gene (high, yellow; low, black). For violin plots the minima, maxima, centre and percentiles are provided in the Source Data. f, g, t-SNE plots for differentially activated regulons (FDR-corrected P value <0.01 from one-sided Kolmogorov–Smirnov test) as computed by SCENIC, data points represent individual cells (n = 337), the colour scaling represents the regulon AUC value as a measure of the number of transcription factor target genes being expressed (high yellow, low black).

