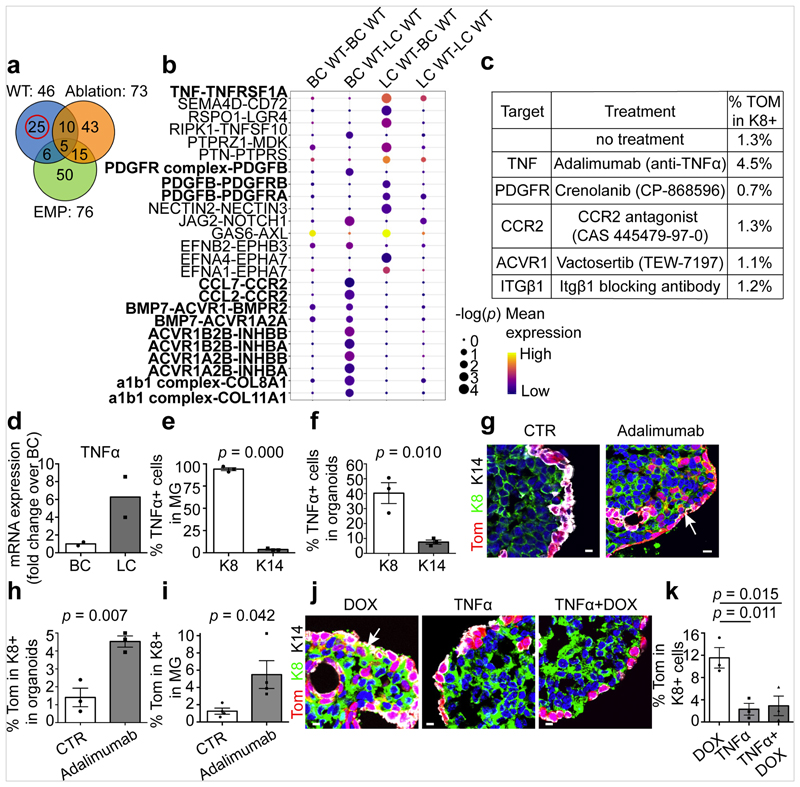
Fig. 3. TNF expression by LCs restricts BC multipotency under homeostatic conditions.
a, Venn diagram representing the interaction between the significant ligand–receptor pairs identified by CellPhone-DB analysis on scRNa-seq data from wild-type, ablation and embryonic mammary progenitors (EMP) (n = 95 cells). b, The mean expression and P values of the ligand–receptor interaction exclusively significant for wild-type cells (n = 25 pairs). For CellPhone-DB analysis, P values are derived from one-sided permutation tests (significant P < 0.05). c, The percentage of K8+tdTomato+ cells arising from BCs in K5CreER/tdTomato organoids treated with inhibitors of the ligand–receptor pairs tested. Mean of 2 independent experiments. d–f, mRNA (d) and protein (e, f) expression of TNF in MG (d, e) and MG organoids (f). Mean of 2 independent experiments normalized over wild-type BCs (d). Quantification of TNF K8+ and K14+ cells from the immunofluorescence after cytospin of MG cells (e) or organoids (f). n = 3 independent experiments. The bar height and error bars are mean ±s.e.m., with individual data points shown. P values are derived from unpaired two-sided t-tests. g, h, Confocal imaging of control or adalimumab-treated K5CreER/tdTomato organoids after immunostaining for tdTomato, K8 and K14 (g) and quantification of tdTomato+K8+ cells in these organoids (h). For adalimumab treatment, organoids were treated with adalimumab for 48 h and analysed after 72 h. The bar height and error bars are mean ±s.e.m., with individual data points shown. P values are derived from paired two-sided t-tests. n = 3 independent experiments. i, Quantification of tdTomato+K8+ cells in the MG of control K5CreER/tdTomato mice or mice analysed one week after IDI of adalimumab (n = 4 mice per condition). The bar height and error bars are mean ±s.e.m., with individual data points shown. P values are derived from unpaired two-sided t-test. j, k, Confocal imaging of immunostaining for tdTomato, K8 and K14 in K5CreER/tdTomato organoids treated with DOX, TNF and DOX+TNF for 48 h and analysed after 72 h (j) and quantification of tdTomato+ K8+ cells in these organoids (k). n = 3 independent experiments. The bar height and error bars are mean ±s.e.m., with individual data points shown. P values are derived from ANOVA followed by two-sided Dunnett’s test. Hoechst nuclear staining is shown in blue. Scale bars, 10 μm.

