Abstract
Oxidative phosphorylation (OXPHOS) defects caused by somatic mitochondrial DNA (mtDNA) mutations increase with age in human colorectal epithelium and are prevalent in colorectal tumours, but whether they actively contribute to tumorigenesis remains unknown. Here we demonstrate that mtDNA mutations causing OXPHOS defects are enriched during the human adenoma/carcinoma sequence, suggesting they may confer a metabolic advantage. To test this we deleted the tumour suppressor Apc in OXPHOS deficient intestinal stem cells in mice. The resulting tumours were larger than in control mice due to accelerated cell proliferation and reduced apoptosis. We show that both normal crypts and tumours undergo metabolic remodelling in response to OXPHOS deficiency by upregulating the de novo serine synthesis pathway (SSP). Moreover, normal human colonic crypts upregulate the SSP in response to OXPHOS deficiency prior to tumorigenesis. Our data show that age-associated OXPHOS deficiency causes metabolic remodelling that can functionally contribute to accelerated intestinal cancer development.
Introduction
Fundamental changes in the cellular metabolism of tumour cells were first observed in 1956 by Otto Warburg who showed that tumour cells preferentially utilise glycolysis for ATP production over mitochondrial oxidative phosphorylation (OXPHOS) 1,2. This was termed ‘aerobic glycolysis’ or the ‘Warburg Effect’. Warburg suggested that a key event in carcinogenesis was ‘injury’ to the respiratory machinery and subsequent analysis of mitochondrial function showed that OXPHOS was frequently down-regulated in many tumours3. This shift to glycolysis results in less efficient production of ATP, but has been shown to confer selective advantages during oncogenesis via other mitochondrial processes such as; resistance to apoptosis4, diversion of glycolytic intermediates into pathways required for cellular biomass production via one-carbon metabolism5, and reactive oxygen species (ROS) production6.
Defects in the OXPHOS system are also a common feature in a number of human ageing tissues7–10. The colorectal epithelium is particularly susceptible to the accumulation of crypts deficient in complexes I and IV11–13, with an average of 15% of crypts being OXPHOS deficient at the age of 7013. The underlying causes of the OXPHOS defects in the ageing colonic epithelium are somatic mutations of the mitochondrial DNA (mtDNA). Human mtDNA is a ~16.6kb circular, multicopy genome found within the mitochondrial matrix that encodes 13 essential subunits of the OXPHOS system together with 22tRNAs and 2 rRNAs to support synthesis of mtDNA-encoded proteins within the organelle. As there are multiple copies of mtDNA in individual cells, mutant and wild type mtDNA can co-exist in a situation termed heteroplasmy, or all copies can be the same, termed homoplasmy. Most mtDNA mutations are functionally recessive; somatic mtDNA mutations must clonally expand to high levels of heteroplasmy within an individual cell before a defect in the OXPHOS system becomes manifest14. The downstream metabolic consequences of such mutations in the rapidly proliferating colonic epithelial cells are largely unknown, though studies from other proliferative cell lines taken from patients with primary mtDNA disease have shown evidence of metabolic rewiring similar to that of cancer cells as a compensatory response to promote cell survival15. MtDNA mutations at very high levels of heteroplasmy, or homoplasmy, have also been detected in a number of tumour types16 including in 60-70% of colorectal cancers17–19. In silico predictions have suggested that mtDNA mutations likely to be detrimental to OXPHOS function are particularly enriched in colorectal tumours16. Age is the biggest risk factor for colorectal cancer development20 and given the fact that pathogenic mtDNA mutations are a common feature of both normal ageing colorectal crypts and colorectal tumours, we wanted to address the question of whether age-related mtDNA mutations are playing a role in colorectal cancer development.
Results
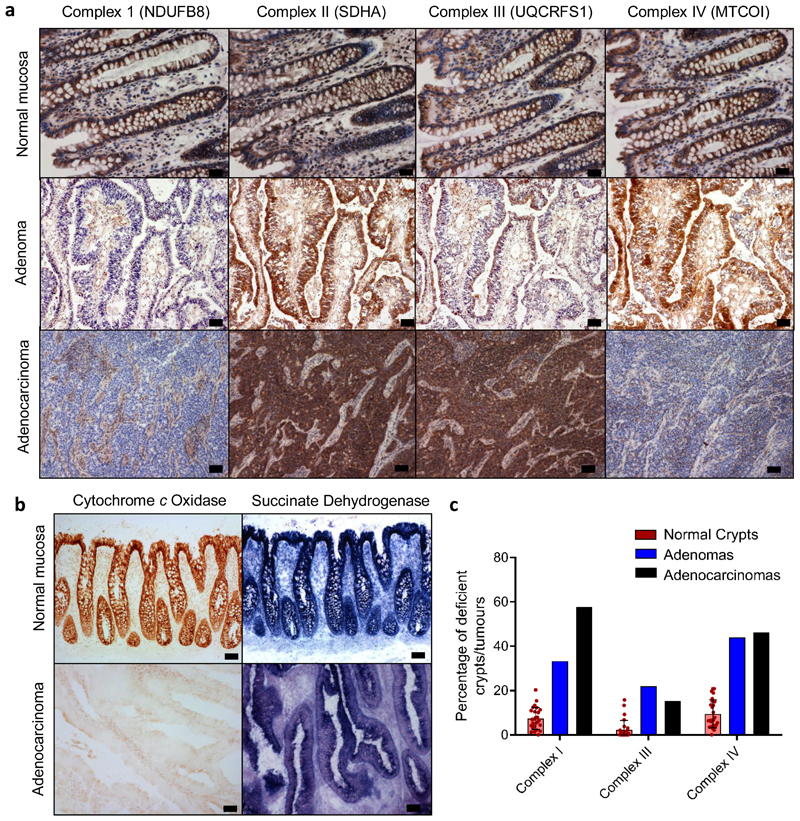
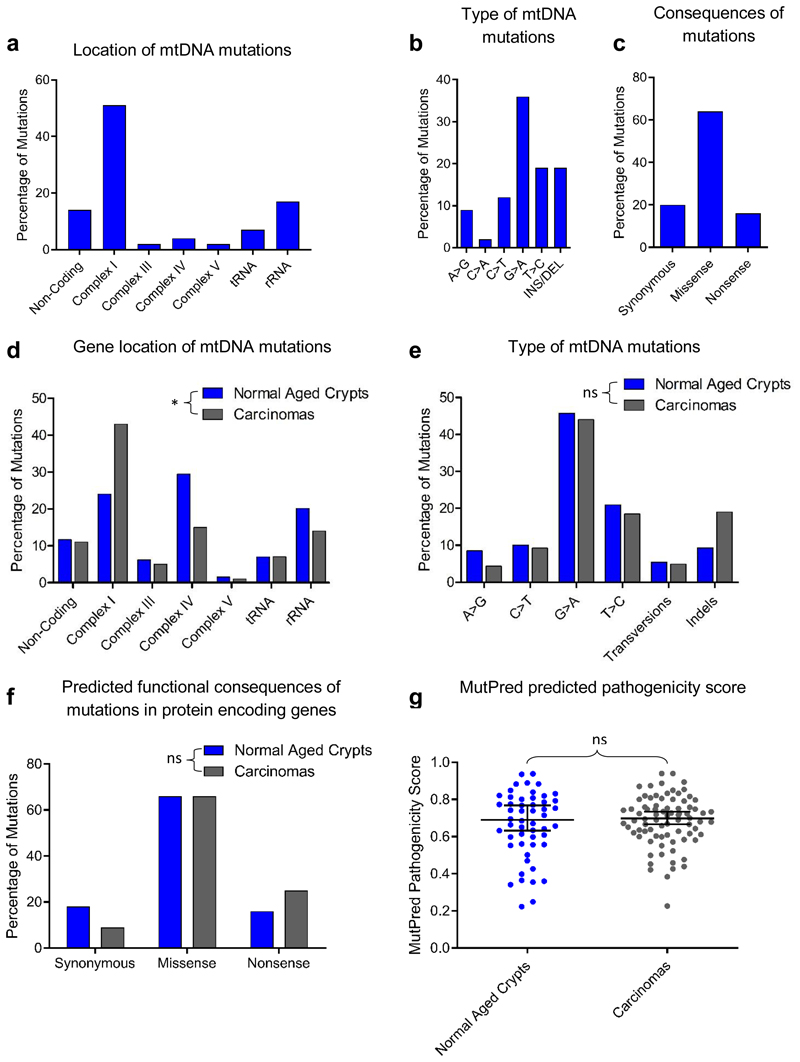
We hypothesised that if age-related mtDNA mutations present in non-transformed colonic epithelium13,21 contributed to colorectal cancer development, a similar spectrum of mtDNA mutations (and downstream mitochondrial OXPHOS deficiency) would be present and enriched in colorectal tumours. To investigate this, we assessed mitochondrial OXPHOS subunit protein levels and enzyme activities in 9 adenomatous polyps and in 26 adenocarcinomas and their patient matched normal mucosa (Fig. 1a-b). We performed in situ immunohistochemical (IHC) analysis to ensure we only analysed the epithelial compartment without contamination by muscle, stromal or immune cells or the non-transformed mucosa. 4/9 (44%) of the adenomas and 18/26 (69%) of the adenocarcinomas had decreased levels, or absence of, one or more OXPHOS subunits and/or loss of histochemical cytochrome c oxidase (COX) reactivity (Fig. 1, Supplementary Information Table 1) compared with an average of 10% of normal crypts (Fig. 1c). Sequencing of the mtDNA of laser-micro dissected tumour epithelium, and either patient matched normal mucosa or stromal tissue from the tumour section (to provide the germline mitochondrial genotype of each subject), detected tumour-specific, clonally-expanded mtDNA point mutations in 4/9 adenomas and 22/26 adenocarcinomas (47 mutations in total) (Supplementary Information Table 2, and Fig. 2). Of the 22 OXPHOS-deficient tumours, 18 had ≥1 mtDNA mutations at high levels of heteroplasmy correlating with the IHC profile (Supplementary Information Table 2). MtDNA mutations detected in tumours with normal OXPHOS protein levels were either present at <50% heteroplasmy, or were known polymorphic variants predicted not to affect OXPHOS14. This highlights the fact that mtDNA mutations are functionally recessive and must reach high levels of heteroplasmy before an OXPHOS defect will become manifest. In the 4 tumours with OXPHOS defects, mtDNA mutations were not detected, similar to our previous analyses of normal crypts13, suggesting nuclear factors can also contribute to age-related OXPHOS deficiency. Combining the mtDNA mutations detected in the human adenocarcinomas here with those published by others 17–19,22 (Supplementary Information Table 3), we observed a similar mtDNA mutation spectrum in tumours and normal ageing colonic crypts11,13,21,23 (Supplementary Information Table 4, Fig. 2), with the only significant difference being a higher proportion of complex I subunit mutations in the tumours (Fig. 2d). Given the similarities between the mutational spectrum and OXPHOS defects in normal crypts and tumours, and the very high prevalence of OXPHOS defects in the tumours, we hypothesised that pre-existing OXPHOS defects in normal crypts may provide a selective metabolic advantage during tumorigenesis.
Figure 1. OXPHOS subunit immunohistochemical and histochemical analysis of human colorectal adenomas and adenocarcinomas.
a: Immunohistochemistry was performed on 26 adenocarcinoma samples and patient matched normal mucosa, and 9 colonic adenoma samples. Representative images showing OXPHOS subunit expression in normal mucosa (CSC024), an adenoma (AD07), and an adenocarcinoma (CSC024). b: Cytochrome c oxidase and succinate dehydrogenase histochemistry was performed on the same samples as in panel a. Representative images of normal colonic mucosa and adenocarcinoma from CRC009 are shown in b. c: Quantification of the mean percentage of normal crypts per subject with defects in the specified OXPHOS subunits (each dot represents the mean percentage of OXPHOS deficient crypts in each subject, n=26 subjects, error bars are s.e.m.), and the percentage of adenomas (n=9) and adenocarcinomas (n=26) analysed with defects in the specified OXPHOS subunits. Scale bars a- 20µm, b 50µm.
Figure 2. Analysis of mitochondrial DNA (mtDNA) mutations detected in 26 colorectal adenocarcinomas compared with normal aged crypts.
a-c: Location, type and consequences of mtDNA mutations detected in colorectal adenocarcinomas in this study (n=41 mutations). d-g: Comparison of the location (d), types (e), and functional consequences (f) of mtDNA mutations in previously published normal crypts (n=129 mutations) and adenocarcinomas11,13,21,23 (n=182 mutations). There was a significant difference in the location of the mtDNA mutations in adenocarcinomas compared with normal aged crypts (p=0.0123, Chi-squared analysis (d)), but no significant differences were detected in the types of mutations (p=0.2264, Chi-squared analysis, (e)) or the predicted functional consequences (p=0.1504, Chi-squared analysis (f)). (g) Comparison of MutPred pathogenicity scores for missense mutations in protein encoding genes in normal aging crypts (n=52 mutations) and adenocarcinomas (n=80 mutations) two-tailed, Mann Whitney U Test, p=0.8138, median ±95% confidence intervals are shown. * p<0.05
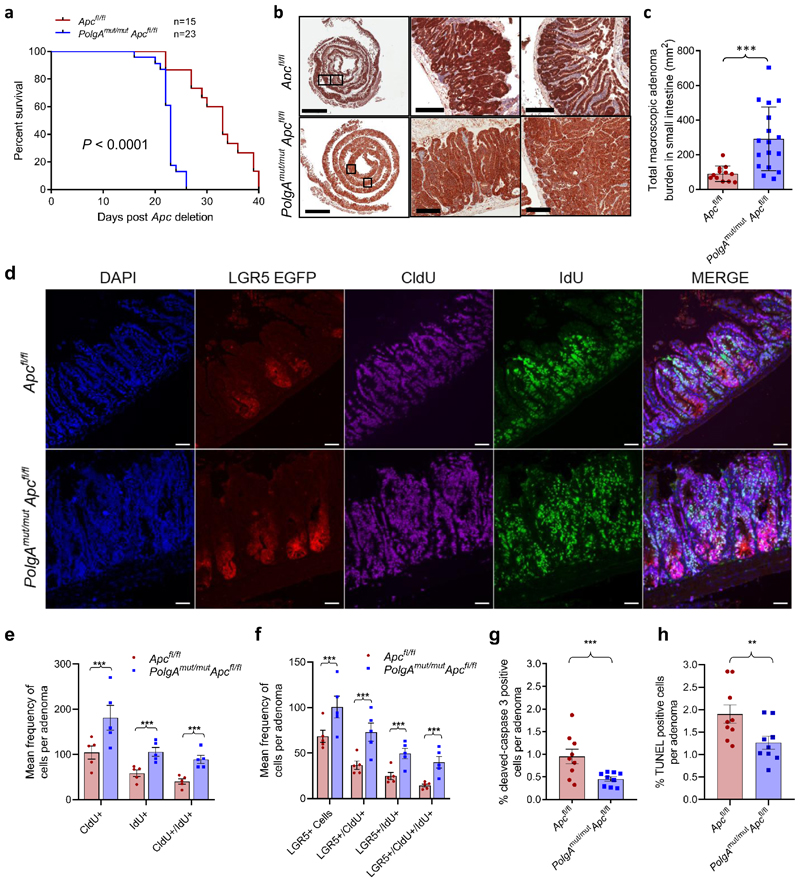
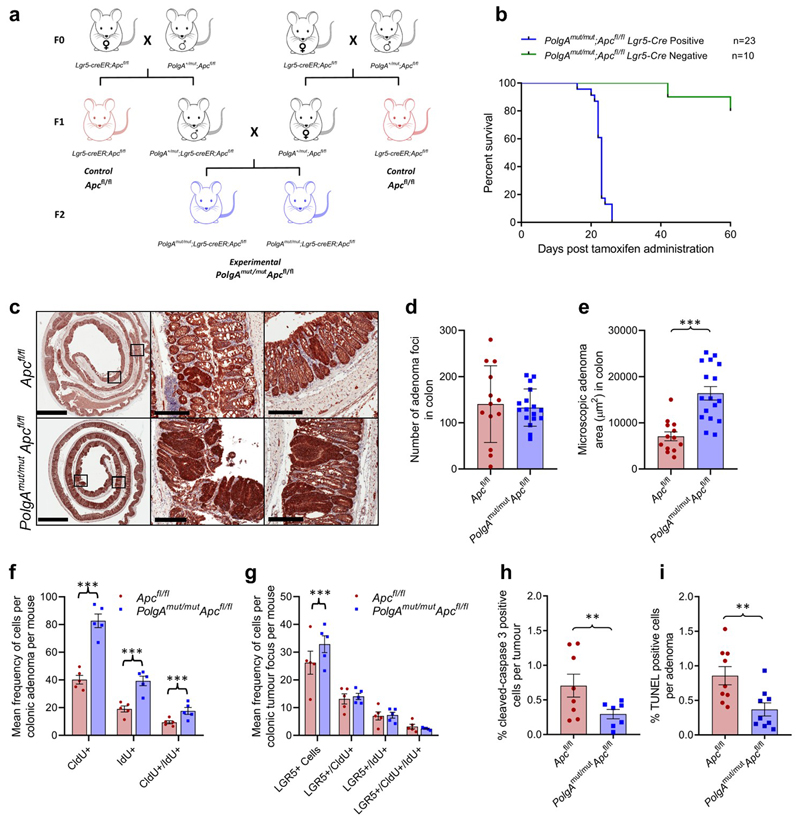
To test this hypothesis, we crossed an inducible intestinal tumour mouse model (Lgr5-creER;Apcfl/fl)24 with a model of accelerated mtDNA mutagenesis (PolgAmut/mut)25,26 (Extended Data Fig. 1a). By 6 months of age, the PolgAmut/mut mice have a high frequency of intestinal crypts with OXPHOS dysfunction caused by clonally expanded mtDNA mutations27. Furthermore, modelling studies support a similar mechanism of clonal expansion of mtDNA mutations through random genetic drift with age in intestinal crypts of the PolgAmut/mut mice27 and humans28. Intestinal tumours were induced in PolgAmut/mut;Lgr5-creER;Apcfl/fl (from herein denoted PolgAmut/mut;Apcfl/fl) and Lgr5-creER;Apcfl/fl (from herein denoted Apcfl/fl) mice by tamoxifen activation of the cre-ER at 6 months of age. PolgAmut/mut;Apcfl/fl mice had a significantly shorter lifespan than Apcfl/fl mice with median survival times post-Apc deletion of 23 and 33 days respectively (Fig. 3a). We confirmed that the dose of the inducing agent tamoxifen was not toxic when given to mice that did not express cre-ER (Extended Data Fig. 1b). To compare tumour growth rates, Apc deletion was induced in PolgAmut/mut;Apcfl/fl and Apcfl/fl mice at 6 months of age, and all mice were killed 23 days later (the median life-span of the PolgAmut/mut;Apcfl/fl line). Total tumour burden in the small intestine (SI) of PolgAmut/mut;Apcfl/fl mice was significantly higher than in Apcfl/fl mice (Fig. 3b,c). β-Catenin IHC showed no significant difference in the number of microscopic β-Cateninhigh foci in the colon between the two groups (Extended Data Fig.1c-d). However, foci in PolgAmut/mut;Apcfl/fl mice were almost twice the size of those in the Apcfl/fl mice (Extended Data Fig. 1e). These data suggest that mitochondrial dysfunction in intestinal epithelial cells of PolgAmut/mut;Apcfl/fl mice promotes tumour cell growth after transformation by Apc deletion.
Figure 3. PolgAmut/mut;Apcfl/fl mice have reduced lifespan and enhanced tumour growth due to accelerated cell proliferation and reduced apoptosis compared with Apcfl/fl mice.
a: Kaplan-Meier survival curve showing survival times post Apc deletion (two-sided Mantel-Cox (Log-Rank) test, p<0.0001, ‘n’ = number of mice) b: β-Catenin immunohistochemistry on small intestinal sections (scale bars 3mm (first column) and 200µm). Immunohistochemistry was performed on PolgAmut/mut;Apcfl/fl (n=17) and Apcfl/fl (n=12) mice 23 days post-Apc deletion, representative images are shown. c: Tumour burden in small intestine of PolgAmut/mut;Apcfl/fl (n=17) and Apcfl/fl (n=12) mice 23 days post-Apc deletion (unpaired, 2 tailed, t-test, error bars show s.d., p=0.0010) d: Immunoflourescent (IF) images showing LGR5+ cells, and cells which have incorporated CldU and IdU. Scale bars 50µm. IF was performed on n=5 mice per group and representative images are shown. e-f: Quantification of the frequency of thymidine analogue incorporation in all cells per adenoma (e), and LGR5+ cells per adenoma per mouse (f). n=5 mice per group with 20 adenomas analysed per mouse (two-sided linear mixed effect regression model with mouse ID as a random effect, p<0.001 in all comparisons). g-h: Apoptotic cells were identified and quantified using cleaved caspase 3 (CC3) immunohistochemistry (g) and TUNEL labelling (h) in mice 23 days post-Apc deletion. n=9 mice per group with a minimum of 10 adenomas analysed per mouse Two-sided linear mixed effect regression model with mouse ID as a random effect, p<0.001 for CC3 and p=0.008 for TUNEL, mean percentage or apoptotic cells per adenoma per mouse are shown ± s.e.m. For all panels: * p<0.05, **p<0.01, ***p<0.001.
To investigate the underlying cause of the increased tumour size in the PolgAmut/mut;Apcfl/fl mice, we compared proliferation rates of all cells in the adenomas, and specifically in the LGR5+ stem cells, from both groups of animals using multiple thymidine analogue labelling (Fig. 3d). We noted a significantly higher frequency of cells incorporating CldU and IdU, both individually and together, in adenomas of the SI (Fig. 3e) and the colon (Extended Data Fig. 1f) of the PolgAmut/mut;Apcfl/fl mice. Incorporation of both thymidine analogues identifies cells which have divided twice within the 28 hour period providing evidence that the cells are proliferating faster in PolgAmut/mut;Apcfl/fl adenomas. In the SI, both the frequency of LGR5+ cells per adenoma, and their levels of thymidine analogue incorporation were significantly higher in the PolgAmut/mut;Apcfl/fl mice compared to the Apcfl/fl mice, indicative of a higher proliferative index (Fig. 3f). Despite an increase in LGR5+ stem cells in colonic adenomas, no significant differences in LGR5+ stem cell proliferation rates were noted. (Extended Data Fig. 1g). Using cleaved caspase 3 IHC and (TdT)-mediated dUTP nick end (TUNEL) labelling, we detected a significantly lower frequency of apoptotic cells in adenomas from the PolgAmut/mut;Apcfl/fl mice in both the SI (Fig. 3g-h) and colon (Extended Data Fig. 1h-i). These data suggest that mitochondrial dysfunction leads to increased cell proliferation and decreased apoptosis resulting in accelerated tumour growth.
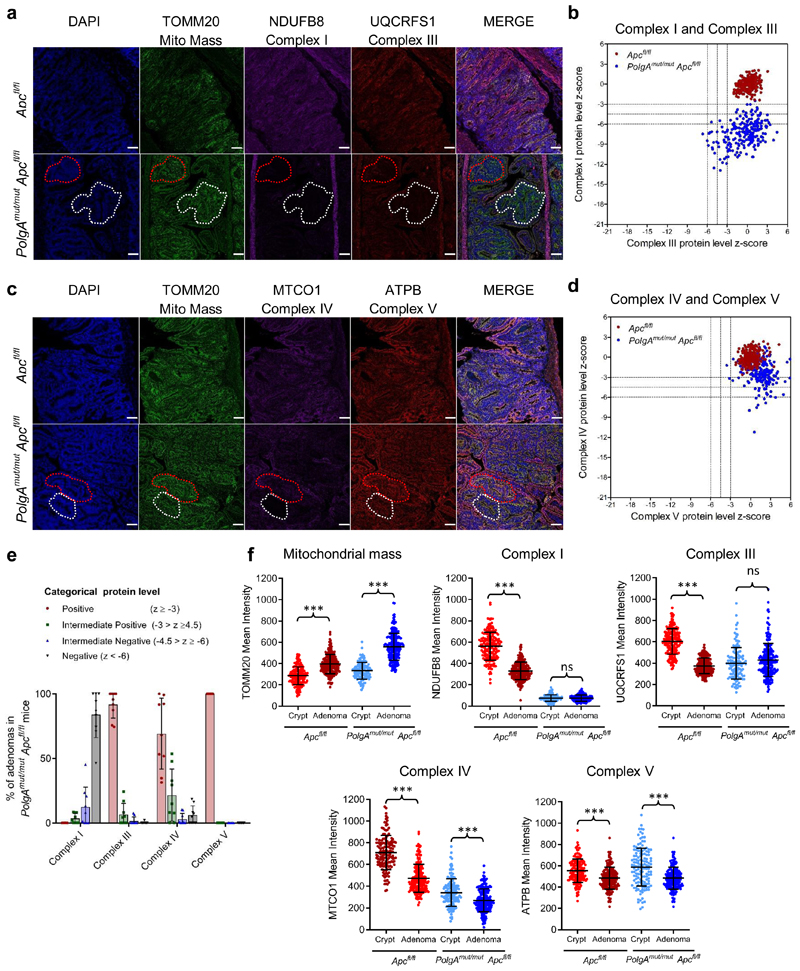
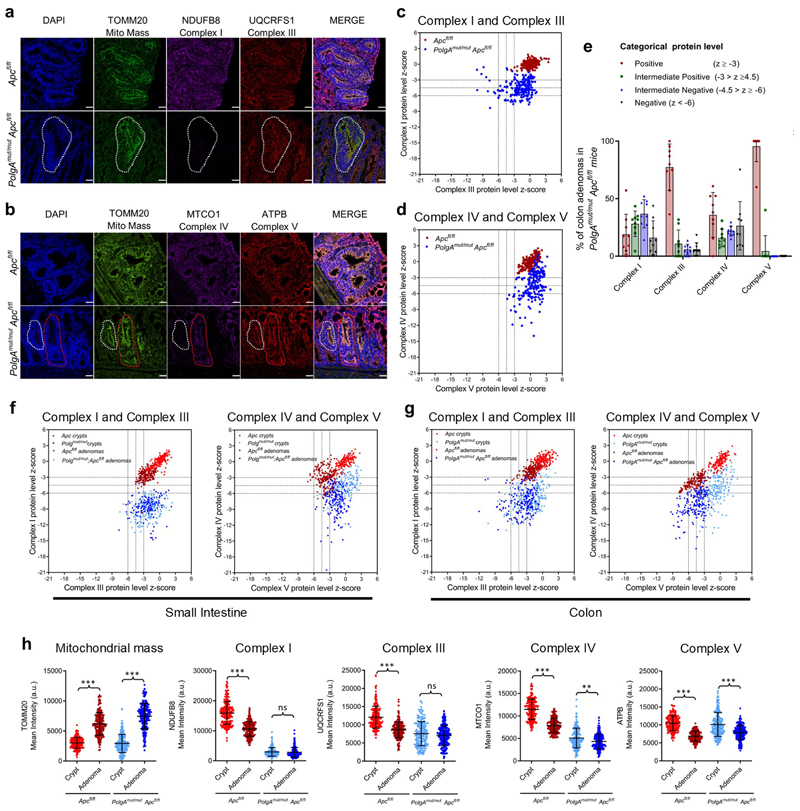
Next we investigated the pattern of OXPHOS deficiency in intestinal adenomas from PolgAmut/mut;Apcfl/fl and Apcfl/fl mice using quantitative quadruple immunofluorescence (IF)29 (Fig. 4a-e, Extended Data Fig. 2a-e). OXPHOS proteins were normalised to the mitochondrial mass marker TOMM20 with Apcfl/fl adenomas acting as controls. In the SI, >85% of PolgAmut/mut;Apcfl/fl adenomas were classified as NDUFB8 (Complex I)-deficient whereas MTCO1 (Complex IV) and UQCRFS1 (Complex III) labelling only revealed minimal deficiency (Fig. 4e). Similar patterns of OXPHOS deficiency were detected in colonic adenomas (Extended Data Fig. 2e). To determine whether Apc deletion affected mitochondrial OXPHOS protein abundance, we compared normal (non-recombined) SI and colonic mucosa of the PolgAmut/mut;Apcfl/fl and Apcfl/fl mice with the adenomas (Fig. 4f and Extended Data Fig.2f-h). In both tissues, mitochondrial density increased significantly following Apc deletion in both mouse models. There were no significant differences in NDUFB8 or UQCRFS1 between the crypts and adenomas of the PolgAmut/mut;Apcfl/fl mice in both SI and colon, but MTCO1 and ATPB levels were significantly lower in the adenomas. In the Apcfl/fl mice, OXPHOS proteins were significantly lower in the adenomas than in the normal mucosa in both colon and SI, supporting previous studies showing Wnt-mediated down-regulation of mitochondrial OXPHOS as a tumour promoting mechanism30. Our data suggest that this mechanism is accelerated in the PolgAmut/mut;Apcfl/fl mice.
Figure 4. Small Intestinal adenomas from PolgAmut/mut;Apcfl/fl mice are deficient in mitochondrial Complex I, but the majority retain expression of subunits of complexes III, IV and V.
a and c: Immunofluorescence was performed to quantify levels of OXPHOS proteins on n=9 PolgAmut/mut;Apcfl/fl mice and n=10 Apcfl/fl mice. Representative images are shown. Scale bars 50µm. The white dashed line shows an adenoma region deficient in complex I and III, and the red dashed line highlights deficiency in complex I only in panel a: An adenoma region deficient in complex IV is highlighted by the white dashed line and one with normal complex IV is highlighted by the red dashed line in panel c. b and d: Dot plots showing relative Z-scores calculated following quantification of mitochondrial OXPHOS protein levels in adenomas from PolgAmut/mut;Apcfl/fl (n=9) and Apcfl/fl (n=10) mice using the method in29. n=20 adenomas were quantified per mouse. e: Categorical analysis of OXPHOS protein levels PolgAmut/mut;Apcfl/fl (n=9 mice) and Apcfl/fl (n=10 mice) Data points show individual mice ± s.d. f: Dot plots showing raw densitometry values for mitochondrial protein levels. For the adenomas: n=9 PolgAmut/mut;Apcfl/fl and n=10 Apcfl/fl mice with 20 adenomas analysed per mouse. For the normal crypts, n=5 mice were analysed per group with a minimum of 13 crypts quantified per mouse. One-way ANOVA with Tukey’s post-test. P values for within genotype comparisons between normal crypts and adenomas were as follows: TOMM20: Apcfl/fl p<0.0001, PolgAmut/mut;Apcfl/fl p<0.0001, NDUFB8: Apcfl/fl p<0.0001, PolgAmut/mut;Apcfl/fl p=0.9995, UQCRFS1: Apcfl/fl p<0.0001, PolgAmut/mut;Apcfl/fl p=0.1302, MTCO1: Apcfl/fl p<0.0001, PolgAmut/mut;Apcfl/fl p=0.0001, ATPB: Apcfl/fl p<0.0001, PolgAmut/mut;Apcfl/fl p<0.0001. For all panels: * p<0.05, **p<0.01, ***p<0.001, error bars show s.e.m
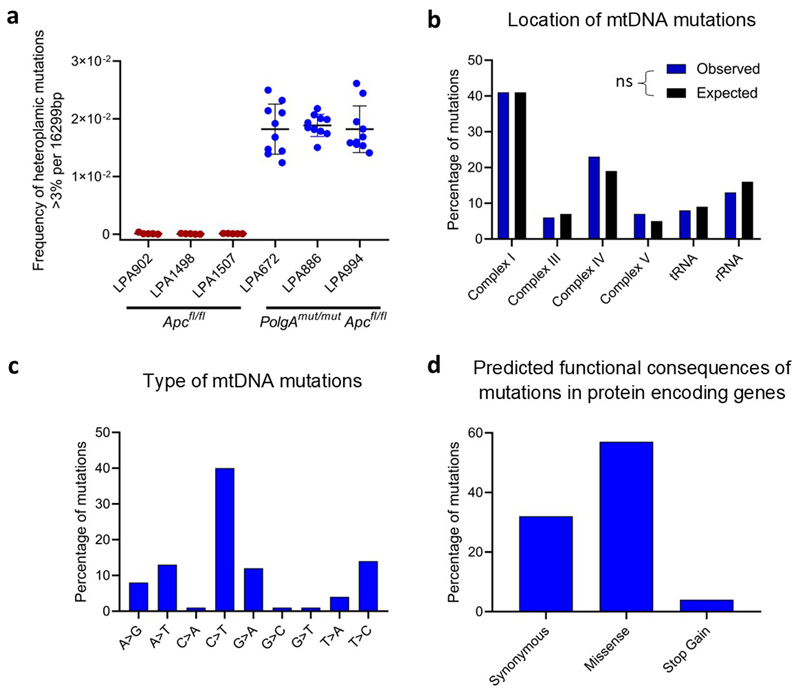
To investigate if somatic mtDNA mutations were responsible for the OXPHOS deficiencies in the mice, individual adenomas were laser-microdissected from PolgAmut/mut;Apcfl/fl and Apcfl/fl mice and the mtDNA sequenced. PolgAmut/mut;Apcfl/fl adenomas harboured an average of 13-14 variants present at 30-70% heteroplasmy (Supplementary Information Table 5) whereas in Apcfl/fl adenomas, none were detected at >5%. The mutational spectrum was consistent with the random mutagenesis model previously described in colonic crypts of the PolgAmut/+ mice27 (Extended Data Fig. 3). Unlike our human dataset, no homoplasmic mtDNA variants were detected; however, this is not unexpected given the age of the mice and the predictions of the time required for a mtDNA variant to reach to homoplasmy27. These data strongly infer that multiple heteroplasmic clonally expanded mtDNA mutations are the underlying cause of the OXPHOS defects detected in PolgAmut/mut;Apcfl/fl adenomas.
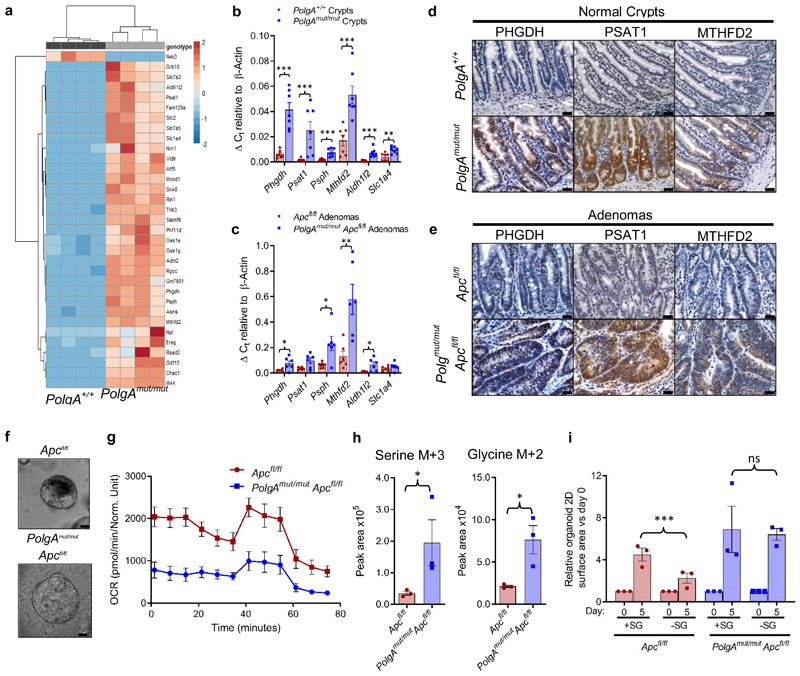
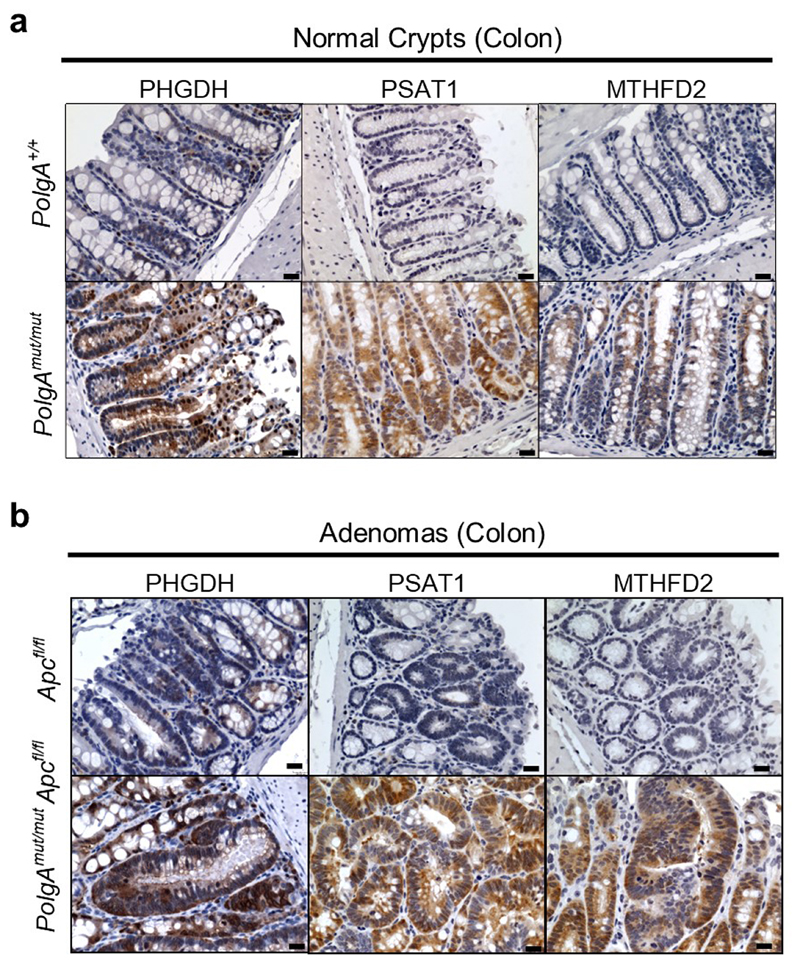
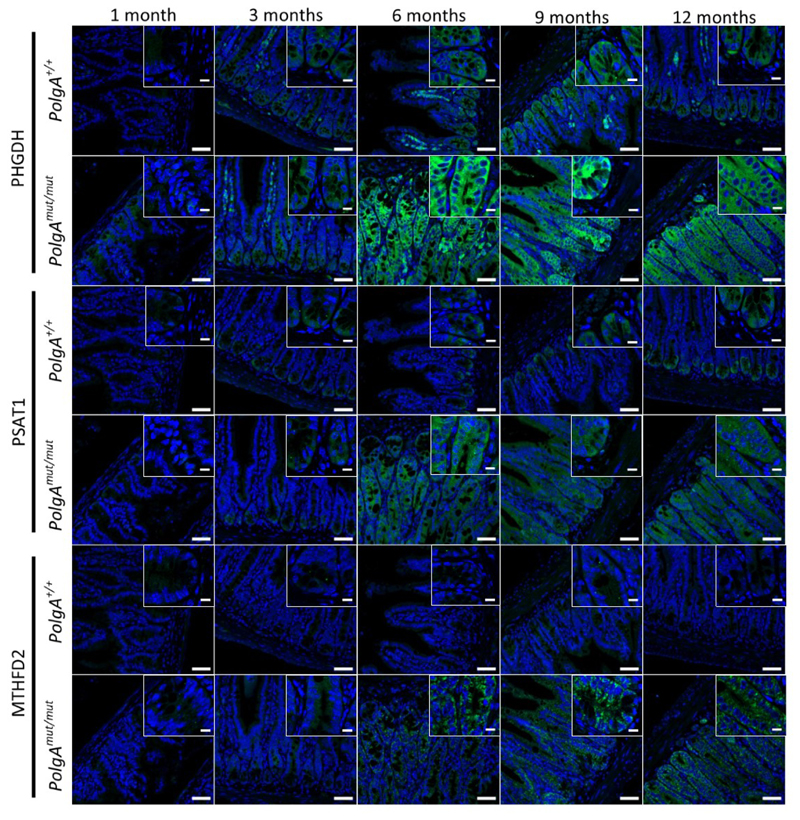
Next we used RNASeq to investigate the mechanism by which OXPHOS dysfunction in the normal ageing intestinal epithelium accelerates tumour development.Normal epithelial crypts from the distal end of the SI (where the majority of adenomas occur) were isolated from 6-month old PolgAmut/mut and PolgA+/+ mice. Comparison of differentially expressed genes revealed the most significantly upregulated genes, Phgdh, Psat1, Psph, Mthfd2, Slc1a4 and Aldh1l2, were involved in pathways relating to serine biosynthesis, uptake and metabolism (Fig.5a, Supplementary Information Table 6). These data were confirmed by qRT-PCR (Fig. 5b). RNA extracted from laser micro-dissected adenoma tissue from the SI of both groups of animals showed upregulation of Phgdh, Psph, Mthfd2, and Aldh1l2 in the adenomas from the PolgAmut/mut;Apcfl/fl mice (Fig. 5c). These findings were confirmed at the protein level for PHGDH, PSAT1, and MTHFD2 by IHC in the SI (Fig. 5d-e) and colon (Extended Data Fig. 4a-b). Supporting the hypothesis that these proteins are upregulated in response to age-related accumulation of OXPHOS defects in the PolgAmut/mut mice, we observed an age-related increase in SSP protein levels in the normal SI crypts of PolgAmut/mut mice between 1 and 12 months of age (Extended Data Fig. 5).
Figure 5. Mitochondrial OXPHOS dysfunction causes upregulation of de novo serine synthesis in both non-transformed crypts and adenomas from mice.
a: Heat map showing differential gene expression in non-transformed crypt homogenates from the small intestines of PolgA+/+ and PolgAmut/mut mice (n=4 mice per group). b: Mean relative expression of the SSP genes by RT-PCR which were identified to be upregulated by RNASeq analysis in normal crypts. n=7 mice per group, one-way Mann-Whitney U test, p=0.0003 for all genes except Slc1a4 where p=0.0035 c: Mean relative expression of the SSP genes by RT-PCR which were identified to be upregulated by RNASeq analysis in laser-microdissected adenomas. n=6 mice per group, one-way Mann-Whitney U test, p values as follows: Phgdh p=0.0325, Psat1 p=0.066, Psph p=0.0130, Aldh1l2 p=0.1548, Mthfd2 p=0.0043, error bars show s.e.m. d-e: Immunohistochemistry images showing in situ levels of SSP proteins in the non-transformed normal small intestinal mucosa (d), and adenomas (e). Immunohistochemistry was performed on n=4 mice per genotype and representative images are shown. Scale bars 50µm. f: Organoids were generated from n=3 PolgAmut/mut;Apcfl/fl and n=3 Apcfl/fl mice. Representative images of adenoma organoids are shown. Scale bars 100µm. g: Oxygen consumption rates measured by Seahorse analysis in adenoma organoids (n=3 mice per genotype, 8 technical replicates per mouse, mean ±s.e.m per mouse are shown). h: Quantification of major mass isotopomers detected in adenoma organoids following growth in the presence of 13C6-glucose for 24 hours. 13C labelling is shown as M+3 (serine) or M+2 (glycine). n=3 mice per group with 3 technical replicates performed per mouse (one-way unpaired t-test, p=0.0143 for labelled serine and p=0.0151 for labelled glycine, data are mean per mouse ±s.e.m). i: Quantification of the growth of adenoma organoids in medium with (+SG) or without (-SG) serine and glycine for 5 days. Data are normalised to organoid area on day 0. Mean organoid size per mouse relative to day 0 ± s.e.m is shown, n=3 mice per group, unpaired, two-tailed t-test, p=0.4140 for Apcfl/fl and p=0.0021 for PolgAmut/mut;Apcfl/fl. For all panels: * p<0.05, **p<0.01, ***p<0.001.
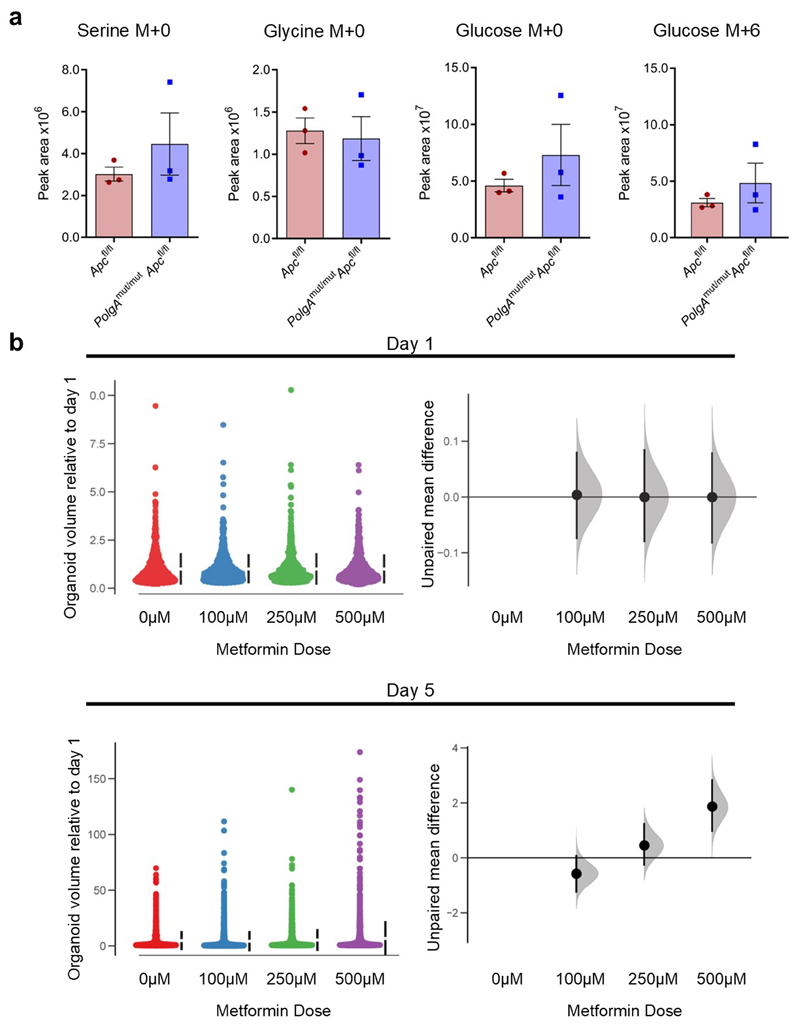
We investigated the functional consequences of changes in gene expression and protein levels in the PolgAmut/mut;Apcfl/fl adenomas by generating in vitro adenoma organoids from mice from the two groups (Fig. 5f). We were unable to investigate this in non-transformed normal small intestinal organoids as it has been shown previously (as is our own experience) that these do not grow from the PolgAmut/mut mice in vitro 31. Baseline oxygen consumption rate (OCR) was lower in organoids derived from PolgAmut/mut;Apcfl/fl adenomas compared with Apcfl/fl adenomas, confirming that in vivo OXPHOS defects were manifest in the in vitro model (Fig 5g). Following growth in 13C6 labelled glucose for 24 hours, we found that labelled serine (M+3) and glycine (M+2) (derived from the labelled glucose through the SSP) were significantly higher in PolgAmut/mut;Apcfl/fl organoids, indicating increased rates of de novo serine synthesis (Fig. 5h). No significant differences were observed in the levels of labelled glucose per se suggesting equal uptake, nor were there differences in the levels of unlabelled (M+0) serine or glycine (Extended Data Fig 6a). Growth rates in the absence of serine and glycine (-SG) were significantly impaired in the Apcfl/fl organoids whereas PolgAmut/mut;Apcfl/fl organoids maintained their growth (Fig. 5i), suggesting complex I deficiency induces the SSP conferring a significant growth advantage to the adenomas. Next we investigated the effect of the biguanide metformin, which has been shown to inhibit complex I32,33, on growth of Apcfl/fl organoids. There was a significant increase in organoid growth when they were dosed with metformin compared to vehicle controls (Extended Data Fig 6b), confirming that pharmacological inhibition of complex I can also enhance adenoma organoid growth34.
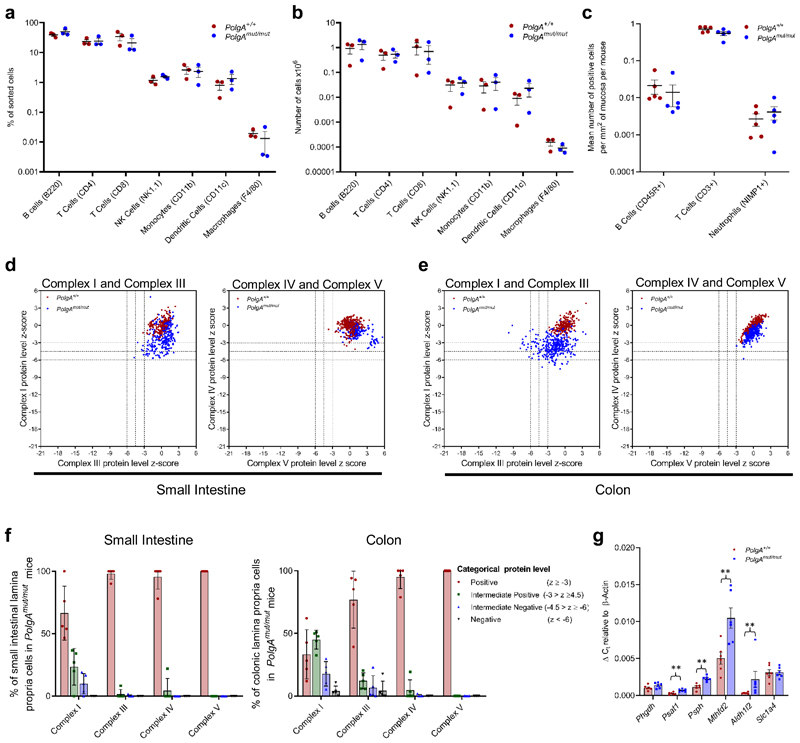
Since the PolgAmut/mut model is a whole body knock-in, we evaluated changes in the intestinal immune microenvironment at 6 months of age prior to tumour induction to determine any contribution to accelerated tumour growth. In-depth fluorescence-activated cell sorting (FACS) analysis of immune cell types in the distal end of the SI revealed no significant differences between either the proportions or the absolute numbers of the sorted immune cells between the two groups (Fig. 6a-b, Supplementary Information Fig. 1). This was confirmed in a sub-set of immune cells by IHC. (Fig 6c). Furthermore, in contrast to our crypt data, we detected little evidence of OXPHOS deficiency within the lamina propria of PolgAmut/mut mice; 66% of small intestinal cells showed normal NDUFB8 levels while 95% had normal MTCO1 levels (Fig 6d-f). Gene expression studies revealed significant upregulation of Psat1, Psph, Mthfd2 and Aldh1l2, but not Phgdh (Fig 6g), providing evidence that there is mitochondrial dysfunction and metabolic remodelling in the epithelial tissue microenvironment, but this is less marked than in the epithelial cells.
Figure 6. Characterisation of the immune microenvironment in the lamina propria of the small intestine of PolgAmut/mut and PolgA+/+ mice at 6 months of age, prior to tumour induction.
a-b: Immune cell infiltration within the distal third of small intestine was analysed by flow cytometry. a shows the relative proportions of each cell type, b shows the absolute numbers. No significant differences were found between the two groups (n=3 mice per group, one-way ANOVA with Tukey’s post-test). c: Mean frequency of B cells, T Cells and Neutrophils/mm2 of small intestinal epithelium as quantified by immunohistochemistry. n=5 mice per group, No significant differences were detected by one-way ANOVA with Tukey’s post-test. d-e: Dot plots showing Z-scores calculated following quantification of mitochondrial OXPHOS protein levels in small groups of lamina propria cells in the small intestine (d) and colon (e) of PolgAmut/mut and PolgA+/+ mice (n=5 mice per group and a minimum of 50 areas per mouse were analysed). f: Categorical analysis of OXPHOS protein levels (n=5 mice per group). g: Relative expression of the SSP genes in the lamina propria of the small intestine by RT-PCR which had been identified to be upregulated by RNASeq analysis in the crypts (n=6 mice per group, one-way Mann-Whitney U test). P values are as follows: Phgdh p=0.1201, Psat1 p=0.043, Psph p=0.011, Aldh1l2 p=0.0022, Mthfd2 p=0.0043, Slc1a4 p=0.500. Mean values per mouse ± s.e.m are shown. * p<0.05, **p<0.01, ***p<0.001
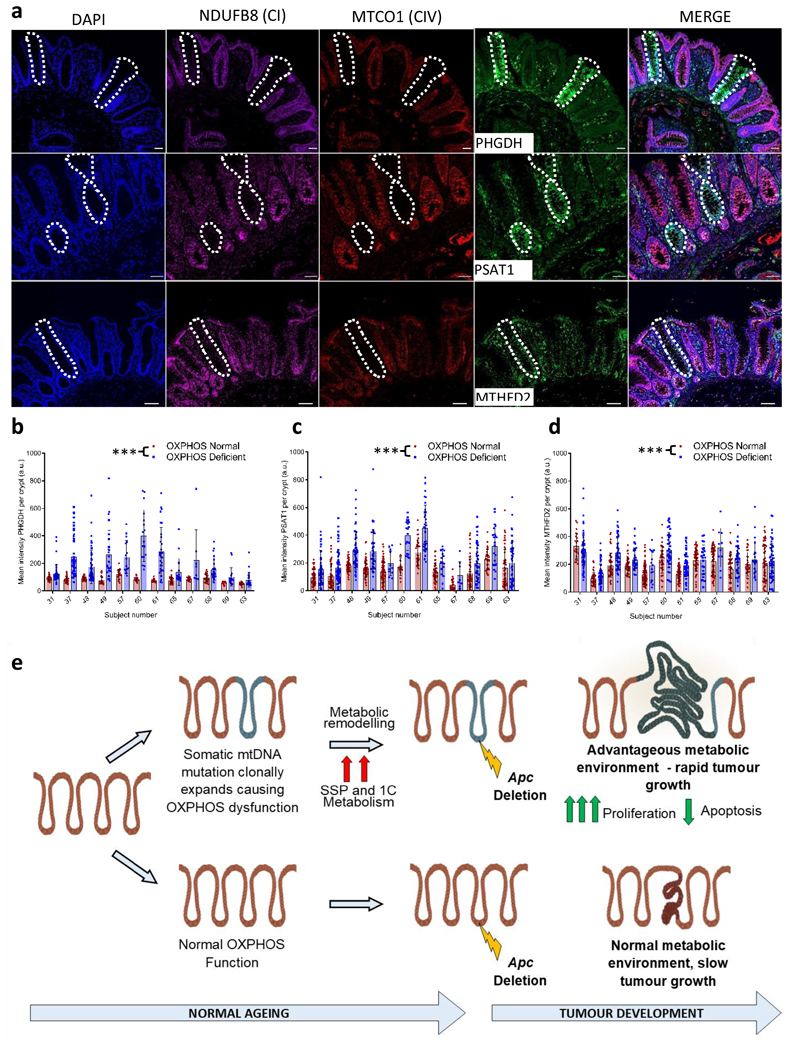
Our mouse experiments have provided evidence that mitochondrial OXPHOS dysfunction can induce metabolic remodelling in the mouse SI and colon. Finally, it was important to see whether these findings were translatable to humans. We tested this by quantifying levels of PHGDH, PSAT1 and MTHFD2 in individual OXPHOS normal and OXPHOS deficient crypts from aged human samples by immunofluorescence. Levels of all three enzymes were significantly higher in crypts with OXPHOS defects than those with normal OXPHOS function (Fig. 7a-d), suggesting that normal aged human crypts expressing OXPHOS deficiency upregulate the de novo SSP as a pro-survival mechanism.
Figure 7. Mitochondrial OXPHOS dysfunction causes upregulation of de novo serine synthesis in normal ageing human colonic crypts.
Immunoflourescent images showing co-labelling of OXPHOS proteins and SSP enzymes in normal human colonic epithelium. Scale bars; 50µm. Immunofluorescence was performed for each antibody on n=12 human samples. Representative images are shown. b-d: Quantification of the levels of PHGDH, PSAT1 and MTHFD2 in individual human crypts. Every OXPHOS deficient crypt on the section was quantified and OXPHOS normal crypts on the same section were randomly sampled. In b the number of crypts analysed from left to right is: n=45, 46, 40, 62, 43, 50, 28, 29, 21, 16, 16, 17, 33, 31, 41, 17, 20, 8, 32, 27, 15, 17, 24, 24. In c the number of crypts analysed from left to right is: n=47, 57, 58, 70, 44, 56, 54, 39, 73, 11, 21, 20, 33, 33, 39, 16, 30, 8, 61, 45, 31, 22, 51, 49. In d the number of crypts analysed from left to right is: 23, 67, 40, 61, 44, 47, 42, 32, 108, 15, 37, 38, 59, 60, 58, 26, 62, 10, 48, 40, 31, 24, 60, 59. Error bars show mean ±s.d. Data were analysed by two-sided linear mixed effect regression model with mouse ID as a random effect, p<0.0001 in all comparisons. e: Schematic showing the hypothesised mechanism by which mtDNA mutations and OXPHOS defects contribute to tumorigenesis. ***p<0.001
Discussion
Our data show that age-related mitochondrial OXPHOS dysfunction caused by mtDNA mutations in both humans and mice causes metabolic remodelling in intestinal epithelial cells, with specific upregulation of the de novo SSP, and the mouse model shows that this provides a metabolically favourable environment for tumour growth (Fig. 7e). Our human mtDNA sequencing data shows that mtDNA mutations are not a requirement for tumorigenesis as they were not present in all adenocarcinomas studied, highlighting diverse mitochondrial genetic heterogeneity between tumours.In addition, the specific mtDNA mutation and its level of heteroplasmy are important determinants of whether a mtDNA mutation is actively contributing to a favourable metabolic phenotype for the tumour or whether it is simply a passenger mutation. Only those mtDNA mutations which are present both at functionally important sites and at a high enough level of heteroplasmy to cause OXPHOS defects, result in a favourable metabolic shift which, as we have shown in the mouse, can accelerate tumour cell growth. We believe that it is the biochemical change rather than the mutational event per se providing the advantage. By contrast, mtDNA mutations that are present at low levels of heteroplasmy, or ones which do not cause a biochemical defect, fall into the ‘passenger mutation’ category and examples of those were also detected in our study.
The pathways we show to be upregulated in OXPHOS deficient crypts in both our human and mouse data are well recognised as being critical for biomass production during tumour growth34. It is well accepted that only a small proportion of human adenomas go on to become adenocarcinomas35 and that the larger the adenoma, the higher the risk of carcinogenesis36. Therefore, the selective advantage of OXPHOS dysfunction for tumour growth, acting in synergy with nuclear DNA mutations, would be reflected in their increasing prevalence in clinically detectable large adenomas and adenocarcinomas, which is in line with our data. Although our mouse data specifically identified the contribution of pre-existing mtDNA mutations to tumorigenesis, it is also possible that tumour cells can acquire new mtDNA mutations that randomly clonally expand to high levels of heteroplasmy in individual cells during the tumorigenic process. If these mutations cause an OXPHOS defect, together with the associated favourable metabolic phenotype, those cells may outcompete others and become dominant within the tumour. Additional data to support a pro-tumorigenic role for pathogenic mtDNA mutations can be found in a recent pan-cancer analysis of mtDNA (PCAWG Consortium)16. This study showed selective enrichment of truncating mtDNA mutations in the protein-encoding genes at high levels of heteroplasmy (>60%) specifically in colorectal cancers. This was not seen in most other cancer types, with the authors suggesting that these mtDNA mutations could have oncogenic effects by altering signalling pathways16.
In the normal ageing intestine, this metabolic shift in response to OXPHOS deficiency may represent a response to mitochondrial stress, particularly if there are increased mitochondrial ROS levels; diversion of glucose through the SSP to increase glutathione production to help detoxify mitochondrial ROS is documented in mitochondrial disease models37. In addition, mitochondrial ROS play a significant role as signalling molecules in LGR5+ stem cell maintenance and crypt differentiation highlighting the importance of maintaining the required ROS levels for normal crypt cell homeostasis38,39. Through its role as a precursor for the synthesis of nucleic acids, proteins and lipids as well as antioxidants, serine is critical to support metabolic processes for cellular growth and survival in cancer development40. Therefore, the apparently protective cellular response to OXPHOS deficiency during ageing may provide a distinct metabolic advantage for tumour growth when those cells are transformed. The OXPHOS deficiency observed in our mouse model provoked a similar metabolic response (i.e. resistance to serine starvation due to upregulation of the SSP) to that seen in a model with activating Kras mutations in the presence of Apc deletion34. Furthermore, metabolic rewiring has been shown to occur in gliomas containing oncogenic IDH1 mutations in response to oxidative stress, suggesting that mechanisms to maintain cellular redox balance are important for cancer cell survival41. Although we found no significant differences in either the absolute numbers or proportions of immune cell types in our model, we found evidence of low-level OXPHOS defects and a compensatory increase in SSP gene expression in cells of the lamina propria. Therefore, in addition to definitive evidence of the cell intrinsic effect of OXPHOS defects on tumour cell growth, it is possible that the aged microenvironment also plays a role.
We stress that our observations do not indicate that mtDNA-driven OXPHOS deficiency alone is able to initiate cancer as PolgAmut/mut mice do not have a higher tumour incidence compared with age-matched wild-type controls25,26. Rather, we hypothesise that age-related mtDNA mutations act synergistically with driver mutations, which are present in ~1% of normal crypts in middle-aged individuals42, providing an advantageous metabolic environment during the pervasive process of neoplastic change during the colorectal adenoma-carcinoma sequence35. This hypothesis is supported by evidence of an increasing frequency of mtDNA mutations and OXPHOS defects from normal aged human crypts to adenoma to carcinoma.
A logical question arising from our studies is whether there is an increased incidence of colorectal cancer in patients with inherited pathogenic mtDNA mutations causing mitochondrial disease. Although there are no published studies addressing this question, in our clinical experience, we see no evidence to suggest that the patients have an increased incidence of cancer over their lifetime. However, a number of studies have shown there is rapid loss of inherited pathogenic mtDNA mutations in human replicating tissues with age43–48. This is supported by similar findings in mouse models of inherited mtDNA disease 49,50. Specifically looking at data from the gut, this loss of inherited mtDNA mutations results in the frequency of crypts with OXPHOS defects being similar to age-matched controls48,51. We currently do not understand the mechanism by which this selective loss is happening; however, loss of OXPHOS deficient cells from the rapidly proliferating tissues would mean that any metabolic advantage for cancer cells would also be lost. This could explain why these patients do not appear to be at a higher risk of cancer. These observations suggest that inherited and age-associated somatic mtDNA mutations are behaving differently, highlighting the value of using the PolgAmut/mut mouse model in our study to model the ageing human phenotype.
In conclusion, we propose that age-related mitochondrial OXPHOS defects can contribute to accelerated intestinal cancer cell growth and survival through up-regulation of serine biosynthetic pathways. Metabolic pathways are attractive targets for therapeutic intervention and the inherent reliance on the SSP in intestinal tumours with OXPHOS defects may make them selectively vulnerable to SSP inhibition and worthy of future investigation.
Methods
Patients and Samples
Normal colonic epithelial and colorectal adenocarcinoma tissue was obtained from 26 patients undergoing surgical resection for a histopathologically-graded adenocarcinoma diagnosis and from 9 patients undergoing surgery for removal of adenomatous polyps (age range 52-82 years, 20 male, 15 female). Informed written consent was obtained prior to surgery and samples were coded to maintain confidentiality. This project was approved by the Joint Ethics Committee of Newcastle and North Tyneside Health Authority (2001/188) and the National Research Ethics Committee London-Stanmore (11/LO/1613).
Genetically Engineered Mouse Models
Lgr5-EGFP-IRES-creERT2, Apcfl/fl 24 and PolgA+/mut 25 mice were cross bred to generate PolgAmut/mut;Lgr5-creER;Apcfl/fl and Lgr5-creER;Apcfl/fl mice as shown in Extended Data Fig. 3. Mice were maintained on a C57BL/6 background, both sexes were used and researchers were blinded to genotypes. Mice were housed in single sex cages at 20 ± 2°C under a 12 hr light/12 hr dark photoperiod with lights on at 07:00 hr. All animal work was carried out in line with the Animals (Scientific Procedures) Act 1986 and the EU Directive 2010 in compliance with the UK Home Office (PPL P3052AD70) and the Newcastle University Animal Welfare Ethical Review Board (AWERB 425). Both sexes were used in all experiments (except RNASeq where all mice were female) and all mice were 6 months old unless stated.
COX/SDH Histochemistry
Human colon samples were mounted for sectioning and frozen in isopentane pre-cooled to -190°C in liquid nitrogen. Cryostat sections (12 µm) were cut onto glass slides and COX/SDH histochemistry performed as previously described 13.
OXPHOS subunit immunohistochemistry (human samples)
10 μm sections were cut from all samples described above and air dried for 1 hour at room temperature (RT). Immunohistochemistry was performed as previously described11 using the following antibodies; Complex I NDUFB8 1:50, Complex II SDHA 1:1000, Complex III UQCRFS1 1:1000, Complex IV MTCO1 1:1000, combined with a polymer detection system (Menarini Diagnostics). Protein levels were qualitatively scored in tumours compared to patient matched colonic epithelium by two independent scorers. *** normal levels, ** intermediate levels, * low levels, - absence of protein. For adenoma samples, patient matched normal epithelium was not available, therefore we compared with at least 5 samples of normal epithelium from the adenocarcinoma cohort. All normal crypts on each tissue section were analysed (mean; 243 per section, range; 43-769).
DNA isolation from tumour epithelium and normal tissue
Human colon tumour samples or murine small intestinal adenomas were mounted for sectioning and frozen in isopentane pre-cooled to -190°C in liquid nitrogen. 20µm cryostat sections were mounted on PEN (polyethylenenaphthalate) membrane slides (Leica Microsystems). Sections were subjected to SDH histochemistry, followed by ethanol dehydration and were then air-dried for 1 hour. Areas of tumour epithelium were cut into sterile 0.5 ml PCR tubes using a Zeiss PALM micro-dissection system and lysed as previously described13. DNA was extracted from whole tissue from subject matched normal colon using an EZ1 DNA extraction system (Qiagen).
Human mtDNA Sequencing
The entire mtDNA sequence was determined from the adenocarcinoma tissue and subject matched normal colon. MtDNA was PCR-amplified and sequenced and an ABI3130 using ABI3130xl genetic analyser system with ABI 3130 Data Collection Software v4 and analysed as previously described using Seqscape software v2.613. Human adenoma tissue was sequenced as previously described52
Mouse mtDNA sequencing
MtDNA was PCR amplified in two overlapping 9Kb fragments using primer sets 1628F (5’-AGAAAGCGTTCAAGCTCAAC-3’) and 10737R (5’-CCATGAAGCGTCTAAGGTGTG-3’) and 10059F (5’-ACCATCTTAGTTTTCGCAGC-3’ and 2315R (5’-CACTTTGACTTGTAAGTCTAGG-3’) (numbers correspond to NC_005089.1). PCR parameters were; an initial denaturation at 94 °C for 10 min followed by 30 cycles of denaturation at 94 °C for 20 s, primer annealing at 68 °C for 20 s, extension for 9 min at 68 °C and a final extension at 72 °C for 5 min. PCR products were purified, sequenced on a MiSeq (Illumina) using MiSeq control software, and bioinformatic analysis performed as previously described52 with the exception that the mouse mtDNA reference sequence was used (NC_005089.1 and MM10). Software used in the bioinformatics analysis was as follows: BWA v0.7, Samtools v0.1.18, Picard v1.85, VarScan v2.3.8, LoFreq v0.6.1, ANNOVAR v529, Haplogrep v2.
Tamoxifen induction
PolgAmut/mut;Lgr5-creER;Apcfl/fl and Lgr5-creER;Apcfl/fl mice aged 6 months were injected intraperitoneally with 4 doses of tamoxifen in sunflower oil at 10 mg/ml over 4 consecutive days (300µl, 200µl, 200µl, 200µl).
Scoring of macroscopic adenomas
Mice were culled 23 days post-tamoxifen administration, their intestines removed, flushed with 10% neutral buffered formalin, opened up and pinned out as intestinal whole mounts. Using a dissecting microscope, intestinal adenomas (minimum 1mmx1mm) were counted and their areas measured. For fused adenomas the total area was measured. For comparative analysis between PolgAmut/mut;Apcfl/fl (n=17) and;Apcfl/fl (n=12) mice, the total sum of the adenomatous area was calculated. Adenomas were counted blind by two independent scorers.
Immunohistochemistry
4µm sections were de-paraffinised and rehydrated as standard. Antigen retrieval was performed by pressure-cooking in either 1mM EDTA pH8.0 (β-Catenin, CD3, OXPHOS antibodies) or 10mM sodium citrate, pH6.0 (PSAT1, PHGDH, MTHFD2, Cleaved-caspase 3, CD45R, NIMP1) for 20 minutes. Standard immunohistochemistry was performed using the following antibodies; rabbit anti-β-Catenin (1:1000), anti-MTHFD2 (1:600), anti-PSAT1 (1:600), anti-PHGDH (1:4000), anti-cleaved caspase 3 (1:35), rat anti-CD45R (1:200), anti-CD3 (1:100), anti-NIMP1 (1:100). Rabbit primary antibodies were visualised using the Envision Anti-rabbit HRP polymer kit (Dako) as per the manufacturer’s instructions, rat primary antibodies were detected and visualised using goat anti-IgG:Biotin and a HRP-conjugated ABC kit (Vector). All immunohistochemistry slides were imaged using the Aperio virtual pathology system (Leica Microsystems, UK) and analysed using Aperio Imagescope v12.4
Immunofluorescence
Sections were prepared and antigen retrieval performed as for IHC. Sections were incubated in primary antibodies at 4°C overnight. Primary antibodies; anti-NDUFB8 (1:50), anti-UQCRFS1 (1:100), anti-MTCO1(1:100), anti-ATPB (1:100), anti-TOMM20 (1:100), anti-IdU (1:100), anti-BrdU (1:100), anti-GFP biotin (1:100), anti-MTHFD2 (mouse 1:300, human 1:90), anti-PSAT1 (mouse 1:300, human 1:90), anti-PHGDH (mouse 1:2000, human 1:300). Sections were washed in TBST and incubated in secondary antibodies for 2 hours at RT. Secondary antibodies (all diluted 1:200 unless stated); goat anti-mouse IgG1 biotin- goat anti-mouse IgG2b-546, goat anti-rabbit IgG-488, goat anti-mouse IgG2a-546, goat anti-mouse IgG1-647, donkey anti-mouse IgG-488 (1:150), donkey anti-rat IgG-Cy5, streptavidin -546, donkey anti-rabbit-750. Sections were then washed. With cocktails including NDUFB8, sections were incubated in tertiary antibody; streptavidin-647 for 2 hours at RT. All sections were stained with Hoechst 33342 (Invitrogen).
(TdT)-mediated dUTP nick end (TUNEL) labelling
TUNEL labelling was performed using an In Situ Cell Death Detection kit (Merck, 11684817910) as per the manufacturer’s standard protocol with the following exceptions; the enzyme solution was diluted 1:40 in TUNEL dilution buffer (Merck, 11966006001) and the convertor-POD was diluted 1:2 in PBS.
OXPHOS protein quantification, image analysis and Z-score generation (mouse)
Sections were imaged using a Nikon A1R inverted confocal microscope and were analysed using Image J software (NIH). Adenomas (n=9 PolgAmut/mut;Lgr5-creER;Apcfl/fl mice per group, n=10 Lgr5-creER;Apcfl/fl mice per group minimum of 20 crypts/mouse), normal crypts (n=5 mice/ group, minimum of 10 crypts/ mouse), or small areas of lamina propria containing approximately 5-10 stromal cells (n=5 mice per group, minimum of 50 areas per mouse), were selected as regions of interest (ROI) and fluorophore mean intensity values recorded for each channel. Values were background corrected by subtracting the mean intensity of a no primary control (NPC) from the ROI mean. Z-scores were generated using in house software (available at http://mito.ncl.ac.uk/immuno/) as previously described29.
OXPHOS/SSP protein quantification, image analysis and Z-score generation (human)
OXPHOS and OXPHOS/SSP IF was performed as above on four serial sections per subject (n=12). The first section was labelled with antibodies against NDUFB8, MTCO1 and TOMM 20 and OXPHOS proteins quantified and crypts categorised as OXPHOS positive or deficient based on their Z-scores. The second-fourth sections were labelled with antibodies against NDUFB8, MTCO1 and one of either PHGDH, PSAT1 or MTHFD2. The same crypts were identified in all serial sections and levels of SSP enzymes quantified. Data were binned into OXPHOS normal or OXPHOS deficient and SSP enzyme proteins levels compared. Every OXPHOS deficient crypt on the section was quantified (range n=8 to n=108) and OXPHOS normal crypts on the same section were randomly selected based on the DAPI channel and quantified.
Thymidine analogue labelling, immunofluorescence and analysis
16 days post-Apc deletion mice (n=5 per group) were injected with 300μl CldU (C6891, Sigma Aldrich) 28 and 20 hours before death. 4 hours before death, mice were injected with 300 μl IdU (I7125, Sigma Aldrich). IF was performed as above. Twenty adenomas per mouse were manually identified and imaged using a Zeiss AxioImager M1 fluorescent microscope. Zeiss ZEN Lite (Blue Edition) was used to quantify cells labelled with a single antibody and cells in which co-localisation of >1 antibody was observed.
Scoring of β-cateninhigh foci
Two serial sections were taken for scoring β-cateninhigh foci; the first was subjected to β-catenin immunohistochemistry and the adjacent section to standard haematoxylin and eosin (H&E) staining as previously described13. β-catenin high foci were scored as clusters of cells that showed both increased nuclear and cytoplasmic β-catenin when compared to surrounding cells. H&E sections were used to confirm the dysplastic nature of the cells. Areas of β-cateninhigh cell clusters were measured, with cells being classed as belonging to the same cluster or foci if there were no normal crypts separating them.Sections were scored blind by two people independently.
Scoring of apoptotic cells
Apoptotic cells were labelled in colon and small intestine (SI) tissue sections from n=9 mice per group by two methods; Cleaved caspase 3 IHC and the TUNEL assay. For the SI n=9 mice were analysed per assay per group. For the colon n=7 PolgAmut/mut;Lgr5-creER;Apcfl/fl mice and n=9 Lgr5-creER;Apcfl/fl mice were analysed per group using cleaved caspase 3 IHC and n=9 mice per group for the TUNEL assay. A minimum of 10 adenomas were analysed per mouse. Apoptotic cells were counted and presented as the percentage of total nuclei in the adenoma.
Quantification of CD3, CD45R and NIMP1 positive cells
SI sections from n=5 PolgAmut/mut and PolgA+/+ mice underwent immunohistochemistry as above to identify CD3+, CD45R+ and NIMP1+ cells.. 10 random x20 magnification images were taken per section and the number of positive cells/field of view counted. The total area of epithelium was measured and the frequency of positive cells/mm2 calculated. Areas containing Peyers patches were excluded.
Small intestinal crypt and stromal RNA extraction
SI crypts were isolated from the stroma from the distal SI as previously described53. Crypt pellets and stromal pellets were flash frozen in liquid nitrogen and stored at -80°C. RNA was extracted using the RNeasy Mini Kit with DNase (Qiagen) using the manufacturer’s protocol. Sample RNA integrity (RIN) scores were analysed on a 2100 Bioanlyser (Agilent) using the RNA 600 Nanokit, and 2100 Expert software vB02.9.
RNASeq
Crypt RNA from Polgmut/mut (n=4) and PolgA+/+ (n=4) mice with RIN score >7.0 (range 7.5-9.2) were used in differential gene expression analysis. Crypt mRNA libraries were prepared using the TruSeq Stranded mRNA library kit (Illumina). Samples were analysed using the NextSeq 500 system (Illumina) with 16 million 75 bp single reads per sample. All samples were quality assessed using FASTQC v 0.11.7, before processing in accordance to the protocol in54–57 using Stringtie v.1.3.4 and Ballgown v3.8. Alignment and annotation used the Hisat2 mm10 genome build (Hisat2 v.2.1.0) and the Ensembl GTF v.GRCm38.92 respectively. The resultant gene lists were then submitted to Enrichr webserver58,59 to obtain ontology information.
SI adenoma RNA extraction
The distal SI was extracted from 6-month-old PolgAmut/mut;Lgr5-creER;Apcfl/fl and Lgr5-creER;Apcfl/fl mice at 23 days post tamoxifen induction. Tissue was flushed with PBS, opened longitudinally and rolled up, followed by freezing in isopentane cooled to -190°C in liquid nitrogen. 15 µM SI tissue sections were cut on PEN membrane slides. Sections were fixed in 75% ethanol and stained in 1% cresyl violet acetate (in 50% ethanol). Sections were dehydrated in a graded ethanol series and air-dried for 5 minutes. Laser microdissection of adenomas was performed using the Zeiss PALM micro-dissection system. Adenoma RNA was isolated using the RNeasy Micro kit with DNase (Qiagen).
qRT-PCR
High-Capacity cDNA Reverse Transcription Kit (Applied Biosystems) was used to reverse transcribe RNA from crypt, stromal and adenoma samples. qRT-PCR was performed in triplicate using validated Taqman® assays for Phgdh, Psat1, Psph, Mthfd2, Aldh1l2 and Slc1a4 with Taqman® Universal PCR master mix (Applied Biosystems) on the Applied Biosystems StepOnePlus Real-Time PCR system. 14 crypt samples (n=7 per group), 12 stromal samples (n=6 per group), and 12 adenoma samples (n=6 per group) were analysed by StepOne™ Software v2.1. The comparative CT method was used with Actb mRNA as a reference to generate ΔCT values in Microsoft Excel 2016.
Adenoma Organoid Generation
Lgr5-creER;Apcfl/fl and PolgAmut/mut;Lgr5-creER;Apcfl/fl mice were induced with tamoxifen across 4 days (3, 2, 2, 2 mg) at 6 months and SI adenomas were isolated ~3 weeks after induction. Organoids were generated and maintained as previously described34.
Growth analysis in SG- medium
Adenoma cultures from;Apcfl/fl (n=3) and PolgAmut/mut;Apcfl/fl (n=3) mice were collected in PBS, pelleted, and re-suspended in 50% Matrigel (v/v) in PBS in a 96-well plate. Amino acid free Advanced DMEM/F-12 (Life Technologies) was reconstituted with appropriate concentrations of amino acids. Cultures were grown in complete (+SG) or serine and glycine free (-SG) medium for 5 days at 37°C and 5% CO2, with media refreshed after three days. Images of 4 points per well were taken every two hours using IncuCyte™ ZOOM (Essen BioScience Inc.) equipped with their Dual Color Filter Cube #4459 and a Nikon 10X objective, using IncuCyte ZOOM 2018A (v20181.1.6628.28170) software. Organoid 2D area on day 0 and day 5 were measured using ImageJ v1.51.
Mitochondrial functional assay
The XF Cell Mito Stress Test Kit (Seahorse Bioscience), was performed using the adenoma organoids. One day prior to the assay 96 well plates were prepared with Matrigel as previously described 60.Intestinal adenoma cultures from Apcfl/fl (n=3) and PolgAmut/mut; Apcfl/fl (n=3) were collected three days post-seeding, pooled, washed and pelleted. Pellets were re-suspended in Mito XF medium. The Mito Stress Test was performed as per the manufacturer’s standard protocol on a Seahorse XF96 Extracellular Flux analyser. Data were collected using Agilent Seahorse Wave software v2.4.Following analysis, organoids were fixed in 10% neutral buffered formalin for 30 min at RT. Formalin was then removed and plates left to air-dry overnight. Organoids were incubated in cresyl violet at RT for 30 min then washed in dH2O overnight followed by incubation in 10mM acetic acid on a shaker at RT for 30 min. Optical intensity was measured at 562nm and read-outs were used to normalise OCR measurements.
Metabolomic analysis
Organoid cultures were plated in technical triplicate in 24-well plates and three days post-seeding, medium was changed to include 13C6 labelled glucose (Cambridge Isotope Laboratories) minus HEPES and nystatin. Samples were prepared and underwent LC-MS as previously described34. Metabolite peak areas were determined using Thermo TraceFinder (v3.2). Commercial standards of all metabolites detected had been previously analysed on this LC-MS system with the pHLIC column. 13C labelling patterns were determined by measuring peak areas for the accurate mass of each isotopologue of many metabolites. Metabolite levels were normalized to total cell protein. LC-MS protocol adapted from reference 61
Complex I inhibition of adenoma organoids with metformin
Adenoma organoids from Apcfl/flmice (n=3) were washed in PBS, re-suspended in 100 µL CellTracker™ green CMFDA (1:200 in media) and incubated at 37°C for 10 minutes. After cells were pelleted, washed and re-suspended in Matrigel, seeded in 96 well plates, and complete media added. Cells were imaged on the Zeiss LSM 800 confocal microscope at 2.5X magnification to generate 1mm thick Z-stacks of 25 slices. Organoids were then dosed with 0–500 µM metformin in DMSO (3 technical replicates/dose/mouse). On the fifth day, organoids were stained with DAPI (1:200), washed and imaged as above. Images were stitched using Zen v2.6 and channels were deconvolved using Huygens software v18.04. Surfaces were created in Imaris v9.0 using the CellTracker or DAPI labelling. A threshold of >200,000 µm2 was applied and the volumetric size of organoids on day 5 were normalised to day 1.
FACS Analysis of Small intestinal lymphocytes
Lamina propria lymphocytes were extracted from 6-month old PolgA+/+ and PolgAmut/mut mice (n=3/genotype) as follows: SIs were extracted, cleared of mesentery, fat and Peyers Patches, cut into pieces and washed in HBSS without calcium and magnesium. Intraepithelial lymphocytes were removed by agitation for 15min in HBSS with 20mM HEPES and 2% FCS. The remaining tissue was digested in serum free medium containing Liberase TL (250µg/ml; Roche) and 0.05% DNase I (Roche) for 15min. Lamina propria lymphocytes were separated from epithelial cells by centrifugation in 40% Percoll and cell pellets collected.
Lymphocytes were washed once with PBS and then stained with LIVE/Dead stain (Invitrogen 34961) for 30 min at 40°C. Cells were then washed once with PBS and stained with the following surface CD4, CD8, CD45R/B220, NK1.1, CD11b, CD11c, F4/80, Class II (anti-mouse I-A/I-E). Cells were analysed using LSRII (FACS DIVA v8 software) and by FlowJo v10 software.
Statistics and Reproducibility
Statistical comparisons for survival data were performed using GraphPad Prism (v8.3.1) software using Mantel-Cox (Log-Rank) test. Unpaired t-tests and Mann-Whitney tests were performed using GraphPad Prism (v8.3.1). Where no predication was made about the direction of a potential difference, two-tailed tests were used (e.g. Fig. 3c). Where pre-existing data supported a prediction in the direction of a difference between samples, a one-tailed t-test was used (e.g. Fig. 5b-c). Where multiple comparisons were made, one-way ANOVA was calculated using GraphPad Prism (v8.3.1), followed by Tukey post-test (e.g. Fig 4f). Linear mixed-effect models were employed to compare the tumour sizes, cell proliferation apoptotic and immune cell (IHC) frequencies for each group (e.g. Fig 3e-h). This allowed variation between individual mice and sample location to be accounted for as random effects within the model structure. Tumour data was logged to approximate a normal distribution. For analysis of organoids following Metformin dosing estimation graphics for observed organoid sizes were displayed on Gardner Altman plots 62. This allows the distribution of the mean difference to be observed though bootstrapping 63, generating a robust sampling-error curve with a 95% confidence interval. Analysis was conducted using the R programming language (code available on request)64 (R Studio v3.4.0). In all figures where data shown are the mean per mouse/human of multiple measurements, data shown are mean ±s.e.m, where they are a single data point per mouse/human data shown are mean ±s.d. All P values are: * p<0.05, **p<0.01, ***p<0.001.
Sample sizes were chosen based on previous studies and our experience using these models which had shown robust statistical power. No statistical methods were used to predetermine sample size. All experiments were successfully replicated. For mouse studies a minimum of 4 mice were used, and organoid cultures were generated from 3 different animals and a minimum of 3 independent cultures per mouse used in each experiment. All mouse and organoid work was replicated in at least 2 independent experiments. For IHC or IF experiments, preliminary staining was performed on n=3-5 samples then optimised staining performed on the entire cohort (minimum n=3 biological replicates (e.g. 3 mice or human samples) per experiment) at the same time. Image analysis was performed at the same time for each experiment. Mouse experiments were not randomized, animals were allocated to experimental groups based on their genotype. Investigators were blinded to the genotypes of the animals during the experiments and data analysis.
Further information on research design is available in the Nature Research Reporting Summary linked to this article
Extended Data
Extended Data Fig. 1. Generation of PolgAmut/mut;Lgr5-creER;Apcfl/fl and Lgr5-creER;Apcfl/fl mice and analysis of colonic adenomas.
a: Breeding scheme. MtDNA mutations can be transmitted down the maternal germline65 therefore it was essential that only Lgr5-creER;Apcfl/fl (red) mice from a wild-type PolgA mother used as controls. b: Kaplan-Meier survival curve showing survival time following tamoxifen administration in PolgAmut/mut mice. Survival to clinical endpoint or experimental endpoint of 60 days is shown, ‘n’ = number of mice. c: β-Catenin immunohistochemistry was performed on colon sections from n=17 PolgAmut/mut;Apcfl/fl mice and n=13 Apcfl/fl mice. Representative images are shown (scale bars 3mm (first column) and 200µm). d: Frequency of adenomas in the colon 23 days post-Apc deletion (unpaired, two tailed, t-test, p=0.7444), n=17 PolgAmut/mut;Apcfl/fl mice and n=13 Apcfl/fl mice, data are mean ±s.d. e: Mean adenoma size in the colon in n=17 PolgAmut/mut;Apcfl/fl mice and n=13 Apcfl/fl mice 23 days post-Apc deletion. All adenomas on a section were quantified ranging from 5 to 280, mean per mouse ± s.e.m are shown. Two-sided linear mixed effect regression model with mouse ID as a random effect, p<0.0001. f-g: Quantification of the frequency of thymidine analogue incorporation in all cells per colonic adenoma (f) and LGR5+ cells per colon adenoma per mouse (g). n=5 mice per group with 18 adenomas analysed per mouse. Mean frequency per adenoma per mouse ± s.e.m is shown. Two-sided linear mixed effect regression model with mouse ID as a random effect, p<0.001. h-i: Apoptotic cells were quantified using (h) cleaved caspase 3 (CC3) immunohistochemistry n=7 PolgAmut/mut;Apcfl/fl mice and n=9 Apcfl/fl mice and (i) TUNEL labelling (n=9 mice per group) in mice 23 days post-Apc deletion. A minimum of 10 adenomas were analysed per mouse, mean percentage of apoptotic cells per adenoma per mouse ±s.e.m is shown. Two-sided linear mixed effect regression model with mouse ID as a random effect, CC3 p=0.0092, TUNEL p= 0.002. * p<0.05, **p<0.01, ***p<0.001.
Extended Data Fig. 2. Colonic adenomas from PolgAmut/mut;Apcfl/fl mice are deficient in mitochondrial complex I, but the majority retain expression of subunits of complexes III, IV and V.
a and b: Immunofluorescence was performed to quantify levels of OXPHOS proteins in n=9 PolgAmut/mut;Apcfl/fl mice and n=9 Apcfl/fl mice. Representative images are shown. Scale bars 50µm. An adenoma deficient in complex I is highlighted by the white dashed line in a. The white dashed line highlights an adenoma deficient in complex IV, and red dashed line shows one with normal complex IV in b. c and d: dot plots showing Z-scores calculated following quantification of mitochondrial OXPHOS protein levels in adenomas from n=9 PolgAmut/mut;Apcfl/fl and n=9 Apcfl/fl mice with 20 adenomas quantified per mouse. e : Categorical analysis of OXPHOS protein levels in PolgAmut/mut;Apcfl/fl (n=9) and Apcfl/fl (n=9) mice, error bars show mean ±s.d. f-g : dot plots showing Z-scores calculated following quantification of mitochondrial OXPHOS protein levels in normal crypts and adenomas in the small intestine (f) and the colon (g). f : For the adenomas: n=9 PolgAmut/mut;Apcfl/fl and n=10 Apcfl/fl mice were analysed with 20 adenomas quantified per mouse. For the normal crypts, n=5 mice were analysed with a minimum of 13 crypts quantified per mouse. g : For the colonic adenomas: n=9 mice per group were analysed with a minimum of 20 adenomas quantified per mouse. For the normal crypts, n=6 Apcfl/fl mice and n=7 PolgAmut/mut;Apcfl/fl mice were analysed with a minimum of 22 crypts quantified per mouse. h Dot plots showing raw densitometry values for mitochondrial protein levels in the colon (n numbers same as in g, error bars are s.d.). One-way ANOVA with Tukey’s post-test. P values for within genotype comparisons between normal crypts and adenomas were as follows: TOMM20: Apcfl/fl p<0.0001, PolgAmut/mut;Apcfl/fl p<0.0001, NDUFB8: Apcfl/fl p<0.0001, PolgAmut/mut;Apcfl/fl p=0.9761, UQCRFS1: Apcfl/fl p<0.0001, PolgAmut/mut;Apcfl/fl p=0.2901, MTCO1: Apcfl/fl p<0.0001, PolgAmut/mut;Apcfl/fl p=0.0007, ATPB: Apcfl/fl p<0.0001, PolgAmut/mut;Apcfl/fl p<0.0001. For all panels: * p<0.05, **p<0.01, ***p<0.001
Extended Data Fig. 3. Analysis of mitochondrial DNA (mtDNA) mutations detected in individual small intestinal adenomas from PolgAmut/mut;Apcfl/fl and Apcfl/fl mice.
a: The frequency of heteroplasmic variants >3% detected in adenomas from PolgAmut/mut;Apcfl/fl (n=3 mice per group and n=10 adenomas per mouse) and Apcfl/fl mice (n=3 mice per group, n=5 adenomas per mouse), mean ±s.d. are shown. b-d: Analysis of mtDNA variants present at >30% heteroplasmy in individual adenomas from PolgAmut/mut;Apcfl/fl mice (n=413 mtDNA mutations in total). For location (b), expected values were calculated based on the proportion of the mitochondrial genome taken up by each gene category and observed and expected values compared using Chi-squared analysis. No significant deviation from the expected frequencies was detected (p=0.4744).
Extended Data Fig. 4. Mitochondrial OXPHOS dysfunction causes upregulation of de novo serine synthesis in vivo in the mouse colon.
Immunohistochemistry images showing in situ levels of SSP proteins in the non-transformed normal colonic mucosa (a) and adenomas (b) of PolgA+/+ and PolgAmut/mut mice. Immunohistochemistry was performed on n=4 mice per group. Representative images are shown. Scale bars 50µm.
Extended Data Fig. 5. Immunofluorescent images showing the levels of PHGDH, PSAT1 and MTHFD2 in PolgA+/+ and PolgAmut/mut mice from 1-12 months of age.
Immunofluorescence was performed on n=3 mice per group at each time point. Representative images are shown. Scale bars 50µm.
Extended Data Fig. 6. Quantification of major mass isotopomers following growth of adenoma organods in 13C6-glucose and adenoma organoid growth in to the presence of metformin.
a: Quantification of major mass isotopomers following growth in the presence of 13C6-glucose for 24 hours. 13C labelling is shown as M+6 (glucose) and M+0 denotes no labelling. No significant differences were found between organoids from Apcfl/fl mice compared with PolgAmut/mut;Apcfl/fl mice by one-tailed unpaired t-test. n=3 mice per group with 3 technical replicates performed per mouse. Error bars show s.e.m. b: A shared group estimation plot comparing the effect of metformin on the volume of individual adenoma organoids generated from Apcfl/fl mice (n=3) on days 1 and 5 post seeding. Volume data are normalised to day 1. On day 1 the numbers of organoids measured were: 0µM: n=739, 100µM: n=796, 250µM: n=711, 500µM: n=652. On day 5 the numbers of organoids measured were: 0µM: n=1060, 100µM: n=1515, 250µM: n=1088, 500µM: n=1431. Bootstrap estimation of group mean differences (circle) and 95% confidence intervals (vertical bars) are plotted as a sampling distribution.
Supplementary Material
Acknowledgements
We thank T Prolla (University of Wisconsin, Washington, USA) for donating the PolgA+/mut mice. We thank C Alston for assistance in the analysis of mtDNA mutations and staff in the Newcastle University Comparative Biology Centre for the animal husbandry. This work was supported by the Wellcome Centre for Mitochondrial Research [203105/Z/16/Z], Newcastle University Centre for Ageing and Vitality (supported by the Biotechnology and Biological Sciences Research Council, Engineering and Physical Sciences Research Council, Economic and Social Research Council and Medical Research Council [MR/L016354/1]), the UK NIHR Biomedical Research Centre in Age and Age Related Diseases award to the Newcastle upon Tyne Hospitals NHS Foundation Trust and the NC3Rs (C.A.R, NC/K500513/1). OJS is supported by Cancer Research UK grants (A25045,A17196,A12481 and A21139). OJS and DG were supported by ERC starting Grant 311301 awarded to OJS. FO is supported by the Medical Research Council (MR/R023026/1). JL is supported by Cancer Research UK (C18342/A23390)
Footnotes
Author Contributions
L.C.G., C.B., C.S., and C.A.R. performed breeding and phenotypic analyses of mice. A.L.M.S., D.H., M.H., J.N.S., and A.B. performed histology, immunohistochemistry, immunofluorescence and analysis of mouse and human samples. L.C.G., O.M.R., R.J. and B.G. performed sequencing and histological analysis of human samples. S.A.C.M, I.M., S.K., and J.C.M., collected and processed human samples. J.C.W. performed molecular biology and cell culture experiments. G.H and A.P. performed sequencing and bioinformatic analyses of the mouse and human adenomas. Flow cytometric immunophenotyping of the small intestine was carried out by S.A. and G.M. J.L. and F.O. performed the immune cell IHC. L.W. carried out imaging and analysis of the immune cell IHC. F.R. performed statistical analysis of the RNASeq data. A.P.B. performed statistical analysis of the experimental data. D.G. J.C.W, and O.J.S., performed the metabolomic analyses and analysed the data. L.C.G., R.W.T., R.H., D.M.T., N.D.P and O.J.S, conceived the ideas, designed the experiments, and interpreted the data. All authors contributed to writing and revising the paper.
Competing interests: F.O is a director of Fibrofind limited. J.L and F.O are shareholders in Fibrofind limited. The remaining authors declare no competing financial interests.
Data Availability Statement
RNASeq and DNA next generation sequencing data has been deposited in the Sequence Read Archive under Bioproject accession code PRJNA645504. Source data is provided for Figures 1c, 2d-g, 3a,c,e-h, 4c-f, 5b,c, g-i, 6a-g, 7b-d and for Extended Data Figures 1b, d-i, 2c-h, 3a-d, and 6. All other data supporting the findings of this study are available from the corresponding author on reasonable request
Code Availability
Code used to generate mitochondrial OXPHOS Z-scores and dot pots is freely available at http://mito.ncl.ac.uk/immuno/. R-programming code used in linear regression mixed effect modelling is available upon request.
References
- 1.Warburg O. On the origin of cancer cells. Science. 1956;123:309–314. doi: 10.1126/science.123.3191.309. [DOI] [PubMed] [Google Scholar]
- 2.Warburg O. On respiratory impairment in cancer cells. Science. 1956;124:269–270. [PubMed] [Google Scholar]
- 3.Pedersen PL. Tumor mitochondria and the bioenergetics of cancer cells. Prog Exp Tumor Res. 1978;22:190–274. doi: 10.1159/000401202. [DOI] [PubMed] [Google Scholar]
- 4.Marchetti P, et al. Mitochondrial permeability transition is a central coordinating event of apoptosis. J Exp Med. 1996;184:1155–1160. doi: 10.1084/jem.184.3.1155. [DOI] [PMC free article] [PubMed] [Google Scholar]
- 5.Rosenzweig A, Blenis J, Gomes AP. Beyond the Warburg Effect: How Do Cancer Cells Regulate One-Carbon Metabolism? Frontiers in Cell and Developmental Biology. 2018;6 doi: 10.3389/fcell.2018.00090. [DOI] [PMC free article] [PubMed] [Google Scholar]
- 6.Diebold L, Chandel NS. Mitochondrial ROS regulation of proliferating cells. Free Radic Biol Med. 2016;100:86–93. doi: 10.1016/j.freeradbiomed.2016.04.198. [DOI] [PubMed] [Google Scholar]
- 7.Bender A, et al. High levels of mitochondrial DNA deletions in substantia nigra neurons in aging and Parkinson disease. Nat Genet. 2006;38:515–517. doi: 10.1038/ng1769. [DOI] [PubMed] [Google Scholar]
- 8.Fellous TG, et al. Locating the stem cell niche and tracing hepatocyte lineages in human liver. Hepatology. 2009;49:1655–1663. doi: 10.1002/hep.22791. [DOI] [PubMed] [Google Scholar]
- 9.Muller-Hocker J. Cytochrome-c-oxidase deficient cardiomyocytes in the human heart--an age-related phenomenon. A histochemical ultracytochemical study. Am J Pathol. 1989;134:1167–1173. [PMC free article] [PubMed] [Google Scholar]
- 10.Muller-Hocker J. Cytochrome c oxidase deficient fibres in the limb muscle and diaphragm of man without muscular disease: an age-related alteration. J Neurol Sci. 1990;100:14–21. doi: 10.1016/0022-510x(90)90006-9. [DOI] [PubMed] [Google Scholar]
- 11.Greaves LC, et al. Defects in multiple complexes of the respiratory chain are present in ageing human colonic crypts. Exp Gerontol. 2010;45:573–579. doi: 10.1016/j.exger.2010.01.013. doi:S0531-5565(10)00047-1 [pii] [DOI] [PMC free article] [PubMed] [Google Scholar]
- 12.Greaves LC, et al. Clonal Expansion of Early to Mid-Life Mitochondrial DNA Point Mutations Drives Mitochondrial Dysfunction during Human Ageing. PLoS genetics. 2014;10:e1004620. doi: 10.1371/journal.pgen.1004620. [DOI] [PMC free article] [PubMed] [Google Scholar]
- 13.Taylor RW, et al. Mitochondrial DNA mutations in human colonic crypt stem cells. J Clin Invest. 2003;112:1351–1360. doi: 10.1172/JCI19435. [DOI] [PMC free article] [PubMed] [Google Scholar]
- 14.Lightowlers RN, Chinnery PF, Turnbull DM, Howell N. Mammalian mitochondrial genetics: heredity, heteroplasmy and disease. Trends Genet. 1997;13:450–455. doi: 10.1016/s0168-9525(97)01266-3. [DOI] [PubMed] [Google Scholar]
- 15.Bao XR, et al. Mitochondrial dysfunction remodels one-carbon metabolism in human cells. Elife. 2016;5 doi: 10.7554/eLife.10575. [DOI] [PMC free article] [PubMed] [Google Scholar]
- 16.Yuan Y, et al. Comprehensive molecular characterization of mitochondrial genomes in human cancers. Nat Genet. 2020 doi: 10.1038/s41588-019-0557-x. [DOI] [PMC free article] [PubMed] [Google Scholar]
- 17.He Y, et al. Heteroplasmic mitochondrial DNA mutations in normal and tumour cells. Nature. 2010;464:610–614. doi: 10.1038/nature08802. doi:nature08802 [pii] [DOI] [PMC free article] [PubMed] [Google Scholar]
- 18.Larman TC, et al. Spectrum of somatic mitochondrial mutations in five cancers. Proc Natl Acad Sci U S A. 2012;109:14087–14091. doi: 10.1073/pnas.1211502109. [DOI] [PMC free article] [PubMed] [Google Scholar]
- 19.Polyak K, et al. Somatic mutations of the mitochondrial genome in human colorectal tumours. Nat Genet. 1998;20:291–293. doi: 10.1038/3108. [DOI] [PubMed] [Google Scholar]
- 20.CRUK. Bowel Cancer Statistics. < http://www.cancerresearchuk.org/health-professional/cancer-statistics/statistics-by-cancer-type/bowel-cancer>.
- 21.Greaves LC, et al. Comparison of mitochondrial mutation spectra in ageing human colonic epithelium and disease: absence of evidence for purifying selection in somatic mitochondrial DNA point mutations. PLoS genetics. 2012;8:e1003082. doi: 10.1371/journal.pgen.1003082. [DOI] [PMC free article] [PubMed] [Google Scholar]
- 22.Ericson NG, et al. Decreased mitochondrial DNA mutagenesis in human colorectal cancer. PLoS genetics. 2012;8:e1002689. doi: 10.1371/journal.pgen.1002689. [DOI] [PMC free article] [PubMed] [Google Scholar]
- 23.Greaves LC, et al. Mitochondrial DNA mutations are established in human colonic stem cells, and mutated clones expand by crypt fission. Proc Natl Acad Sci U S A. 2006;103:714–719. doi: 10.1073/pnas.0505903103. [DOI] [PMC free article] [PubMed] [Google Scholar]
- 24.Barker N, et al. Crypt stem cells as the cells-of-origin of intestinal cancer. Nature. 2009;457:608–611. doi: 10.1038/nature07602. doi:nature07602 [pii] [DOI] [PubMed] [Google Scholar]
- 25.Kujoth GC, et al. Mitochondrial DNA mutations, oxidative stress, and apoptosis in mammalian aging. Science. 2005;309:481–484. doi: 10.1126/science.1112125. [DOI] [PubMed] [Google Scholar]
- 26.Trifunovic A, et al. Premature ageing in mice expressing defective mitochondrial DNA polymerase. Nature. 2004;429:417–423. doi: 10.1038/nature02517. [DOI] [PubMed] [Google Scholar]
- 27.Baines HL, et al. Similar patterns of clonally expanded somatic mtDNA mutations in the colon of heterozygous mtDNA mutator mice and ageing humans. Mechanisms of ageing and development. 2014;139c:22–30. doi: 10.1016/j.mad.2014.06.003. [DOI] [PMC free article] [PubMed] [Google Scholar]
- 28.Stamp C, et al. Predominant Asymmetrical Stem Cell Fate Outcome Limits the Rate of Niche Succession in Human Colonic Crypts. EBioMedicine. 2018;31:166–173. doi: 10.1016/j.ebiom.2018.04.017. [DOI] [PMC free article] [PubMed] [Google Scholar]
- 29.Rocha MC, et al. A novel immunofluorescent assay to investigate oxidative phosphorylation deficiency in mitochondrial myopathy: understanding mechanisms and improving diagnosis. Scientific reports. 2015;5:15037. doi: 10.1038/srep15037. [DOI] [PMC free article] [PubMed] [Google Scholar]
- 30.Pate KT, et al. Wnt signaling directs a metabolic program of glycolysis and angiogenesis in colon cancer. EMBO J. 2014;33:1454–1473. doi: 10.15252/embj.201488598. [DOI] [PMC free article] [PubMed] [Google Scholar]
- 31.Fox RG, Magness S, Kujoth GC, Prolla TA, Maeda N. Mitochondrial DNA polymerase editing mutation, PolgD257A, disturbs stem-progenitor cell cycling in the small intestine and restricts excess fat absorption. Am J Physiol Gastrointest Liver Physiol. 2012;302:G914–924. doi: 10.1152/ajpgi.00402.2011. [DOI] [PMC free article] [PubMed] [Google Scholar]
- 32.El-Mir MY, et al. Dimethylbiguanide inhibits cell respiration via an indirect effect targeted on the respiratory chain complex I. J Biol Chem. 2000;275:223–228. doi: 10.1074/jbc.275.1.223. [DOI] [PubMed] [Google Scholar]
- 33.Owen MR, Doran E, Halestrap AP. Evidence that metformin exerts its anti-diabetic effects through inhibition of complex 1 of the mitochondrial respiratory chain. Biochem J. 2000;348(Pt 3):607–614. [PMC free article] [PubMed] [Google Scholar]
- 34.Maddocks ODK, et al. Modulating the therapeutic response of tumours to dietary serine and glycine starvation. Nature. 2017;544:372–376. doi: 10.1038/nature22056. [DOI] [PubMed] [Google Scholar]
- 35.Fearon ER, Vogelstein B. A genetic model for colorectal tumorigenesis. Cell. 1990;61:759–767. doi: 10.1016/0092-8674(90)90186-i. [DOI] [PubMed] [Google Scholar]
- 36.Winawer SJ, et al. Colorectal cancer screening: clinical guidelines and rationale. Gastroenterology. 1997;112:594–642. doi: 10.1053/gast.1997.v112.agast970594. [DOI] [PubMed] [Google Scholar]
- 37.Nikkanen J, et al. Mitochondrial DNA Replication Defects Disturb Cellular dNTP Pools and Remodel One-Carbon Metabolism. Cell Metab. 2016;23:635–648. doi: 10.1016/j.cmet.2016.01.019. [DOI] [PubMed] [Google Scholar]
- 38.Rodriguez-Colman MJ, et al. Interplay between metabolic identities in the intestinal crypt supports stem cell function. Nature. 2017;543:424–427. doi: 10.1038/nature21673. [DOI] [PubMed] [Google Scholar]
- 39.Stringari C, et al. Metabolic trajectory of cellular differentiation in small intestine by Phasor Fluorescence Lifetime Microscopy of NADH. Scientific reports. 2012;2:568. doi: 10.1038/srep00568. [DOI] [PMC free article] [PubMed] [Google Scholar]
- 40.Yang M, Vousden KH. Serine and one-carbon metabolism in cancer. Nat Rev Cancer. 2016;16:650–662. doi: 10.1038/nrc.2016.81. [DOI] [PubMed] [Google Scholar]
- 41.Hollinshead KER, et al. Oncogenic IDH1 Mutations Promote Enhanced Proline Synthesis through PYCR1 to Support the Maintenance of Mitochondrial Redox Homeostasis. Cell Rep. 2018;22:3107–3114. doi: 10.1016/j.celrep.2018.02.084. [DOI] [PMC free article] [PubMed] [Google Scholar]
- 42.Lee-Six H, et al. The landscape of somatic mutation in normal colorectal epithelial cells. Nature. 2019;574:532–537. doi: 10.1038/s41586-019-1672-7. [DOI] [PubMed] [Google Scholar]
- 43.de Laat P, et al. Clinical features and heteroplasmy in blood, urine and saliva in 34 Dutch families carrying the m.3243A >G mutation. J Inherit Metab Dis. 2012;35:1059–1069. doi: 10.1007/s10545-012-9465-2. [DOI] [PMC free article] [PubMed] [Google Scholar]
- 44.Frederiksen AL, et al. Tissue specific distribution of the 3243A->G mtDNA mutation. J Med Genet. 2006;43:671–677. doi: 10.1136/jmg.2005.039339. [DOI] [PMC free article] [PubMed] [Google Scholar]
- 45.Grady JP, et al. mtDNA heteroplasmy level and copy number indicate disease burden in m.3243A>G mitochondrial disease. EMBO Mol Med. 2018;10 doi: 10.15252/emmm.201708262. [DOI] [PMC free article] [PubMed] [Google Scholar]
- 46.Olsson C, et al. The level of the mitochondrial mutation A3243G decreases upon ageing in epithelial cells from individuals with diabetes and deafness. European journal of human genetics:EJHG. 2001;9:917–921. doi: 10.1038/sj.ejhg.5200742. [DOI] [PubMed] [Google Scholar]
- 47.Rahman S, Poulton J, Marchington D, Suomalainen A. Decrease of 3243 A>G mtDNA mutation from blood in MELAS syndrome: a longitudinal study. Am J Hum Genet. 2001;68:238–240. doi: 10.1086/316930. Epub 2000 Nov 2020. [DOI] [PMC free article] [PubMed] [Google Scholar]
- 48.Su T, et al. Inherited pathogenic mitochondrial DNA mutations and gastrointestinal stem cell populations. The Journal of pathology. 2018;246:427–432. doi: 10.1002/path.5156. [DOI] [PMC free article] [PubMed] [Google Scholar]
- 49.Filograna R, et al. Modulation of mtDNA copy number ameliorates the pathological consequences of a heteroplasmic mtDNA mutation in the mouse. Sci Adv. 2019;5:eaav9824. doi: 10.1126/sciadv.aav9824. [DOI] [PMC free article] [PubMed] [Google Scholar]
- 50.Kauppila JHK, et al. A Phenotype-Driven Approach to Generate Mouse Models with Pathogenic mtDNA Mutations Causing Mitochondrial Disease. Cell reports. 2016;16:2980–2990. doi: 10.1016/j.celrep.2016.08.037. [DOI] [PMC free article] [PubMed] [Google Scholar]
- 51.Betts J, et al. Gastrointestinal tract involvement associated with the 3243A>G mitochondrial DNA mutation. Neurology. 2008;70:1290–1292. doi: 10.1212/01.wnl.0000308940.38092.74. doi:70/15/1290 [pii] [DOI] [PubMed] [Google Scholar]
- 52.Coxhead J, et al. Somatic mtDNA variation is an important component of Parkinson's disease. Neurobiol Aging. 2016;38:217 e211–217 e216. doi: 10.1016/j.neurobiolaging.2015.10.036. [DOI] [PMC free article] [PubMed] [Google Scholar]
- 53.Sato T, et al. Single Lgr5 stem cells build crypt-villus structures in vitro without a mesenchymal niche. Nature. 2009;459:262–265. doi: 10.1038/nature07935. [DOI] [PubMed] [Google Scholar]
- 54.Pertea M, Kim D, Pertea GM, Leek JT, Salzberg SL. Transcript-level expression analysis of RNA-seq experiments with HISAT, StringTie and Ballgown. Nature protocols. 2016;11:1650–1667. doi: 10.1038/nprot.2016.095. [DOI] [PMC free article] [PubMed] [Google Scholar]
- 55.Pertea M, et al. StringTie enables improved reconstruction of a transcriptome from RNA-seq reads. Nature Biotechnology. 2015;33:290. doi: 10.1038/nbt.3122. https://www.nature.com/articles/nbt.3122#supplementary-information. [DOI] [PMC free article] [PubMed] [Google Scholar]
- 56.Frazee AC, et al. Ballgown bridges the gap between transcriptome assembly and expression analysis. Nature biotechnology. 2015;33:243–246. doi: 10.1038/nbt.3172. [DOI] [PMC free article] [PubMed] [Google Scholar]
- 57.Kim D, Langmead B, Salzberg SL. HISAT: a fast spliced aligner with low memory requirements. Nature methods. 2015;12:357–360. doi: 10.1038/nmeth.3317. [DOI] [PMC free article] [PubMed] [Google Scholar]
- 58.Chen EY, et al. Enrichr: interactive and collaborative HTML5 gene list enrichment analysis tool. BMC bioinformatics. 2013;14:128. doi: 10.1186/1471-2105-14-128. [DOI] [PMC free article] [PubMed] [Google Scholar]
- 59.Kuleshov MV, et al. Enrichr: a comprehensive gene set enrichment analysis web server 2016 update. Nucleic acids research. 2016;44:W90–97. doi: 10.1093/nar/gkw377. [DOI] [PMC free article] [PubMed] [Google Scholar]
- 60.Fan YY, et al. A bioassay to measure energy metabolism in mouse colonic crypts, organoids, and sorted stem cells. Am J Physiol Gastrointest Liver Physiol. 2015;309:G1–9. doi: 10.1152/ajpgi.00052.2015. [DOI] [PMC free article] [PubMed] [Google Scholar]
- 61.Gonzalez PS, et al. Mannose impairs tumour growth and enhances chemotherapy. Nature. 2018;563:719–723. doi: 10.1038/s41586-018-0729-3. [DOI] [PubMed] [Google Scholar]
- 62.Ho J, Tumkaya T, Aryal S, Choi H, Claridge-Chang A. Moving beyond P values: data analysis with estimation graphics. Nature methods. 2019;16:565–566. doi: 10.1038/s41592-019-0470-3. [DOI] [PubMed] [Google Scholar]
- 63.Efron B, Tibshirani RJ. An introduction to the bootstrap. CRC press; 1994. [Google Scholar]
- 64.R Core Team. R: A language and environment for statistical computing. 2018 https://www.R-project.org/
- 65.Ross JM, et al. Germline mitochondrial DNA mutations aggravate ageing and can impair brain development. Nature. 2013;501:412–415. doi: 10.1038/nature12474. [DOI] [PMC free article] [PubMed] [Google Scholar]
Associated Data
This section collects any data citations, data availability statements, or supplementary materials included in this article.


