Abstract
Metastasis constitutes the primary cause of cancer-related deaths, with the lung being a commonly affected organ. Here we found that activation of lung-resident group 2 innate lymphoid cells (ILC2) orchestrated suppression of Natural Killer (NK) cell-mediated innate anti-tumor immunity, leading to increased lung metastases and mortality. Using multiple models of lung metastasis, we show that IL-33-dependent ILC2-activation in the lung is centrally involved in promoting tumor burden. ILC2-driven innate type-2 inflammation is accompanied by profound local suppression of interferon-γ production and cytotoxic function of lung NK cells. ILC2-dependent suppression of NK cells is elaborated via an innate regulatory mechanism, reliant on IL-5-induced lung eosinophilia, ultimately limiting the metabolic fitness of NK cells. Therapeutic targeting of IL-33 or IL-5 reversed NK cell suppression, and alleviated cancer burden. Thus, we reveal an important function of IL-33 and ILC2 in promoting tumor metastasis via their capacity to suppress innate type-1 immunity.
Many cancers spread to the lung, with grave consequences for patient survival1. For the formation of lung metastases, circulating tumor cells (CTC) must extravasate into the tissue interstitium and evade tissue-resident immune cells. Lung Natural Killer (NK) cells are the innate counterpart to cytotoxic CD8+ T cells and comprise approximately 10-20% of all lung-resident lymphocytes in humans and mice. NK cells are critical for antigen-independent recognition and elimination of infiltrating CTC, as demonstrated by overwhelming metastatic burden in their absence or impairment2.
Group 2 innate lymphoid cells (ILC2) are the innate counterpart to adaptive CD4+ TH2 cells, and like NK cells, comprise a tissue-resident population in the naive lung3. Lung ILC2 are activated by the alarmin interleukin (IL)-33 which is released from various immune and non-immune cell-types upon lung injury, infection, or allergen exposure4. ILC2 mediate innate and adaptive type-2 inflammation through rapid release of effector cytokines such as IL-5 and IL-13, and expression of costimulatory ligands that influence TH2 cells4. ILC2 also closely interact with regulatory T cells (Treg) cells, indicating a potential contribution to immune-suppressive functions5, 6. Relatedly, several groups describe distinct regulatory ILC that can counter type-1 immunity7, 8, or ILC2-specific expression of immune-suppressive molecules9. Nevertheless, it remains unclear if the physiological role of ILC2 extends beyond regulating type-2 immunity.
Although type-2 inflammation is largely associated with tumor progression, via type-2 cytokine-mediated polarisation of alternatively activated macrophages and myeloid derived suppressor cells, IL-33 has both pro- and anti-tumor functions in primary solid, and haematological malignancies10. Similarly, opposing functions for ILC2 are reported in the primary tumor environment11, 12, 13. Nevertheless, type-2 inflammation is associated with metastasis formation 14, 15. Given the central role of lung ILC2 in directing innate and adaptive type-2 immunity4, we hypothesized that ILC2 activation in the pre-metastatic niche can influence the formation of lung metastases.
Here we demonstrate that pre-existing type-2 airway inflammation greatly increases metastatic seeding of the lung in an IL-33- and ILC2-dependent pathway. In addition to orchestrating type-2 inflammation, ILC2 also profoundly suppress NK cell-driven anti-tumor immunity independent of the adaptive immune system. Mechanistically, ILC2 mediate their immunosuppressive effect via recruitment and activation of eosinophils in an IL-5 dependent manner. Eosinophils, but not ILC2, are able to directly suppress NK cell function by modulating the metabolic environment of the inflamed niche. Therapeutic intervention reverses lung NK cell metabolic restraint, effector molecule production and anti-tumor function. As such, we demonstrate the important function of ILC2 in cancer dissemination to the lung, and further reveal a novel immune-regulatory collaboration between ILC2 and eosinophils that antagonizes innate type-1 immunity.
Results
IL-33-driven activation of ILC2 is critical for promoting lung metastases
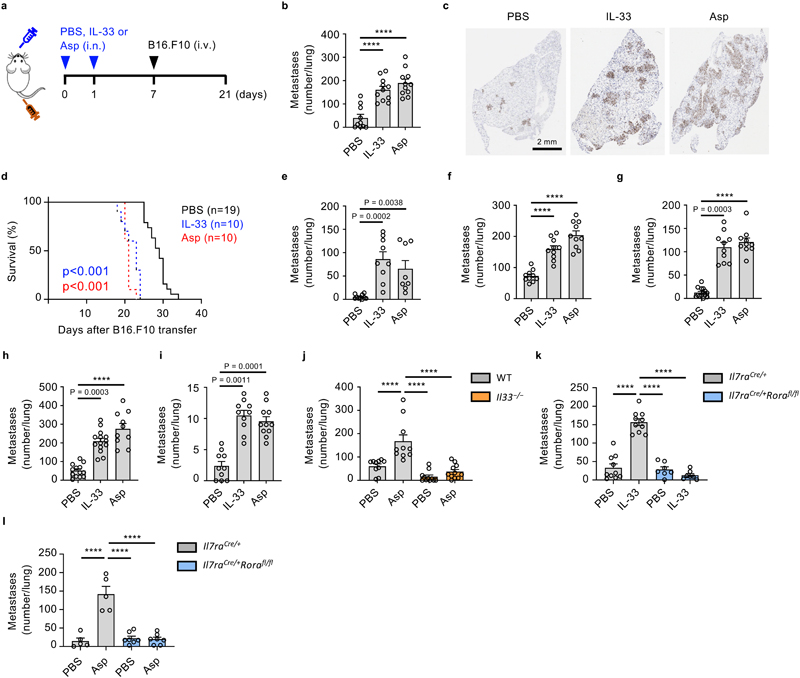
To assess the effect of airway innate type-2 inflammation on lung metastasis formation, we employed a model of IL-33 or Aspergillus protease allergen (Asp) induced airway inflammation prior to adoptive transfer of metastatic B16.F10 melanoma cells (Fig. 1a). We noted a significant increase in metastatic burden by day 21, and increased mortality in both IL-33 or Asp conditioned mice (Fig. 1b, c, d, Extended Data Fig. 1a).
Figure 1. IL-33-driven activation of ILC2 is critical for promoting lung metastases.
a-d, Wild type (WT) mice were treated intranasally with IL-33, Aspergillus protease-allergen (Asp) or PBS, followed by intravenous transfer of metastatic B16.F10 cells, and sacrifice on day 21 (a), and: visual quantification of lung metastases (b) (n = 11), histological staining for Ki67+ tumor cells (c), or kept alive to determine lung metastases-related mortality (d). e, f Lung metastases were visually quantified in mice treated as in Fig. 1a with LL/2 (e) (n = 10,9,8), or 4T1 cells (f) (n = 10). g,h, 4T1 (g) (n = 10) or 4T1-T (h) (n = 13,14,10) breast cancer cells were implanted in the mammary fat pad of BALB/c mice on day 0, followed by intranasal treatment with IL-33, Asp or PBS on days 7 and 14, and visual quantification of lung metastases on day 21. i, Twelve-week-old female B6.MMTV-PyMT mice were randomized and treated intranasally with IL-33, Asp or PBS once a week and sacrificed at 20 weeks of age, followed by visual quantification of lung metastases (n = 10,10,11). j-l, WT and Il33 −/− mice (j; n = 10), or Il7raCre/+ and Il7raCre/+Rorafl/fl mice were treated as in Fig. 1a with IL-33 (k, n = 10,10,7,7) or Asp (l, n = 5,5,7,7) followed by visual quantification of lung metastases.
Bar graphs indicate mean (±SEM) and show combined data of two (d-h, and j-k) or three (b and i), or are representative of three independent experiments (c and l). Statistical analyses were calculated using one-way ANOVA or Log-rank (Mantel-Cox) test (d) with **** = p ≤ 0.0001.
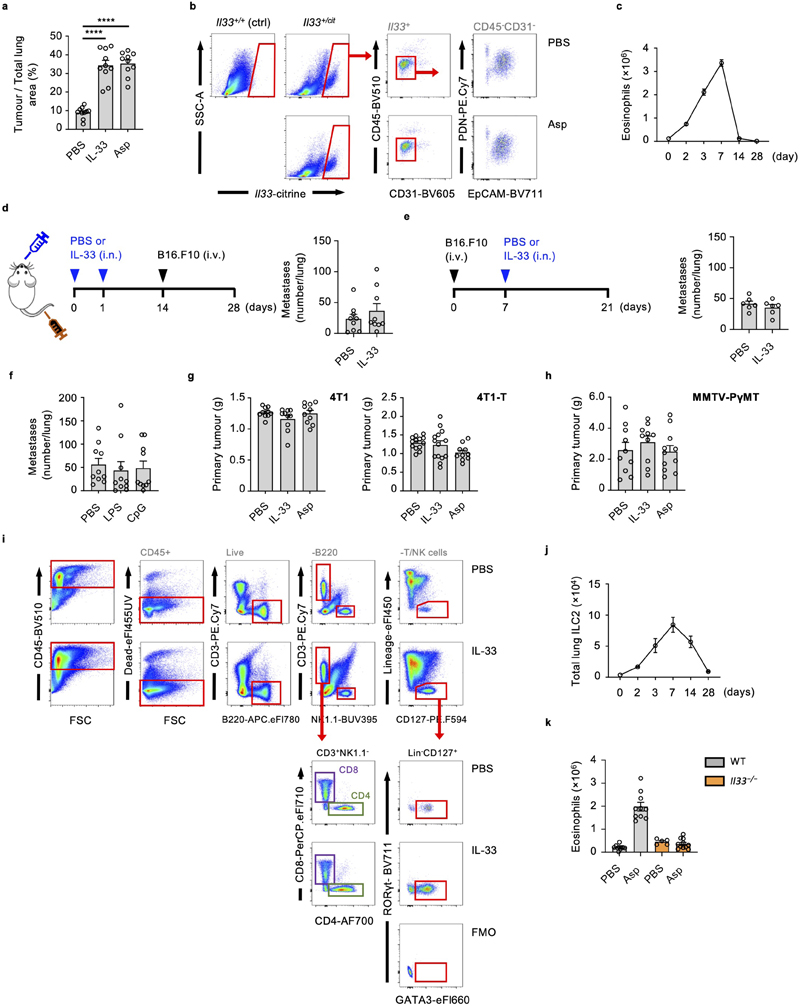
Protease allergens can activate lung-resident ILC2 via IL-33-release16, which is produced primarily by EpCAM+ epithelial cells (Extended Data Fig. 1b). Resolution of acute type-2 inflammation after 14 days, as measured by lung eosinophilia, diminished the pro-metastatic effect of IL-33 (Extended Data Fig. 1c, d). Moreover, administration of IL-33 after metastatic engraftment, or intranasal sensitization with non-type-2-inducing inflammatory agents (CpG or LPS) had no effect on metastatic seeding (Extended Data Fig. 1e, f). Next, we assessed the role of IL-33- or Asp-sensitization in metastatic models of lung carcinoma (LL/2, C57BL/6J genetic background) and breast cancer (4T1, BALB/c genetic background), which also showed increased tumor burden in mice exposed to innate type-2 inflammation (Fig. 1e, f). Similarly, both orthotopically implanted 4T1 and highly metastatic 4T1-T breast cancer cells developed more lung metastases in mice exposed to intranasal Asp or IL-33, without influencing primary tumor size (Fig. 1g, h, Extended Data Fig. 1g). In an autochthonous model of breast cancer (B6.MMTV-PyMT) that metastasizes to the lung, IL-33 or Asp treatment similarly promoted lung metastases without affecting primary tumor size (Fig. 1i, Extended Data Fig. 1h). Therefore, we conclude that IL-33- or allergen-driven type-2 airway inflammation significantly increases lung metastatic burden in cancer.
Allergen exposure leads to IL-33 release, resulting in the rapid activation of ILC2 which subsequently contribute to innate and adaptive type-2 inflammation4. We confirm that intranasal IL-33 induces ILC2 expansion, and that Asp induces IL-33-dependent acute type-2 inflammation, as measured by eosinophilia (Extended Data Fig. 1i, j, k). To investigate whether Asp-driven increases in lung metastases depend on IL-33, we primed C57BL/6J wild type and Il33 −/− mice with Asp before adoptively transferring B16.F10 cells. While wild type mice treated with Asp had significantly more lung metastases on day 21, we observed no effect of allergen treatment in Il33 −/− mice (Fig. 1j). As ILC2 are the primary lung cells that respond to acute IL-33 release16, we hypothesized that ILC2 may promote metastatic seeding after IL-33 or allergen exposure. To test this, we exposed Il7raCre/+Rorafl/fl ILC2-deficient5 or control mice to IL-33 or Asp allergen, followed by adoptive transfer of B16.F10 cells and assessment of metastatic burden. Similar to Il33 −/− mice, ILC2-deficient mice produced significantly fewer lung metastases after exposure to either IL-33 or Asp allergen compared to control mice (Fig. 1k, l). Hence, we propose that allergen-induced promotion of lung metastasis formation is reliant on IL-33-driven activation of ILC2.
IL-33 does not promote early seeding of the lung by CTC
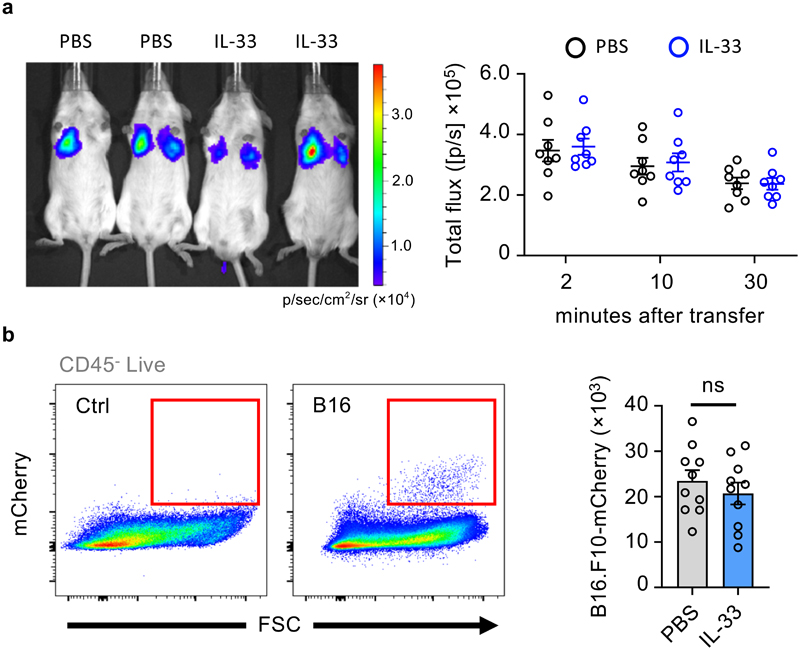
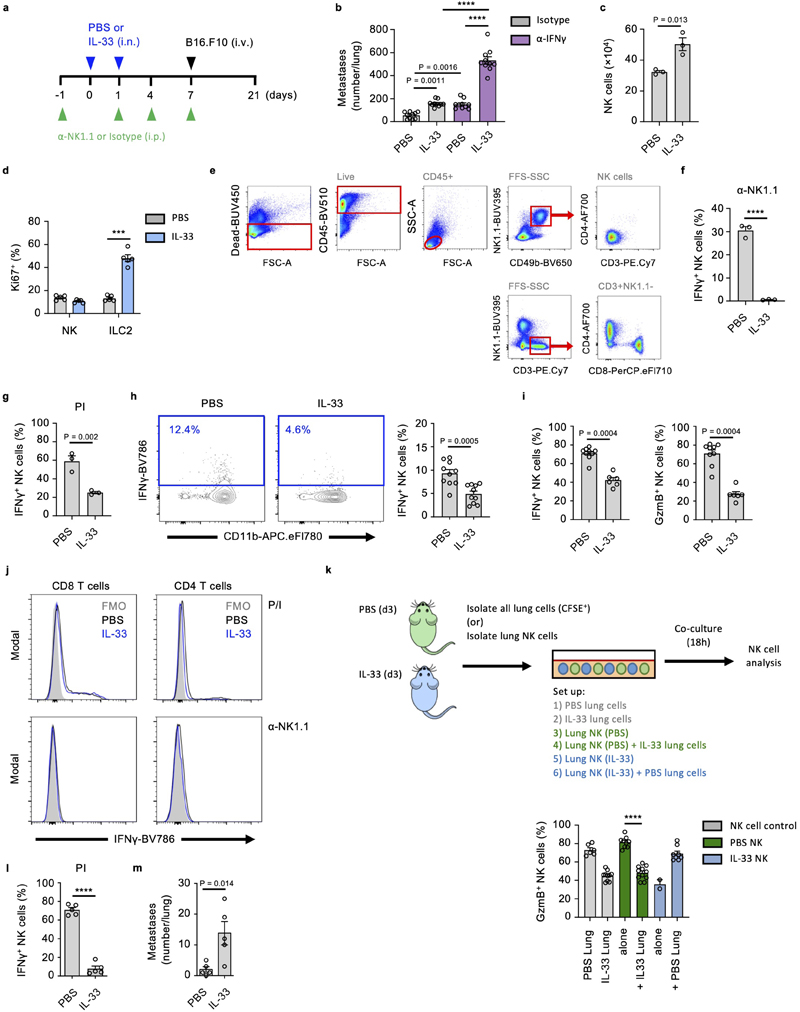
To determine whether IL-33-ILC2-dependent airway inflammation influences early arrest of CTC in the capillaries of inflamed lung, we quantified either B16.F10-mCherry fluorescent, or B16.F10-Akaluc bioluminescent cells at early time-points in IL-33-primed or control mice. IL-33-primed lungs were not seeded with more CTC (Fig. 2a, b), arguing that another mechanism may promote metastatic burden. NK cells are essential for detecting and eliminating both CTC and early metastatic lesions2. To investigate if IL-33 functions in a parallel pathway with NK cells, we asked if IL-33 priming synergizes with NK cell depletion (Extended Data Fig. 2a). We first confirmed that NK cell depletion resulted in a substantial increase in lung metastasis formation (Fig. 3a). Moreover, we observed no additive effect of IL-33 priming in NK cell depleted mice; Thus, while IL-33 does not promote early arrest of CTC in the lung, we hypothesised that IL-33 influences NK cell-driven anti-tumor function.
Figure 2. IL-33 does not promote early seeding of the lung by CTC.
a,b, Albino C57BL/6 mice were treated intranasally with IL-33 or PBS on days 0 and 1, followed by intravenous transfer on day 7 of: (a) substrate-conditioned B16.F10-AkaLuc cells, followed by IVIS imaging at the indicated times (representative image at 10 minutes), followed by quantification of signal in the chest of mice (n = 8); (b) B16.F10-mCherry cells, followed by quantification of total B16.F10 tumor cells in the lung 24 hours after injection (n = 10). Representative gating shown for non-injected control (Ctrl) and B16.F10-mCherry cell injected (B16) mice.
Bar graphs indicate mean (±SEM) and show combined data of two independent experiments (a and b), IVIS and flow cytometry plots show representative images of two independent experiment (a and b). Statistical analyses were calculated using unpaired two-tailed Student’s t-test (b) with ns = not significant.
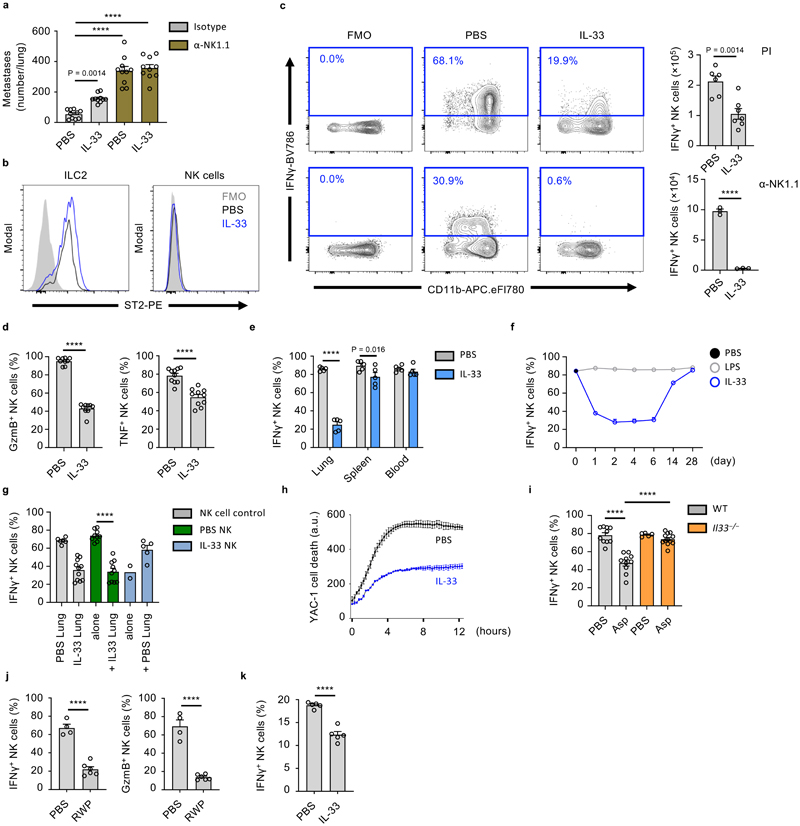
Figure 3. IL-33 suppresses lung NK cell function.
a, WT mice treated as in Fig. 1a were given anti-NK1.1 or control antibody, followed by visual quantification of lung metastases on day 21 (n = 10). b-e, WT mice were treated with IL-33 or PBS on day 0 and 1, followed by sacrifice on day 3 and: (b) ST2 expression by lung ILC2 and NK cells was measured; (c) Identification (left) and quantification (right) of total IFNγ + lung NK cells after PI (top; n = 6,7) or anti-NK1.1(bottom; n = 3) stimulation; (d) Quantification of Gzmb+ and TNF+ lung NK cells (n = 10); (e) Quantification IFNγ + NK cells from listed anatomical sites (n = 5). f, Quantification of IFNγ + lung NK cells at the indicated time-points after intranasal treatment with IL-33 (blue) or LPS (grey) on day 0 and 1, compared to PBS-treated WT animals (d0, black) (n = 6). g, Lung NK cells from PBS- or IL-33-treated WT mice were co-cultured for 12 hours with CFSE labeled whole lung cell homogenates from PBS- or IL-33-treated WT mice. CFSE+ endogenous NK (grey) or purified NK (green, blue) cells were subsequently assessed for IFNγ production (n = 6,11,10,10,2,5). h, Killing assay of YAC-1 target cells by lung NK cells from PBS- or IL-33-treated WT mice (n = 3). i, WT and Il33 −/− mice were treated with Asp on day 0 and 1, followed by quantification of IFNγ + lung NK cells on day 3 (n = 10,10,5,10). j, WT mice were treated with ragweed pollen (RWP), followed by quantification of IFNγ + and GzmB+ lung NK cells (n = 4,6). k, BALB/c mice were treated, as in Fig. 3b, followed by quantification of IFNγ + lung NK cells (n = 5).
Fluorescence-minus-one (FMO); Arbitrary unit (a.u.); Unless otherwise indicated PI re-stimulation was used to measure NK cell cytokine production. Bar graphs indicate mean (±SEM) and show combined data of two (d,i) or three (a) independent experiments or a representative of three independent experiments (b, c, e-h, j, k). Statistical analyses were calculated using one-way ANOVA, unpaired two-tailed Student’s t-test (c), or Wilcoxon matched-pairs signed rank (h) with **** = p ≤ 0.0001.
IL-33 suppresses lung NK cell function
NK cells are the major ILC population, and the predominant source of IFNγ in the lungs of naive mice, which is involved in the anti-metastatic function of lung NK cells (Extended Data Fig. 2b)17. IL-33 administration moderately increased total lung NK cell numbers (Extended Data Fig. 2c). We confirmed that IL-33 administration induced expansion of ST2+ ILC2, while ST2– lung NK cells did not increase Ki67 expression (Fig. 3b, Extended Data Fig. 2d), suggesting a potential indirect effect of IL-33 on NK cells. We next assessed the functional capacity of lung NK cells in PBS or IL-33-treated mice by detection of intracellular IFNγ, Granzyme B (GzmB) and tumor necrosis factor (TNF). In IL-33-treated mice, we observed a significant reduction in IFNγ production after ex vivo stimulation with either phorbol-12-myristate-13-acetate (PMA) plus ionomycin (PI), or anti-NK1.1 antibody (Fig. 3c, Extended Data Fig 2e, f), and substantial reductions in total lung IFNγ-positive NK cell numbers (Extended Data Fig. 2g). Additionally, we observed a significant reduction in GzmB and TNF production (Fig. 3d). Similar results were obtained after ex vivo stimulation with a combination of IL-12 and IL-18 (Extended Data Fig. 2h). Intranasal IL-33-administration had no or minimal effect on circulating or splenic NK cell function (Fig. 3e), although peri-cardiac adipose NK cells were suppressed (Extended Data Fig. 2i).
We investigated the kinetics of lung NK cell suppression in timecourse experiments, and found that IFNγ production was suppressed for about 2 weeks after intranasal IL-33 administration (blue), while intranasal LPS treated mice (grey) did not differ from baseline (black, d0) (Fig. 3f). Suppression appeared inversely correlated with type-2 inflammation (Extended Data Fig. 1c). Notably, the capacity of lung CD4+ and CD8+ T cells to produce IFNγ was unaffected by IL-33 treatment (Extended Data Fig. 2j). Moreover, IFNγ and GzmB production by purified NK cells from naive mouse lungs was effectively suppressed upon co-culture with IL-33-treated lung cells, indicating that the lung inflammatory milieu has potent immunosuppressive properties (Fig. 3g, Extended Data Fig. 2k). Conversely, purified NK cells from IL-33-treated lungs regained IFNγ and GzmB expression upon co-culture with PBS-treated lung cells, indicating that suppression is reversible. Next, by in vitro cytotoxicity assay, we found that lung NK cells from IL-33 mice were impaired in their ability to eliminate tumor cells (Fig. 3h).
To assess if allergen-induced IL-33 release could affect lung NK cells, we treated both wild type and Il33 −/− mice with PBS or Asp. Intranasal Asp administration led to reduced lung NK cell function in wild type but not Il33 −/− mice on day 3 (Fig. 3i). Administration of ragweed pollen similarly impaired lung NK cell function (Fig. 3j). We also observed suppression of CD49b+ NK cell function in BALB/c mice treated with IL-33 (Fig. 3k). Moreover, parallel experiments conducted on C57BL/6 mice in a different animal facility produced comparable results in terms of NK cell suppression and increased metastatic seeding upon IL-33 treatment (Extended Data Fig. 2l, m). In all, these data suggest that allergen-induced IL-33 release suppresses lung NK cell function.
ILC2 mediate an innate-immune checkpoint on lung NK cell function
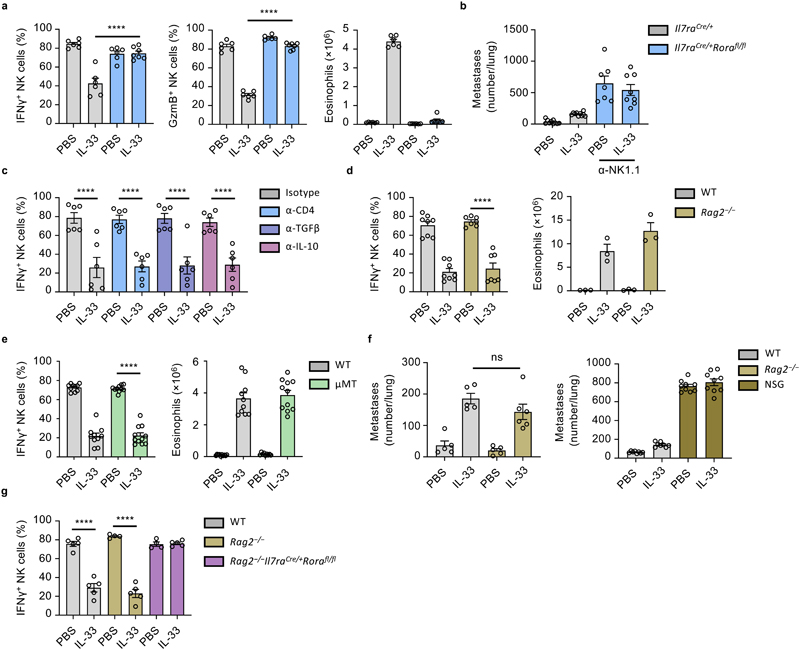
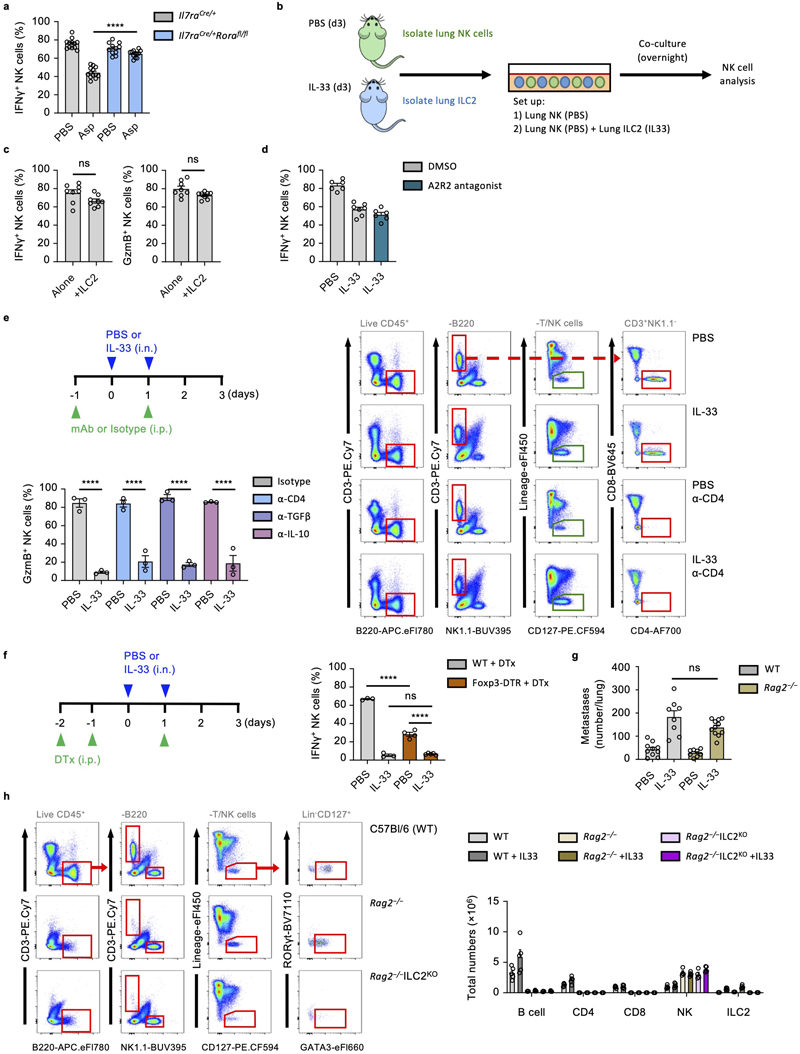
As the main IL-33-responsive cell in naive lungs, ILC2 may orchestrate suppression of NK cells. Indeed, IL-33- or Asp-treated ILC2-deficient mice failed to suppress production of IFNγ and GzmB by lung NK cells, or induce type-2 inflammation (Fig. 4a, Extended Data Fig. 3a). ILC2-deficient mice that were also depleted of NK cells were now susceptible to increased metastatic seeding (Fig. 4b), supporting the hypothesis that ILC2-mediated suppression of NK cells is important in promoting lung metastasis formation. Relatedly, IL-33-sensitization did not influence metastatic seeding in NK cell depleted ILC2-deficient mice (Fig. 4b). While these data suggest that ILC2 can influence lung NK cell function, possibly via a direct AMP-mediated pathway18, we found that both in vitro lung ILC2 and NK cell co-culture, as well as small molecule inhibition of A2AR in vivo failed to suppress or rescue NK cell function respectively, indicating that another indirect mechanism may elaborate the NK cell-suppressing function of ILC2 (Extended Data Fig. 3b, c, d).
Figure 4. ILC2 mediate an innate-immune checkpoint on lung NK cell function.
a,b, Il7raCre/+ and Il7raCre/+Rorafl/fl mice were treated with PBS or IL-33 on day 0 and 1, followed by quantification of IFNγ + and GzmB+ lung NK cells, and lung eosinophilia on day 3 (a) (n = 6,6,6,7), or treated as in Extended Data Fig. 2a, followed by visual quantification of lung metastases (b) (n = 10,10,7,8). c, WT mice were treated with PBS or IL-33 on day 0 and 1, and the indicated mAb on day -1 and 1 followed by quantification of IFNγ + lung NK cells on day 3 (n = 6). d, WT and Rag2 −/− mice were treated with PBS or IL-33 on day 0 and 1, followed by quantification of IFNγ + lung NK cells (left, n = 8,8,7,7) and lung eosinophilia (right, n = 3) on day 5. e, WT and μMT mice were treated with PBS or IL-33 on day 0 and 1, followed by quantification of IFNγ + lung NK cells (left, n = 10,10,10,11) and lung eosinophilia (right, n = 10,10,10,11) on day 3. f, WT, Rag2 −/− (left, n = 5,5,5,6) and NOD/SCID.Il2rg −/− (NSG) (right, n = 9) mice were treated as in Fig. 1a, followed by visual quantification of lung metastases. g, Mice of indicated genotypes were treated with PBS or IL-33 on day 0 and 1, followed by quantification of IFNγ + lung NK cells day 3 (n = 5,5,4,5,4,5).
PI re-stimulation was used to measure NK cell cytokine production. Bar graphs indicate mean (±SEM). Data shown are combined from two (ce) or three (b and f) independent experiments, or a representative of three independent experiments (a). Statistical analyses were calculated using one-way ANOVA or unpaired two-tailed Student’s t-test t (c) with ns = not significant, **** = p ≤ 0.0001.
ILC2 can promote both conventional and regulatory CD4+ T cell expansion in the lungs5, 6, 19, 20. To ascertain if ILC2-mediated suppression of NK cells relies on concomitant CD4+ T cell function, we used CD4-depleting antibody together with IL-33 treatment. However, neither lack of CD4+ T cells nor neutralization of IL-10 or TGF-β could rescue IL-33-induced suppression of NK cells (Fig. 4c, Extended Data Fig. 3e). Similarly, depletion of CD4+ Treg cells (B6.Foxp3DTR) did not impair the effect of IL-33 on lung NK cell suppression (Extended Data Fig. 3f). To ask if other adaptive immune cells contribute to this phenotype, we administered IL-33 to both wild type, µMT and Rag2 −/− mice, followed by measurement of IFNγ production by lung NK cells. We found that lung NK cells in both wild type, µMT and Rag2 −/− mice are similarly impaired upon IL-33 treatment (Fig. 4d, e, left panels), suggesting that ILC2 collaborate with non-adaptive-immune cells to suppress NK cell function. Moreover, IL-33 priming of Rag2 −/− mice followed by B16.F10 or LL/2 adoptive transfer resulted in a similar increase in metastatic burden compared to IL-33-treated wild type mice (Fig. 4f, left panel, and Extended Data Fig. 3g). B16.F10 adoptive transfer into mice lacking both adaptive and innate lymphocytes confirmed the important role of NK cells in preventing metastatic seeding of the lung, and also demonstrated no additive effect of IL-33 sensitization in the absence of ILC (Fig. 4f, right panel). Lastly, we created ILC2-deficient mice on the Rag2 −/− background (Rag2–/–Il7raCreRorafl/fl), which also failed to suppress NK cells in response to IL-33 (Fig. 4g, Extended Data Fig. 3h). Thus, activated ILC2 can suppress NK cells via an innate-immune regulatory mechanism.
ILC2-derived IL-5 promotes eosinophil-mediated suppression of lung NK cells
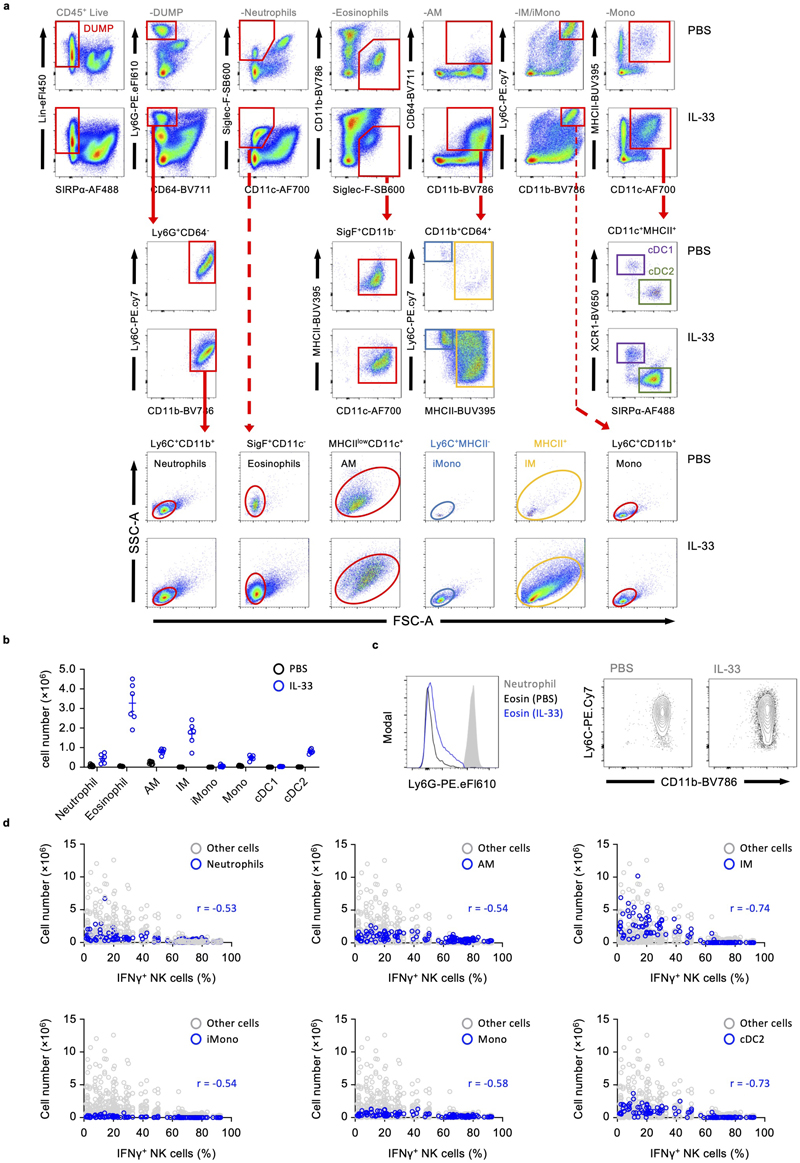
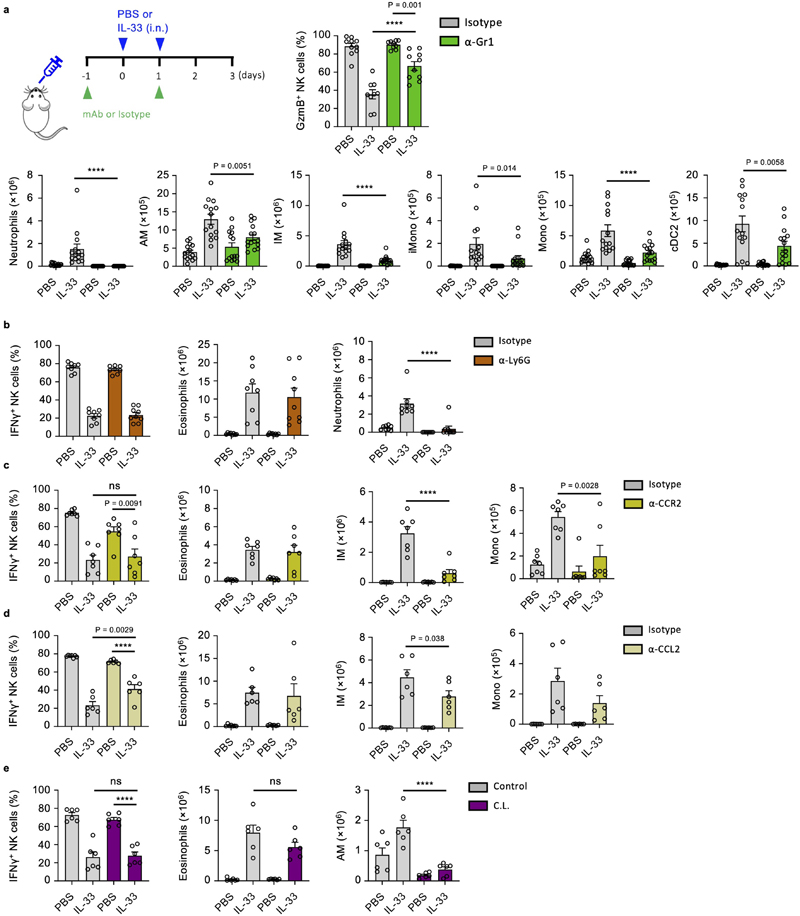
Myeloid cells are implicated in promoting lung metastasis formation21, can suppress NK cells2, and are induced or stimulated by ILC2, advancing the hypothesis that a myeloid-ILC2 interaction elaborates IL-33-driven suppression of NK cells. We first characterized the myeloid compartment in the lungs of PBS and IL-33 treated mice on day 3, which revealed an expected influx of eosinophils, inflammatory monocyte-derived macrophages (IM) and dendritic cells, as well as neutrophils and monocytes (Extended Data Fig. 4a, b). Given the known immune-suppressive functions of Gr-1+ (Ly-6G+ or Ly-6C+) myeloid cells22, 23, we used antibody-mediated depletion to assess their role in IL-33-driven suppression of NK cells. Anti-Gr-1 treatment reversed the effect of IL-33 on suppression of IFNγ and GzmB production by NK cells (Fig. 5a, Extended Data Fig. 5a). However, parallel assessment of the myeloid compartment revealed that multiple immune cells were affected by anti-Gr-1 treatment in IL-33-sensitised mice, including eosinophils, highlighting broad direct or indirect effects of this reagent (Fig 5a, Extended Data Fig. 5a). Targeted depletion of Ly-6G+ neutrophils, or impairment of CCR2-CCL2-mediated influx of monocytes was largely unsuccessful in reverting IL-33-driven suppression of NK cells (Extended Data Fig. 5b, c, d). Similarly, clodronate-liposome-mediated depletion of alveolar macrophages (AM) failed to rescue NK cell suppression (Extended Data Fig. 5e). This suggested that neutrophils, despite their pro-metastatic function in other models22, 24, 25 are not involved in IL-33-mediated suppression of lung NK cells.
Figure 5. ILC2-derived IL-5 promotes eosinophil-mediated suppression of lung NK cells.
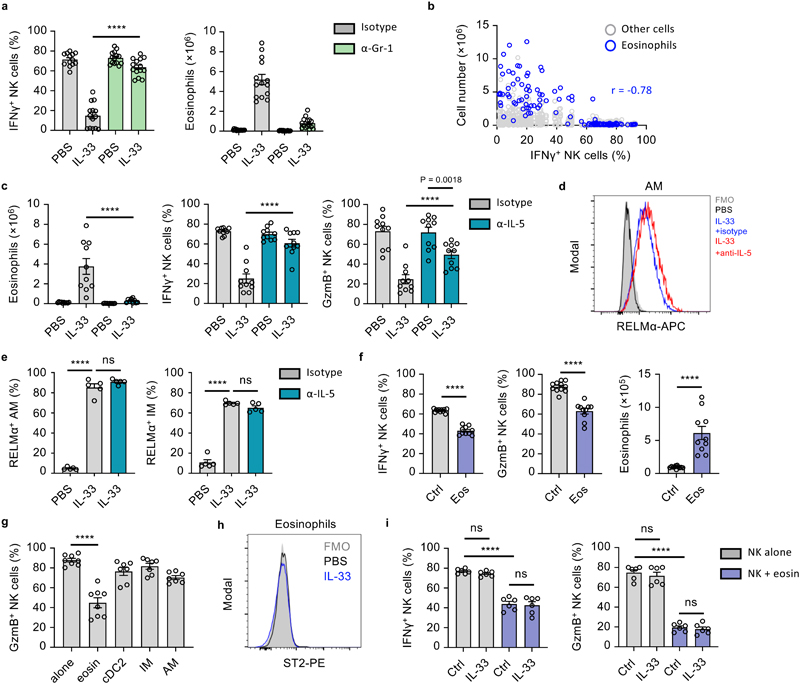
a, WT mice were treated with PBS or IL-33 on day 0 and 1, and anti-Gr-1 or control antibody on day -1 and 1 followed by quantification of IFNγ + lung NK cells and eosinophil numbers (n = 15,14,14,15) on day 3. b, Correlation of lung eosinophil numbers and percent IFNγ + NK cells on day 3 from WT mice treated with PBS and IL-33- (days 0, 1) (n=125). c-e, WT mice were treated with PBS or IL-33 on day 0 and 1, and anti-IL-5 or control antibody on day -6, -3 and -1 followed by quantification of IFNγ + and GzmB+ lung NK cells and eosinophilia (c) (n = 10), or flow cytometric identification (d) and quantification of RELMα+ AM and IM (e) (n = 5) on day 3. f, Eosinophils were adoptively transferred to WT mice on day 0, followed by quantification of IFNγ + and GzmB+ lung NK cells and lung eosinophilia on day 1 (n = 10). g, Flow-cytometry sorted immune cells from WT mice were co-cultured with purified lung NK cells for 12 hours followed by quantification of GzmB+ lung NK cells (n = 8,8,7,7,7). h, ST2 expression by WT mouse lung eosinophils on day 3 after treatment with PBS or IL-33 (day 0 and 1). i, WT mouse lung NK cells were co-cultured for 12 hrs with eosinophils (1:10 ratio) with addition of IL-33 or control, followed by quantification of IFNγ + and GzmB+ lung NK cells (n = 6).
PI re-stimulation was used to measure NK cell cytokine production. Bar graphs indicate mean (±SEM). Data shown are combined from two (ce, and g- i) or three (a and f) independent experiments, with (gG) representing Pearson r (n=125). Statistical analyses were calculated using one-way ANOVA or unpaired two-tailed Student’s t-test (f) ns = not significant, **** = p ≤ 0.0001.
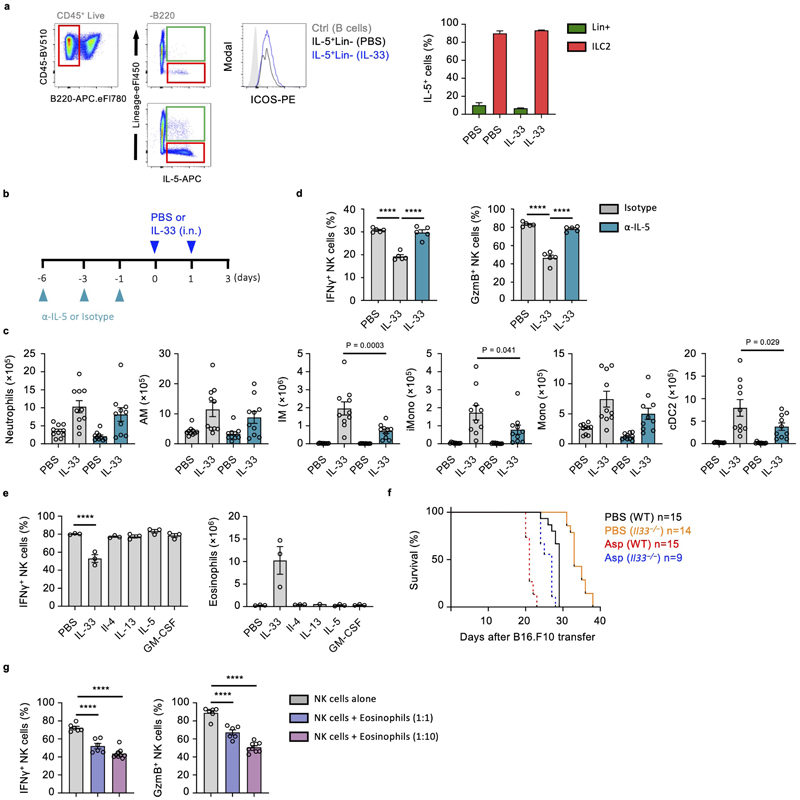
We found lung eosinophilia to be most strongly correlated with suppression of IFNγ production by NK cells (Fig. 5b, Extended Data Fig. 4d). Although surface Ly-6G-negative, eosinophils express Ly-6C (Extended Data Fig. 4c), and numbers were reduced in IL-33-sensitised lungs upon anti-Gr-1 treatment (Fig. 5a). To specifically assess the role of eosinophils on NK cell suppression we neutralized IL-5, a cytokine essential for eosinophilic inflammation26, which is primarily secreted by ILC2 during innate type-2 lung inflammation (Extended Data Fig. 6a). Lung eosinophil numbers were significantly reduced by anti-IL-5 treatment in IL-33-sensitized mice, while neutrophil numbers were unaffected (Fig. 5c, Extended Data Fig. 6b, c). Moreover, anti-IL-5 treatment also did not impair other inflammatory effects of IL-33, such as alternative activation of AM and (IM) as assessed by RELMα expression (Fig. 5d, e). Anti-IL-5 treatment protected against the suppressive effect of IL-33 on lung NK cell production of IFNγ and GzmB, after re-stimulation with both PI and anti-NK1.1 (Fig. 5c, Extended Data Fig. 6d).
Intranasal administration of recombinant IL-4, IL-13, IL-5, or GM-CSF did not induce lung eosinophilia or NK cell suppression, suggesting that IL-5 is essential but not sufficient for NK cell suppression (Extended Data Fig. 6e). Indeed, it is known that IL-5 operates in concert with other inflammatory mediators to promote lung eosinophilia26. Relatedly, Il5 −/− mice develop fewer lung metastases27, and we found prolonged survival in PBS- or Asp-treated Il33 −/− mice after B16.F10 transfer (Extended Data Fig. 6f). Moreover, adoptive transfer of eosinophils to naive mice, or co-culture of NK cells with ex vivo derived or purified lung eosinophils from IL-33 treated mice effectively suppressed lung NK cell function, whereas cDC2, IM and AM did not (Fig. 5f, g, Extended Data Fig. 6g). Notably, both naive and inflamed lung eosinophils do not express ST2, and no additive effect of IL-33 on NK cell–eosinophil co-cultures was observed (Fig. 5h, i). These data indicate that ILC2-derived IL-5 is important for eosinophil-mediated suppression of NK cell function.
IL-33-induced suppression of lung NK cell effector molecules is not transcriptionally regulated
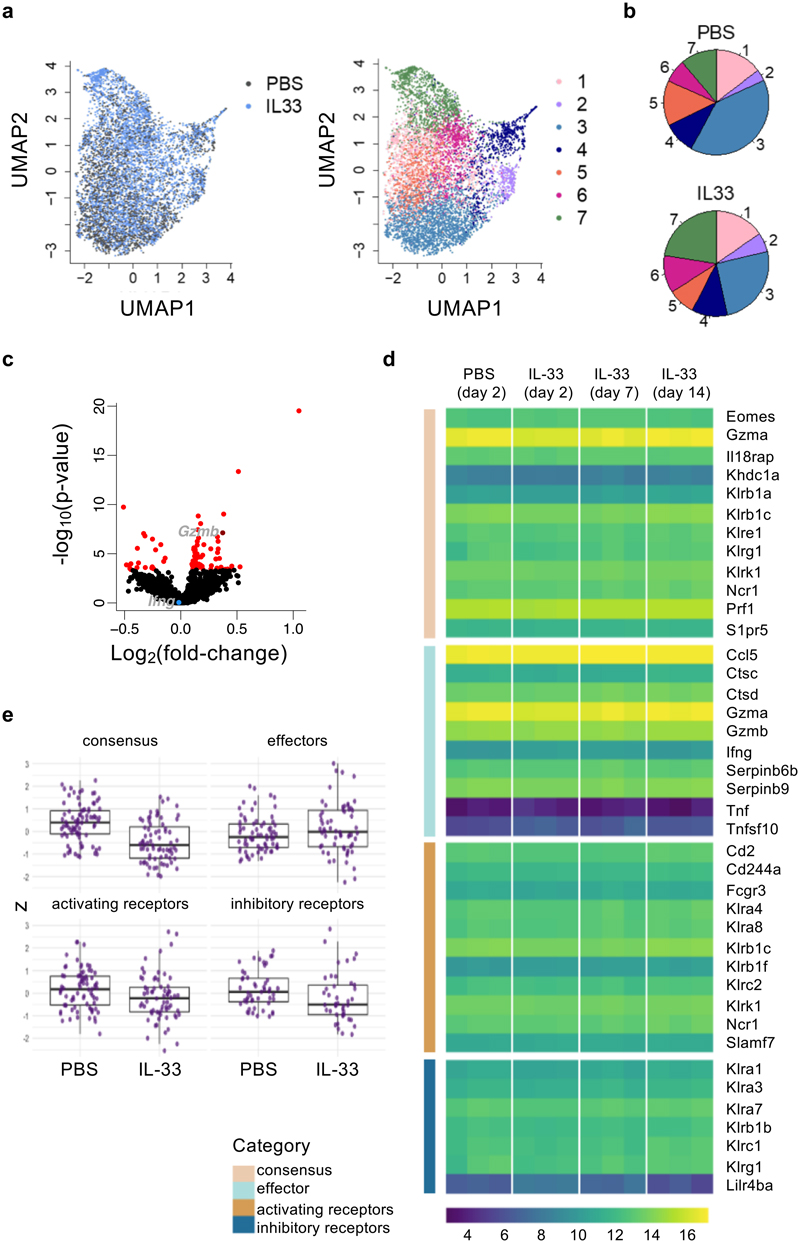
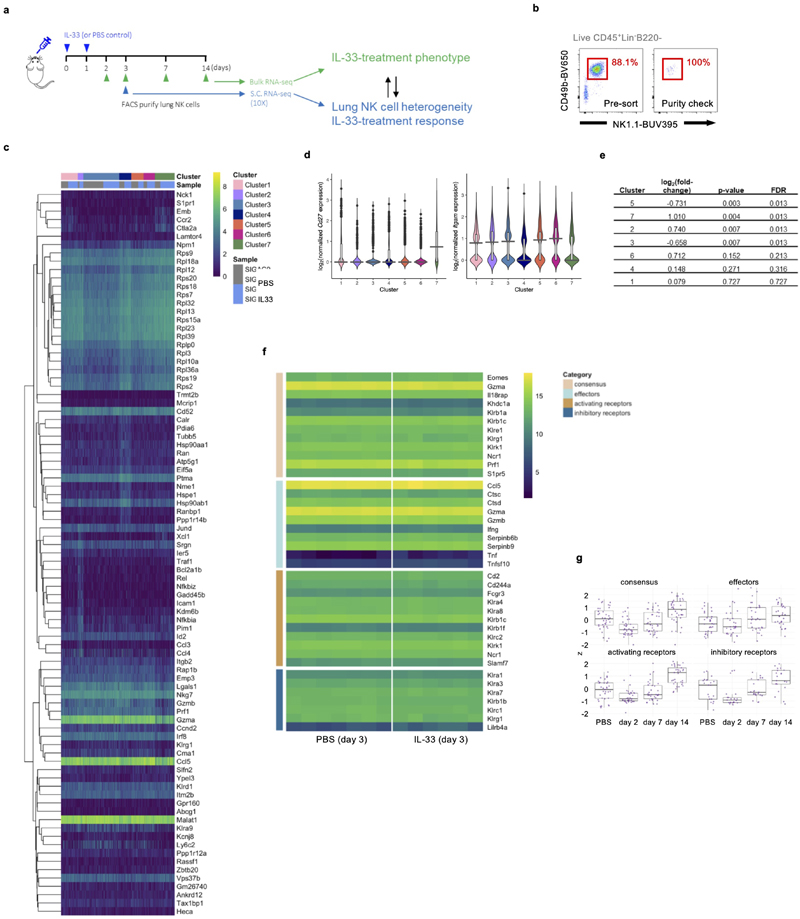
To investigate how lung NK cells were affected in terms of gene regulation, we performed single-cell-RNA-seq analysis on flow cytometry purified lung NK cells from PBS or IL-33 treated wild type mice at different time-points (Extended Data Fig. 7a, b). At day 3, we identified 7 clusters (see Methods) of NK cells in PBS and IL-33-treated lungs in single-cell RNA-seq data (Fig. 6a), which were annotated by their gene expression patterns and assessed for maturation and proliferation markers. Cluster 7 exhibits signatures indicative of CD27hiCD11blow immature NK cells, whose relative abundance corresponds with our flow cytometry observations (Extended Data Fig. 7c, d). Comparison of treatment arms did not reveal the emergence of novel clusters, but suggested shifts in relative proportions of clusters and subtle global changes in gene expression across clusters upon IL-33 treatment (Fig. 6b, c, Extended Data Fig. 7e). In contrast to protein expression measurements, effector molecule genes such as Ifng and Gzmb were either unaffected or upregulated by IL-33 treatment, respectively.
Figure 6. IL-33-induced suppression of lung NK cells is not transcriptionally regulated.
a, WT mice were treated with IL-33 or PBS on day 0 and 1, followed by isolation of lung NK cells on day 3 for scRNA-seq analysis. UMAP projection of NK cell scRNA-seq data from 2 mice from each treatment coloured by treatment (left) and cluster (right). b, Average proportions of lung NK cells in each cluster from PBS- or IL-33-treated mice. c, Volcano plot of a differential expression analysis comparing IL-33- and PBS-treated NK cells. Red indicates significantly differentially expressed genes (FDR < 0.05). Ifng (not significant, blue) and Gzmb (significant, dark red) are labelled. d,e, Bulk-RNA-seq analysis of sorted lung NK cells from PBS or IL-33-treated WT mice. Expression of NK cell consensus, effector, and both activating and inhibitory receptor transcripts (manually curated) are shown as a heatmap of log2-transformed normalized read counts of individual genes at the indicated time-points (d), or grouped by category for day 3 (z-scaled expression values for genes within the 4 gene lists) (e). Each point represents the expression value obtained by one replicate for a given gene at a given time point.
Box plots represent mean (black line), first and third quartiles (box) and range within 1.5 times the interquartile range from the box (whiskers).
We also performed a bulk-RNA-seq time-course on lung NK cells after IL-33 administration to capture changes in gene transcription over time (Extended Data Fig. 7a). We tested if IL-33-treatment led to changes in expression of NK cell consensus, effector molecule, or activating and inhibitory receptor gene-sets. We did not observe substantial modulation in expression at 2, 7 or 14 days after intranasal IL-33 administration (n=3), or on day 3 in a higher-powered (n=6, 7) bulk-RNA-seq experiment (Fig. 6d, e, Extended Data Fig. 7f, g). Altogether, these transcriptomic studies suggest that post-transcriptional regulation may influence the functional impairment of lung NK cells after IL-33 administration.
Activated ILC2 suppress NK cells via an eosinophil-mediated metabolic mechanism
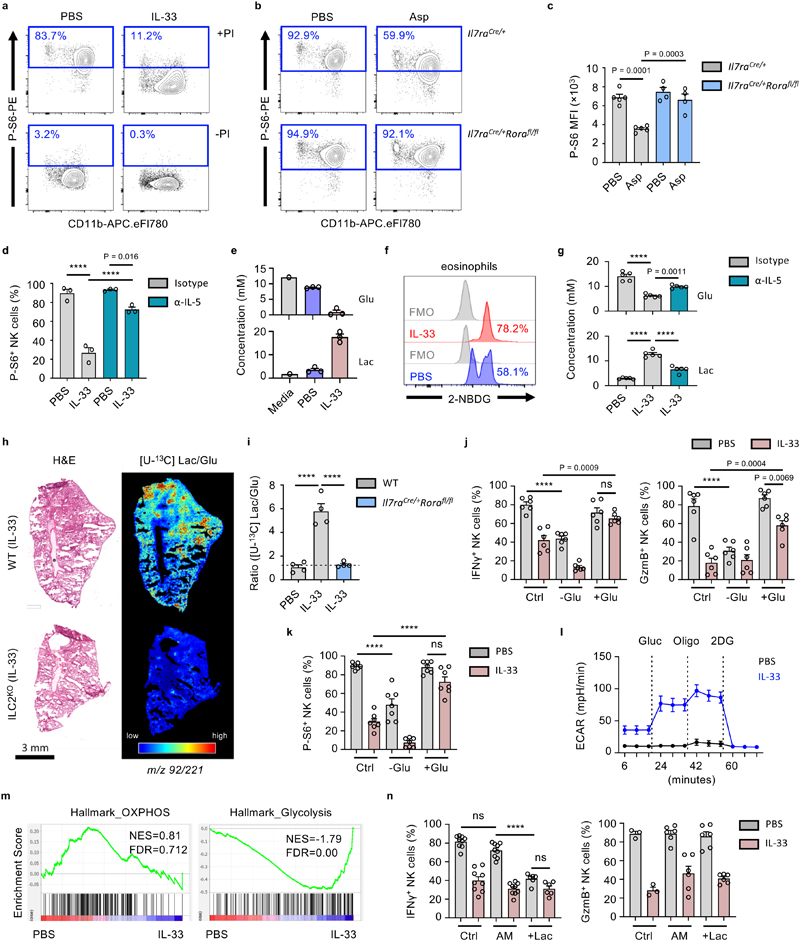
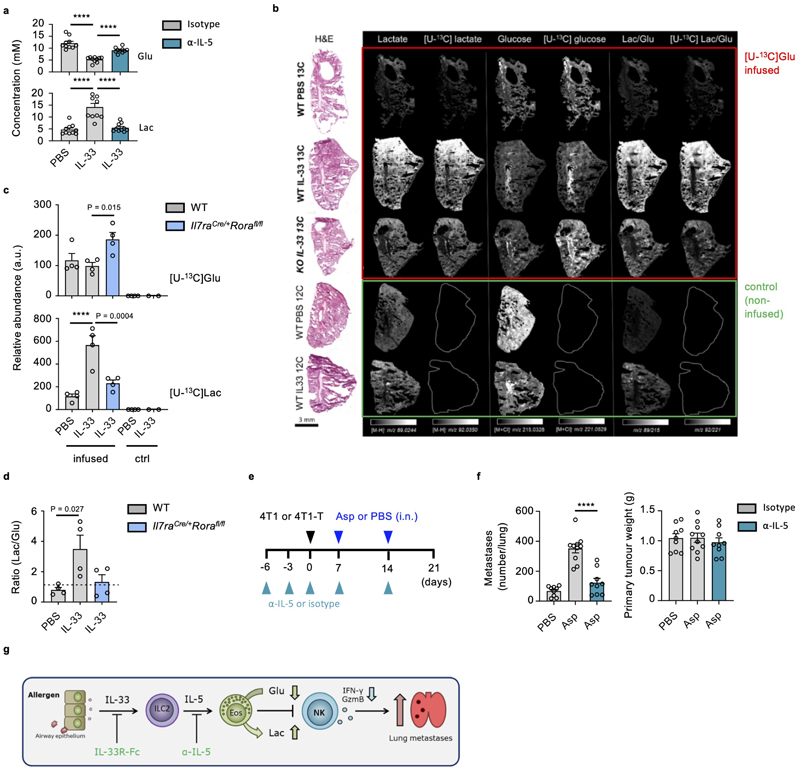
As post-transcriptional regulation of NK cell function can be controlled by their metabolic state28, we hypothesed that global suppression of lung NK cell function is influenced by eosinophil-induced changes in NK cell metabolism. Metabolic stress is sensed by NK cells, resulting in suppressed mTORC1-activity, and reduced phosphorylation of ribosomal subunit S629. We observed reduced phospho-S6 levels in IL-33- or Asp-treated lung NK cells upon stimulation (Fig. 7a, b). Phospho-S6 levels were unchanged in Asp-treated ILC2-deficient mice, and restored upon IL-5-neutralisation in IL-33-treated wild type mice (Fig. 7c, d). Moreover, metabolic profiling of lung cultures by nuclear magnetic resonance (NMR) revealed an increase in glucose utilization upon IL-33 treatment (Fig. 7e). Activated eosinophils primarily utilize glycolysis30, and express associated metabolic pathway genes, including glucose transporters Glut1 and Glut3 (encoded by genes Slc2a1, Slc2a3)31. Correspondingly, we observed uptake of the 2-NBDG glucose analog by lung eosinophils, which increased in IL-33-treated mice (Fig. 7f). Importantly, IL-5-neutralisation reversed IL-33 mediated changes in glucose utilization and lactate production in both C57BL/6J and BALB/c mice (Fig. 7g, Extended Data Fig. 8a). Additionally, mass spectrometry imaging (MSI) of mice infused with [U-13C] glucose was performed to assess in vivo glycolysis in inflamed lungs (Fig. 7h, Extended Data Fig. 8b, c, d). We observed increased [U-13C] and [U-12C] lactate/glucose ratios upon IL-33 treatment in wild type but not ILC2-deficient mice (Fig. 7i, Extended Data Fig. 8b, c, d). These data support the hypothesis that ILC2-induced eosinophilia modulates glucose utilization in the lung environment.
Figure 7. Activated ILC2 suppress NK cells via an eosinophil-mediated metabolic mechanism.
a, WT mice were treated with IL-33 or PBS on day 0 and 1 and sacrificed on day 3, followed by intracellular detection of phospho-S6 (P-S6)-positive lung NK cells after culture in media ± PI. b,c, Mice of the indicated genotypes were treated as in (a) with Asp or PBS, followed by intracellular detection of P-S6 in lung NK cells (b, representative data; c, MFI, n = 5,5,4,4). d, WT mice were treated with PBS or IL-33 on day 0 and 1, and anti-IL-5 or control antibody on day -6, -3 and -1 followed by quantification of P-S6+ lung NK cells on day 3 (n = 3). e,f, Lung cells from WT mice treated as in (a) were: (e) cultured for 18 hrs, followed by quantification of glucose (Glu) or lactate (Lac) in the media by NMR (n = 1,3,3), or (f) quantification of ex vivo 2-NBDG uptake by lung eosinophils. g, Lung cells from WT mice treated as in (d) were cultured cultured for 18 hrs, followed by quantification of glucose (Glu) or lactate (Lac) in the media by NMR (n = 5). h,i, Il7raCre/+Rorafl/fl or WT mice were treated intranasally with PBS or IL-33 on day 0 and 1, followed by [U-13C]glucose infusion and mass spectrometry imaging (MSI) on day 3. H&E and corresponding MSI analysis of [U-13C]lactate over [U-13C]glucose ratio (pixel per pixel) as shown by heatmap (h), and mean relative abundances (i, n = 4). j,k, Lung cells from WT mice treated as in (a) were assessed for NK cell expression of IFNγ and GzmB (j, n = 6), or P-S6 (k, n = 7) after cultured (with PI) for 3 hours in normal (Ctrl), no-glucose (-Glu) or high-glucose (+Glu) media. l, Lung homogenates were cultured (with PI) for 3 hours, after which NK cells were isolated and assessed for ECAR after addition of glucose, oligomycin, and 2DG (n = 5). m, GSEA of PBS and IL-33-treated lung NK cell bulk-RNAseq data (day 3). Normalised enrichment score (NES) and false discovery rate (FDR) shown for each plot. n, Lung cells from WT mice treated as in (a) were cultured (with PI) for 3 hours in normal (Ctrl), acidified media (AM), or 15 mM lactic acid containing media (+Lac) and assessed for NK cell expression of IFNγ (n = 9,9,9,9,6,6) and GzmB (n = 3,3,6,6,6,6).
Bar graphs indicate mean (±SEM) and show combined data of two (c, g, i, n) or three (j, k) independent experiments. Data representative of two (b, d, f, h, l, m) or three (a, e) independent experiments. Statistical analyses were calculated using one-way ANOVA with ns = not significant, **** = p ≤ 0.0001.
We further tested if depletion of glucose or increased concentrations of lactate were responsible for impaired NK cell function. We found that glucose restriction impaired naive lung NK cell function, while high glucose media rescued IFNγ and GzmB production, as well as phospho-S6 expression, by IL-33-treated lung NK cells upon activation (Fig. 7j, k). Moreover, ex vivo activated NK cells from IL-33-treated mouse lungs exhibit an increased extracellular acidification rate (ECAR) after glucose administration (Fig. 7l). Gene set enrichment analysis (GSEA) identified enrichment of genes associated with glycolysis in the IL-33-treated lung NK cells compared to PBS control (Fig. 7m). Interestingly, culture of naive lung NK cells in lactic acid suppressed IFNγ but not GzmB production (Fig. 7n). These data suggest that ILC2-induced eosinophilia orchestrates suppression of NK cell function by restraining NK cell glucose metabolism.
Therapeutic targeting of the ILC2-eosinophil axis restores NK cell-mediated tumor control
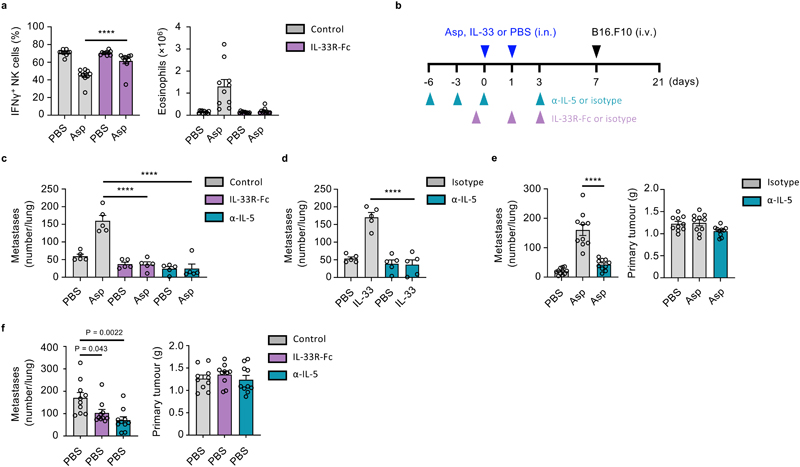
As we have observed that IL-33-driven activation of ILC2 represents a central node in a mechanism of type-1 immunity regulation, we postulated that this axis may present a potential therapeutic target. Given that IL-5- and IL-33-targeted therapeutics are already in the clinic or undergoing phase-2 clinical trials, respectively32, we first utilized an IL-33 trap (IL-33R-Fc) to block Asp allergen-induced airway inflammation. Prophylactic dosing prevented NK cell suppression in wild type mice upon Asp administration, while also reducing markers of type-2 inflammation, including eosinophilic inflammation (Fig. 8a). Similarly, Asp-induced metastatic burden of B16.F10 melanoma was alleviated upon IL-33 neutralization (Fig. 8b, c). In addition to anti-IL-5 restoring NK cell function (Fig. 5c), we find that prophylactic administration significantly reduced the metastatic burden in both Asp- and IL-33-sensitized mice, upon transfer B16.F10 cells (Fig. 8b, c, d). We further administered anti-IL-5 to BALB/c mice bearing 4T1 or 4T1-T orthotopically implanted breast cancer cells, and found a reduction in lung metastases formation in Asp-treated groups, but no effect on primary tumor burden (Fig. 8e, Extended Data Fig. 8e, f). Moreover, given that BALB/c mice are predisposed towards both innate and adaptive type-2 inflammation33, we investigated if prophylactic dosing may reduce metastasis formation in naive mice; We observe that both IL-5- or IL-33-neutralization reduced lung metastases in a model of metastasis from primary breast cancer (Fig 8f). Thus, targeting of the ILC2-eosinophil axis can restore anti-mestastic function of lung NK cells (Extended Data Fig. 8g).
Figure 8. Therapeutic targeting of the ILC2-eosinophil axis restores NK cell-mediated tumor control.
a, WT mice were treated intranasally with PBS or Asp on day 0 and 1, and IL-33R-Fc or control on day -1 and 1 followed by quantification of IFNγ + lung NK cells and eosinophilia on day 3 (n = 10). b-d, WT mice were treated as indicated (b), and lung metastases were quantified by visual examination on day 21 in: (c) Asp- or PBS-treated mice (n = 5), or (d) IL-33 or PBS-treated mice (n = 5). e, BALB/c mice were orthotopically implanted with 4T1 breast cancer cells on day 0, and received treatment with anti-IL-5 or control antibody (days -6, -3, 0, 7 and 14), and Asp or PBS intranasally (day 7 and 14), followed by sacrifice on day 21 and visual quantification of lung metastases, and measurement of primary tumour weight (n = 10). f, BALB/c mice were orthotopically implanted with 4T1-T breast cancer cells on day 0, and received treatment with anti-IL-5 (days -6, -3, 0, and three times a weeks), or IL33R-Fc or control (day -1 and three times a week) until sacrifice on day 21; the number of lung metastases were measured by visual quantification, and primary tumor weight was measured (n = 10).
Bar graphs indicate mean (±SEM) and shows representative data of two (c) or three (d) independently performed experiments, or combined data of two (a, e and f) independent experiments. Statistical analyses were calculated using one-way ANOVA with **** = p ≤ 0.0001.
Discussion
In summary, our data implicates ILC2-driven innate type-2 inflammation in promoting metastatic seeding of the airways. We find that ILC2 can locally antagonize lung NK cell function via an eosinophil-mediated metabolic checkpoint. Therapeutic or genetic interference in this pathway restores NK cell functionality, with benefit on tumor burden.
Both primary tumor-derived and exogenous factors that promote inflammation can influence CTC arrest in the pre-metastatic niche1, 21. We found that ILC2-driven inflammation had no effect on mechanical trapping of CTC, but did acutely suppress lung NK cell function. Against our expectations, adaptive immune cells did not play a major role, while targeting of eosinophils was effective in reversing the effect of IL-33 on NK cells. Although neutrophils are also known to enhance CTC extravasation and lung metastasis formation22, 34, we found that specific ablation was ineffective at blocking IL-33-mediated NK cell suppression. Conversely, anti-IL-5 mAb treatment targeted eosinophils specifically, and reduced both NK cell suppression and metastatic seeding of the lung. Nevertheless, eosinophils are also reported to have anti-metastatic function in the lung35. However, our studies use 10-to-20 fold less IL-33, or use physiological stimuli in conjunction with Il33 −/− mice to reveal a pro-metastatic role in six different tumor models on different genetic backgrounds, and in different animal facilities. While eosinophils are primarily associated with type-2 inflammatory diseases, little is known about their ability to suppress type-1 immunity26.
Type-1 cytokines can directly antagonize effector functions of adaptive and innate type-2 lymphocytes6, 36. Reciprocal type-2 cytokine-driven regulatory mechanisms are less well defined, although IL-4 can suppress IFNγ production at very early stages of T cell activation37. Moreover, Treg cells and recently identified ILCreg are known to restrain type-1 immune cells via production of IL-10 or TGF-β8, 38, 39, however we found that these cytokines, or adaptive immunity, did not play a significant role in ILC2-mediated suppression of NK cells. While the ILC2-eosinophil-driven innate immune checkpoint suppresses anti-metastatic function of NK cells, its effect on adaptive anti-tumor immunity remains unknown. B16.F10 and other cancer cell-lines are susceptible to mono- and combination-immunotherapy40, prompting future studies to assess the role of ILC2-driven suppression on adaptive anti-tumor immunity.
IL-33 primarily promotes both innate and adaptive type-2 immunity, although there are reports of IL-33 directly stimulating NK and CD8+ T cells41, 42, 43. However, our results in ILC2-deficient or anti-IL-5 treated mice reveal indirect suppression by IL-33 on innate type-1 immunity. Nevertheless, forced overexpression of Il33 by tumors, or prolonged administration of high-dose IL-33 can promote anti-tumor immunity via indirect mechanisms that involve ILC2 in the primary tumor environment13, 44. Our data reveal a critical role of ILC2 and IL-33 in the pre-metastatic niche, which may stimulate further studies that disentangle physiological and therapy-induced effects of IL-33 at both the primary tumor and peripheral sites. Moreover, as our IL-33 neutralization and Il33 −/− mouse experiments target the endogenous release of IL-33, we speculate that ILC2-mediated innate type-1 immune suppression may influence other physiological roles such as lipid metabolism and wound healing; Indeed, IL-33 can also suppress adipose tissue NK cells.
IL-5 is primarily known for its importance in eosinophil development and function45. Our neutralization experiments reveal an essential role for IL-5 in mediating ILC2-dependent NK cell suppression. Importantly, IL-5 alone is not sufficient for exerting this function, and likely works in concert with other IL-33-induced factors that promote eosinophilic inflammation such as IL-13 and eotaxins26, 46. By neutralizing endogenously produced IL-5 (and IL-33), we target a physiological pathway that complements experiments using ILC2-deficient mice, which lack the primary innate source of IL-5 in the airways. Similarly, these approaches identify eosinophils as the critical myeloid cell-type that collaborates with ILC2 to suppress NK cell function. It remains to be determined whether ILC2, or other sources of IL-5 such as TH2 or mast cells exert similar control over NK cells in other organs.
Unexpectedly, we found that suppression of lung NK cell effector function did not coincide with major changes in transcription of core NK cell genes, or shifts in lung NK cell clusters, after IL-33 administration. However, post-transcriptional regulation of NK cell function can be governed by the activation-induced metabolic demand, and extracellular metabolite concentrations28. Although functionally and metabolically quiescent at rest, ex vivo activation resulted in increased glycolysis of NK cells from IL-33-treated lungs. Consistent with this, naive NK cells are initially more reliant on OXPHOS for effector function47, raising the possibility that the inflammatory environment provides signals that increase their reliance on glycolysis29. Increased reliance on glycolysis of lung NK cells coincides with altered metabolite bioavailability in the IL-33-treated lung milieu. Low concentrations of glucose, or lactate acidosis, impairs effector functions of NK and other lymphoid cells28, 48. Lung eosinophils are likely responsible for local glucose depletion and production of lactic acid in the IL-33-inflamed setting; Eosinophils are the most prevalent myeloid population in the inflamed lungs and readily take up 2-NBDG, while ex vivo cultures of inflamed lung utilise glucose and secrete lactate more than uninflamed lungs, which is reversed by anti-IL-5-mediated prevention of eosinophilia. The implications of glucose depletion or lactic acidosis on naive lung NK cell function is confirmed by our observed reductions in phospho-S6, and downstream translation of effector molecules. This mirrors the phenotype of NK cells from inflamed lungs, while reduced phospho-S6 and effector molecule production can be rescued by the genetic or therapeutic blockade of eosinophilia. Similarly, suppressed lung NK cells can be partially rescued by culture in high-glucose conditions. Lastly, using MSI of [U-13C]glucose infused mice we demonstrate that IL-33 increases glucose flux in the inflamed lung environment. These findings support the concept of nutrient competition in the immune-microenvironment49. It remains unknown what NK cell-intrinsic mechanisms are responsible for sensing metabolite availability, although in CD8+ T cells AMPKα1 can sense glucose availability to modulate mTORC1 and S6k50. Thus, we provide compelling evidence that ILC2-driven lung eosinophilia modulates the extracellular availability of metabolites, which impairs efficient glycolysis-dependent effector functions of lung NK cells.
Accession codes
Transcriptomic data is available at the Sequence Read Archive (SRA) under the Bioproject PRJNA637311.
Methods
In vivo animal studies
BALB/c, Nod/Scid.Il2rg −/− (NSG), C57BL/6J (B6), B6.MMTV-PyMT, B6.Tyr −/−, B6.Il33cit/cit (Il33 −/−), B6.Il7rCre/+ (provided by Prof. Hans Reimer Rodewald51), B6.Il7rCre/+Rorafl/fl, B6.Foxp3DTR, B6.µMT, B6.Rag2 −/− and B6.Rag2–/–Il7rCre/+Rorafl/fl mice were maintained in the Cancer Research UK – Cambridge Institute (CRUK-CI) animal facility, under specific-pathogen-free conditions. Mice housed at the CRUK-CI were kept in individually ventilated cages, between 19-23 °C with 45-65% humidity and a 12hour dark/light cycle. Some studies were performed at the Medical Research Councils ARES facility (Babraham, UK). Mice were sex and age matched whenever possible, and most mice were used at 8-12 weeks of age. All animal work was conducted under project license PD7484FB9 at the CRUK-CI (with approval from the Cancer Research UK - Cambridge Institute, Animal Welfare Ethical Review Body) or at the Medical Research Councils ARES facility (with approval from Babraham Institute, Animal Welfare Ethical Review Body) all in accordance with Home Office regulation.
In vivo experiments
Mice were anesthetized by isofluorane inhalation, followed by the intranasal administration of rmIL-33 (0.2 µg, Biolegend), rmIL-4 (0.5 µg), rmIL-13 (0.5 µg), rmGM-CSF (0.5 µg), rmIL-5 (0.5 µg), LPS (1 μg, Sigma), CpG (10 μg, Invivogen), Aspergillus protease allergen (0.01U, Sigma), Ragweed pollen extract (300 μg, Greer) or clodronate liposome (C.L.) (30% C.L./PBS, Liposoma B.V.) in 40 µl of PBS. Diphtheria toxin (10 ng/g, Sigma), IL-33R-Fc (10 mg/kg, AstraZeneca), anti-NK1.1 mAb (50 μg, PK136, BioXcell), anti-CCR2 (20 μg, MC-21, provided by Prof. Matthias Mack52), anti-CCL2 (200 μg, MCP-1, BioXcell), anti-Ly6C/G (200 μg, GR-1, BioXcell), anti-Ly-6G (200 μg, 1A8, BioXcell), anti-CD4 (100 μg, GK1.5, BioXcell), anti-IL-10 (300 μg, JES5-2A5, BioXcell), anti-TGF-β (400 μg, 1D11.16.8, BioXcell), anti-IL-5 (100 μg, TRFK5, BioXcell), rat IgG1, κ (BioXcell), rat IgG2a (BioXcell), or rmIL-33 (0.5 µg, Biolegend) was administered by intraperitoneal injection in 100 µl of PBS. A2AR antagonist (20 μg, SCH 58261, Sigma) was administered in DMSO/PBS (v/v).
Tumor cells and experimental lung metastasis models
All cell lines used in this study tested negative for Mycoplasma, and were authenticated by STR profiling. B16.F10 (Dr. Jacqueline Shields), B16.F10-mCherry, LL/2 (Dr. Maike de la Roche), B16.F10-Akaluc, as well as 4T1 (Prof. Greg Hannon) and 4T1-T (Prof. Greg Hannon53) tumor cells were grown in Dulbecco’s Modified Eagle’s Medium with 10% FBS. Tumor cells were detached using 0.05% Trypsin-EDTA (Gibco) and washed twice in PBS before injection. 1×10⁵ B16.F10, 4T1, or 4T1-T, and 2×10⁶ LL/2 were used for i.v. injection, unless otherwise stated. All orthotropic injections were performed using 1x10⁵ 4T1 or 3×10⁴ 4T1-T mouse mammary tumor cells re-suspended in 30 μl of PBS. For the early seeding studies 1×10⁵ B16.F10-mCherry cells were injected i.v. and lungs collected 24 hours post injection. In the autochthonous breast cancer model twelve-week-old female B6.MMTV-PyMT mice were randomized and treated intranasally with IL-33, Asp or PBS once a week and sacrificed at 20 weeks of age, followed by visual quantification of lung metastases, and weighing of primary tumours. Tumors on the lung surface were quantified by counting the metastatic foci under a dissection microscope, after which lungs were collected for further processing. For survival studies mice were treated as described in the figures and injected with B16-F10 tumor cells at day 0, mice were monitored daily and were sacrificed when reaching the humane endpoint.
Live imaging studies
Third generation lentiviral particles were produced by transient co-transfection of 293FT cells with Akaluc54-plasmid (Kindly provided by Prof. Greg Hannon) and the three packaging constructs pMDL, CMV-Rev, and VSV-G. Lentivirus containing particles were concentrated on Centricon Plus-70 filters (Millipore) and B16.F10 cells were infected with concentrated lentivirus in the presence of 8 mg/ml polybene, and selected 3 days after infection with neomycin (Geneticin 1 mg/ml, Invitrogen). IVIS bioluminescent imaging was performed by in vitro exposure of B16.F10-Akaluc cells to 250 µM Akalumine substrate for 30 minutes at 37 °C in a humidified, 5% CO2 incubator. The cells were washed with PBS twice and 1×10⁵ cells were injected i.v. into B6.Tyr −/−mice and imaging was performed 2, 10, and 30 min after. Total photon emission from the thorax of each mouse was quantified with the LivingImage software package (Xenogen).
Single cell preparation
Cell suspensions were prepared from lung by mechanical dissociation, followed by digest in 5 ml of RPMI-1640 containing collagenase I (500 U/ml) and DNase I (0.2 mg/ml) for 45 minutes at 37 °C on a shaker (220 rpm), followed by filtration through a 70 μm strainer and 25% Percoll gradient enrichment of leukocytes, and red blood cell (RBC) lysis. Tumor cell were recovered without Percoll enrichment. Blood cells were lysed in 5 ml RBC lysis buffer 3 times for 5 minutes and spleens were strained through a 70 μm filter in RPMI-1640 before lysing erythrocytes with RBC lysis buffer for 5 minutes. Single-cells were re-stimulated and stained for surface and intracellular markers (see flow cytometry).
Primary cell culture
Mouse primary cells were cultured in RPMI-1640 supplemented with 10% FCS, 100 U/ml penicillin (Invitrogen), and 100 μg/ml streptomycin (Invitrogen). Cells were cultured at 37 °C in a humidified, 5% CO2 incubator.
NK cell isolation and co-culture
Single cell suspension from PBS or IL-33-sensitised lung were used to isolate NK cells by magnetic bead negative selection strategy (EasySep, StemCell), according to manufacturer’s protocol. NK cell purity was assessed by flow cytometry and cells were used when purity exceeded 90%. Purified NK cells were cultured overnight, alone or with CFSE-labelled PBS or IL-33 lung single cell suspensions in different ratio’s. Alternatively, NK cells were co-cultured with sort purified ILC2 cells overnight in equal concentrations.
Eosinophil culture and adoptive transfer
Bone marrow derived eosinophils were cultured as described before55. Briefly, bone marrow derived progenitor cells were differentiated for 4 days in IMDM with GlutaMAX-1 (Gibco) with 10% FBS, 100 U/ml penicillin (Invitrogen), and 100 μg/ml streptomycin (Invitrogen) supplemented with 100 ng/ml Stem Cell Factor (Pepro Tech) and 100 ng/ml Flt3 ligand (Pepro Tech) at a concentration of 1×10⁶/ml. Thereafter, expanded progenitor cells were differentiated into eosinophils using 10 ng/ml recombinant mouse IL-5 (Pepro Tech) for 10 days and derived eosinophils were subsequently co-cultured with purified NK cells at different ratio’s or adoptively transferred into recipient mice (3×10⁶/mouse).
Glucose and lactate cultures
For in vitro glucose uptake experiments, mouse primary cells were cultured in glucose-free RPMI-1640 (Gibco) supplemented with 10% FCS, and 2-NBDG (50 µM, Thermo Fisher). Cells were cultured for 1 hour at 37 °C in a humidified, 5% CO2 incubator, followed by harvest, processing and flow cytometry analysis at 4 °C. For glucose-deficient or glucose-high experiments, mouse primary lung cells were cultured in glucose-free RPMI-1640 (Gibco) supplemented with 10% FCS, +/- glucose (2.0 or 4.5 mM), 100 U/ml penicillin (Invitrogen), and 100 μg/ml streptomycin (Invitrogen). Cells were cultured for 3 hours at 37 °C in a humidified, 5% CO2 incubator, followed by harvest, processing and flow cytometry analysis at 4 °C. For lactic acid experiments, mouse primary lung cells were cultured in RPMI-1640 supplemented with 10% FCS, 100 U/ml penicillin (Invitrogen), 100 μg/ml streptomycin (Invitrogen), and either: a) lactic acid (15 mM, pH 6.4 Sigma), b) HCl (pH 6.4), or c) normal pH (7.4). Cells were cultured for 3 hours at 37 °C in a humidified, 5% CO2 incubator, followed by harvest, processing and flow cytometry analysis at 4 °C. For intracellular cytokine detection, PMA + ionomycin and protein transport inhibitor (Thermo Fisher) was added during the 3-hour culture.
Sample preparation and 1H NMR analysis
For metabolic profiling of lung cultures, WT mice were treated with IL-33 or PBS on day 0 and 1, followed by culture of 1×10⁶ cells (whole lung) for 18 hours in 200 μL of RPMI-1640 supplemented with 10% FCS, 100 U/ml penicillin (Invitrogen), and 100 μg/ml streptomycin (Invitrogen). Cells were cultured at 37 °C in a humidified, 5% CO2 incubator. Three technical replicates were set up for each mouse, and combined (600 μL) for NMR analysis. 590 μL of sample was placed in a 5 mm Wilmad standard NMR tube and 10 μL of 60 mM TSP was added as the chemical shift and internal quantitation standard. 1H NMR spectra were acquired on a 600 MHz Bruker Avance NMR spectrometer using a water pre-saturation sequence with 1024 averages, 5sec repetition time, 2.28sec acquisition time (TR=7.28sec) and 32K time domain data points. The time domain data were pre-processed by 0.5 Hz line broadening, Fourier transformation, zero and first order phase correction. Chemical shifts were assigned from the human metabolomic data base (HMDB; http://www.hmdb.ca/) and also from our own 2D-NMR spectral (COSY and TOCSY) data. The absolute metabolite concentrations of the media were estimated using the NMR suite 8.3 (Chenomx® Software package) using the internal standard TSP concentration.
Cytotoxicity assays
To determine their ex vivo cytotoxic capacity we purified PBS- or IL33-exposed NK cells from mouse lungs using a magnetic bead negative selection strategy (EasySep, StemCell), according to manufacturer’s protocol. Purified NK cells (>85%) were subsequently CFSE-stained (5 μM final concentration in PBS) and co-cultured with >1.5 weeks passaged YAC-1 cells at 10:1 (NK/YAC-1) ratio in RPMI-1640. Addition of Annexin V Red (Essen Bioscience) allowed us to follow target cell killing using the Incucyte platform (Incucyte software v2018A, Essen Bioscience).
Flow cytometry
Single cells were incubated with anti-mouse CD16/32 (Thermo Fisher) to block Fc receptors and stained as indicated. Lineage cocktail contained (±CD3 (145-2C11), ±NK1.1 (PK136), TCRβ, CD5 (53-7.3), CD19 (1D3), CD11b (M1/70), CD11c (N418), FcεR1α (MAR-1), F4/80 (BM8), Ly-6C/G (Rb6-8C5), and Ter119 (TER-119) all on eFluor450 (eBioscience)). For intracellular staining we used the Foxp3/Transcription Factor Kit (Thermo Fisher), or Cytofix/Cytoperm Kit (BD Bioscience) as per manufacturer’s instructions. For intracellular cytokine detection, single cells were stimulated with PMA (60 ng/ml) and ionomycin (500ng/ml) plus 1× protein transport inhibitor (Thermo Fisher), 1× cytokine stimulation cocktail (Thermo Fisher), or plate bound anti-NK1.1 mAb (10-30 µg/ml, BioXcell), or recombinant IL-12 (20 ng/ml) and IL-18 (5 ng/ml) in culture media (RPMI-1640, 10% FCS) at 37 °C for 3 hours before staining. Data was acquired on a BD Fortessa or Symphony instrument, cells were quantified using CountBright beads. Data was analysed using FlowJo X (Tree Star).
B220 (RA3-6B2, Life Technologies, APC.eFl780), CD3e (145-2C11, eBioscience, PE.Cy7 and eFl450) (25-0031-83, 4304567), CD4 (RM4-5, eBioscience, AF700), CD5 (53-7.3, eBioscience, eFl450), CD8 (53-6.7, eBioscience, PerCP.eFl710 and SB645), CD11b (M1/70, eBioscience, eFl450, APC.eFl780, and BV785), CD11c (N418, eBioscience, eFl450 and AF700), CD16/32 (93, Biolegend), CD19 (1D3, eBioscience, eFl450), CD31 (390, Biolegend, BV605), CD45 (30-F11, Biolegend, BV510), CD49b (HMa2, BD, BV650), CD64 (X54-5/7.1 Biolegend, BV711), CD127 (SB/199, BD, PE.CF594), CD172a (P84, Biolegend, AF488), EpCam (G8.8, Biolegend, BV711), FceR1a (MAR-1, eBioscience, eFl450 and PerCP.eFl710), Fixable Viability Dye (eBioscience, UV455), F4/80 (BM8, eBioscience, eFl450 and APC.eFl780), Foxp3 (FJK-16s, eBioscience, AF488), GATA3 (TWAJ, eBiosciences, eFl660), Granzyme B (NGZB, eBioscience, PerCP.eFl710), I-A/I-E (CI2G9, BD, BUV395), ICOS (7E.17G9, eBioscience, PE), IFNg (XMG1.2, Biolegend, BV786), IL-5 (TRFK5, BD, APC), Ki67 (CIB56, BD, BV786), Ly-6C/G (Rb6-8C5, eBioscience, eFl450), Ly-6G (1A8-Ly6g, eBioscience, PE.eFl610), Ly-6C (HK1.4, eBioscience, PE.Cy7), NK1.1 (PK136, BD, BUV395 and eBioscience, eFl450), RELMα (DS8RELM, Invitrogen, APC), Phospho-S6 (cupk43k, eBioscience, PE), Podoplanin (8.1.1, Biolegend, PE.Cy7), Roryt (Q31.378, eBioscience, PerCP.eFl710), SiglecF (1RNM44N, eBioscience, SB600), ST2 (RMST2-2, eBioscience, PE), Ter119 (TER-119, eBioscience, eFl450).
Metabolic analysis
ECAR was measured using the Seahorse XF96 Extracellular Flux Analyzer (Agilent Technologies). PBS or IL-33 lung homogenates were stimulated 3 hours with PMA (60 ng/ml) and ionomycin (500ng/ml) at 37°C in a 5% CO2 incubator. Cells were collected and NK cells were purified by magnetic bead negative selection strategy (EasySep, StemCell), according to manufacturer’s protocol. Cells were suspended in XF Base Minimal RPMI (pH7.4) with L-Glutamine (2 mM), and were plated into a culture microplate (5x10⁵ cells/well; Agilent Technologies). Prior to real-time measurement of the ECAR, Glucose (20 mM), oligomycin (1,5 μM), and 2DG (50 mM) were added.
Mass Spectrometry Imaging (MSI) Sample Preparation, Acquisition and Data Analysis
Mice were anesthetized with isoflurane, maintained at 37ºC and administered with [U-13C]glucose (Cambridge Isotope Laboratories, Andover, MA) as a bolus at 0.4 mg/g, followed by continuous infusion of 0.012 mg/g/min at 300 µL/h for 120 min56. The lungs were rapidly removed and snap frozen in dry ice chilled isopentane and stored at -80C until sectioning. Lungs were sectioned to 10 µm thickness using a CM3050 cryomicrotome (Leica Biosystems, Nussloch, Germany) and thaw-mounted onto Superfrost slides (Fisher Scientific, Loughborough, UK) for desorption electrospray ionization (DESI) MSI and histological examination. Tissue section slides were vacuum packed and stored at -80ºC until analysis.
DESI MSI was carried out using an automated 2D DESI source (Prosolia Inc, Indianapolis, IN, USA) with home-built sprayer assembly57 mounted to a Q-Exactive FTMS instrument (Thermo Scientific, Bremen, Germany). Analyzes were performed at spatial resolutions between 40 μm in negative ion mode and mass spectra were collected in the mass range of 80−900 Da with mass resolving power set to 70000 at m/z 200 and an S-Lens setting of 100. Methanol/water (95:5 v/v) was used as the electrospray solvent at a flow rate of 1.0 μL/min and a spray voltage of -4.5kV. Distance between DESI sprayer to MS inlet was 7mm, while distance between sprayer tip to sample surface was 1.5mm at an angle of 75°. Nitrogen N4.8 was used as nebulizing gas at a pressure of 6.5 bar. Omnispray 2D (Prosolia, Indianapolis, USA) and Xcalibur (Thermo Fisher Scientific Inc) software were used for MS data acquisition. Individual line scans were converted into centroided. mzML format using MSConvert (ProteoWizard toolbox version 3.0.4043) and subsequently into.imzML using imzML converter v1.3. Hematoxylin and eosin (H&E) staining was performed post analysis on same lung sections and the stained sections were imaged at 40x with Aperio CS2 digital pathology scanner (Aperio Tech., Oxford, UK), and visualized with ImageScope software (Aperio Tech.).
Mass Imaging data were visualized and analyzed using SCiLS Lab MVS 2019b software (SCiLS GmbH, Bremen, Germany). MS images were normalized to RMS (Root Mean Square) to compensate for signal instabilities and allow comparison between multiple experiments. Exact mass measurements only were used for metabolite identification with mass deviations <8ppm (see below). For labelled metabolites no mass interferences were found on non-infused samples MS images. (Metabolite; Ion Cluster; m/z theoretical; m/z measures; error): Lactate; [M-H]-; 89.024418; 89.02386; 6.3, [U-13C]Lactate; [M-H]-; 92.033379; 92.03269; 7.5, Glucose; [M+Cl]-; 215.032789; 215.03241; 1.8, [U-13C]Glucose; [M+Cl]-; 221.05291; 221.05359; 3.1.
A bisecting k-means algorithm using a weak pixel denoising and distance correlation as parameters were applied to provide unsupervised clustering of MS images to create regions corresponding to each lung sample. Then, the mean relative abundance of each molecular species for pixels of the image was extracted from each sample and expressed in arbitrary unit (a.u.).
Histology
Lung lobes were fixed in 10% neutral buffered formalin in PBS for 24 hours, followed by transfer to 70% Ethanol in PBS for another 24 hours and embedded into paraffin. 3 μm sections were cut and stained with Ki-67. The CRUK-CI Histology Core performed tissue embedding, sectioning and staining. Image quantification was performed using the HALO software (HALO, Indica labs).
Bulk-RNA-seq
Mouse lungs were dissected and made to single cell suspension as described above, followed by staining with with anti-mouse CD16/32 (Thermo Fisher) to block Fc receptors, Lineage cocktail (anti-CD5, CD19, CD11c, FcεR1α, F4/80, Ly-6C/G, and Ter119) eFl450, anti-CD45 BV510, anti-CD49b BV605, anti-NK1.1 BUV395, anti-CD3 PE-Cy7, anti-B220 APC-eFl780, and anti-CD4 AF700. Dead cells were excluded by DAPI staining, followed by electronic gating of live CD45+LineageintCD3–CD4–B220–NK1.1+CD49b+ NK cells which were purified by FACS (BD Aria II, Becton Dickinson). Purity checks were performed after each sort, with all used samples being >95% pure.
1 µg of total RNA was used as input material for library preparation. The NEBNext Poly(A) mRNA magnetic Isolation Module (NEB) was used to isolate poly(A) RNAs. Libraries were generated with the NEBNext Ultra Directional RNA Library Prep kit for Illumina (NEB) according to manufacturer's instructions. The pooled libraries were quantified with KAPA Library Quantification Kit for Illumina (Kapa Biosystems) and sequenced (single end 50nt) on an Illumina HiSeq 4000 (Illumina).
Bulk RNA-seq analysis
Sequence data were aligned to the GRCm38 mouse reference genome using STAR (v2.7.3)58. Quality control metrics were computed using Picard CollectAlignmentStatistics and CollectRnaSeqMetrics (https://broadinstitute.github.io/picard). Assignment and quantification of reads to transcripts from Ensembl release 98 (https://www.ensembl.org) were performed using featureCounts from the subread package (v1.5.2)59. DESeq260 was used to estimate size factors for normalization, estimate dispersions, fit a negative binomial GLM and calculate Wald statistics for differential expression between sample groups. Gene set enrichment analysis was performed using GSEA software and gene set collection 7.1 (Hallmark signatures). (http://software.broadinstitute.org/gsea/index.jsp).
A power calculation was carried out with PROPER61 using estimates of the variance from the first bulk RNA-seq analysis in which there were 3 replicates for each group. The second RNA-seq analysis had 7 replicate samples taken from mice on day 2 following treatment with PBS and IL-33. The data for one replicate in the IL-33 group failed QC based on depth of coverage and clustering in a principal components analysis and was discarded.
Single-cell RNAseq processing and quality control
WT mouse lung NK cell FACS purification was performed identical to bulk-RNA-seq experiments. Mapping and counting of 10x Genomics scRNA-seq reads was performed using Cell Ranger (v 3.1.0) without filtering droplets. Reads with swapped barcodes and empty droplets were identified for filtering using the swappedDrops and emptyDrops functions from the DropletUtils (v1.4.3) Bioconductor package62, 63. Data were further processed using scran (v1.12.1), scater (v1.12.2) and SingleCellExperiment (v1.6.0) Bioconductor packages64, 65. Poor quality cells with log10 total UMIs less than 3 median absolute deviations (MADs) from the median, total genes detected less than 3 MADs from the median, or log10 ratio of mitochondrial to non-mitochondrial gene UMIs deviating more than 3 MADs from the median were removed. Normalization was carried out by deconvolving cell pools as implemented in the computeSumFactors function from the scran Bioconductor package66. To remove contaminating myeloid cells, we first identified lung myeloid- and NK-cell specific genes using the following sources: population comparison of splenic NK cells versus lung alveolar macrophages from the ImmGen RNA-seq database67 (analysis specified genes always expressed in one population and never in the other; selected top 10 with highest expression); alternatively activated macrophage markers from Holtzman et al.68; alveolar macrophage genes from Misharin et al.69; and NK cell genes from Crinier et al.70. Expression of myeloid-specific and NK cell specific genes was largely mutually exclusive. Cells that expressed more myeloid-specific than NK cell-specific genes were classified as contaminating cells and were removed.
Single-cell RNAseq analysis
Clustering was performed by the Louvain method on a shared nearest neighbours graph as implemented in the scran and igraph (v1.2.4.1) packages. Marker genes for each cluster were identified using the findMarkers function from scran, selecting genes differentially expressed compared to all other clusters. Cell-specific scores for cell cycle phases were calculated using the CellCycleScoring function from the Seurat (v3.1.1) package71 after converting supplied human phase-associated genes to their murine orthologues using BioMart (biomaRt v2.40.5). Cluster abundances were modelled using a quasi-likelihood negative binomial GLM and differential abundances between PBS and IL-33-treated samples tested with empirical Bayes quasi-likelihood F-tests, as implemented in the edgeR (v3.26.8) Bioconductor package72. Abundance analyses were performed by normalizing based on cell number and without estimating a trend on the dispersion due to the small number of clusters. After filtering for genes detected in at least 1% of cells, differential expression analysis controlling for cluster abundances and cluster-specific treatment effects was also performed through the edgeR negative binomial GLM framework73, modelling gene expression as a function of sample, cluster, and cluster-sample interactions. A likelihood ratio test was performed contrasting IL-33-treated sample coefficients with PBS-treated sample coefficients. Analysis code for scRNA-seq is available at (https://github.com/MarioniLab/scRNAseqLungNKcells).
Statistics
Analysis for two groups were calculated using unpaired two-tailed Student’s t-test, comparisons of more than two groups were calculated using one-way ANOVA with Tukey post-analysis, or Log-rank (Mantel-Cox) test where necessary. Data were analysed using GraphPad Prism 8 (GraphPad Software) with p ≤ 0.05 being considered significant.
Data and Software Availability
Transcriptomic data used in Fig. 6 and Extended Data Fig. 7 are available at the Sequence Read Archive (SRA) under the Bioproject PRJNA637311 : Lung NK cell transcriptomic. Bulk RNAseq data are available with the following BioSample accession numbers: SAMN15099850 (bulk PBS vs IL33) and the following sample names are A1, D1, B2, C2, F2, E1 and H1 for the PBS-treated condition and D2, B1, F1, E2, A2 and G1 for IL33-treated condition; SAMN15099866 (time-course) with the following triplicate sample names E4, A4, C3 (WT PBS day 3), H3, F4, D3 (WT IL33 day 3), C4, G4, A3 (WT IL33 day 7), B4, E3, G3 (WT IL33 day 14) and D4, F3, B3 (IL2KO IL33 day 3).
Extended Data
Extended Data Fig. 1. Pre-existing innate type-2 inflammation promotes lung metastasis formation.
a, WT mice were treated as in (Fig. 1 a) and tumor burden was assessed by histological staining for Ki67+ tumor foci and quantification of tumor area over total lung area by automated image analysis (n = 10). b, Il33cit/+reporter mice were treated intranasally with PBS or IL-33 on days 0 and 1, and citrine+ lung cells were assessed on day 3. c, WT mice were treated intranasally with IL-33 on days 0 and 1 (or PBS injection for day 0), followed by quantification of total lung eosinophils by flow cytometry (see Extended Data Fig 4a for gating strategy) at the indicated time-points (n = 3). d, WT mice were treated as indicated, followed by visual quantification of lung metastases on day 28 (n = 9). e, WT mice were treated as indicated, followed by visual quantification of lung metastases on day 21 (n = 6). f, WT mice were treated intranasally with LPS, CpG or PBS on days 0 and 1, followed by intravenous transfer of B16.F10 cells on day 7, and sacrifice on day 21, followed by visual quantification of lung metastases (n = 10). g, 4T1 (n = 10) or 4T1-T (n = 13,14,10) breast cancer cells were implanted in the mammary fat pad (see Methods), primary tumors were dissected and weighed. h, B6.MMTVPyMT mice were randomized, treated intranasally with PBS, IL-33, or Asp (from week 12 to 20, see Methods), followed by measurement of total primary breast tumor(s) weight at 20 weeks of age (n = 10,10,11). i, Representative flow cytometry gating strategy of lung lymphocytes and innate lymphocyte populations from WT mice treated with PBS or IL-33 on day 0 and 1, followed by sacrifice on day 3 description of gated cells is listed above the dot plot, cell exclusion performed by Boolean-gating. j, WT mice were treated as in (c), followed by quantification of total lung ILC2 (Live CD45+CD3– B220– NK1.1 – Lineage– CD127+RORγt– GATA3+) at the indicated time points (n = 3). k, WT andIl33–/–mice were treated with PBS or Asp on day 0 and 1, followed by quantification of total lung eosinophils at day 3 (n = 10,10,5,10).
Bar graphs indicate mean (±SEM) and show combined data of two (d-f, k, g) or three (a, h), or representative of three independent experiments (b, c, i, j c). Statistical analyses were calculated using one-way ANOVA with **** = p ≤ 0.0001.
Extended Data Fig. 2. IL-33 influences lung NK cells.
a, WT mice were treated as indicated, followed by visual quantification of lung metastases on day 21. b, WT mice were treated with anti-IFNγ or control mAb similar to (a); Tumor burden was assessed on day 21 by visual quantification of lung metastases (n = 10). c, Mice were treated intranasally with PBS or IL-33 on days 0 and 1, followed by quantification of total lung NK cells by flow cytometry on day 3 (n = 3). d, WT mice were treated as in (c), followed by flow cytometric detection of Ki-67+ lung NK cells and ILC2 (n =5). e, Representative flow cytometry gating strategy of lung NK cells and T lymphocytes from WT mice treated with PBS or IL-33 on day 0 and 1, followed by sacrifice on day 3. f,g, WT mice were treated as in (c), followed by quantification of IFNγ + NK cells (Live CD45+NK1.1+/lowCD49b+) after 3hr stimulation of total lung cells with plate bound anti-NK1.1 (f) (n = 3); or PI (g) (n = 3). h, Total WT mouse lung cells were stimulated for 3hrs ex vivo with a combination of IL-12 and IL-18, followed by quantification of IFNγ + positive NK cells (n = 10). i, WT mice were treated as in (c) and cardiac WAT NK cell were analyzed for intracellular IFNγ (n = 9,6) and GzmB (n = 9,6) after 3hr stimulation with PI. j, Lung CD4 and CD8 T cells from PBS or IL-33 treated WT mice were analyzed for intracellular IFNγ after 3hr stimulation with PI or anti-NK1.1 (representative gating shown in (e)). k, WT mice were treated as in (c), followed by lung NK cells purification and co-cultured with CFSE labelled whole lung homogenates from PBS or IL-33 treated WT mice (12h), followed by 3hr PI stimulation and detection of GzmB positive NK cells; grey bars indicate CFSE-labelled NK cells present in whole lung homogenates (n = 6,11,10,11,2,8 biologically independent samples). l-m, WT mice housed at the MRC ARES facility were treated as in (c), followed by quantification of percent of IFNγ + NK cells (after 3hrs of PI) (l) (n =5), or treated as in Fig. 1a (50K B16.F10) followed by visual quantification of lung metastases (m) (n = 5).
Bar graphs indicate mean (±SEM) and show combined data of two (b, i) or three (h, k) independent experiments. (e, j) show representative flow cytometry plots of three independent experiments, whereas (c, d, f, g, I, and m) show a representative bar graph of two independent experiments. Statistical analyses were calculated using one-way ANOVA or unpaired two-tailed Student’s t-test (c, f-i, l, m) **** = p ≤ 0.0001.
Extended Data Fig. 3. ILC2 suppress NK cells via an indirect innate immune mechanism.
a, Il7raCre/+or Il7raCre/+Rorafl/fl mice were treated with PBS or Asp on day 0 and 1, followed by quantification of IFNγ + lung NK cells on day 3 (n = 12,13,11,12). b,c, WT mice were treated as in (a), followed by purification of lung ILC2 (flow cytometry) and lung NK cells (magnetic bead, see Methods) on day 3. Lung NK were cultured alone or with ILC2 and analyzed for intracellular IFNγ and GzmB (c) (n = 8). d, WT mice were treated as in (e) with PBS or IL-33 and A2AR antagonist or DMSO followed by quantification of IFNγ + lung NK cells on day 3 (n = 6,7,6). e, WT mice were treated as indicated, followed by quantification of GzmB+ lung NK cells (n = 3, representative gating on right). f, WT and Foxp3DTR mice were treated with PBS or IL-33 and DTx, followed by quantification of percent IFNγ + lung NK cells on day 3 (n = 3,3,4,5). g, WT andRag2–/–mice were treated with PBS or IL-33 on days 0 and 1, and given adoptive transfer of LL/2 cells (i.v.) on day 7. Tumor burden was assessed on day 21 by visual quantification of lung metastases (n = 10,8,8,10). h, WT, Rag2–/–and Rag2–/–Il7raCre/+Rorafl/fl mice were treated with PBS or IL-33 on day 0 and 1, followed by flow cytometry analysis for the indicated lung lymphoid cells on day 3 (n = 5).
Bar graphs indicate mean (±SEM) and show combined data of two (c, d, and g) or three (a) independent experiments. (e, f, and h) shows a representative bar graph of two independent experiments. Statistical analyses were calculated using one-way ANOVA with ns = not significant, and **** = p ≤ 0.0001.
Extended Data Fig. 4. Myeloid cell profiling after IL-33 administration and correlation with NK cell function.
a,b, WT mice were treated with PBS or IL-33 on day 0 and 1, followed by (a) flow cytometry analysis and (b) quantification for the indicated lung myeloid cells on day 3 (n = 6). c, Representative flow cytometry plot of eosinophils from mice injected and gated as in (a) assessed for expression of Ly-6G (left) Ly-6C (right). d, The correlation between percent IFNγ + NK cells and total numbers of the indicated myeloid cells in the lung of PBS or IL-33 injected WT mice (day 0 and 1, sacrificed on day 3) was analyzed on pooled results (n=125).
Bar graphs indicate mean (±SEM) and show representative data from three independent experiments (a, b, and c) and (d) representing Pearson r.
Extended Data Fig. 5. IL-33-mediated suppression of NK cells is not dependent on neutrophils or alveolar macrophages.
a-e, WT mice were treated with PBS or IL-33 on day 0 and 1, and the indicated mAb (or clodronate liposomes, C.L.) on day -1 and 1 followed by quantification of percent IFNγ + or GzmB+ lung NK cells (after PI stimulation) and quantification for the indicated lung myeloid cells on day 3 (a; GzmB n = 10,9,9,10, and depicted myeloid cells n = 15,14,14,15, b; n = 8,8,8,9, c; n = 7, d,e, n = 6).
Bar graphs indicate mean (±SEM) and show combined data of two (b-e) or three (a) independent experiments. Statistical analyses were calculated using one-way ANOVA with ns = not significant, and **** = p ≤ 0.0001
Extended Data Fig. 6. IL-5 and eosinophils mediate IL-33-driven suppression of NK cells.
a, WT mice were treated with PBS or IL-33 on day 0 and 1, followed by quantification of IL-5+ ILC2 (CD45+B220–Lineage–), or CD45+B220–lineage+ cells in the lungs on day 3 (n = 5); the identity of IL-5+ ILC2 was further confirmed by ICOS expression. b-d, WT mice were treated with PBS or IL-33 on day 0 and 1, and anti-IL-5 or control on day -6, -3 and -1 followed by quantification of the total numbers of the indicated myeloid cells in the lung (c) (n = 10), and the percent IFNγ + and GzmB+ lung NK cells (after anti-NK1.1 stimulation) on day 3 (d) (n = 5). e, WT mice were treated intranasally with PBS or the indicated cytokines on day 0 and 1, followed by quantification of percent IFNγ + NK cells (after PI stimulation), or lung eosinophil numbers on day 3 (n = 3). f, Mice of the indicated genotypes were treated intranasally Asp or PBS on days 0 and 1, followed by intravenous transfer of B16.F10 cells on day 7 and subsequent determination of lung metastases-related mortality by Kaplan-Meier survival curve (n = 15,14,15,9). g, Purified WT mouse lung NK cells were cultured alone or withex vivo bone marrow derived eosinophils at the indicated ratios for 18 hours, followed by a 3hr re-stimulation with PI and quantification of IFNγ + and GzmB+ NK cells by flow cytometry (n = 6,6,9).
Bar graphs indicate mean (±SEM) of combined data of two (c, g) or three (f) independent experiments. (d and e) show representative data of three independently performed experiments and (a) depicts representative flow cytometry plots. Statistical analyses were calculated using one-way ANOVA or Log-rank (Mantel-Cox) test (f) with **** = p ≤ 0.0001.
Extended Data Fig. 7. Single-cell and bulk-RNA-seq of naive and IL-33-inflammed lung NK cells.
a, Mice were treated with PBS or IL-33 on day 0 and 1, followed by FACS purification of lung NK cells at the indicated time-points for either scRNA-seq or bulk-RNA-seq analysis. b, Post FACS purity was assessed for all sorts. c, Clusters from (Fig. 4a) were annotated based on their gene expression patterns. Heatmap of genes significantly (FDR < 0.05) upregulated or downregulated in one cluster versus all others. Where more than 15 genes were significantly differentially expressed, only the 15 with the greatest average log-fold changes in each direction were included. Blue-to-yellow color gradient indicates log2 (normalized gene expression). d, scRNA-seq expression ofCd27and Itgam (encoding CD11b) separated by cluster. Specific clusters were annotated as follows (where individual genes were significantly upregulated in one cluster compared to all others, the 5 with greatest average log-fold-change are listed as marker genes): Cluster 2: signaling/inflammatorychemokine-expressing NK cells (Pim1, Nfkbia, Gadd45b, Ccl4, Icam1); Cluster 3: (Kcnj8, Ly6c2); Cluster 4: (Hsp90ab1, Hspe1, Nme1, Ptma, Rps2); Cluster 6: (Ccl5, Cma1, Klrg1, Itm2b); Cluster 7: immature NK cells (Ctla2a, Emb, Ccr2, Rps15a, Rpl10a). Cluster 2 was most similar to the previously identified splenic murine NK cell cluster 3, and Cluster 7 was most similar to the previously identified splenic and blood murine NK cell cluster 2 as identified by Crinier et al. 32. e, Results of a differential abundance analysis comparing the abundance of cells in each cluster after IL-33 versus PBS treatment. P-values were calculated using empirical Bayes quasi-likelihood F-tests in a negative binomial GLM (as described in Methods). f,g, Expression of NK cell consensus32, effector, and both activating and inhibitory receptor transcripts from bulk-RNA-seq analysis of sorted lung NK cells. Data are represented as a heatmap of log2as identified by Cri-transformed normalized read counts of individual genes, grouped by category (f), or z-scaled expression values for genes within the 4 gene lists. Each point represents the expression value obtained by one replicate for a given gene at a given time point (g). Box plots represent mean (black line), first and third quartiles (box) and range within 1.5 times the interquartile range from the box (whiskers). Violin plots represent median (black line), interquartile ranges (box) and a kernel density plot.
Extended Data Fig. 8. IL-33 increases glucose flux in the lung environment via ILC2 and IL-5.
a, BALB/c mice were treated intranasally with IL-33 or PBS on days 0 and 1, and anti-IL-5 or control antibody (i.p.) on day -6, -3, and 0 and sacrificed on day 3. Lung homogenates were cultured for 18 hours and glucose (Glu) and lactate (Lac) concentrations were measured in the supernatant by NMR analysis (n = 10,9,9). b, Spatial resolving glycolytic activity in lung by MSI. WT or Il7raCre/+Rorafl/fl(KO) mice were dosed with PBS or IL-33 on day 0 and 1, and sacrificed on day 3 and infused or not with [U-13C] glucose (as described in Methods). (Right to left) H&E stained lungs and post DESI-MSI molecular images of lactate, [U-13C] lactate, glucose, [U-13C] glucose, normal and [U-13C] lactate to glucose ratio (pixel per pixel). Intensity scale is fixed for each molecular species independently, and monochromatic lighter colors correspond to higher relative abundance. c, d, Bar graphs indicate mean relative abundances of [U-13C] glucose or [U-13C] lactate (c) (n = 4), or the ratio of [U-12C] lactate over glucose (d) (n = 4). e, BALB/c were treated intranasally with Asp or PBS on days 0 and 1, and anti-IL-5 or control antibody (i.p.) on day -6, -3, 0 and 3, followed by injected with 4T1-T breast cancer cells in the mammary fat pad on day 7, and sacrifice on day 21. f, Tumor burden of mice treated as in (e) with 4T1-T cells was quantified by visual examination and primary tumor weight was recorded (n = 9,10,9). g, Graphical abstract.
Bar graphs indicate mean (±SEM) of combined data of two (a, c, d, and f) independent experiments. (b) depicts representative MSI images of two independent experiments. Statistical analyses were calculated using one-way ANOVA with **** = p ≤ 0.0001.
Acknowledgements
We acknowledge the following funding sources: EMBO long-term post-doctoral fellowship (ALTF 423-2017, MJS), MRC Skills Development Fellowship (MR/P014178/1, ACR), European Union’s Horizon 2020 research and innovation programme under the Marie Skłodowska-Curie grant agreement (PanILC No 840501, JS), The Royal Society and Wellcome Trust (204622/Z/16/Z, TYH), Cancer Research UK (CRUK) core award (A24995, TYH), and the CRUK Grand Challenge Rosetta Consortium (C197/A25040, KMB, RJAG, AT and GH). DESI-MSI optimization was supported by N Strittmatter. We thank the CRUK-CI research instrumentation, flow cytometry, genomics, bioinformatics, histopathology, imaging and BRU cores for their expertise and help.
Footnotes
Author Contributions
MJS designed and conducted experiments, and wrote the manuscript. SP, ACR, AT, GH, SiP, CG, AN, JuS, JiS, AR and EMS assisted with experiments or analysis. JDS, MDE, ANJM, HR, MM, GJH, XRR, SC, RJAG, KMB and JM provided reagents and/or advice. TYH supervised the study, designed and conducted experiments, and wrote the manuscript.
Competing Interests Statement
GH, XRR, RJAG and ESC are employees of AstraZeneca and have stock/stock options in AstraZeneca.
References
- 1.Steeg PS. Targeting metastasis. Nat Rev Cancer. 2016;16:201–218. doi: 10.1038/nrc.2016.25. [DOI] [PMC free article] [PubMed] [Google Scholar]
- 2.Lopez-Soto A, Gonzalez S, Smyth MJ, Galluzzi L. Control of Metastasis by NK Cells. Cancer Cell. 2017;32:135–154. doi: 10.1016/j.ccell.2017.06.009. [DOI] [PubMed] [Google Scholar]
- 3.Monticelli LA, et al. Innate lymphoid cells promote lung-tissue homeostasis after infection with influenza virus. Nat Immunol. 2011;12:1045–1054. doi: 10.1031/ni.2131. [DOI] [PMC free article] [PubMed] [Google Scholar]
- 4.Schuijs MJ, Halim TYF. Group 2 innate lymphocytes at the interface between innate and adaptive immunity. Ann N YAcad Sci. 2018;1417:87–103. doi: 10.1111/nyas.13604. [DOI] [PubMed] [Google Scholar]
- 5.Halim TYF, et al. Tissue-Restricted Adaptive Type 2 Immunity Is Orchestrated by Expression of the Costimulatory Molecule OX40L on Group 2 Innate Lymphoid Cells. Immunity. 2018;48:1195–1207 e1196. doi: 10.1016/j.immuni.2018.05.003. [DOI] [PMC free article] [PubMed] [Google Scholar]
- 6.Molofsky AB, et al. Interleukin-33 and Interferon-gamma Counter-Regulate Group 2 Innate Lymphoid Cell Activation during Immune Perturbation. Immunity. 2015;43:161–174. doi: 10.1016/j.immuni.2015.05.019. [DOI] [PMC free article] [PubMed] [Google Scholar]
- 7.Crome SQ, et al. A distinct innate lymphoid cell population regulates tumor-associated T cells. Nat Med. 2017;23:368–375. doi: 10.1038/nm.4278. [DOI] [PMC free article] [PubMed] [Google Scholar]
- 8.Wang S, et al. Regulatory Innate Lymphoid Cells Control Innate Intestinal Inflammation. Cell. 2017;171:201–216 e218. doi: 10.1016/j.cell.2017.07.027. [DOI] [PubMed] [Google Scholar]
- 9.Seehus CR, et al. Alternative activation generates IL-10 producing type 2 innate lymphoid cells. Nat Commun. 2017;8 doi: 10.1038/s41467-017-02023-z. 1900. [DOI] [PMC free article] [PubMed] [Google Scholar]
- 10.Fournie JJ, Poupot M. The Pro-tumorigenic IL-33 Involved in Antitumor Immunity: A Yin and Yang Cytokine. Front Immunol. 2018;9:2506. doi: 10.3389/fimmu.2018.02506. [DOI] [PMC free article] [PubMed] [Google Scholar]
- 11.Chevalier MF, et al. ILC2-modulated T cell-to-MDSC balance is associated with bladder cancer recurrence. J Clin Invest. 2017;127:2916–2929. doi: 10.1172/JCI89717. [DOI] [PMC free article] [PubMed] [Google Scholar]
- 12.Jovanovic IP, et al. Interleukin-33/ST2 axis promotes breast cancer growth and metastases by facilitating intratumoral accumulation of immunosuppressive and innate lymphoid cells. Int J Cancer. 2014;134:1669–1682. doi: 10.1002/ijc.28481. [DOI] [PubMed] [Google Scholar]
- 13.Saranchova I, et al. Type 2 Innate Lymphocytes Actuate Immunity Against Tumours and Limit Cancer Metastasis. Sci Rep. 2018;8 doi: 10.1038/s41598-018-20608-6. 2924. [DOI] [PMC free article] [PubMed] [Google Scholar]
- 14.DeNardo DG, et al. CD4(+) T cells regulate pulmonary metastasis of mammary carcinomas by enhancing protumor properties of macrophages. Cancer Cell. 2009;16:91–102. doi: 10.1016/j.ccr.2009.06.018. [DOI] [PMC free article] [PubMed] [Google Scholar]
- 15.Taranova AG, et al. Allergic pulmonary inflammation promotes the recruitment of circulating tumor cells to the lung. Cancer Res. 2008;68:8582–8589. doi: 10.1158/0008-5472.CAN-08-1673. [DOI] [PMC free article] [PubMed] [Google Scholar]
- 16.Halim TY, Krauss RH, Sun AC, Takei F. Lung natural helper cells are a critical source of Th2 cell-type cytokines in protease allergen-induced airway inflammation. Immunity. 2012;36:451–463. doi: 10.1016/j.immuni.2011.12.020. [DOI] [PubMed] [Google Scholar]
- 17.Street SE, Cretney E, Smyth MJ. Perforin and interferon-gamma activities independently control tumor initiation, growth, and metastasis. Blood. 2001;97:192–197. doi: 10.1182/blood.v97.1.192. [DOI] [PubMed] [Google Scholar]
- 18.Long A, et al. Type 2 Innate Lymphoid Cells Impede IL-33-Mediated Tumor Suppression. J Immunol. 2018;201:3456–3464. doi: 10.4049/jimmunol.1800173. [DOI] [PMC free article] [PubMed] [Google Scholar]
- 19.Halim TY, et al. Group 2 innate lymphoid cells license dendritic cells to potentiate memory TH2 cell responses. Nat Immunol. 2016;17:57–64. doi: 10.1038/ni.3294. [DOI] [PMC free article] [PubMed] [Google Scholar]
- 20.Halim TY, et al. Group 2 innate lymphoid cells are critical for the initiation of adaptive T helper 2 cell-mediated allergic lung inflammation. Immunity. 2014;40:425–435. doi: 10.1016/j.immuni.2014.01.011. [DOI] [PMC free article] [PubMed] [Google Scholar]
- 21.Altorki NK, et al. The lung microenvironment: an important regulator of tumour growth and metastasis. Nat Rev Cancer. 2019;19:9–31. doi: 10.1038/s41568-018-0081-9. [DOI] [PMC free article] [PubMed] [Google Scholar]
- 22.Coffelt SB, et al. IL-17-producing gammadelta T cells and neutrophils conspire to promote breast cancer metastasis. Nature. 2015;522:345–348. doi: 10.1038/nature14282. [DOI] [PMC free article] [PubMed] [Google Scholar]
- 23.Gabrilovich DI. Myeloid-Derived Suppressor Cells. Cancer Immunol Res. 2017;5:3–8. doi: 10.1158/2326-6066.CIR-16-0297. [DOI] [PMC free article] [PubMed] [Google Scholar]
- 24.Albrengues J, et al. Neutrophil extracellular traps produced during inflammation awaken dormant cancer cells in mice. Science. 2018;361 doi: 10.1126/science.aao4227. [DOI] [PMC free article] [PubMed] [Google Scholar]
- 25.Quail DF, et al. Obesity alters the lung myeloid cell landscape to enhance breast cancer metastasis through IL5 and GM-CSF. Nat Cell Biol. 2017;19:974–987. doi: 10.1038/ncb3578. [DOI] [PMC free article] [PubMed] [Google Scholar]
- 26.Weller PF, Spencer LA. Functions of tissue-resident eosinophils. Nat Rev Immunol. 2017;17:746–760. doi: 10.1038/nri.2017.95. [DOI] [PMC free article] [PubMed] [Google Scholar]
- 27.Zaynagetdinov R, et al. Interleukin-5 facilitates lung metastasis by modulating the immune microenvironment. Cancer Res. 2015;75:1624–1634. doi: 10.1158/0008-5472.CAN-14-2379. [DOI] [PMC free article] [PubMed] [Google Scholar]
- 28.O'Brien KL, Finlay DK. Immunometabolism and natural killer cell responses. Nat Rev Immunol. 2019;19:282–290. doi: 10.1038/s41577-019-0139-2. [DOI] [PubMed] [Google Scholar]
- 29.Donnelly RP, et al. mTORC1-dependent metabolic reprogramming is a prerequisite for NK cell effector function. J Immunol. 2014;193:4477–4484. doi: 10.4049/jimmunol.1401558. [DOI] [PMC free article] [PubMed] [Google Scholar]
- 30.Porter L, et al. Metabolic Profiling of Human Eosinophils. Front Immunol. 2018;9:1404. doi: 10.3389/fimmu.2018.01404. [DOI] [PMC free article] [PubMed] [Google Scholar]
- 31.Fairfax KA, et al. Transcriptional profiling of eosinophil subsets in interleukin-5 transgenic mice. J Leukoc Biol. 2018;104:195–204. doi: 10.1002/JLB.6MA1117-451R. [DOI] [PMC free article] [PubMed] [Google Scholar]
- 32.Lawrence MG, Steinke JW, Borish L. Cytokine-targeting biologics for allergic diseases. Ann Allergy Asthma Immunol. 2018;120:376–381. doi: 10.1016/j.anai.2018.01.009. [DOI] [PubMed] [Google Scholar]
- 33.Hsieh CS, Macatonia SE, O'Garra A, Murphy KM. T cell genetic background determines default T helper phenotype development in vitro. Journal of Experimental Medicine. 1995;181:713–721. doi: 10.1084/jem.181.2.713. [DOI] [PMC free article] [PubMed] [Google Scholar]
- 34.Wculek SK, Malanchi I. Neutrophils support lung colonization of metastasis-initiating breast cancer cells. Nature. 2015;528 doi: 10.1038/nature16140. 413417. [DOI] [PMC free article] [PubMed] [Google Scholar]
- 35.Lucarini V, et al. IL-33 restricts tumor growth and inhibits pulmonary metastasis in melanoma-bearing mice through eosinophils. Oncoimmunology. 2017;6:e1317420. doi: 10.1080/2162402X.2017.1317420. [DOI] [PMC free article] [PubMed] [Google Scholar]
- 36.Iwamoto I, Nakajima H, Endo H, Yoshida S. Interferon gamma regulates antigen-induced eosinophil recruitment into the mouse airways by inhibiting the infiltration of CD4+ T cells. J Exp Med. 1993;177:573–576. doi: 10.1084/jem.177.2.573. [DOI] [PMC free article] [PubMed] [Google Scholar]
- 37.Tanaka T, Hu-Li J, Seder RA, Fazekas de St Groth B, Paul WE. Interleukin 4 suppresses interleukin 2 and interferon gamma production by naive T cells stimulated by accessory cell-dependent receptor engagement. Proc Natl Acad Sci U S A. 1993;90:5914–5918. doi: 10.1073/pnas.90.13.5914. [DOI] [PMC free article] [PubMed] [Google Scholar]
- 38.Li MO, Wan YY, Flavell RA. T cell-produced transforming growth factor-beta1 controls T cell tolerance and regulates Th1- and Th17-cell differentiation. Immunity. 2007;26:579–591. doi: 10.1016/j.immuni.2007.03.014. [DOI] [PubMed] [Google Scholar]
- 39.Asseman C, Mauze S, Leach MW, Coffman RL, Powrie F. An essential role for interleukin 10 in the function of regulatory T cells that inhibit intestinal inflammation. J Exp Med. 1999;190:995–1004. doi: 10.1084/jem.190.7.995. [DOI] [PMC free article] [PubMed] [Google Scholar]
- 40.Korman AJ, Peggs KS, Allison JP. Checkpoint blockade in cancer immunotherapy. Adv Immunol. 2006;90:297–339. doi: 10.1016/S0065-2776(06)90008-X. [DOI] [PMC free article] [PubMed] [Google Scholar]
- 41.Bonilla WV, et al. The alarmin interleukin-33 drives protective antiviral CD8(+) T cell responses. Science. 2012;335:984–989. doi: 10.1126/science.1215418. [DOI] [PubMed] [Google Scholar]
- 42.Bourgeois E, et al. The pro-Th2 cytokine IL-33 directly interacts with invariant NKT and NK cells to induce IFN-gamma production. Eur J Immunol. 2009;39:1046–1055. doi: 10.1002/eji.200838575. [DOI] [PubMed] [Google Scholar]
- 43.Qi L, et al. Interleukin-33 activates and recruits natural killer cells to inhibit pulmonary metastatic cancer development. Int J Cancer. 2020;146:1421–1434. doi: 10.1002/ijc.32779. [DOI] [PubMed] [Google Scholar]
- 44.Moral JA, et al. ILC2s amplify PD-1 blockade by activating tissue-specific cancer immunity. Nature. 2020;579:130–135. doi: 10.1038/s41586-020-2015-4. [DOI] [PMC free article] [PubMed] [Google Scholar]
- 45.Dougan M, Dranoff G, Dougan SK. GM-CSF, IL-3, and IL-5 Family of Cytokines: Regulators of Inflammation. Immunity. 2019;50 doi: 10.1016/j.immuni.2019.03.022. 796811. [DOI] [PubMed] [Google Scholar]
- 46.Mishra A, Rothenberg ME. Intratracheal IL-13 induces eosinophilic esophagitis by an IL-5, eotaxin-1, and STAT6-dependent mechanism. Gastroenterology. 2003;125:1419–1427. doi: 10.1016/j.gastro.2003.07.007. [DOI] [PubMed] [Google Scholar]
- 47.Keppel MP, Saucier N, Mah AY, Vogel TP, Cooper MA. Activation-specific metabolic requirements for NK Cell IFN-gamma production. J Immunol. 2015;194:1954–1962. doi: 10.4049/jimmunol.1402099. [DOI] [PMC free article] [PubMed] [Google Scholar]
- 48.Brand A, et al. LDHA-Associated Lactic Acid Production Blunts Tumor Immunosurveillance by T and NK Cells. Cell Metab. 2016;24 doi: 10.1016/j.cmet.2016.08.011. 657671. [DOI] [PubMed] [Google Scholar]
- 49.Kedia-Mehta N, Finlay DK. Competition for nutrients and its role in controlling immune responses. Nat Commun. 2019;10 doi: 10.1038/s41467-019-10015-4. 2123. [DOI] [PMC free article] [PubMed] [Google Scholar]
- 50.Rolf J, et al. AMPKalpha1: a glucose sensor that controls CD8 T-cell memory. Eur J Immunol. 2013;43:889–896. doi: 10.1002/eji.201243008. [DOI] [PMC free article] [PubMed] [Google Scholar]
- 51.Schlenner SM, et al. Fate mapping reveals separate origins of T cells and myeloid lineages in the thymus. Immunity. 2010;32:426–436. doi: 10.1016/j.immuni.2010.03.005. [DOI] [PubMed] [Google Scholar]
- 52.Mack M, et al. Expression and characterization of the chemokine receptors CCR2 and CCR5 in mice. J Immunol. 2001;166:4697–4704. doi: 10.4049/jimmunol.166.7.4697. [DOI] [PubMed] [Google Scholar]
- 53.Wagenblast E, et al. A model of breast cancer heterogeneity reveals vascular mimicry as a driver of metastasis. Nature. 2015;520 doi: 10.1038/nature14403. 358362. [DOI] [PMC free article] [PubMed] [Google Scholar]
- 54.Iwano S, et al. Single-cell bioluminescence imaging of deep tissue in freely moving animals. Science. 2018;359:935–939. doi: 10.1126/science.aaq1067. [DOI] [PubMed] [Google Scholar]
- 55.Lu TX, Rothenberg ME. Bone Marrow Derived Eosinophil Cultures. Bio Protoc. 2014;4 doi: 10.21769/bioprotoc.1161. [DOI] [PMC free article] [PubMed] [Google Scholar]
- 56.Marin-Valencia I, et al. Analysis of tumor metabolism reveals mitochondrial glucose oxidation in genetically diverse human glioblastomas in the mouse brain in vivo. Cell Metab. 2012;15:827–837. doi: 10.1016/j.cmet.2012.05.001. [DOI] [PMC free article] [PubMed] [Google Scholar]
- 57.Takats Z, Wiseman JM, Gologan B, Cooks RG. Mass spectrometry sampling under ambient conditions with desorption electrospray ionization. Science. 2004;306:471–473. doi: 10.1126/science.1104404. [DOI] [PubMed] [Google Scholar]
- 58.Dobin A, et al. STAR: ultrafast universal RNA-seq aligner. Bioinformatics. 2013;29:15–21. doi: 10.1093/bioinformatics/bts635. [DOI] [PMC free article] [PubMed] [Google Scholar]
- 59.Liao Y, Smyth GK, Shi W. featureCounts: an efficient general purpose program for assigning sequence reads to genomic features. Bioinformatics. 2014;30:923–930. doi: 10.1093/bioinformatics/btt656. [DOI] [PubMed] [Google Scholar]
- 60.Love MI, Huber W, Anders S. Moderated estimation of fold change and dispersion for RNA-seq data with DESeq2. Genome Biol. 2014;15:550. doi: 10.1186/s13059-014-0550-8. [DOI] [PMC free article] [PubMed] [Google Scholar]
- 61.Wu H, Wang C, Wu Z. PROPER: comprehensive power evaluation for differential expression using RNA-seq. Bioinformatics. 2015;31:233–241. doi: 10.1093/bioinformatics/btu640. [DOI] [PMC free article] [PubMed] [Google Scholar]
- 62.Lun ATL, et al. EmptyDrops: distinguishing cells from empty droplets in droplet-based single-cell RNA sequencing data. Genome Biol. 2019;20:63. doi: 10.1186/s13059-019-1662-y. [DOI] [PMC free article] [PubMed] [Google Scholar]
- 63.Griffiths JA, Richard AC, Bach K, Lun ATL, Marioni JC. Detection and removal of barcode swapping in single-cell RNA-seq data. Nat Commun. 2018;9 doi: 10.1038/s41467-018-05083-x. 2667. [DOI] [PMC free article] [PubMed] [Google Scholar]
- 64.Lun AT, McCarthy DJ, Marioni JC. A step-by-step workflow for low-level analysis of single-cell RNA-seq data with Bioconductor. F1000Res. 2016;5:2122. doi: 10.12688/f1000research.9501.1. [DOI] [PMC free article] [PubMed] [Google Scholar]
- 65.McCarthy DJ, Campbell KR, Lun AT, Wills QF. Scater: pre-processing, quality control, normalization and visualization of single-cell RNA-seq data in R. Bioinformatics. 2017;33:1179–1186. doi: 10.1093/bioinformatics/btw777. [DOI] [PMC free article] [PubMed] [Google Scholar]
- 66.Lun AT, Bach K, Marioni JC. Pooling across cells to normalize single-cell RNA sequencing data with many zero counts. Genome Biol. 2016;17:75. doi: 10.1186/s13059-016-0947-7. [DOI] [PMC free article] [PubMed] [Google Scholar]
- 67.Heng TS, Painter MW, Immunological Genome Project C The Immunological Genome Project: networks of gene expression in immune cells. Nat Immunol. 2008;9:1091–1094. doi: 10.1038/ni1008-1091. [DOI] [PubMed] [Google Scholar]
- 68.Holtzman MJ, Byers DE, Alexander-Brett J, Wang X. The role of airway epithelial cells and innate immune cells in chronic respiratory disease. Nat Rev Immunol. 2014;14:686–698. doi: 10.1038/nri3739. [DOI] [PMC free article] [PubMed] [Google Scholar]
- 69.Misharin AV, Morales-Nebreda L, Mutlu GM, Budinger GR, Perlman H. Flow cytometric analysis of macrophages and dendritic cell subsets in the mouse lung. Am J Respir Cell Mol Biol. 2013;49:503–510. doi: 10.1165/rcmb.2013-0086MA. [DOI] [PMC free article] [PubMed] [Google Scholar]
- 70.Crinier A, et al. High-Dimensional Single-Cell Analysis Identifies Organ-Specific Signatures and Conserved NK Cell Subsets in Humans and Mice. Immunity. 2018;49:971–986 e975. doi: 10.1016/j.immuni.2018.09.009. [DOI] [PMC free article] [PubMed] [Google Scholar]
- 71.Stuart T, et al. Comprehensive Integration of Single-Cell Data. Cell. 2019;177:1888–1902 e1821. doi: 10.1016/j.cell.2019.05.031. [DOI] [PMC free article] [PubMed] [Google Scholar]
- 72.Lun AT, Chen Y, Smyth GK. It's DE-licious: A Recipe for Differential Expression Analyses of RNA-seq Experiments Using Quasi-Likelihood Methods in edgeR. Methods Mol Biol. 2016;1418:391–416. doi: 10.1007/978-1-4939-3578-9_19. [DOI] [PubMed] [Google Scholar]
- 73.McCarthy DJ, Chen Y, Smyth GK. Differential expression analysis of multifactor RNA-Seq experiments with respect to biological variation. Nucleic Acids Res. 2012;40:4288–4297. doi: 10.1093/nar/gks042. [DOI] [PMC free article] [PubMed] [Google Scholar]
Associated Data
This section collects any data citations, data availability statements, or supplementary materials included in this article.
Data Availability Statement
Transcriptomic data used in Fig. 6 and Extended Data Fig. 7 are available at the Sequence Read Archive (SRA) under the Bioproject PRJNA637311 : Lung NK cell transcriptomic. Bulk RNAseq data are available with the following BioSample accession numbers: SAMN15099850 (bulk PBS vs IL33) and the following sample names are A1, D1, B2, C2, F2, E1 and H1 for the PBS-treated condition and D2, B1, F1, E2, A2 and G1 for IL33-treated condition; SAMN15099866 (time-course) with the following triplicate sample names E4, A4, C3 (WT PBS day 3), H3, F4, D3 (WT IL33 day 3), C4, G4, A3 (WT IL33 day 7), B4, E3, G3 (WT IL33 day 14) and D4, F3, B3 (IL2KO IL33 day 3).


