Abstract
Influenza A virus causes millions of severe illnesses during annual epidemics. The most abundant protein in influenza virions is the matrix protein M1 that mediates virus assembly by forming an endoskeleton beneath the virus membrane1. The structure of full-length M1, and how it oligomerizes to mediate assembly of virions, is unknown. Here we have determined the complete structure of assembled M1 within intact virus particles, as well as the structure of M1 oligomers reconstituted in vitro. We found that the C-terminal domain of M1 is disordered in solution, but can fold and bind in trans to the N-terminal domain of another M1 monomer, thus polymerising M1 into linear strands which coat the interior surface of the assembling virion membrane. In the M1 polymer, five histidine residues, contributed by three different M1 monomers, form a cluster that can serve as the pH-sensitive disassembly switch after entry into a target cell. These structures therefore provide mechanisms for influenza virus assembly and disassembly.
The influenza A virus (IAV) genome segments and associated proteins are protected by a lipid envelope derived from the host cell membrane. The exterior of the envelope is densely decorated by the membrane-anchored glycoproteins haemagglutinin (HA) and neuraminidase (NA), while the matrix protein 1 (M1) is tightly associated with the inner surface of the viral membrane 1. M1 interacts with viral ribonucleoproteins (vRNPs) 2,3 and the cytoplasmic tails of the viral glycoproteins HA and NA 1,4,5 to promote their incorporation into virions. Influenza virions are pleomorphic, producing filamentous and spherical virions 6,7. Classical electron microscopy (EM) suggests that M1 forms a helical arrangement of fibers in both filamentous 8,9 and spherical virions 10. After uptake into a target cell, pH-induced structural changes in M1 are thought to contribute to virus entry and disassembly 11.
The 252-residue long, 28 kDa M1 protein consists of an N- and C-terminal domain (NTD and CTD). The structure of the NTD has been determined by crystallography, revealing a globular fold of 9 α helices and a highly charged surface 12–14. There are no structures available for the CTD of M1. A structure of the full-length matrix protein is available from an orthomyxovirus Infectious Salmon Anemia Virus (ISAV), however substantial divergence (18% sequence identity) between ISAV and IAV matrix proteins makes it unclear how relevant the ISAV matrix protein structure is to IAV 15.
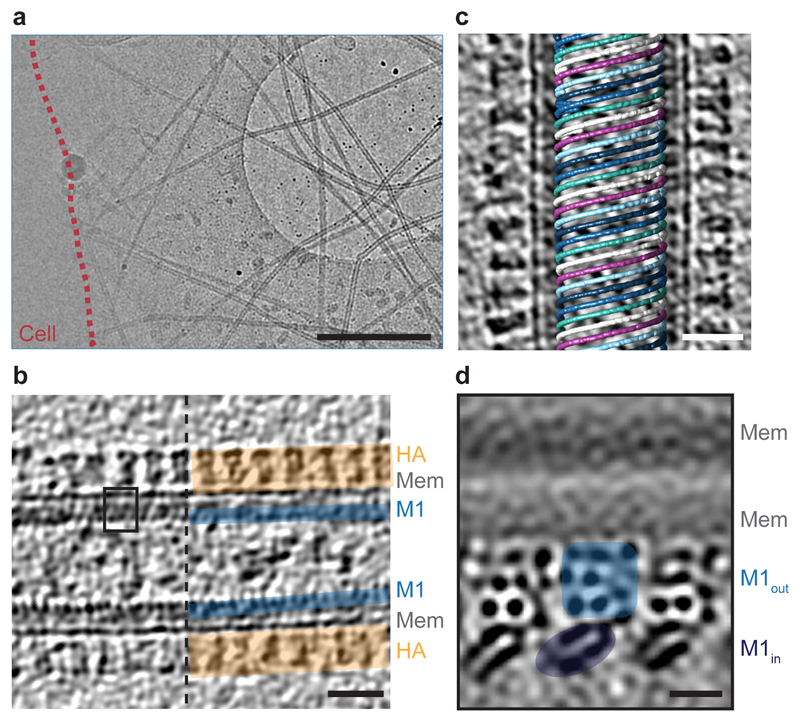
To avoid purification artefacts 16 we performed cryo-electron tomography (cryo-ET) on influenza A/Hong Kong/1/1968 (H3N2) (HK68) virions directly budding from infected cells 17. We observed filamentous virus particles radiating from infected cells as well as isolated filamentous virions (Fig. 1a). A dense glycoprotein layer can be seen on the outer surface of the virus envelope, and a thin M1 layer directly underneath the viral membrane (Fig. 1b).
Figure 1. Cryo-ET of influenza A/HK68 virions.
a) 2D cryo-EM image of influenza A/HK68 virions surrounding an infected cell (outlined in red). Scale bar 1 µm. b) Central slice through a tomogram of an individual influenza A/HK68 virion. The surface HA layer (orange), the membrane, and the M1 matrix layer (blue) are marked. Scale bar 20 nm. Images in a and b are representative of three independent preparations of virus. c) M1 assembles parallel helical strands, visualized by marking the positions of aligned M1 subtomograms within the original tomogram volumes. A right handed helix with 6 parallel M1 strands is shown. Scale bar 20 nm. d) Projection through 1.8 nm of three parallel strands of the M1 structure determined by subtomogram averaging. The membrane bilayer and the outer and the inner lobes of the M1 reconstruction are marked. Dark densities correspond to slices through protein α helices. The size and orientation of the view correspond to the black square in b). Scale bar 2 nm.
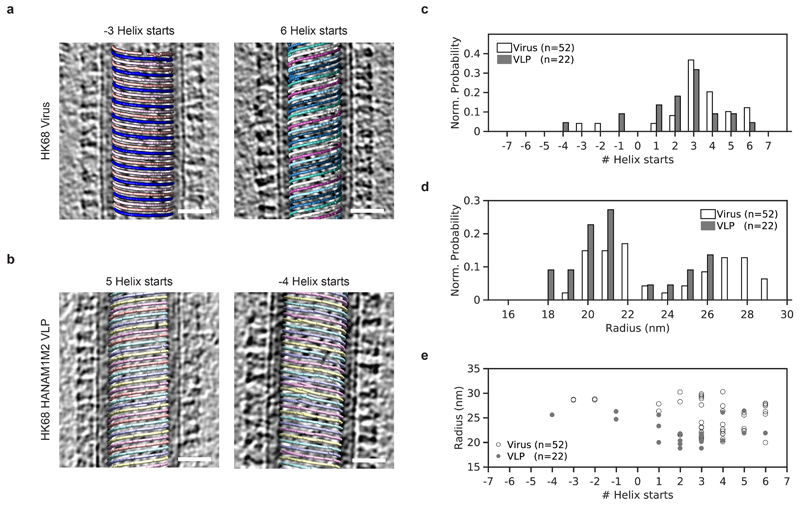
We performed reference-free subtomogram averaging for the M1 density layer from each virion individually. We found that M1 forms tightly packed, linear polymers that assemble a helical array (Fig 1c). The spacing between strands, ~ 3.6 nm, is similar to those observed in classical EM experiments 8–10,18. The diameter of the virions, and the number of parallel polymer strands, both vary (1-6 strands at a radius from 18 – 29 nm, Extended Data Fig. 1). M1 subtomograms from virions with three strands were combined into a larger data set. The resulting reconstruction of M1 in situ shows the inner and outer leaflet of the membrane bilayer with a two-lobed protein layer bound tightly to its inner surface (Fig. 1d, Extended Data Fig. 2a-c).
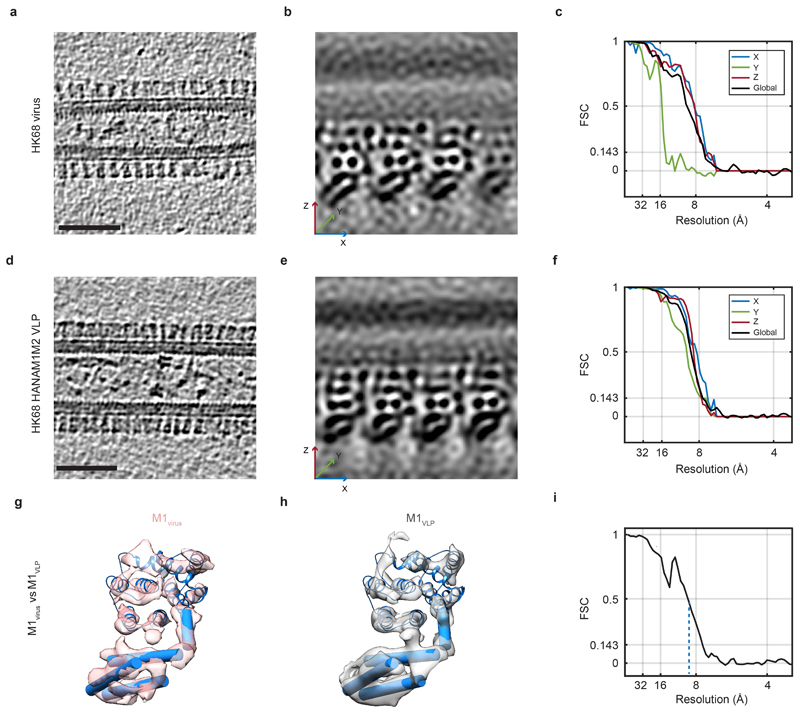
Co-expression of M1 together with either HA or NA is sufficient to form filamentous protrusions, which in the presence of matrix protein 2 (M2) are released as particles that closely resemble virions 19. We next co-expressed the IAV HK68 proteins HA, NA, M1 and M2 to form virus-like particles (VLPs) 19 and imaged them as described above for virions. VLPs were essentially indistinguishable from viral filaments (Extended Data Fig. 2a,d). We determined the structure of the M1 layer from the VLPs (Extended Data Fig. 2d-f) finding it to be identical to that obtained from virions (Extended Data Fig. 2g-i). Due to its more isotropic resolution (Extended Data Fig. 2f), we used the M1 reconstruction obtained from VLPs for further interpretation.
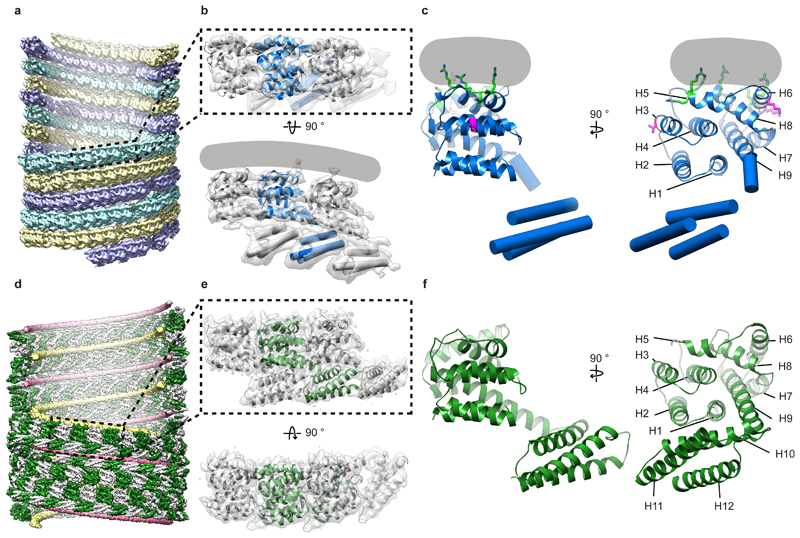
At the resolution obtained (~8 Å), α helices within individual M1 monomers were clearly observed. The crystal structure of the M1 NTD monomer determined at pH 7 (PDB:1EA3 13), a pH most similar to the interior of flu virions, could be fitted as a rigid-body into the membrane proximal lobe of our structure; all nine α helices of the M1 NTD monomers are accommodated by the density (Fig. 2a,b). Previous biochemical studies have suggested that the M1 NTD interacts with negatively charged phospholipids via electrostatic interactions 13,20. Consistent with these observations, in our structure the interaction between M1 and the membrane is mediated by a positively charged surface formed by helices 5, 6 and 8 (Fig. 2c, green residues).
Figure 2. Structure and assembly of influenza M1.
a) Arrangement of M1 within influenza A/HK68 HANAM1M2 VLPs visualized by placing the M1 monomer structure at orientations and positions determined by subtomogram averaging. Three parallel strands which are coloured differently. Some monomers have been removed to reveal the inside of the filament. b) The structure of three neighboring M1 monomers in a strand determined by subtomogram averaging (grey surface), fitted with a crystal structure of the M1 NTD (PDB:1EA3 13) and a secondary-structure model for the M1 CTD. The grey line indicates the position of the membrane. c) The model of an individual M1 monomer. Helix (H) numbers are indicated. Positively charged residues making membrane interactions are green (residues 76-78 in H5, 101 and 104 in H6, 134 in H8). Residues at the inter-strand interface where mutation alters virion morphology are magenta (residue 41 in H3, 95 and 102 in H6). d) Arrangement of M1 (green and white) within helical assemblies of M1 assembly in vitro. Nucleic acid strands are shown in yellow and pink. e) Three neighboring M1 monomers extracted from the full reconstruction (grey isosurface), fitted with the atomic model built based on this density. f) The model of an individual monomer.
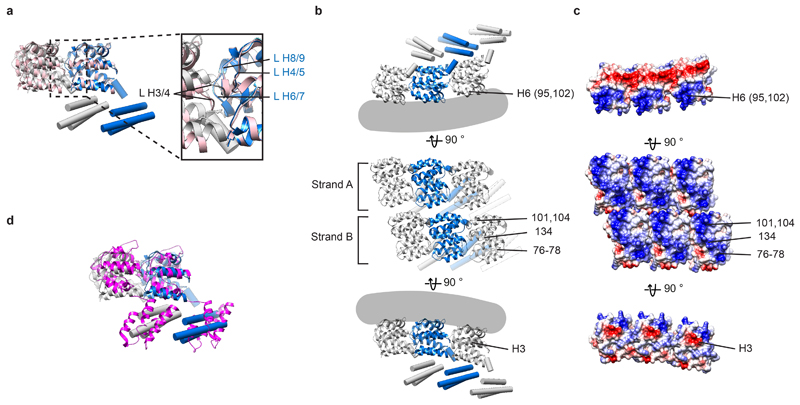
Fitting multiple copies of the M1 NTD structure reveals that M1 polymerizes into parallel linear strands, packed tightly together (Fig. 2a). Within the strands, loops between NTD helices form an interface similar to the crystal packing in the M1 NTD crystal obtained at neutral pH (PDB:1EA3 13) (Extended Data Fig. 3a). Each M1 NTD appears in close proximity to two monomers on each adjacent strand (Extended Data Fig. 3b, middle). Positively charged residues from helix 6 face negatively charged residues in the parallel strand, predominantly in helix 3 (Extended Data Fig. 3b,c). The interface between monomers from adjacent strands is small (~360 Å2), suggesting a weak interaction that may allow strands to slide relative to each other. Several mutations or variations altering virion morphology 21–23 are located at the M1 NTD-NTD inter-strand interface (Fig. 2c, magenta residues), suggesting that strand packing may modulate virion morphology.
The density for helix 9 extends beyond the crystallized helix 9, protruding downwards into the inner lobe density which corresponds to the M1 CTD (Fig. 2b,c). The CTD contains 3 cylindrical densities suggesting that it folds into a 3-helix globular domain, and its orientation suggests formation of a trans interface in which it interacts with the membrane-distal surface of the NTD from the neighboring M1 monomer in the linear polymer (Fig. 2b). A trans-interface between NTD and CTD is present within the crystal packing of the ISAV matrix protein (Extended Data Fig. 3d) 15.
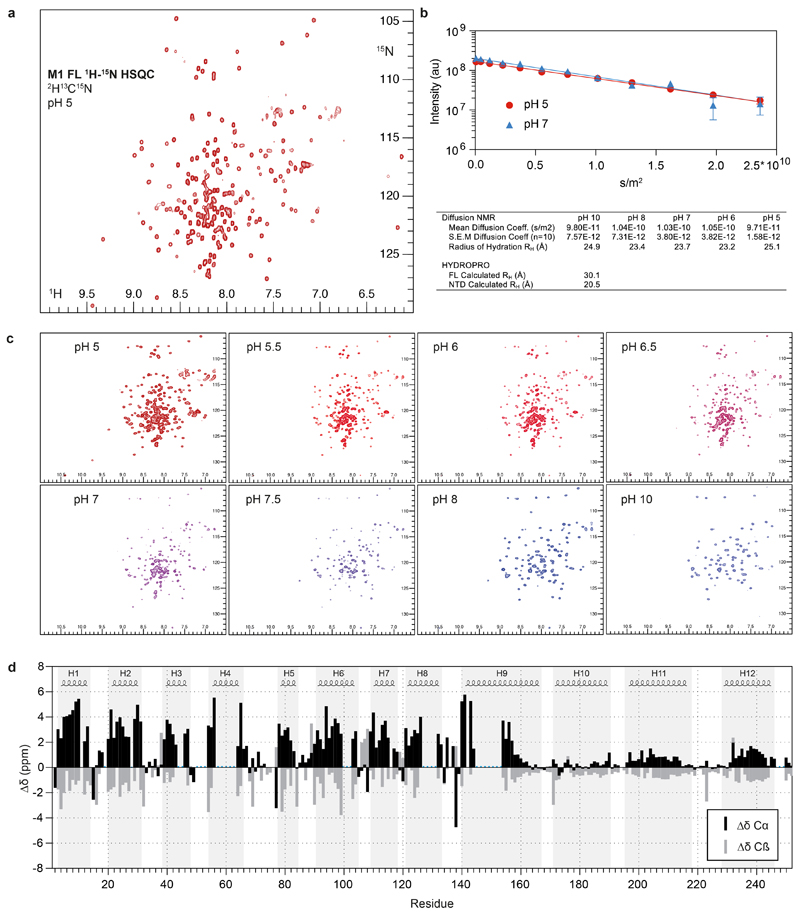
In order to obtain a higher resolution structure of M1, we expressed and purified recombinant full length M1. We characterized the purified protein by NMR (Extended Data Fig. 4a), and found that it is monomeric in solution at neutral pH with a radius of hydration (RH) of ~25 Å (Extended Data Fig. 4b). The NTD adopts the same nine-helix fold as present in previously determined crystal structures 12–14. The CTD, in contrast, is largely disordered, consistent with previous observations 24 and does not adopt detectable tertiary structure when pH is increased (Extended Data Fig. 4c). We identified three stretches with some helical propensity, corresponding to residues 171-190 (helix 10), 196-218 (helix 11) and 231-246 (helix 12) (Extended Data Fig. 4d).
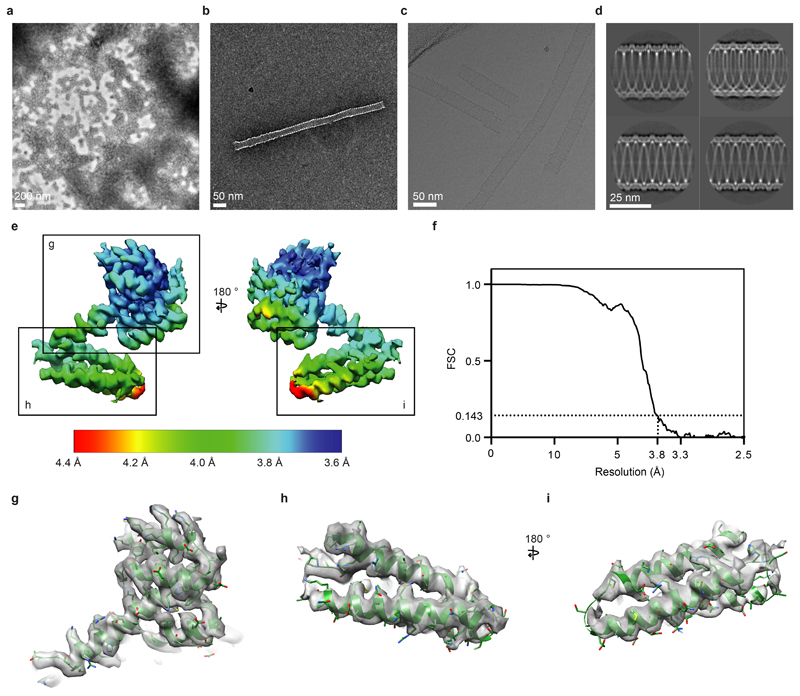
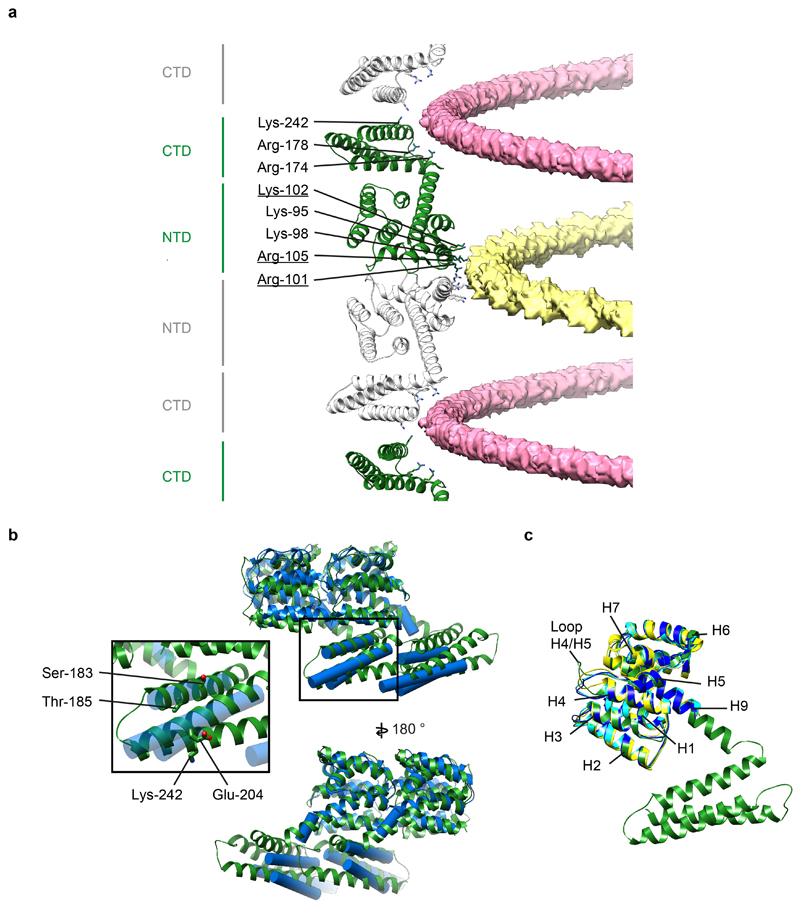
We assembled purified M1 into helical tubes in the presence of nucleic acid and imaged them by cryo-electron microscopy (cryo-EM) (Extended Data Fig. 5 a-d) - similar coiled structures have been observed in flu virions with disrupted M1 layers 18. We reconstructed a map at 3.8 Å resolution, resolving both the NTD and CTD (Extended Data Fig. 5e-i). The helix exhibits a pitch of 100.0 Å with 32.4 M1 dimers in each helical turn (Fig. 2d). M1 dimerizes via its NTD membrane-binding surface giving rise to two antiparallel linear polymer strands, introducing a D1 symmetry and making the helix apolar. Two nucleic acid filaments are found inside the helix, one at the NTD-NTD dimerization interface (Fig. 2d, yellow strand) and the other in a groove formed at the CTD-CTD interface (Fig. 2d, pink strand) – both appear to be nonspecifically bound and only unfeatured density was observed (Extended Data Fig. 6a). The 3.8 Å resolution density map allowed building of an atomic model for the full-length M1 protein (Fig. 2e,f, Fig. 3, Extended Data Fig. 5 g-i).
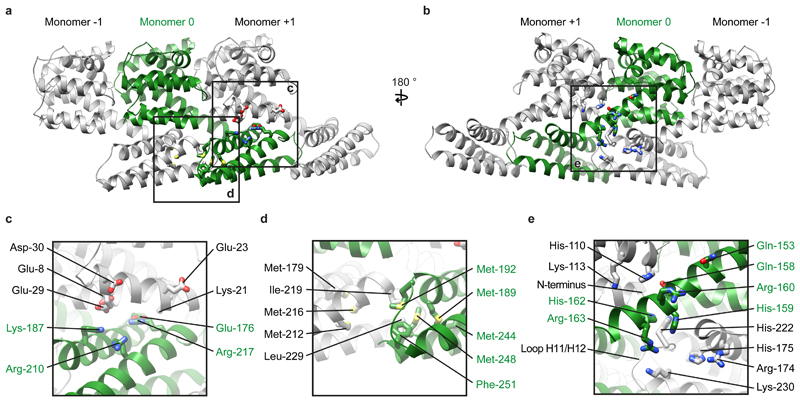
Figure 3. Interactions mediating assembly of M1.
a) Three neighboring M1 monomers from an M1 strand viewed as in Fig. 2e. b) A 180º rotated view of a). In a) and b), residues involved in monomer polymerization are shown in stick representation. Boxes indicate regions magnified in c)-d). c) Charged residues mediate interactions between the CTD of monomer 0 (green) and the NTD of monomer +1. d) Hydrophobic residues mediate interactions between neighboring CTDs. e) A histidine-rich, positively-charged cluster is formed at the interface of three M1 monomers.
The linear M1 strand from the in vitro helical assembly curves in a direction orthogonal to that of the M1 strand from the virus, and with opposite handedness. The structure and arrangement of M1 within the linear M1 strands is, however, very similar (Fig. 2, Extended Data Fig. 6b). In both cases the same surfaces of the NTD mediate polymerization, placing the C terminus in the same trans-interacting position. We therefore interpret the in vitro assembly as a higher-resolution model for the structure and arrangement of M1 strands within the virion.
The structure of the NTD is essentially identical to that of N-terminal fragment structures previously determined by X-ray crystallography (PDB:1AA7 12, PDB:1EA3 13, PDB:5V6G 25) with the exception of the helix4/5 loop which adopts a different conformation (Extended Data Fig. 6c).
The last helix in the NTD, helix 9, extends by three helical turns beyond the crystal structure, before proline-171 bends the peptide chain backwards to form the CTD. The CTD is composed of 82 residues organized into 3 helices (Fig. 3) found at the positions where helical propensity was highest in the NMR experiments (Extended Data Fig. 4). The extension of helix 9 positions the CTD below the membrane distal surface of the neighboring NTD, as in the viral structure, where it forms a tight interaction (Fig. 3a-c). The NTD-CTD interface appears to be stabilized by charge complementarity between the negatively charged membrane-distal surface of the NTD (residues Glu-8, Glu-23, Glu-29, Asp-30), and the positively charged interacting surface of the CTD (residues Lys-187, Arg-210, Arg-217), as well as by an inter-molecular salt bridge between Lys-21 and Glu-176 (Fig. 3c).
The three-helix bundle of the CTD is stabilized by two methionine-rich hydrophobic cores, one containing Met-189, Met-192, Met-244, Met-248 and the other containing Met-179, Met-212, Met-216 (Fig. 3d). The two hydrophobic cores from neighboring monomers in the strand interact with one another via a hydrophobic interface including Ile-219, Leu-229 of one monomer, and Met-192, Met-248, Phe-251 of the neighboring monomer (Fig. 3d).
Overall, linear polymerization of full-length M1 by trans-interactions between the NTD and the neighboring CTD buries a surface area of 2137 A2 per monomer, compared to 776 A2 contributed by the NTD (1-158) alone. These extra interfaces contribute considerable energy to promote M1 polymerization, membrane bending 26 and virion filament extension.
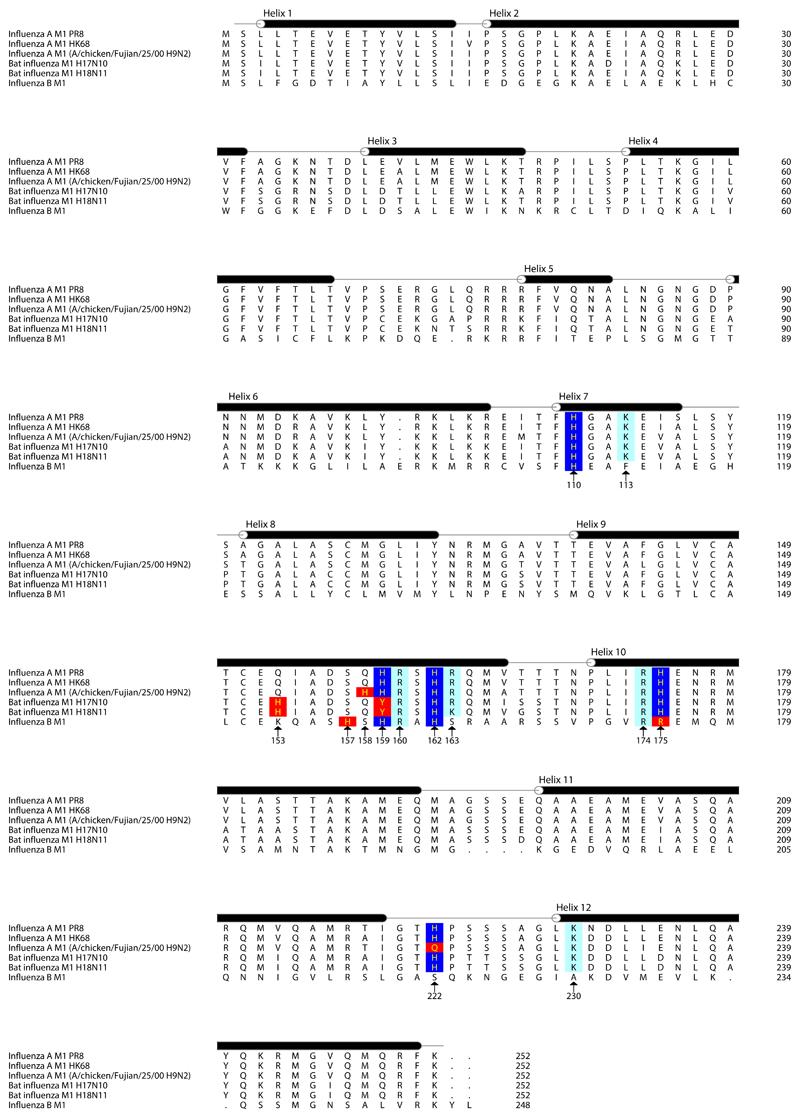
The helix 9 extension interacts with neighboring M1 monomers in both the +1 and -1 positions (Fig. 3a,b,e). Directly adjacent to the helix 9 extension we resolve an interaction between the N terminus of the +1 M1, and the loop between helices 11 and 12 of the -1 M1 (Fig. 3e): there are therefore direct interactions between three M1 monomers centred around the helix 9 extension. All three monomers contribute to form a highly positively charged amino acid cluster of 5 arginine or lysine residues and 5 histidine residues. The helix 9 extension of the central monomer contributes His-159, Arg-160, His-162, and Arg-163; helix 7 in the NTD of the +1 M1 monomer contributes His-110 and Lys-113; the CTD of the -1 M1 monomer contributes residues Arg-174, His-175, His-222, and Lys-230 (Fig. 3e). A sequence analysis of M1 reveals that this cluster is highly conserved suggesting this feature is important for the influenza lifecycle. Indeed four of the five histidines are strictly conserved in IAV (Extended Data Fig. 7), and while His-222 to glutamine substitutions are found in certain H9N2 viruses and His-159 to tyrosine in some bat derived H17N10 and H18N11 sequences, they are compensated by substitution of Gln-158 to His, and Gln-153 to His, respectively (Fig. 3e, Extended Data Fig. 7). Histidine can function as a pH sensor and histidine clusters regulate structural changes in response to low pH in diverse viruses 27,28. The M1 layer disintegrates and dissociates from the membrane when influenza virions are exposed to low pH 11,29,30. Protonation of the five histidines in this cluster would introduce additional positive charges, providing a mechanism to trigger destabilization and disassembly of the M1 layer in the endosome.
Our observations show that IAV M1 polymerizes into parallel linear strands which assemble helical arrays to form the viral endoskeleton. Polymerization is associated with extension of helix 9 and transition of the CTD from an unfolded to folded state, upon which it interacts with the NTD of the neighboring M1 molecule in the strand. This arrangement implies that virus assembly will be processive – binding of M1 into the filament induces conformational changes that create new interfaces promoting binding of the next monomer. Assembly buries a large surface area, providing an energy source to drive assembly and protrusion of the virion. Once assembled, five histidines that are distant in sequence and contributed by three sequential M1 monomers in the filament come together to form a histidine cluster that can serve as the trigger for pH-mediated M1 disassembly.
Methods
Cell lines
Human embryonic kidney 293-T (HEK293T) and Madin-Darby canine kidney (MDCK) cells were cultured in cell culture medium: Dulbecco’s modified Eagle medium (DMEM) Glutamax (Gibco) supplemented with 10% Fetal Bovine Serum (FBS) and 1% penicillin/streptavidin (PS). HEK293T cells are known as commonly misidentified cell lines. In this study HEK293T cells were used as they are a well-established tool for the expression of influenza VLPs: the cells themselves were not studied.
Preparation of HK68 virus samples
Initial virus stocks of A/Hong Kong/1/1968 (H3N2) (HK68) influenza A virus (IAV) generated by reverse genetics as described in 31 were amplified in MDCK cells 32. All experiments with HK68 virus were carried out under BSL-2 conditions. In preparation for cell seeding, QF AU-200 mesh R2/2 grids (Quantifoil) were glow-discharged and placed into a 6-well tissue culture plate well containing 2 mL of cell culture medium for at least 1 h before cell seeding. 150,000 MDCK cells diluted in cell culture medium were seeded per well and incubated at 37°C 5% CO2, 100% humidity for 12 h to 24 h until cells were adhered to EM grids. Wells were washed with 0.3% BSA in DMEM before inoculation with diluted virus at a multiplicity of infection (MOI) of 1. Cells were incubated with virus for 1 h, gently shaking every 15 min. After 1 h, the inoculum was removed and replaced with 0.3% BSA/DMEM containing 0.5 μg/ml to 5 μg/ml TPCK-treated trypsin, depending on trypsin activity. Infection was stopped when cytopathic effect (CPE) was visible by light microscopy, typically 24 h to 48 h post infection. Grids were removed from cell culture medium, and 5 μL of 1:3 diluted 10 nm colloidal gold in PBS was added to each grids prior to plunge-freezing by back-side blotting using a LeicaGP cryo plunger (Leica).
Preparation of HK68 HANAM1M2 VLP samples
The sequences of HK68 HA, HK68 NA, HK68 M1 and HK68 M2, cloned into pCAGGS expression vectors as previously described in 19, were used for the production of HK68 VLP samples. VLP samples were prepared equivalently to HK68 virus samples. 300,000 HEK293-T cells were seeded per well with grids present inside the well. When cells were adhered to EM grids, typically 12-24 h post seeding, cells were co-transfected with the four plasmids in the ratio 1:1:2:0.5 for HA, NA, M1, M2, using the transfection reagent FUGENE (Promega) according to the manufacturer’s protocol. 48 h post-transfection, grids were removed from cell culture medium and plunge-frozen as described above.
Cryo-electron tomography
Collection of cryo-ET data was performed as described previously 33. Tilt series were acquired on a Titan Krios (Thermo Fisher, formerly FEI) operated at 300 kV equipped with a Gatan Quantum 967 LS energy filter using a 20 eV slit in zero-loss mode. Images were recorded on a Gatan K2-Summit direct electron detector with a pixel size of 1.78 Å or 1.7 Å at the specimen level. Tomograms were acquired from –60° to 60° with 3° increment and a dose-symmetric tilt-scheme 34 using SerialEM-3.49 35, with defoci between -2 μm and -6 μm, 20 Frames were aligned using the alignframes function in the IMOD 4.10 software package 36. If data were collected in super resolution mode, frames were Fourier cropped to 4K x 4K pixel images. The contrast transfer functions (CTF) for each tilt image was determined on non-exposure filtered tilt stacks using CTFFIND4 37 and evaluated for each image. Tilt images were exposure filtered according to the accumulated dose applied to the sample for each tilt as described in 38 using Matlab (MathWorks) or the dose weight filtering options in alignframes function in IMOD 4.10. Tilt series were aligned in etomo/IMOD using gold fiducials. Tomograms with less than three trackable fiducials were discarded. Tilt images were CTF-multiplied and reconstructed by weighted back-projection using NovaCTF 39. Tomograms were subsequently isotropically binned by a factor of two and by a factor of four (referred to as Bin2 and Bin4 tomograms in the following). Detailed imaging parameters per dataset are summarized in Extended Data Table 1. Tomograms were visualized either in IMOD or UCSF Chimera 1.13.1 40.
Subtomogram averaging
Tomograms which were acquired at an underfocus range from 1 µm to 4 µm were used for subtomogram averaging. Data from HK68 virus tomograms and HK68 HANAM1M2 VLP tomograms were processed using essentially the same strategy.
Subtomogram averaging was performed using scripts in Matlab (Mathworks) based on functions from the AV3 41, TOM 42 and Dynamo 43 software packages. To determine initial positions and orientations for subtomogram extraction, the central axis of each virus/VLP filament was marked in Bin4 tomograms using the Volume Tracer function in UCSF Chimera and fitted with a spline function. A tubular grid of points was generated at the radial position of the matrix layer, centered on this spline, with a grid spacing of 2 Bin4 pixels (approximately 1.5 nm). This generated 20,000 - 35,000 positions per filament. Overlapping cubic subtomograms with box size 64 pixels (46 nm) were extracted at these grid positions. Initial Euler angles were assigned based on the orientation of the normal vectors relative to the tube surface at each grid position. For HK68 virus data, subtomograms were split into two independent data half sets, based on their location in either the upper or the lower part of each filament, prior to starting any subtomogram averaging or alignment.
Subtomograms for each filament were averaged to generate starting references, and then iteratively, rotationally and translationally aligned and averaged at Bin4, and then at Bin2 (in 96 pixel boxes) to generate low resolution structures of the M1 layer for each filament. Structures from individual filaments differed in radius, number of helix starts, and radius (Extended Data Fig. 1). M1 subtomograms extracted from 4 filaments with the same parameters (3-start, right-handed M1 layers) were combined. For VLP data, subtomograms were divided into two half sets, based on location in either the upper or the lower part of each filament, after assignment of helix start number, and further processing was performed independently for the two half sets. Subtomograms were re-extracted at Bin1 (in 120 pixel boxes) and final iterations of alignment were performed applying a bandpass filter from 8 Å to 35 Å. The NTD and CTD layers were subsequently refined independently using the final alignment parameters and masks which focused on the respective layer.
For HK68 virus data the missing wedge was modelled at all processing stages as the sum of the amplitude spectra of subtomograms extracted from regions of each tomogram containing empty ice, and was applied during alignment and averaging. For VLP data, this wedge was applied from Bin1, a binary wedge was used at earlier alignment stages.
For each of the refined layers, we assessed the regularity of the local packing and the quality of alignment by plotting the distribution of positions of all neighboring subtomograms for each M1 position in a so-called ‘neighbor plot’ as described in 44. The peaks corresponding to the positions of neighbors in the helical lattice were elliptical and extended along the tube surface, perpendicular to the tube axis (the Y-direction). This observation suggests either higher variability in the position of neighbors in this direction, or lower accuracy of alignment in this direction. We selected the subsets of M1 monomers where at least three neighboring M1 monomers were found within defined spheres centered on the peak neighbor position. This step reduced resolution anisotropy while retaining ~50% of subtomograms. The cleaned, refined maps of the NTD and CTD layers were then recombined into the final structure (Fig. 1, Extended Data Fig. 2). Density maps were visualized either in IMOD or UCSF Chimera.
Directional resolution measurements
Anisotropy in resolution was assessed by calculating the Fourier shell correlation (FSC) within cones of 40° using 3DFSC 45. Local and global resolution measurements and the determination of a global B-factor were performed in RELION by FSC between the two independent half-datasets within a smooth-edged mask including the M1 layer. Final structures were sharpened using the determined B-factor and filtered according to the determined global resolution 46.
Structure fitting and modelling based on the M1 in situ structure
The crystal structure of the M1-NTD determined at neutral pH, (PDB:1EA3) 13 was fitted as a rigid body into the subtomogram averaging structure using the fit in map functionality in UCSF chimera. The lengths of CTD α-helix-like densities were measured in UCSF Chimera and cylinders of the measured length were placed into the density to illustrate the secondary structure of the M1 CTD.
Expression and purification of M1 for NMR measurements
For NMR, Escherichia coli Rosetta 2 (DE3) bacteria (Merck millipore) transformed with the pET21b (Merck millipore) vector carrying the coding sequence of wildtype PR8 M1 were grown in 99.9% 2H20 (cortecnet) M9 medium, containing 5.4g/L Na2HPO4 (anhydrous), 2.7g/L KH2PO4 (anhydrous), 0.45g/L NaCl, 1.5 g/L yeast nitrogen base (YNB) (Sigma-Aldrich Cat # Y1251), 3.5 g/L 13C,2H D-Glucose (Sigma-Aldrich Cat # 552151) and 1g/L 15NH4Cl (Sigma-Aldrich Cat # 299251). Prior to large-scale expression cells were adapted for growth in deuterated media on M9 medium agar plates (1.5% w/v) containing 10, 44 and 78% 2H2O.
The isotopically labelled M1 protein was purified as stated below for in vitro assembly of M1 helical tubes, in citrate buffer (50 mM citrate pH 5, 50 mM NaCl) and subjected to additional cation exchange chromatography using a HiTrap SP HP column (GE lifesciences) to remove unbound bacterial DNA. The eluted M1 protein was buffer exchanged into 50 mM citrate buffer (50 mM citrate pH 5, 50 mM NaCl), concentrated to 2 mg/mL (~150 µM) and 5% 2H2O, 0.02% NaN3 (Sigma Aldrich) and 0.25 mM 4,4-dimethyl-4-silapentane-1-sulfonic acid (DSS) were added.
NMR
All NMR experiments on PR8 M1 were carried out at 25°C on a Bruker Avance II+ 700 MHz spectrometer equipped with a triple resonance TCI cryo probe. From 1D experiments the sidechain deuteration level was estimated to be above 90%. For the backbone chemical shift assignment, we recorded non-linear sampled TROSY 47 versions of 1H-15N HSQC (full sampling), HNCO, HNcaCO, HNCA, HNcoCA, HNCACB, HNcoCACB, CCcoNH and hNcocaNNH spectra. The spectra were processed and/or reconstructed using either nmrPipe 48, TOPSPIN 4.0.8 or compressed sensing implemented in qMDD (mddnmr) 49. Backbone resonance assignments were performed using ccpnmr 50. Cα, Cβ and C’ secondary chemical shifts were calculated using random coil chemical shifts provided by 51. Extended Data Figure 4 was prepared using Graphpad Prism 8.
The pH titration was performed on a non-deuterated sample. We recorded 1H-15N HSQCs, and X-STE diffusion experiments at pH points 5, 5.5, 6, 6.5, 7, 7.5, 8, 9 and 10.
15N-edited 1H heteronuclear stimulated-echo longitudinal encode-decode diffusion experiments (X-STE) incorporating bipolar pulse paired gradients 52 were used to measure diffusion coefficients of exclusively 15N-labelled species, using a diffusion delay ∂ of 100 ms and 2*2ms gradient pairs δ for encoding and decoding respectively. Peak intensities Io, Ij at multiple gradient strengths (5-85% of the maximum allowed gradient strength) were integrated and the diffusion coefficient was calculated using Stejskal-Tanner equation, where I0 corresponds to the peak intensity observed at the weakest gradient strength and Ij the peak intensity at a given gradient strength G in Gauss*cm-1, with tau corresponding to the gradient recovery delay and γ is the 1H gyromagnetic ratio:
The hydrodynamic radius was calculated according to the Stokes-Einstein equation Rh = kT / (6πηD) where k is the Boltzmann constant, T the absolute temperature and η the solvent viscosity. Theoretical radii of hydration were calculated in HYDROPRO (version 10) 53 based on the PDB files of the isolated NTD and the full-length protein.
Protein production and in vitro assembly of M1 helical tubes
Full-length A/Puerto Rico/8/1934 (H1N1) (PR8) M1 cDNA with Arg-134 to lysine substitution was cloned into pET21b resulting in a C-terminal extension LEHHHHHH. The Arg-134 to lysine substitution, which also occurs naturally in M1, was found to improve sample homogeneity during tube assembly, perhaps by slowing polymerisation. Protein was expressed by 0.1 M IPTG induction in Rosetta 2 (DE3) cells at 37°C for 3 hours in LB media. Cells were pelleted and lysed in Tris-saline (50 mM Tris-HCl pH 8.0, 150 mM NaCl) in the presence of 0.1% Triton X-100, and 0.1 mg/ml egg-lysozyme. The lysate was layered over a 60% sucrose cushion made in tris-saline and supplemented with 0.1% triton X-100 and centrifuged in a SW-32 rotor for 30 min at 25000 RPM. The insoluble pellet from the centrifugation step was found to contain mostly M1 and negative stain EM show it exists as aggregated tubular structures (Extended Data Fig. 5a). Insoluble M1 pellet was resuspended in citrate-buffer (50 mM citrate pH 4.6, 50 mM NaCl), and after centrifugation at 20000 g for 10 minutes, soluble M1 was located in the supernatant. To assemble M1 into tubes, solubilized M1 was mixed with a purified 6.4 kb size plasmid DNA in a w/w ratio of 1:2.5 and adjusted to an M1 protein concentration of 0.1 mg/ml in glycine-saline (100 mM glycine pH 10, 150 mM NaCl). The tube assembly reaction was carried out at 21°C for 16 hours and checked by negative stain EM (Extended Data Fig. 5b).
In vitro helical tube Cryo-EM sample preparation
C-Flat 2/2-3C grids (Protochips) were glow discharged for 30 seconds at 25 mA, and a 5 ul sample of the tube assembly reaction was applied 3 times to the grid with 30 s incubation and blotting between each sample application. Grids were washed with 5 µl H2O before blotting and plunge-freezing in liquid ethane using an FEI Vitrobot. Grids were stored in liquid nitrogen until imaging. Imaging was performed on an FEI Titan Krios operated at 300kV, equipped with a Gatan K2-summit direct detector using a 20 eV slit width operated in zero-loss mode. 2347 2D images were acquired using SerialEM-3.7.0 35 with a nominal magnification of 105000 X, giving a pixel size of 1.128 Å at the specimen level.
2D Cryo-EM image processing
All super-resolution frames were corrected for gain reference, binned by a factor of 2, motion-corrected and dose-weighted using MOTIONCOR2 54. Aligned, non-dose-weighted micrographs were then used to estimate the contrast transfer function (CTF) using CTFFIND4 37.
Filaments were picked manually, and segments were extracted using a box size of 564 Å and an inter-box distance of 33 Å, obtaining 463152 helical segments. Reference-free 2D classification was carried out in RELION 3.0.8. 55 2D classes with clear structural features were selected resulting in 297,183 helical segments. Analysis of selected 2D class averages using Spring package 56 using segclassexam revealed that tube diameters varied between 315-350 Å. The most abundant classes (those with diameters between 327-329 Å as measured by segclassexam) were selected in RELION resulting in 61058 helical segments. Using one 2D class average with minimal out-of-plane tilt, segclassreconstruct within Spring was used to test possible helical parameters, identifying a pitch of ~100 Å and 27.8, 29.8, 31.8 or 28.2, 30.2, 32.2 subunits per turn. These helical parameters were tested in RELION 3D refinement and 32.2 subunits per turn as an initial helical parameter resulted in a density showing protein features, the refined pitch was 99.8 Å and 32.4 subunit per turn. 3D-classfication using a mask focusing on the central 50% of the M1 helical tube further reduced heterogeneity in diameter – the best 3D class contained 17,984 helical segments and was used for final 3D auto-refinement and Bayesian polishing in RELION 57.
Overall resolution estimates were calculated from Fourier shell correlations at 0.143 criterion between two independently refined half-maps, using phase-randomization to correct for any convolution effects of the generous, soft-edged solvent mask focusing on the central 25% of the helix, that is ~1.4 helical turns. Final reconstructions were sharpened using standard post-processing procedures in RELION, resulting in a B-factor of –115 Å2 (Extended Data Table 2). Helical symmetry was imposed on the post-processed maps using the relion_helix_toolbox 58.
Model building and refinement
The N-terminal fragment crystal structure (PDB:1AA7 12) was fitted into the sharpened 3.8 Å map and residues were manually adjusted, C-terminal domain residues were built manually in Coot-0.9 59. The final model contains residue 2-252, the N-terminal methionine is removed by cellular methionine aminopeptidase while the density for the C-terminal tag is present but poorly defined for model building. Steric clash and sidechain rotamer conformations were improved using the Namdinator web server 60. After further manual adjustment, the structure was refined in PHENIX-1.18.2 61 in the presence of riding hydrogen atoms to good geometry with no Ramachandran outliers, giving an EMRinger 62 score of 3.0. Statistics are given in (Extended Data Table 2).
Sequence Alignment
M1 sequences of the following viruses: Influenza A M1 PR8 (A/Puerto Rico/8/1934 (H1N1)), Influenza A M1 HK68 (A/Hong Kong/1/1968 (H3N2)), Influenza A M1 (A/chicken/Fujian/25/2000 (H9N2)), Bat influenza M1 H17N10 (A/little yellow-shouldered bat/Guatemala/164/2009 (H17N10)), Bat influenza M1 H18N11 (A/flat-faced bat/Peru/033/2010 (H18N11)), Influenza B M1 (B/Lee/1940) were downloaded from UniProt and aligned using mafft 7 (https://mafft.cbrc.jp/alignment/software/).
Extended Data
Extended Data Figure 1. HK68 virions and VLPs have variable numbers of M1 strands and variable radius.
a) Slices through tomograms of two HK68 virus filaments, superimposed with a visualization of M1 subtomogram positions and orientations. Separate M1 strands are shown in different colors. Left: M1 arranged as 3 parallel left-handed helical strands and Right: 6 parallel right-handed helix strands. Scale bars 20 nm. Morphology is representative of three independent preparations of virus. b) As in a) but for HK68 VLP filaments. Morphology is representative of five independent preparations of VLPs. c) Histogram showing the distribution of number of helical strands (# Helix starts) for all HK68 virus (white) and VLP (grey) filaments analyzed. Right-handed helices have positive start numbers, left-handed helices have negative start numbers. d) Histogram showing the distribution of filament radii for all HK68 virus and VLP filaments analyzed. Radii were determined at the position of the M1 NTD. e) A scatter plot of number of helical strands against filament radius for each filament characterized in n=52 virions from one representative preparation of virus and n=22 VLPs from one representative preparation of VLPs.
Extended Data Figure 2. Comparison of HK68 virus and VLP M1 structures, and resolution measurements.
a) Representative orthoslice through a HK68 virus tomogram. Scale bar 50 nm. Morphology is representative of three independent preparations of virus. b) Projection through 1.8 nm of the M1 subtomogram average obtained from HK68 virus data. c) Global FSC curve for the structure of M1 from HK68 virus (black), and analysis of anisotropy by FSC curves in X, Y, and Z directions (blue, green red). d) - f) As in a) - c) for VLP data. Morphology is representative of five independent preparations of VLPs. g) The structure of M1 from HK68 virus derived from subtomogram averaging, shown as a pink isosurface and fitted with the M1 NTD crystal structure. Cylinders represent the secondary structure elements of the M1 CTD. h) As in g) but for the subtomogram averaging structure of M1 from VLPs. We did not observe density that might correspond to the cytoplasmic tail of HA. i) FSC calculated between the virus M1 and VLP M1 structures indicating that the structures are the same up to resolution of 9 Å.
Extended Data Figure 3. Analysis of the M1 structure determined within virions and VLPs.
a) Overlay of the model of M1 subunits as they are arranged in virions and VLPs with two neighboring M1 NTD domains (pink) within the crystal packing in PDB:1EA3 13. Inset highlights the positions of the inter-helix loops (L). b) Model of M1 subunits as they are arranged in virions and VLPs, shown in three different orientations (as in Fig. 2b.) c) Surface charge representation for the NTD in equivalent orientations to those shown in a), colored from negative (red) to positive (blue). Charged residues that form inter-strand interfaces, and their respective helix numbers, are marked in upper and lower panels. Basic residues shown in Fig. 2c and involved in membrane interaction are marked in the middle panel. Mutation of residues 77 and 78 to Alanine reduces M1 incorporation into virions 63. d) Overlay of the M1 model with two neighboring infectious salmon anemia virus (ISAV) matrix proteins (magenta) from the crystal packing in PDB:5WCO 15. The difference in orientation of the CTD could reflect differences in IAV or ISAV virion morphology, but we consider it more likely that it reflects the sequence divergence between ISAV and IAV.
Extended Data Figure 4. NMR analysis of M1.
a) 1H-15N HSQC spectrum of full length M1 at pH 5. The spectrum is representative of three independent sample preparations. b) Representative diffusion curves acquired at pH 5 and 7 and fitted diffusion coefficients and calculated radii of hydration at pH values 5, 6, 7, 8 and 10. Error bars indicate the uncertainties of the intensities of the picked peak using Bruker Dynamics Center 2.6.1. HYDROPRO 53 calculated radii of hydration are listed below for comparison. c) 1H-15N HSQC spectra of full length M1 at different pH values. Increasing pH in absence of DNA and membrane does not induce folding of the CTD. At high pH (>8) only resonances from the first part of the NTD are visible. The protein remains largely monomeric throughout the pH titration. d) Secondary chemical shifts analysis. When compared to random coil, positive Cα and negative Cβ chemical shifts designate α helical secondary structure. α helical segments from the single particle structure are depicted above for comparison. Missing assignment are indicated by blue dots.
Extended Data Figure 5. Electron microscopy of in vitro reconstituted M1 helical tubes.
a) Negative-stain image of aggregated M1 tubes found within the pellet after sucrose cushion centrifugation. b) Negative-stain image of an in vitro assembled M1 tube in the presence of nucleic acid. Images in a and b are representative of at least five independent preparations. c) A typical cryo-EM image of in vitro assembled M1 tubes at 2.7 µm underfocus, representative of three independent preparations. d) Selected class averages with tube diameter between 327-329 Å as determined by segclassexam. The lower left class average has minimal out-of-plane tilt and was used to test possible helical parameters by segclassreconstruct. e) Cryo-EM density of an M1 monomer is shown, the surface is colored by local resolution of the map as determined by RELION. Boxes indicate regions magnified in g)-i). f) Global FSC curve of the final in vitro assembled M1 tube helical reconstruction (Fig. 2d). g-i) Magnified regions of cryo-EM density as indicated in e) and their fitted molecular models.
Extended Data Figure 6. Analysis of the in vitro M1 structure.
a) A view of M1 monomers extracted from the helical reconstruction to show the sites of interaction with the two nucleic acid strands (see also Fig. 2). One nucleic acid strand binds at the NTD-NTD interface (yellow), the other binds to a groove formed at the CTD-CTD interface (pink). Residues interacting with nucleic acid are all positively charged and are shown as sticks. Residues that form part of the nuclear localisation signal which was previously shown to bind the viral ribonucleoprotein 64 are underlined. b) Alignment of in situ (blue) and in vitro (green) M1 dimers extracted from their respective linear polymers. The differences are limited to small movements at the interfaces, perturbations in the orientation of α helix 9 that accommodate the different curvatures, and a small change in the orientation of α helix 12. It is possible that these differences reflect differences between spherical PR8 virions and filamentous HK68 virions, but we think it is more likely that they reflect the different curvature and the presence of nucleic acid in the in vitro sample. Inset highlights selected residues in the CTD. The mutations Ser183Ala and Thr185Ala cause spherical IAV WSN to make more filamentous particles 65. We speculate that these mutations may modulate folding of the CTD. Residue 204 is Glu in filamentous Udorn and HK68, but is Asp in spherical WSN, and the mutation Glu204Asp reduces the number of long filaments 21. This residue is close to the C-terminal end of the neighbouring CTD and we speculate that this difference may influence this interaction. Residue 242 can be sumoylated 66. This residue faces the inside of the virion where sumoylation could be accommodated without altering M1 packing. c) Alignment of the full-length M1 structure determined by helical reconstruction (green) to crystal structures of M1 NTD – PDB:1AA7 (blue) 12, PDB:1EA3 (yellow) 13, and PDB:5V6G (cyan) 14. The structures are the same except for small differences in the H4/H5 loop.
Extended Data Figure 7. Alignment of M1 protein sequences.
M1 sequences of the following viruses: Influenza A M1 PR8 (A/Puerto Rico/8/1934 (H1N1)), Influenza A M1 HK68 (A/Hong Kong/1/1968 (H3N2)), Influenza A M1 (A/chicken/Fujian/25/2000 (H9N2)), Bat influenza M1 H17N10 (A/little yellow-shouldered bat/Guatemala/164/2009 (H17N10)), Bat influenza M1 H18N11 (A/flat-faced bat/Peru/033/2010 (H18N11)), Influenza B M1 (B/Lee/1940) were downloaded from UniProt and aligned using mafft (https://mafft.cbrc.jp/alignment/software/). Locations of α helices 1-12 are marked above the amino-acid sequences. Conserved histidines are shaded blue, conserved charged residues are shaded cyan. Substituted histidine locations and compensatory histidine substitutions are shaded red.
Extended Data Table 1. Data collection and processing parameters for M1 within virions and VLPs.
| Influenza A/HK68 virus | Influenza A/HK68 HANAM1M2 VLP | |||
|---|---|---|---|---|
| Data collection and processing | ||||
| Magnification | 81,000 X | 81,000 X | ||
| Voltage (keV) | 300 | 300 | ||
| Detector | Gatan Quantum K2 | Gatan Quantum K2 | ||
| Energy-filter | Yes | Yes | ||
| Slit width (eV) | 20 | 20 | ||
| Pixel size(Å) | 1.70 | 1.78 | ||
| Defocus range (μm) | 1.5 to 4.5 | 2 to 6 | ||
| Defocus step (μm) | 0.25 | 0.25 | ||
| Tilt range (min/max, step) | -60/60°, 3° | -60/60°, 3° | ||
| Tilt scheme | Dose-symmetrical (Hagen scheme) | Dose-symmetrical (Hagen scheme) | ||
| Total Dose (electrons/Å2) | -130-150 | -120 | ||
| Frame number | 20 | 20 | ||
| Tomograms used for Ml/acquired | 53/105 | 20/60 | ||
| Tomograms/viruses used for final structure | 5 | 4 | ||
| Final subtomograms set A NTD/CTD | 6025/5934 | 6936/7164 | ||
| Final subtomograms set B NTD/CTD | 6149/6147 | 7611/7822 | ||
| Symmetry imposed | none | none | ||
| B-factor | -620 | -665 | ||
| Map resolution isotropy (Å) at 0.143 FSC threshold | 5.8-15 | 6.8-9.8 | ||
| Global resolution (Å) at 0.143 FSC threshold | 7.6 | 8.2 | ||
Extended Data Table 2. Data collection and processing parameters for in vitro helical assembly of M1.
| Ml helical assembly (EMDB-11079) (PDB 6Z5L) | |
|---|---|
| Data collection and processing | |
| Magnification | 105000 |
| Voltage (kV) | 300 |
| Electron exposure (e-/Å2) | 47.1 |
| Defocus range (μm) | 1 to 3 |
| Pixel size(Å) | 1.128 |
| Symmetry imposed | Dl helical |
| Initial particle images (no.) | 463152 |
| Final particle images (no.) | 17984 |
| Map resolution (Å; FSC=0.143) | 3.81 |
| Helical rise (Å) | 3.08 |
| Helical twist (°) | 11.11 |
| Refinement | |
| Initial model used (PDB code) | 1AA7 |
| Model resolution (Å) (FSC=0.5) | 3.90 |
| Map sharpening B factor (Å2) | -115 |
| Model composition | |
| Non-hydrogen atoms | 1937 |
| Protein residues | 251 |
| B factors (Å2) | |
| Protein | 96.4 |
| R.m.s. deviations | |
| Bond lengths (Å) | 0.005 |
| Bond angles (°) | 1.010 |
| Validation | |
| MolProbity score | 1.30 |
| Clashscore | 1.79 |
| Poor rotamers (%) | 0 |
| Ramachandran plot | |
| Favored (%) | 94.78 |
| Allowed (%) | 5.52 |
| Disallowed (%) | 0 |
Supplementary Material
Acknowledgments
We thank Vera Sonntag-Buck, Vojtech Zila, Petr Chlanda, Steffen Klein, Dustin Morado, Sjors Scheres, Conny Yu, Cheng-Yu Huang and Wim Hagen for technical assistance, and Peter Rosenthal, Steve Gamblin, John Skehel and David Veesler for support during preparation of helical arrays. All NMR data were acquired at the MRS facility of the MRC-LMB. This study made use of electron microscopes at EMBL and the MRC-LMB EM Facility, as well as high-performance computing resources at EMBL and LMB and the CIID CL2 imaging facility, we thank the staff who maintain those resources. Funding was provided to JAGB by the European Research Council (ERC) under the European Union's Horizon 2020 research and innovation programme (ERC-CoG-648432 MEMBRANEFUSION), the Medical Research Council (MC_UP_1201/16) and the European Molecular Biology Laboratory; and to JAGB and HGK by the Deutsche Forschungsgemeinschaft (project number 240245660 - SFB1129).
Footnotes
Author contributions: XX, HGK and JAGB conceived the project. XX designed and performed in vitro helical assembly of M1, LJC contributed to initial identification of helical arrays. XX, SE and SF designed and performed NMR experiments. JP and JAGB designed virus and VLP experiments which were performed by JP. OS and SK performed preliminary sample preparation and structural characterization of M1. JP, XX, and KQ collected cryo-EM and cryo-ET data. JP processed cryo-ET data with assistance from WW and JAGB. XX processed cryo-EM data with assistance from KQ and JAGB. JP, XX, SE and JAGB interpreted data. JP, XX and JAGB wrote the original draft which was edited and reviewed by all authors. JAGB and HGK obtained funding. JAGB supervised and managed the project.
Competing interests: The authors have no competing interests.
Data availability
The cryo-EM and cryo-ET structures, and representative tomograms are deposited in the Electron Microscopy Data Bank (EMDB) under accession codes EMD-11075, EMD-11076, EMD-11077, EMD-11078 and EMD-11079. The associated molecular models are deposited in the protein data bank (PDB) under accession codes 6Z5J and 6Z5L. Protein structures from published work that were used in this study are available in the PDB under accession codes: 1AA7, 1EA3, 5WCO, and 5V6G. Sequences used in this study are available from Uniprot.
References
- 1.Rossman JS, Lamb RA. Influenza virus assembly and budding. Virology. 2011;411:229–236. doi: 10.1016/j.virol.2010.12.003. [DOI] [PMC free article] [PubMed] [Google Scholar]
- 2.Elster C, Larsen K, Gagnon J, Ruigrok RW, Baudin F. Influenza virus M1 protein binds to RNA through its nuclear localization signal. J Gen Virol. 1997;78(Pt 7):1589–1596. doi: 10.1099/0022-1317-78-7-1589. [DOI] [PubMed] [Google Scholar]
- 3.Noton SL, et al. Identification of the domains of the influenza A virus M1 matrix protein required for NP binding, oligomerization and incorporation into virions. J Gen Virol. 2007;88:2280–2290. doi: 10.1099/vir.0.82809-0. [DOI] [PMC free article] [PubMed] [Google Scholar]
- 4.Chen BJ, Takeda M, Lamb RA. Influenza Virus Hemagglutinin (H3 Subtype) Requires Palmitoylation of Its Cytoplasmic Tail for Assembly: M1 Proteins of Two Subtypes Differ in Their Ability To Support Assembly. J Virol. 2005;79:13673–13684. doi: 10.1128/JVI.79.21.13673-13684.2005. [DOI] [PMC free article] [PubMed] [Google Scholar]
- 5.Zhang J, Pekosz A, Lamb RA. Influenza virus assembly and lipid raft microdomains: a role for the cytoplasmic tails of the spike glycoproteins. J Virol. 2000;74:4634–4644. doi: 10.1128/jvi.74.10.4634-4644.2000. [DOI] [PMC free article] [PubMed] [Google Scholar]
- 6.Chu CM, Dawson IM, Elford WJ. Filamentous forms associated with newly isolated influenza virus. The Lancet. 1949;1:602. doi: 10.1016/s0140-6736(49)91699-2. [DOI] [PubMed] [Google Scholar]
- 7.Mosley VM, Wyckoff RWG. Electron micrography of the virus of influenza. Nature. 1946;157:263. doi: 10.1038/157263a0. [DOI] [PubMed] [Google Scholar]
- 8.Wrigley NG. Electron microscopy of influenza virus. Br Med Bull. 1979;35:35–38. doi: 10.1093/oxfordjournals.bmb.a071539. [DOI] [PubMed] [Google Scholar]
- 9.Ruigrok RW, Calder LJ, Wharton SA. Electron microscopy of the influenza virus submembranal structure. Virology. 1989;173:311–316. doi: 10.1016/0042-6822(89)90248-1. [DOI] [PubMed] [Google Scholar]
- 10.Nermut MV. Further investigation on the fine structure of influenza virus. J Gen Virol. 1972;17:317–331. doi: 10.1099/0022-1317-17-3-317. [DOI] [PubMed] [Google Scholar]
- 11.Fontana J, Steven AC. At Low pH, Influenza Virus Matrix Protein M1 Undergoes a Conformational Change Prior to Dissociating from the Membrane. J Virol. 2013;87:5621–5628. doi: 10.1128/JVI.00276-13. [DOI] [PMC free article] [PubMed] [Google Scholar]
- 12.Sha B, Luo M. Structure of a bifunctional membrane-RNA binding protein, influenza virus matrix protein M1. Nat Struct Biol. 1997;4:239–244. doi: 10.1038/nsb0397-239. [DOI] [PubMed] [Google Scholar]
- 13.Arzt S, et al. Combined results from solution studies on intact influenza virus M1 protein and from a new crystal form of its N-terminal domain show that M1 is an elongated monomer. Virology. 2001;279:439–446. doi: 10.1006/viro.2000.0727. [DOI] [PubMed] [Google Scholar]
- 14.Harris A, Forouhar F, Qiu S, Sha B, Luo M. The Crystal Structure of the Influenza Matrix Protein M1 at Neutral pH: M1-M1 Protein Interfaces Can Rotate in the Oligomeric Structures of M1. Virology. 2001;289:34–44. doi: 10.1006/viro.2001.1119. [DOI] [PubMed] [Google Scholar]
- 15.Zhang W, et al. Crystal structure of an orthomyxovirus matrix protein reveals mechanisms for self-polymerization and membrane association. Proc Natl Acad Sci USA. 2017;114:8550–8555. doi: 10.1073/pnas.1701747114. [DOI] [PMC free article] [PubMed] [Google Scholar]
- 16.Sugita Y, Noda T, Sagara H, Kawaoka Y. Ultracentrifugation deforms unfixed influenza A virions. J Gen Virol. 2011;92:2485–2493. doi: 10.1099/vir.0.036715-0. [DOI] [PMC free article] [PubMed] [Google Scholar]
- 17.Vijayakrishnan S, et al. Cryotomography of budding influenza A virus reveals filaments with diverse morphologies that mostly do not bear a genome at their distal end. PLoS Pathog. 2013;9:e1003413. doi: 10.1371/journal.ppat.1003413. [DOI] [PMC free article] [PubMed] [Google Scholar]
- 18.Calder LJ, Wasilewski S, Berriman JA, Rosenthal PB. Structural organization of a filamentous influenza A virus. Proc Natl Acad Sci USA. 2010;107:10685–10690. doi: 10.1073/pnas.1002123107. [DOI] [PMC free article] [PubMed] [Google Scholar]
- 19.Chlanda P, et al. Structural Analysis of the Roles of Influenza A Virus Membrane-Associated Proteins in Assembly and Morphology. J Virol. 2015;89:8957–8966. doi: 10.1128/JVI.00592-15. [DOI] [PMC free article] [PubMed] [Google Scholar]
- 20.Ruigrok RWH, et al. Membrane Interaction of Influenza Virus M1 Protein. Virology. 2000;267:289–298. doi: 10.1006/viro.1999.0134. [DOI] [PubMed] [Google Scholar]
- 21.Bourmakina SV, García-Sastre A. Reverse genetics studies on the filamentous morphology of influenza A virus. J Gen Virol. 2003;84:517–527. doi: 10.1099/vir.0.18803-0. [DOI] [PubMed] [Google Scholar]
- 22.Elleman CJ, Barclay WS. The M1 matrix protein controls the filamentous phenotype of influenza A virus. Virology. 2004;321:144–153. doi: 10.1016/j.virol.2003.12.009. [DOI] [PubMed] [Google Scholar]
- 23.Burleigh LM, Skehel JJ, Steinhauer DA. Influenza a viruses with mutations in the m1 helix six domain display a wide variety of morphological phenotypes. J Virol. 2005;79:1262–1270. doi: 10.1128/JVI.79.2.1262-1270.2005. [DOI] [PMC free article] [PubMed] [Google Scholar]
- 24.Shishkov A, et al. Spatial structure peculiarities of influenza A virus matrix M1 protein in an acidic solution that simulates the internal lysosomal medium. FEBS J. 2011;278:4905–4916. doi: 10.1111/j.1742-4658.2011.08392.x. [DOI] [PubMed] [Google Scholar]
- 25.Chiang M-J, et al. Maintaining pH-dependent conformational flexibility of M1 is critical for efficient influenza A virus replication. Emerg Microbes Infect. 2017;6:e108. doi: 10.1038/emi.2017.96. [DOI] [PMC free article] [PubMed] [Google Scholar]
- 26.Dahmani I, Ludwig K, Chiantia S. Influenza A matrix protein M1 induces lipid membrane deformation via protein multimerization. Biosci Rep. 2019;39 doi: 10.1042/BSR20191024. BSR20191024. [DOI] [PMC free article] [PubMed] [Google Scholar]
- 27.Zhang X, et al. Atomic model of a nonenveloped virus reveals pH sensors for a coordinated process of cell entry. Nat Struct Mol Biol. 2015;23:74–80. doi: 10.1038/nsmb.3134. [DOI] [PMC free article] [PubMed] [Google Scholar]
- 28.Li Z, Blissard GW. Autographa californica multiple nucleopolyhedrovirus GP64 protein: roles of histidine residues in triggering membrane fusion and fusion pore expansion. J Virol. 2011;85:12492–12504. doi: 10.1128/JVI.05153-11. [DOI] [PMC free article] [PubMed] [Google Scholar]
- 29.Calder LJ, Rosenthal PB. Cryomicroscopy provides structural snapshots of influenza virus membrane fusion. Nat Struct Mol Biol. 2016;23:853–858. doi: 10.1038/nsmb.3271. [DOI] [PMC free article] [PubMed] [Google Scholar]
- 30.Gui L, Ebner JL, Mileant A, Williams JA, Lee KK. Visualization and Sequencing of Membrane Remodeling Leading to Influenza Virus Fusion. J Virol. 2016;90:6948–6962. doi: 10.1128/JVI.00240-16. [DOI] [PMC free article] [PubMed] [Google Scholar]
- 31.Martínez-Sobrido L, García-Sastre A. Generation of recombinant influenza virus from plasmid DNA. J Vis Exp. 2010:e2057. doi: 10.3791/2057. [DOI] [PMC free article] [PubMed] [Google Scholar]
- 32.Tobita K, Sugiura A, Enomote C, Furuyama M. Plaque assay and primary isolation of influenza A viruses in an established line of canine kidney cells (MDCK) in the presence of trypsin. Med Microbiol Immunol. 1975;162:9–14. doi: 10.1007/BF02123572. [DOI] [PubMed] [Google Scholar]
- 33.Wan W, et al. Structure and assembly of the Ebola virus nucleocapsid. Nature. 2017;551:394–397. doi: 10.1038/nature24490. [DOI] [PMC free article] [PubMed] [Google Scholar]
- 34.Hagen WJH, Wan W, Briggs JAG. Implementation of a cryo-electron tomography tilt-scheme optimized for high resolution subtomogram averaging. J Struct Biol. 2017;197:191–198. doi: 10.1016/j.jsb.2016.06.007. [DOI] [PMC free article] [PubMed] [Google Scholar]
- 35.Mastronarde DN. Automated electron microscope tomography using robust prediction of specimen movements. J Struct Biol. 2005;152:36–51. doi: 10.1016/j.jsb.2005.07.007. [DOI] [PubMed] [Google Scholar]
- 36.Kremer JR, Mastronarde DN, McIntosh JR. Computer visualization of three-dimensional image data using IMOD. J Struct Biol. 1996;116:71–76. doi: 10.1006/jsbi.1996.0013. [DOI] [PubMed] [Google Scholar]
- 37.Rohou A, Grigorieff N. CTFFIND4: Fast and accurate defocus estimation from electron micrographs. J Struct Biol. 2015;192:216–221. doi: 10.1016/j.jsb.2015.08.008. [DOI] [PMC free article] [PubMed] [Google Scholar]
- 38.Grant T, Grigorieff N. Measuring the optimal exposure for single particle cryo-EM using a 26 Å reconstruction of rotavirus VP6. eLife. 2015;4:e06980. doi: 10.7554/eLife.06980. [DOI] [PMC free article] [PubMed] [Google Scholar]
- 39.Turoňová B, Schur FKM, Wan W, Briggs JAG. Efficient 3D-CTF correction for cryo-electron tomography using NovaCTF improves subtomogram averaging resolution to 34Å. J Struct Biol. 2017;199:187–195. doi: 10.1016/j.jsb.2017.07.007. [DOI] [PMC free article] [PubMed] [Google Scholar]
- 40.Pettersen EF, et al. UCSF Chimera--a visualization system for exploratory research and analysis. J Comput Chem. 2004;25:1605–1612. doi: 10.1002/jcc.20084. [DOI] [PubMed] [Google Scholar]
- 41.Förster F, Medalia O, Zauberman N, Baumeister W, Fass D. Retrovirus envelope protein complex structure in situ studied by cryo-electron tomography. Proc Natl Acad Sci USA. 2005;102:4729–4734. doi: 10.1073/pnas.0409178102. [DOI] [PMC free article] [PubMed] [Google Scholar]
- 42.Nickell S, et al. TOM software toolbox: acquisition and analysis for electron tomography. J Struct Biol. 2005;149:227–234. doi: 10.1016/j.jsb.2004.10.006. [DOI] [PubMed] [Google Scholar]
- 43.Castaño-Díez D, Kudryashev M, Arheit M, Stahlberg H. Dynamo: A flexible, user-friendly development tool for subtomogram averaging of cryo-EM data in high-performance computing environments. J Struct Biol. 2012;178:139–151. doi: 10.1016/j.jsb.2011.12.017. [DOI] [PubMed] [Google Scholar]
- 44.Kovtun O, et al. Structure of the membrane-assembled retromer coat determined by cryo-electron tomography. Nature. 2018;561:561–564. doi: 10.1038/s41586-018-0526-z. [DOI] [PMC free article] [PubMed] [Google Scholar]
- 45.Tan YZ, et al. Addressing preferred specimen orientation in single-particle cryo-EM through tilting. Nat Methods. 2017;14:793–796. doi: 10.1038/nmeth.4347. [DOI] [PMC free article] [PubMed] [Google Scholar]
- 46.Henderson R. Optimal Determination of Particle Orientation, Absolute Hand, and Contrast Loss in Single-particle Electron Cryomicroscopy. J Mol Biol. 2003;333:721–745. doi: 10.1016/j.jmb.2003.07.013. [DOI] [PubMed] [Google Scholar]
- 47.Pervushin K. Impact of transverse relaxation optimized spectroscopy (TROSY) on NMR as a technique in structural biology. Quart Rev Biophys. 2000;33:161–197. doi: 10.1017/s0033583500003619. [DOI] [PubMed] [Google Scholar]
- 48.Delaglio F, et al. NMRPipe: a multidimensional spectral processing system based on UNIX pipes. J Biomol NMR. 1995;6:277–293. doi: 10.1007/BF00197809. [DOI] [PubMed] [Google Scholar]
- 49.Mayzel M, Rosenlöw J, Isaksson L, Orekhov VY. Time-resolved multidimensional NMR with non-uniform sampling. J Biomol NMR. 2014;58:129–139. doi: 10.1007/s10858-013-9811-1. [DOI] [PMC free article] [PubMed] [Google Scholar]
- 50.Vranken WF, et al. The CCPN data model for NMR spectroscopy: development of a software pipeline. Proteins. 2005;59:687–696. doi: 10.1002/prot.20449. [DOI] [PubMed] [Google Scholar]
- 51.Schwarzinger S, et al. Sequence-dependent correction of random coil NMR chemical shifts. J Am Chem Soc. 2001;123:2970–2978. doi: 10.1021/ja003760i. [DOI] [PubMed] [Google Scholar]
- 52.Ferrage F, Zoonens M, Warschawski DE, Popot J-L, Bodenhausen G. Slow diffusion of macromolecular assemblies by a new pulsed field gradient NMR method. J Am Chem Soc. 2003;125:2541–2545. doi: 10.1021/ja0211407. [DOI] [PubMed] [Google Scholar]
- 53.García De La Torre J, Huertas ML, Carrasco B. Calculation of hydrodynamic properties of globular proteins from their atomic-level structure. Biophys J. 2000;78:719–730. doi: 10.1016/S0006-3495(00)76630-6. [DOI] [PMC free article] [PubMed] [Google Scholar]
- 54.Zheng SQ, et al. MotionCor2: anisotropic correction of beam-induced motion for improved cryo-electron microscopy. Nat Methods. 2017;14:331–332. doi: 10.1038/nmeth.4193. [DOI] [PMC free article] [PubMed] [Google Scholar]
- 55.Zivanov J, et al. New tools for automated high-resolution cryo-EM structure determination in RELION-3. eLife. 2018;7:e42166. doi: 10.7554/eLife.42166. [DOI] [PMC free article] [PubMed] [Google Scholar]
- 56.Desfosses A, Ciuffa R, Gutsche I, Sachse C. SPRING - an image processing package for single-particle based helical reconstruction from electron cryomicrographs. J Struct Biol. 2014;185:15–26. doi: 10.1016/j.jsb.2013.11.003. [DOI] [PubMed] [Google Scholar]
- 57.Zivanov J, Nakane T, Scheres SHW. A Bayesian approach to beam-induced motion correction in cryo-EM single-particle analysis. IUCrJ. 2019;6:5–17. doi: 10.1107/S205225251801463X. [DOI] [PMC free article] [PubMed] [Google Scholar]
- 58.He S, Scheres SHW. Helical reconstruction in RELION. J Struct Biol. 2017;198:163–176. doi: 10.1016/j.jsb.2017.02.003. [DOI] [PMC free article] [PubMed] [Google Scholar]
- 59.Emsley P, Lohkamp B, Scott WG, Cowtan K. Features and development of Coot. Acta Cryst D. 2010;66:486–501. doi: 10.1107/S0907444910007493. [DOI] [PMC free article] [PubMed] [Google Scholar]
- 60.Kidmose RT, et al. Namdinator - automatic molecular dynamics flexible fitting of structural models into cryo-EM and crystallography experimental maps. IUCrJ. 2019;6:526–531. doi: 10.1107/S2052252519007619. [DOI] [PMC free article] [PubMed] [Google Scholar]
- 61.Afonine PV, et al. Real-space refinement in PHENIX for cryo-EM and crystallography. Acta Cryst D. 2018;74:531–544. doi: 10.1107/S2059798318006551. [DOI] [PMC free article] [PubMed] [Google Scholar]
- 62.Barad BA, et al. EMRinger: side chain-directed model and map validation for 3D cryo-electron microscopy. Nat Methods. 2015;12:943–946. doi: 10.1038/nmeth.3541. [DOI] [PMC free article] [PubMed] [Google Scholar]
- 63.Das SC, et al. The highly conserved arginine residues at positions 76 through 78 of influenza A virus matrix protein M1 play an important role in viral replication by affecting the intracellular localization of M1. J Virol. 2012;86:1522–1530. doi: 10.1128/JVI.06230-11. [DOI] [PMC free article] [PubMed] [Google Scholar]
- 64.Baudin F, Petit I, Weissenhorn W, Ruigrok RW. In vitro dissection of the membrane and RNP binding activities of influenza virus M1 protein. Virology. 2001;281:102–108. doi: 10.1006/viro.2000.0804. [DOI] [PubMed] [Google Scholar]
- 65.Zhang K, et al. Two polar residues within C-terminal domain of M1 are critical for the formation of influenza A Virions. Cell Microbiol. 2015;17:1583–1593. doi: 10.1111/cmi.12457. [DOI] [PMC free article] [PubMed] [Google Scholar]
- 66.Wu CY, Jeng KS, Lai MMC. The SUMOylation of Matrix Protein M1 Modulates the Assembly and Morphogenesis of Influenza A Virus. J Virol. 2011;85:6618–6628. doi: 10.1128/JVI.02401-10. [DOI] [PMC free article] [PubMed] [Google Scholar]
Associated Data
This section collects any data citations, data availability statements, or supplementary materials included in this article.
Supplementary Materials
Data Availability Statement
The cryo-EM and cryo-ET structures, and representative tomograms are deposited in the Electron Microscopy Data Bank (EMDB) under accession codes EMD-11075, EMD-11076, EMD-11077, EMD-11078 and EMD-11079. The associated molecular models are deposited in the protein data bank (PDB) under accession codes 6Z5J and 6Z5L. Protein structures from published work that were used in this study are available in the PDB under accession codes: 1AA7, 1EA3, 5WCO, and 5V6G. Sequences used in this study are available from Uniprot.


