Abstract
Fibrosis is a common pathological feature of chronic disease. Deletion of the NF-κB subunit c-Rel limits fibrosis in multiple organs, although the mechanistic nature of this protection is unresolved. Using cell-specific gene-targeting manipulations in mice undergoing liver damage, we elucidate a critical role for c-Rel in controlling metabolic changes required for inflammatory and fibrogenic activities of hepatocytes and macrophages, and identify Pfkfb3 as the key downstream metabolic mediator of this response. Independent deletions of Rel in hepatocytes or macrophages suppressed CCl4-induced liver fibrosis, while combined deletion had an additive anti-fibrogenic effect. In TGFβ1-induced hepatocytes, c-Rel regulates expression of a profibrogenic secretome comprising inflammatory molecules and CTGF; the latter promoting collagen secretion from hepatic myofibroblasts. Macrophages lacking c-Rel fail to polarise to M1 or M2 states, explaining reduced fibrosis in RelΔLysM mice. Pharmacological inhibition of c-Rel attenuated fibrosis in multiple organs in both murine and human fibrosis. In conclusion, activation of cRel/Pfkfb3 in damaged tissue instigates a paracrine signalling network between epithelial, myeloid and mesenchymal cells to stimulate fibrogenesis. Targeting the c-Rel/Pfkfb3 axis has potential for therapeutic applications in fibrotic disease.
Introduction
Fibrosis is a pathophysiological response to repeated tissue insults and involves the progressive accumulation of collagen-rich fibril-forming extracellular matrix (ECM). Fibrosis can occur in any solid organ and if unchecked will progressively replace and disrupt normal tissue mass and architecture leading to loss of organ function1–4. A vast range of human disease states are associated with fibrosis, affecting all vital organs, moreover the persistence of fibrotic tissue increases the risk of many cancers including breast, lung, liver and pancreas5–7. Fibrosis is also a feature of tissue ageing and conditions associated with regenerative failure (e.g. Duchenne Muscular Dystrophy) where the gradual replacement of functional tissue with fibrotic ECM contributes to frailty, loss of mobility and reduced quality of life8–10. The huge clinical burden of fibrosis has stimulated intensive research aimed at the design of anti-fibrotic drugs, this aim has been further stimulated by an increasing body of evidence that fibrosis is highly dynamic and can be manipulated to slow progression, halt or even undergo regression1. To unlock effective anti-fibrotics it is imperative we identify the underlying molecular drivers of fibrosis and identify fibrosis-mediators that can be developed as pharmacological targets. Of particular interest is the identification of fibrosis-mediators that have a common (or core) mechanism of action across different organs and types of injuries, thus enabling the design of generic anti-fibrotic medicines. Common features of fibrotic tissues are persistent epithelial dysfunction, unresolved inflammation and the progressive activation and proliferation of ECM-expressing myofibroblasts11–13. These pathological changes are underpinned by complex multi-directional inflammatory and fibrogenic crosstalk between these cellular compartments within the fibrogenic niche. Hence, illuminating factors that drive one or more of these common pathological processes has the potential to reveal targets for the design of generic anti-fibrotic therapies.
The NF-κB family of transcription factors (RelA/p65, RelB, c-Rel, p50 and p52) are best known for their functions in the immune system and as mediators of inflammation14–17. However, the NF-κB proteins participate in broader cellular functions that include the control of cell proliferation, differentiation, apoptosis, migration, adhesion and senescence, all of which are implicated in fibrogenesis18–21. Importantly, while each of the NF-κB subunits recognise a common core κB DNA binding motif, the transcriptional and physiological consequences of DNA binding differ between the subunits22. As an example, mice lacking RelA/p65 die during embryogenesis due to massive hepatocyte apoptosis, by contrast mice lacking any one of the other four subunits undergo normal embryonic development and are viable23–25. Although the subunits share common structural features such as the Rel homology domain and a nuclear localisation sequence, they have quite distinct primary amino acid sequences and can interact differentially with a range of transcriptional co-factors to bring about differential gene expression14,18. There is also accumulating evidence for context and cell-specific functions for the NF-κB subunits, some of which are controlled by specific post-translational modifications, in particular dynamic phosphorylation and acetylation events18,26.
c-Rel, which is encoded by the REL gene in humans, is an NF-κB activator of gene transcription. c-Rel can promote a permissive state for transcription not only through its interaction with κB motifs, but also via its regulation of the histone methyltransferase EZH2 27,28, the latter recently identified as a profibrogenic regulator in models of liver disease29. We previously described that c-Rel is upregulated in chronic disease and functions as a core pro-fibrogenic factor, based on our observations that c-Rel-deficient (Rel-/-) mice are protected from fibrosis in liver, heart and skin injury models30–33. However, the cellular context and the mechanisms by which c-Rel promotes fibrosis are poorly defined and evidence is currently lacking that pharmacological targeting of c-Rel can safely and effectively modulate fibrosis in the context of chronic injury.
Here we report that c-Rel operates as an essential transcriptional switch for metabolic reprogramming that is required for energy-dependent phenotypic transitions occurring in epithelial cells and macrophages in response to tissue injury. These phenotypic transitions are shown to be important for inflammatory functions and the activation of fibrogenic signalling networks to promote tissue fibrosis. Hence, c-Rel unexpectedly emerges as a metabolic regulator of tissue fibrosis and a rationale target for the development of antifibrotics. We validate this proposal by demonstrating that pharmacological targeting of c-Rel with a selective small molecule inhibitor prevents fibrosis and promotes normal tissue regeneration. Our data therefore set the scene for the design of targeted c-Rel inhibitors as anti-fibrotic agents for use across multiple organs and disease processes.
Results
c-Rel regulates the epithelial response to damage
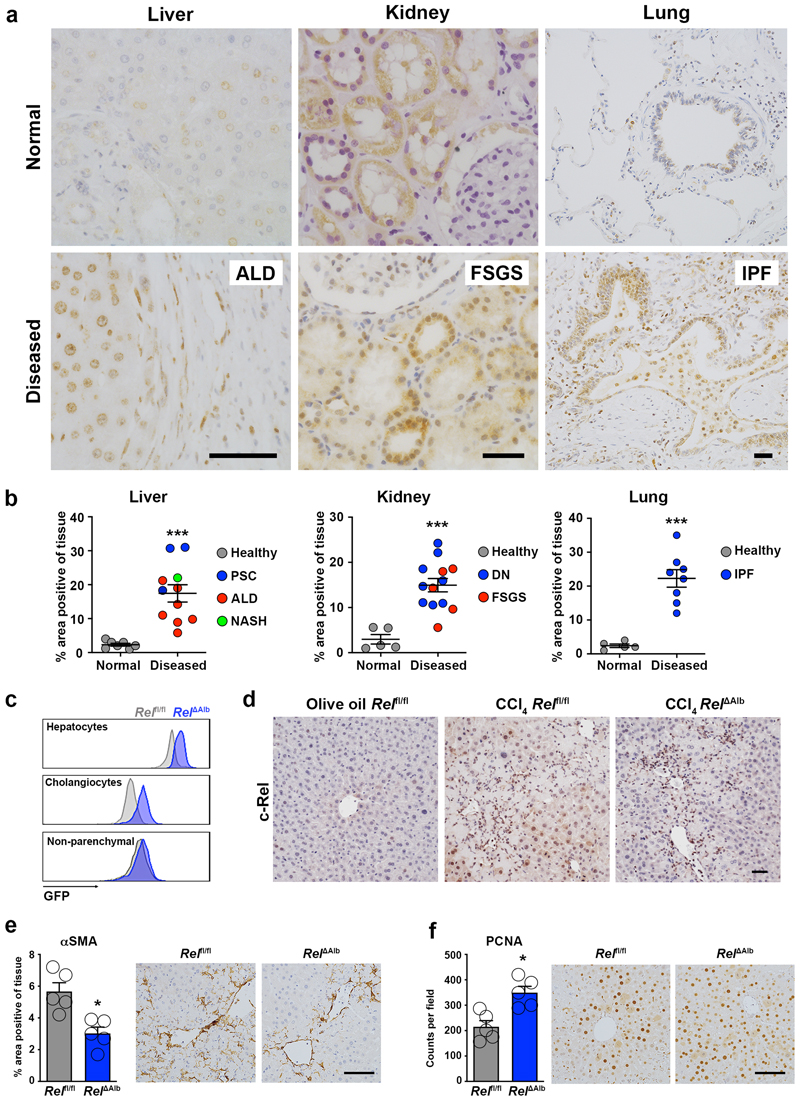
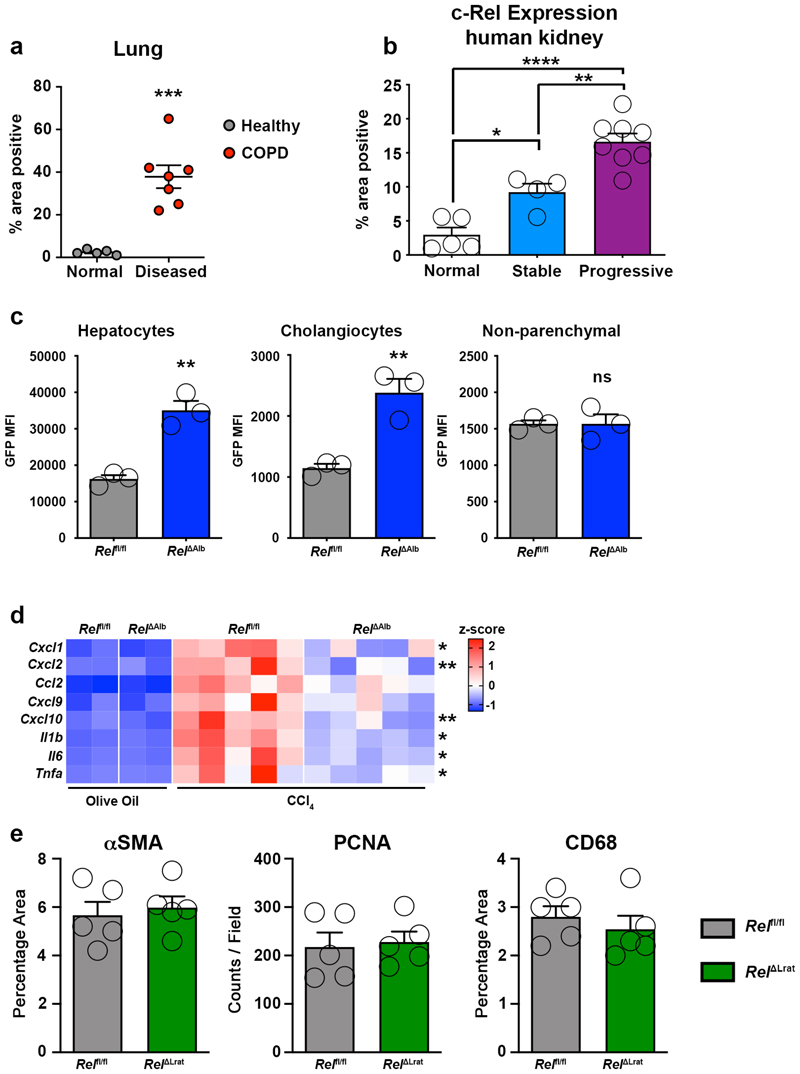
Examination of the expression of c-Rel in fibrotic human liver, kidney and lung revealed a previously unreported upregulation of the NF-κB transcription factor in epithelial cells of all three tissues (Figure 1a and Supplementary Figure 1). Enhanced c-Rel expression was common in chronic liver, lung and kidney diseases and in the latter positively correlated with disease progression (Figure 1b, Extended data Figure 1a and 1b). Epithelial damage is often an initiating event for triggering wound repair and in the context of an acute injury is resolved by epithelial regeneration1,34. To determine the role of epithelial c-Rel in acute wound healing in the liver, we generated RelΔAlb mice in which the transcription factor is selectively deleted in hepatocytes and cholangiocytes (Extended data Figure 1c). As the founder Relfl/fl line was genetically engineered to express GFP upon Cre-mediated recombination we were able to use flow cytometry of isolated cells to confirm epithelial-targeted recombination (Figure 1c). Relfl/fl and RelΔAlb mice were subjected to acute liver injury with the hepatotoxin carbon tetrachloride (CCl4). Immunohistochemical staining for c-Rel confirmed increased expression and nuclear localisation in hepatocytes of CCl4 injured Relfl/fl mice compared to controls. As anticipated, c-Rel was absent in hepatocytes of CCl4 injured RelΔAlb mice, whereas strong immunoreactivity was detected in infiltrating immune cells (Figure 1d). Histology of damaged Relfl/fl (wild type) liver revealed increased numbers of α-SMA+ myofibroblasts (Figure 1e) which correlated with inflammatory gene expression (Extended data Figure 1d). These responses were blunted in CCl4-injured RelΔAlb mice despite the liver damage markers ALT and AST being at similar levels to Relfl/fl controls (Supplementary Table 1). We next asked if deletion of c-Rel impacts on hepatocellular regeneration following CCl4-injury and found enhanced numbers of proliferative hepatocytes in damaged RelΔAlb liver relative to Relfl/fl control (Figure 1f). Of note, cell-specific deletion of c-Rel in hepatic myofibroblast (HM, RelΔLrat mice) did not affect the extent of liver injury or the acute wound healing response (Extended data Figure 1e, Supplementary Table 1). We conclude that injury-induced activation of c-Rel in the hepatic epithelium promotes a profibrogenic phenotype. Liver damage impacts on hepatocytes in multiple ways incuding triggering cellular stress responses, stimulation of apoptosis or senescence and secretion of pro-inflammatory and pro-fibrogenic mediators to mount an effective wound healing response12,35. Indeed, epithelial cells have been proposed as critical orchestrators of immune and inflammatory events following tissue stress and damage36. We therefore hypothesised that the upregulation of c-Rel we observed in the hepatic epithelium of damaged human liver (Figure 1a and b) may control hepatocyte plasticity to promote proinflammatory and profibrogenic phenotypes under disease conditions.
Figure 1. c-Rel is a feature of chronic liver, kidney and lung disease in humans and epithelial c-Rel signalling regulates hepatic fibrogenesis and regeneration in mice.
(a) Representative images show c-Rel staining in normal and diseased liver, lung and kidney sections. (b) Graphs show average percentage area of c-Rel stained tissue in normal liver, lung and kidney sections compared to diseased human liver (alcoholic liver disease (ALD), primary sclerosing cholangitis (PSC) and non-alcoholic steatohepatitis (NASH)), diseased kidney (focal segmented glomerular sclerosis (FSGS) and diabetic nephropathy (DN)) or lung disease, idiopathic pulmonary fibrosis (IPF). Data are mean ± s.e.m. in 7 healthy and 11 diseased patient tissue for liver (p value = 0.0003), 5 healthy and 13 diseased patient tissue for kidney (p value = 0.0002) and 5 healthy and 8 diseased patient tissue for lung (p value <0.0001). (c) FACS plot showing the Mean Fluorescence Intensity (MFI) of GFP in hepatocytes, cholangiocytes (EPCAM+) and non-parenchymal (EpCAM-) cells from the liver of Rel flfl (grey) and Rel ΔAlb (blue) mice. (d) Representative images show c-Rel staining 5 mice/group in olive oil Rel flfl mice and CCl4 injured Relflfl and Rel ΔAlb mice. (e-f) Histological assessment and representative images of (e) αSMA (p value = 0.005) and (f) PCNA (p value = 0.005) stained liver sections in acute CCl4 injured Relflfl and Rel ΔAlb mice. Data are mean ± s.e.m. in 5 mice/group. Scale bars equal 50 microns. All P values were calculated using a unpaired two-sided T test (* P <0.05, *** P <0.001).
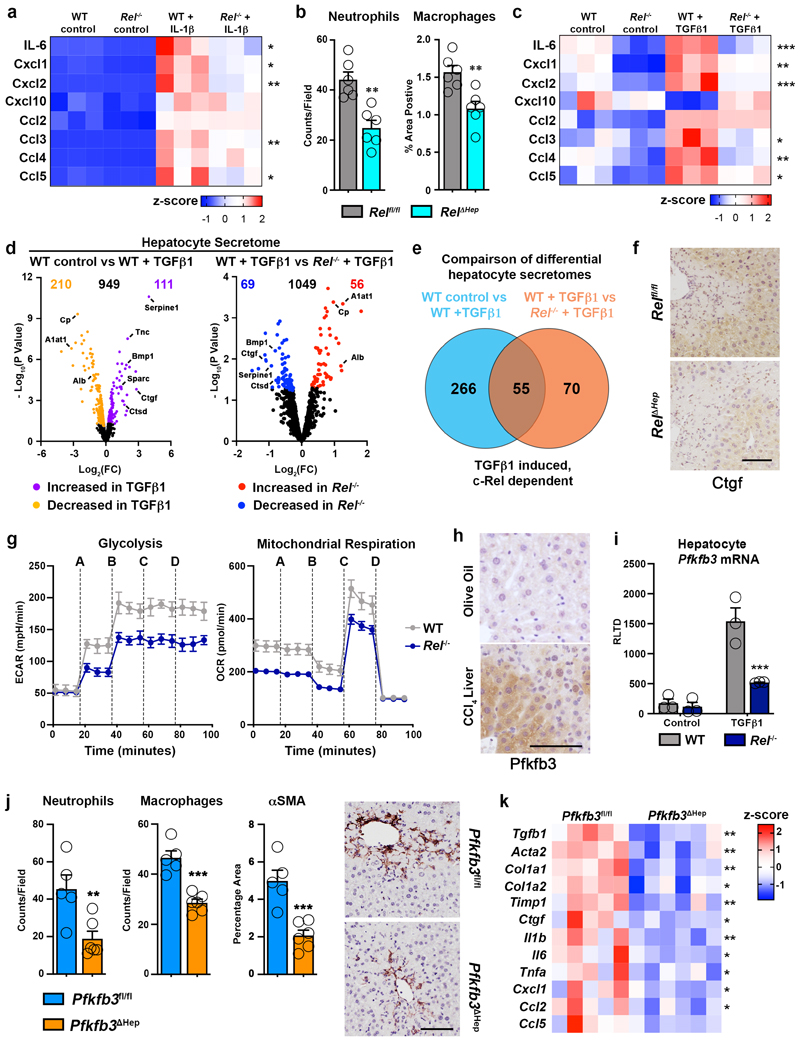
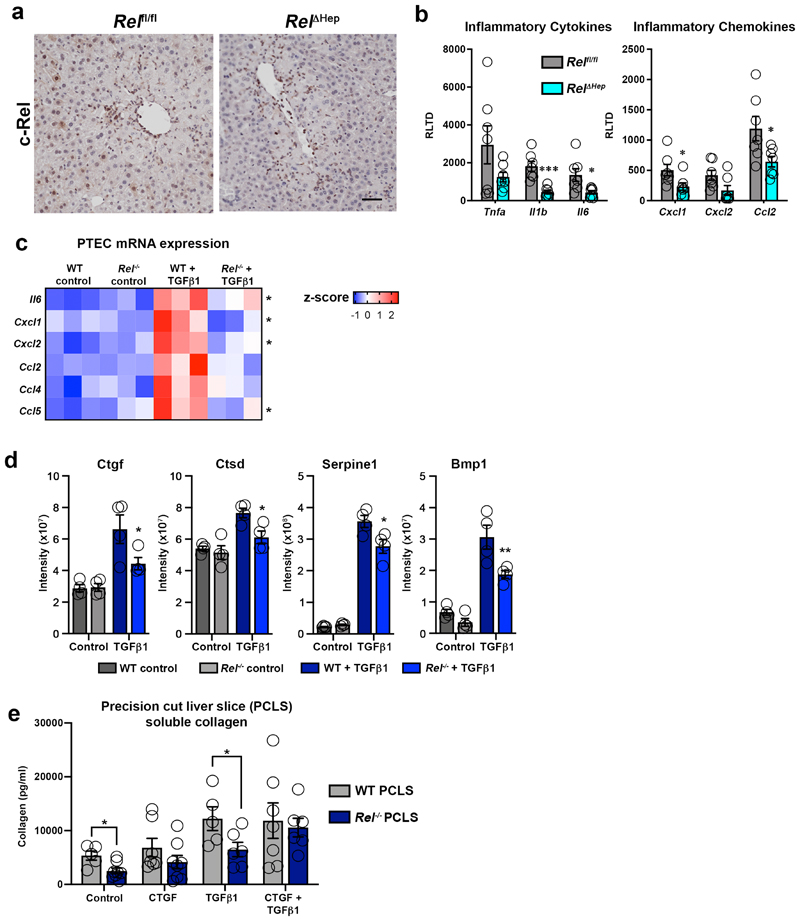
To test this hypothesis we first measured the secretion of several pro-inflammatory cytokines and chemokines in primary cultures of WT and Rel-/- hepatocytes exposed to the classic inflammatory trigger IL-1β (Figure 2a). As expected, WT Hepatocytes mounted a robust inflammatory response to IL-1β challenge, but by contrast Rel-/- hepatocytes were defective for induction of Il-6, Cxcl1, Cxcl2, Ccl3 and Ccl5. These data suggest that activation of c-Rel facilitates the aquisition of an inflammatory hepatocellular phenotype.To confirm a pivotal role for hepatocellular c-Rel in vivo we determined the effects of hepatocyte-specific deletion of the Rel gene on the inflammatory response to acute toxic damage by CCl4. Hepatocyte-targeted deletion of Rel (Rel Δhep) was achieved by delivery of AAV8-TBG-Cre to the livers of Relfl/fl mice and confirmed by c-Rel immunohistochemical staining of the acute CCl4 injured livers (Extended data Figure 2a). Neutrophil and macrophage recruitment in response to CCl4 damage was blunted in Rel Δhep livers as was the induction of proinflammatory cytokines and chemokines (Figure 2b and Extended data Figure 2b). Induction of a robust inflammatory response and immune cell recruitment following injury is critical to drive fibrogenesis37,38. These data indicate c-Rel is a regulator of the hepatocyte phenotype and contributes to fibrogenesis via regulation of damage-induced reprogramming to a pro-inflammatory state.
Figure 2. c-Rel signalling regulates epithelial inflammatory responses via regulation of Pfkfb3.
(a) Heatmap showing secreated IL6, Cxcl1, Cxcl2, Cxcl10, Ccl2, Ccl3, Ccl4 and Ccl5, measured by MSD in the media of hepatocytes isolated from WT and Rel-/- mice and stimulated ± IL-1β. (b) Graph shows quantification of neutrophil (p value = 0.0012) and macrophage (p value = 0.0039) numbers in the liver of acute CCl4 injured Relflfl and Rel ΔHep mice. (c) Heatmap showing secreated IL6, Cxcl1, Cxcl2, Cxcl10, Ccl2, Ccl3, Ccl4 and Ccl5, measured by MSD in the media of hepatocytes isolated from WT and Rel-/- mice and stimulated ± TGFβ1. (d) Volcano plots show differentially expressed proteins detected by proteomic analysis of the secretome of WT control and WT TGFβ1 treated hepatocytes (left) and TGFβ1 treated WT and Rel-/- hepatocytes (right). (e) Venn diagram shows the number of differentially expressed proteins in TGFβ1 treated WT hepatocytes compared to control WT hepatocytes (Blue) and number of differentially expressed proteins in TGFβ1 treated WT hepatocytes compared to TGFβ1 treated Rel-/- hepatocytes (Orange). The overlap denotes c-Rel dependent secreted proteins in response to TGFβ1 stimulation. (f) Representative images show CTGF staining in the liver of 6 mice/group acute CCl4 injured Relflfl and Rel ΔHep mice. (g) Graphs show seahorse analysis of glycolysis (extracellular acidification rate, ECAR) and mitochondrial respiration (oxygen consumption rate, OCR) in WT and Rel-/- hepatocytes stimulated ± TGFβ1. Where A-D vertical lines refer to the administration of the following compounds: A – Glucose, B – Oligomycin, C- Pyruvate and FCCP, D – Rotenone and Antimycin A. (h) Representative images show Pfkfb3 staining in a minimum of 5 mice/group of olive oil control and CCl4 injured liver. (i) Graph shows mRNA expression of Pfkfb3 in WT and Rel-/- hepatocytes stimulated ± TGFβ1. (p value = 0.0008) (j) Quantification of neutrophil (p value= 0.0097) and macrophage (p value = 0.0002) numbers and histological assessment and representative images of αSMA (p value = 0.001) stained liver sections in acute CCl4 injured Pfkfb3flfl and Pfkfb3 Δhep mice. P values were calculated using a unpaired two-sided T test. (k) Heatmap shows mRNA levels of fibrogenic genes; Tgfb1, Acta2, Col1a1, Col1a2, Timp1, Ctgf and inflammatory genes; Il1b, Il6, Tnfa, Cxcl1, Ccl2 and Ccl5 in acute CCl4 injured Pfkfb3flfl and Pfkfb3 Δhep mice. Data in graphs are mean ± s.e.m. in 7 mice/genotype (c), n=5 Pfkfb3flfl and n=6 Pfkfb3 Δhep mice (e), or a minimum of 3 independent cell isolations/condition. Scale bars equal 100 microns. (a, c, i) P values were calculated using a two-way ANOVA with Tukey post-hoc t-test. (b, j, k) P values were calculated using unpaired two-tailed T-test (* P <0.05, ** P <0.01 and ***P<0.001).
TGFβ1 is expressed by macrophages and activated myofibroblasts in response to tissue injury and is a key mediator of wound healing and fibrogenesis39. In addition, TGFβ1 modulates epithelial homeostasis and in the liver can influence hepatocyte apoptosis, senescence, regeneration and inflammation. As these processes are also under the control of NF-κB, it was of interest to determine the extent to which c-Rel regulates the response of hepatocytes to TGFβ1 stimulation. To this end we determined the secretome of TGFβ1-stimulated cultured hepatocytes, using a targeted Meso Scale Discovery (MSD) screen for the detection of inflammatory molecules and an unbiased proteomics analysis for detection of epithelial and fibrogenic proteins. MSD analysis revealed that similar to IL-1β challenge, exposure of WT hepatocytes to TGFβ1 stimulates the secretion of several classic inflammatory cytokines, of which Il-6, Cxcl1, Cxcl2, Ccl3, Ccl4 and Ccl5 responses were significantly supressed in Rel deleted hepatocytes (Figure 2c). While TGFβ is best known for its strong anti-inflammatory effects, these data, in conjuction with previous reports reveal TGFβ1-dependent inflammatory phenotypes in hepatocytes40–44. This suggests a dichotomous role for TGFβ in hepatocytes, which is in line with its context-dependent dampening or promotion of immune responses45. To corroborate the role of c-Rel in TGFβ1-induced epithelial inflammation we examined responses in primary renal proximal tubular cells (PTEC). TGFβ1 stimulation induced enhanced gene expression of Il-6, Cxcl1, Cxcl2, Ccl2, Ccl4 and Ccl5, all of which were attenuated in c-Rel-deficient PTECs (Extended data Figure 2c).
Proteomic analysis of WT hepatocyte media revealed that TGFβ1 challenge altered the secretion of 321 different proteins, confirming a phenotypic reprogramming of these cells in reponse to fibrogenic stimuli (Figure 2d). To determine whether c-Rel signalling was important in modulating the sectrome of TGFβ1 stressed hepatocytes, we directly compared differentially regulated proteins detected in the sectrome of WT hepatocytes after TGFβ1 stimulation with the secretome of Rel-/- hepatocytes after TGFβ1 challenge. Comparison of these two datasets revealed 125 differentially secreted proteins regulated by TGFβ1 challenge, of which 55 were dependent on c-Rel for their response to TGFβ1 (Figure 2d and e). Proteins secreted at enhanced levels in a c-Rel-dependent manner included the fibrogenic factors bone morphometric protein 1 (BMP1), connective tissue growth factor (CTGF), cathepsin D (CTSD) and serpine 1 (Extended data Figure 2d) 46–50, these observations leading us to hypothesise that c-Rel signalling in hepatocytes promotes the secretion of profibrogenic factors. Hepatocytes have been described as a source of CTGF in the fibrotic niche and this growth factor has a plethora of fibrogenic actions including myofibroblast activation, extracellular matrix sectretion, tissue remodelling and angiogenesis51,52. Immunohistochemical staining confirmed that CTGF was highly expressed in hepatocytes and HM of acute CCl4 injured Relfl/fl mice and this induction was suppressed specifically in Rel Δhep hepatocytes, this confirming regulation of epithelial-derived CTGF expression by c-Rel (Figure 2f). To investigate the role of CTGF downstream of c-Rel, we performed a rescue experiment by supplementing the media of TGFβ1-stimulated Rel-/- precision cut liver slices (PCLS) with recombinant CTGF. Soluble collagen release was blunted in TGFβ1 stimulated Rel-/- PCLS, but consistent with our hypothesis, Rel-/- PCLS exposed to exogenous CTGF restored their soluble collagen production to levels comparable with TGFβ1 stimulated WT PCLS (Extended data Figure 2e). On the basis of these data we propose that paracrine activation of epithelial c-Rel stimulates expression of a pro-inflammatory and pro-fibrogenic secretome, important for the initiation of hepatic inflammation and wound repair.
c-Rel controls a glycolytic switch required for epithelial reprogramming and fibrosis
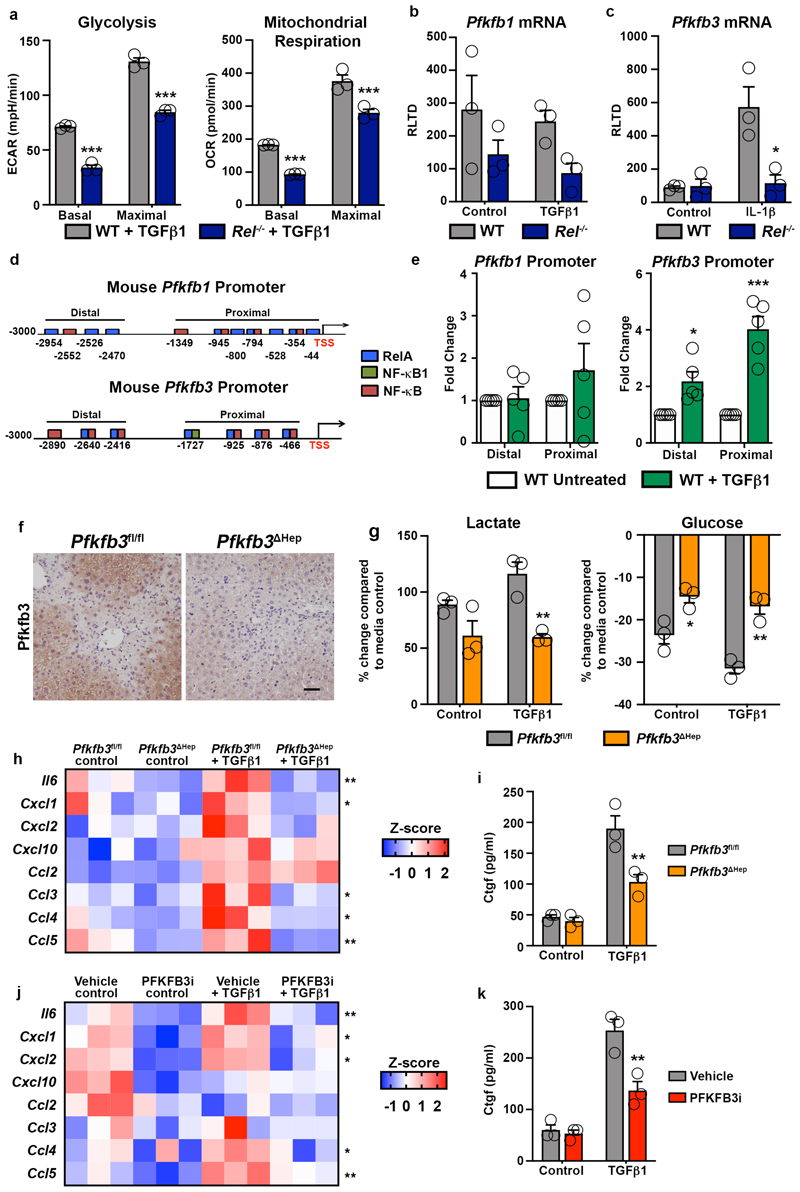
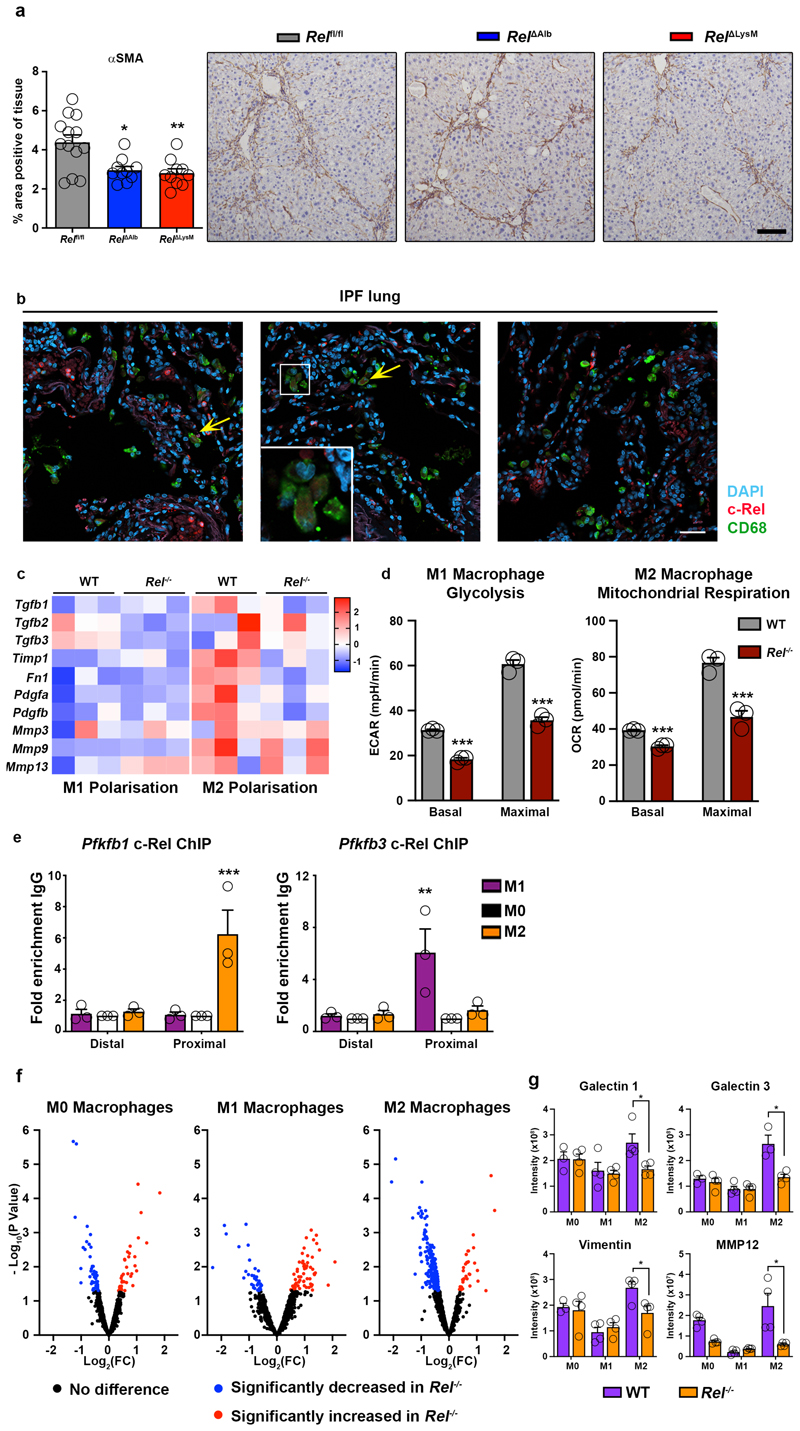
Phenotype reprogramming, inflammation and fibrogenesis are energy dependent processes, requiring underlying metabolic changes to support transcriptional and post-transcriptional alterations in gene expression53–55. Seahorse analysis revealed that both glycolytic rate and mitochondrial respiration were supressed in TGFβ1 stimulated Rel-/- hepatocytes relative to controls (Figure 2g and Extended data Figure 3a). To determine the mechanistic basis for this observation we examined expression of the glycolytic enzymes 6-phosphofructo-2-kinase/fructose-2,6-bisphosphatase-1 and -3 (Pfkfb1 and Pfkfb3), the former acting to reduce glycolytic rate while the latter promotes glycolytic flux56. Pfkfb3 expression was elevated in response to chronic CCl4 liver injury and was most noteably present within hepatocytes (Figure 2h). TGFβ1 increased Pfkfb3 transcript levels in WT hepatocytes, by contrast this response was impaired in Rel-/- hepatocytes (Figure 2i). Pfkfb1 expression in WT hepatocytes was unaffected by TGFβ1 stimulation, however Pfkfb1 mRNA levels were lower in Rel-/- hepatocytes relative to WT hepatocytes (Extended data Figure 3b). Pfkfb3 transcription was also induced in response to classical inflammatory signals in WT hepatocytes, however this response was impaired in Rel-/- hepatocytes (Extended data Figure 3c). In silico analysis of the Pfkfb1 and Pfkfb3 promoters predicted potential for recruitment of c-Rel based on the presence of multiple putative κB binding sites in proximal and distal promoter regions of both genes (Extended data Figure 3d). ChIP assays confirmed the recruitment of c-Rel to the distal and proximal sites of the Pfkfb3 promoter upon stimulation with TGFβ1 (Extended data Figure 3e). Consistent with gene expression data, c-Rel binding at the Pfkfb1 promoter was independent of TGFβ1 (Extended data Figure 3e).
From these data we hypothesised that the proinflammatory and profibrogenic effects of c-Rel activation in hepatocytes is dependent upon induction of Pfkfb3 expression and an increased glycolytic flux. To test this idea we generated hepatocyte-targeted knockouts of Pfkfb3 (Pfkfb3 Δhep) by administration of AAV8-TBG-Cre in Pfkfb3fl/fl mice (Extended data Figure 3f). Hepatocytes isolated from Pfkfb3 Δhep livers failed to undergo TGFβ1-induced enhanced lactate production and a concomitant reduction in media glucose that was observed in control Pfkfb3fl/fl hepatocytes (Extended data Figure 3g). To determine the consequences of this metabolic defect in vivo, Pfkfb3 Δhep and control Pfkfb3fl/fl mice were subject to acute injury with CCl4. Despite comparable levels of damage, Pfkfb3 Δhep livers were impaired for recruitment of neutrophils and macrophages, and in addition displayed reduced numbers of αSMA+ myofibroblasts (Supplementary Table 1 and Figure 2j). Consistent with these histological observations, hepatic inflammatory and fibrogenic gene expression was suppressed in CCl4-injured Pfkfb3 Δhep mice relative to Pfkfb3fl/fl controls (Figure 2k). A role for Pfkfb3 in fueling the energetic requirements for an hepatocellular phenotypic switch was further consolidated by in vitro experiments in which TGFβ1 treated hepatocytes isolated from Pfkfb3 Δhep mice failed to induce the robust inflammatory response observed in relative Pfkfb3fl/fl controls (Extended data Figure 3h). In addition, hepatocyte deletion of Pfkfb3 suppressed induction of CTGF (Extended data Figure 3i). These results were further validated by treatment of WT hepatocytes with a small molecule Pfkfb3 inhibitor which blocked TGFβ1-induced secretion of inflammatory cytokines, chemokines (Extended data Figure 3j) and CTGF (Extended data Figure 3k).
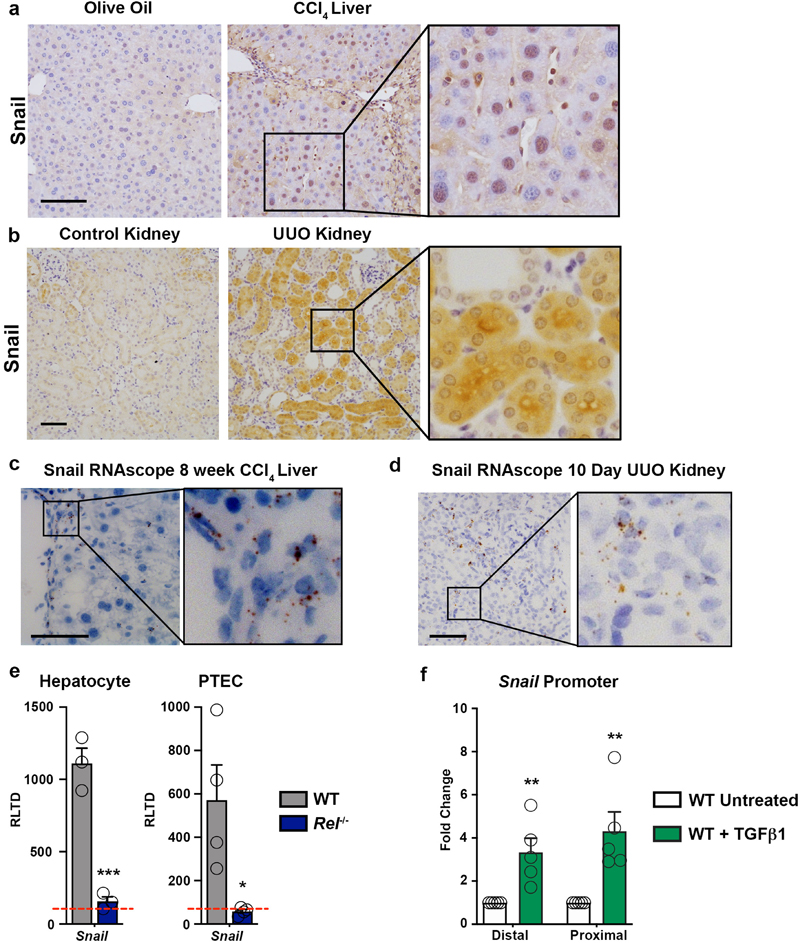
Of note, we additionally observed c-Rel-dependent upregulation of the transcription factor Snail in the nucleus of hepatocytes of CCl4 damaged livers and tubular cells of UUO injured kidneys as well as TGFβ1-stimulated hepatocyte and proximal tubule cell cultures (Extended data Figure 4a-e). ChIP assays confirmed c-Rel is recruited to proximal and distal regions of the Snail promoter which contains multiple NF-κB binding sites (Extended data Figure 4f). Snail is known for its role in epitheial mesenchymal transition (EMT), a developmental process that promotes progression of cancers. While EMT clearly does not directly contribute to the generation of fibroblasts in the liver or kidney as show by elegant lineage tracing studies57,58, it has been suggested that reprogramming of hepatocytes or renal epithelial cells, also described as “partial EMT”, without directly contributing to the myfibroblast population can modulate fibrosis as shown by epithelial Snail1 deletion in renal and liver fibrosis59,60. Interestingly, Snail suppresses the expression of fructose-1,6-bisphosphatase (FBP1), a key enzyme gluconeogenesis61. Hence, c-Rel may promote glycolysis and epithelial reprogramming through combined direct regulation of Pfkfb3 and indirect Snail-mediated repression of FBP1.
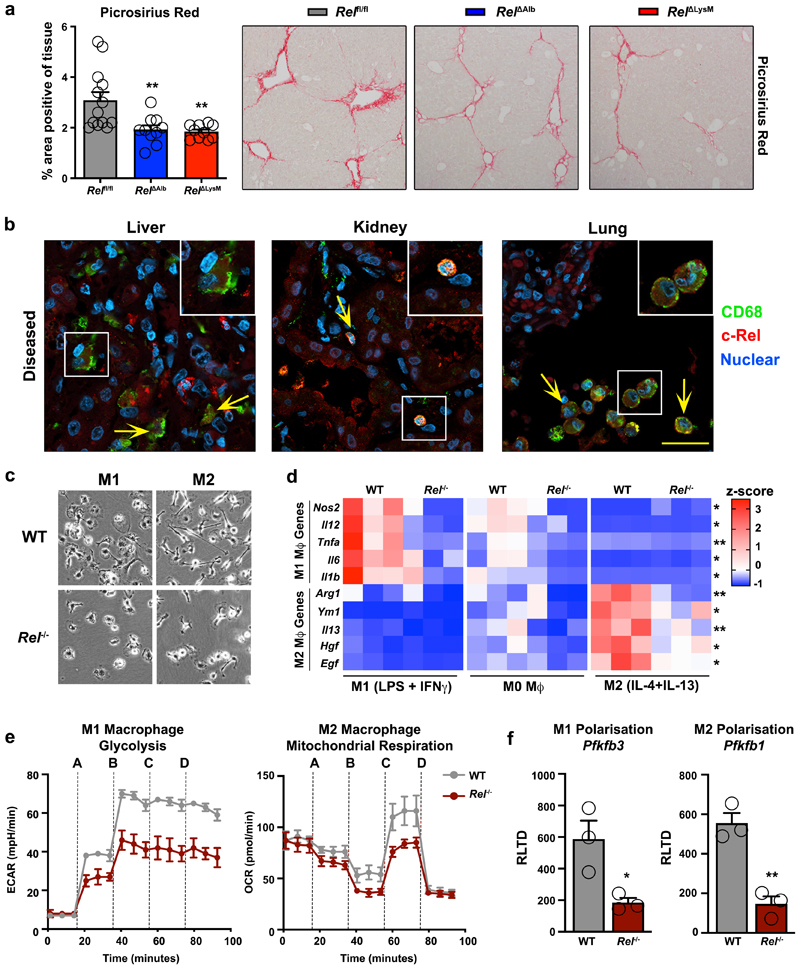
To determine if metabolic control of epithelial reprogramming by c-Rel is relevant in the context of a chronic tissue injury we determined the effects of selective hepatocellular deletion of c-Rel in the chronic CCl4 injury model. Using this model, liver fibrosis was compared between Relfl/fl and Rel ΔAlb genotypes and we also included a myeloid-specific deletion of Rel (RelΔLysM) for further comparison. Morphometric analysis (Figure 3a) of Picrosirius red (collagen) and αSMA stained liver sections (Extended data Figure 5a) evidenced a suppression of fibrosis in Rel ΔAlb compared to Relfl/fl mice, this confirming a requirement of epithelial c-Rel for optimal fibrogenesis. However, as also shown in Figure 3a, a similar protective response was also seen in RelΔLysM mice, this raising the potential for an unexpected profibrogenic role of c-Rel in macrophages. Of note, liver damage, as assessed by elevated serum ALT and AST, was comparable in all three genotypes (Supplementary Table 1).
Figure 3. c-Rel signalling in macrophages is pro-fibrogenic and regulates macrophage plasticity.
(a) Histological assessment and representative images of Picrosirius red (collagen) stained liver sections in chronic CCl4 injured in Relflfl, RelΔAlb (p value = 0.0064 ) and RelΔLysM (p value = 0.0035) mice. Data are mean ± s.e.m. in 10 mice/group, scale bar equals 100 microns. (b) Representative immuno-fluorescence images show c-Rel (red), CD68 (green) and nuclear (blue) staining in human diseased liver (n=11), kidney (n=13) and lung (n=8) sections. Yellow arrows denote co-localisaton of c-Rel and CD68. Scale bars equal 20 microns. (c) Representative bright-field images of WT and Rel-/- M1 and M2 polarised BMDMs in 3 independent cell isolations. Scale bar = 50 microns (d) Heat map shows mRNA expression of Nos2, Il12, Tnfa, Il6, Il1b, Arg1, Ym1, Il13, Hgf and Egf in M0, M1 and M2 polarised WT and Rel-/- BMDM respectively. (e) Graphs show glycolysis (extracellular acidification rate, ECAR) and mitochondrial respiration (oxygen consumption rate, OCR) in M1 and M2 polarised WT and Rel-/- BMDM respectively. Where A-D vertical lines refer to the administration of the following compounds: A – Glucose, B – Oligomycin, C- Pyruvate and FCCP, D – Rotenone and Antimycin A (f) Graphs show mRNA expression of Pfkfb3 (p value = 0.029) and Pfkfb1 (p value = 0.0031) in M1 and M2 polarised WT and Rel-/- BMDMs. Data are mean ± s.e.m of n=3 independent cell isolations. (a, d) P values were calculated using a two-way ANOVA with Tukey post-hoc t-test. (f) P values calculated using an unpaired two-side T test. P values equal *P<0.05 and **P<0.01. Asterisks on heatmaps denote significance between WT and Rel -/- macrophages in M1 or M2 responsive genes in line with the M1 or M2 stimulation. There is no significant difference between M0 macrphages from either genotype.
c-Rel is required for macrophage polarisation
High power images revealed nuclear expression of c-Rel in macrophages of fibrotic human liver, kidney and lung (Figure 3b and Extended data Figure 5b). As functions for c-Rel in macrophages are poorly defined, we asked if a deficiency of c-Rel impacts on macrophage differentiation. Remarkably, both M1 and M2 differentiation were defective in c-Rel-deficient bone marrow-derived macrophages (Figure 3c-d and Extended data Figure 5c). We next investigated if the impaired polarisation of c-Rel-deficient bone marrow-derived macrophages was associated with a failure of metabolic switches required for these macrophage polarisation processes. Assays for glycolytic rate and mitochondrial respiration revealed that Rel-/- macrophages are defective for increased respiration associated with M2 differentiation and for enhanced glycolysis associated with M1 differentiation (Figure 3e and Extended data Figure 5d). Pfkfb1 and Pfkfb3 are required for M2 and M1 states respectively56,62 and were expressed at diminished levels in Rel-/- macrophages differentiated to these functional states (Figure 3f). ChIP assays indicated the enrichment of c-Rel at the proximal promoter of Pfkfb1 in M2 macrophages (with no c-Rel binding in M0 or M1), while conversely c-Rel recruitment to the Pfkfb3 proximal promoter was only detected in M1 macrophages (Extended data Figure 5e). We conclude that c-Rel orchestrates metabolic reprogramming required for macrophage polarisation, this explaining the protection of RelΔLysM mice from fibrosis.
c-Rel combines in epithelial and macrophage compartments to promote fibrosis
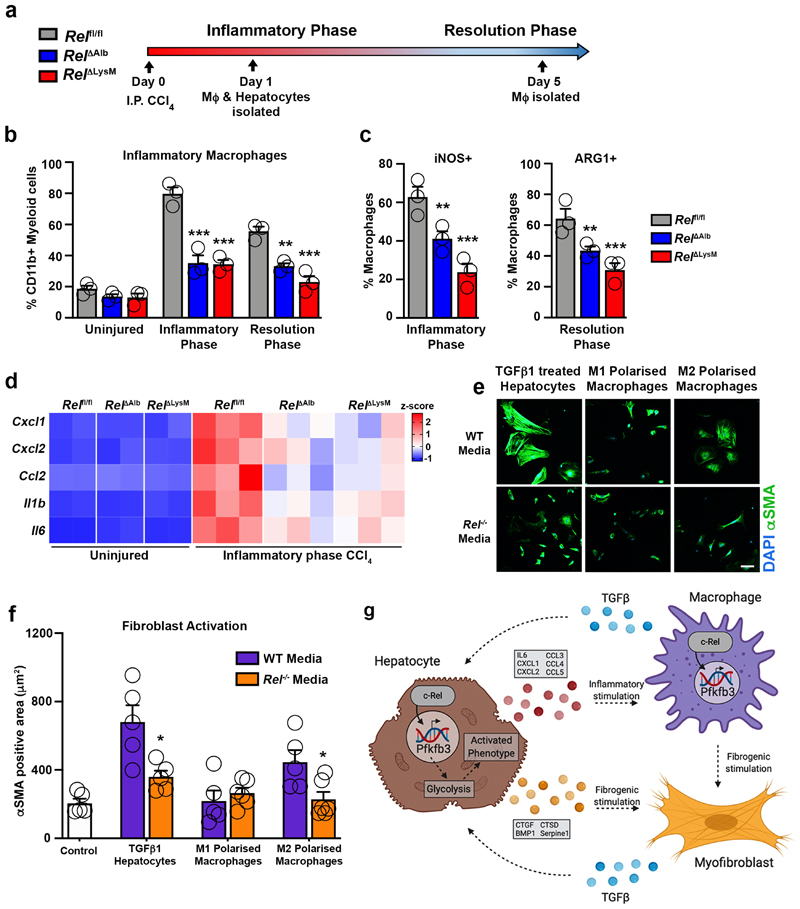
Epithelial cells and macrophages extensively crosstalk during wound healing to bring about effective inflammatory and regenerative responses39. We therefore asked the degree to which c-Rel is required for epithelial-macrophage signalling crosstalk. To address this, Relfl/fl, RelΔAlb and RelΔLysM mice were acutely injured with CCl4 prior to isolation of macrophages and hepatocytes during the inflammatory or resolution phases of wound healing (Figure 4a). Hepatic recruitment and polarisation of macrophages was as expected in acute CCl4 injured Relflfl mice but significantly impaired in RelΔLysM mice (Figure 4b-c). Less expected was that recruitment and polarisation of inflammatory macrophages isolated from CCl4 injured RelΔAlb mice was also diminished (Figure 4b-c). We next asked if c-Rel signalling in macrophages is required for hepatocyte inflammatory reprograming. Hepatocytes isolated from CCl4 injured Relflfl mice confirmed the anticipated expression of inflammatory genes which was suppressed in CCl4 injured RelΔAlb mice (Figure 4d). Similarly, expression of inflammatory markers was reduced in hepatocytes from RelΔLysM mice, indicating that monocyte/macrophage c-Rel is critical for hepatocytes to adopt a proinflammatory phenotype (Figure 4d). Normal wound healing and aberrant tissue fibrosis are governed by multi-directional cellular communication between epithelial cells, macrophages and fibroblasts/myofibroblasts within the wound healing niche. To evaluate the role of c-Rel signalling in hepatocytes and/or macrophages on hepatic stellate cell (HSC) activation, we cultured freshly isolated HSC with conditioned media (CM) collected from either WT or Rel-/- hepatocytes or M1 or M2 polarised macrophages. HSC activation, as measured by αSMA expression and cellular morphology, was accelerated for HSC exposed to CM from TGFβ1-stimulated WT hepatocytes or WT M2 macrophages but not WT M1 macrophages. Consistent with an attenuation of fibrogenic responses in vivo, CM from Rel-/- hepatocytes or M2 polarised macrophages failed to stimulate HSC activation (Figure 4e-f).
Figure 4. c-Rel regulates pro-fibrogenic epithelial-macrophage crosstalk to accelerates fibroblast activation.
(a) Schematic shows Rel fl/fl, Rel ΔLysM and Rel ΔAlb mice receiving CCl4 mediated acute liver injury. Mice were harvested at day 1 and day 5 post CCl4 injury during the inflammatory and resolution phases of wound healing (WH) respectively. (b) FACS quantification of the percentage (%) of CD11bHiF4/80Int inflammatory macrophages in uninjured liver and during the inflammatory (day 1) (p values = 0.0002 for Rel ΔAlb and 0.00012 Rel ΔLysM mice) and resolution (day 5) (p values = 0.0037 for Rel ΔAlb and 0.0002 Rel ΔLysM mice) phases of WH in acute CCl4 injured Rel flfl,Rel ΔAlb and Rel ΔLysM mice. (c) FACS quantification of the percentage (%) of iNOS+ (p values = 0.0033 for Rel ΔAlb and 0.0002 Rel ΔLysM mice) and ARG1+ (p values = 0.0043 for Rel ΔAlb and 0.0001 Rel ΔLysM mice) inflammatory macrophages during the inflammatory and resolution phases of WH respectively in acute CCl4 injured Rel flfl, Rel ΔLysM and Rel ΔAlb mice. Data in graphs are mean ± s.e.m of n=4 independent cell isolations. (d) Heatmap shows mRNA expression of inflammatory genes; Cxcl1, Cxcl2, Ccl2, Il1b and Il6 in primary hepatocytes isolated from Rel flfl, Rel ΔLysM and Rel ΔAlb mice during the inflammatory phase of WH. (e) Representative immuno-fluorescence images of αSMA (green) and nuclear (blue) staining, scale bar = 50 microns. (f) Graph showing quantification of αSMA stained area (f) in WT hepatic stellate cells cultured in media only (control) or conditioned media from WT or Rel-/- hepatocytes treated ± TGFβ1 (p value = 0.0153) or WT or Rel-/- M1 and M2 (p value = 0.024) polarised macrophages. Data are mean ± s.e.m of n=3 independent cell isolations. (b, c, f) P values were calculated using a two-way ANOVA with Tukey post-hoc t-test or an unpaired two-tailed t-test (* P <0.05, ** P <0.01 and *** P <0.001). (g) Model shows c-Rel-Pfkfb3 dependent paracrine epithelial-macrophage crosstalk driving fibroblast activation within the fibrogenic niche. Model created using biorender.
The fibrogenic properties of TGFβ1-stimulated hepatocytes can be at least in-part explained by their secretion of factors such as BMP1, CTGF, CTSD and Serpin 1 (Figure 2c and Extended data Figure 2d). A similar proteomic analysis was performed on the secretome of cultured WT and Rel-/- M0, M1 and M2 polarised macrophages which identified Galectin 1, Galectin 3, vimentin and MMP12 as profibrogenic factors that are expressed at significantly lower levels in the media of Rel-/- M2 polarised macrophages compared with WT (Extended data Figure 5f-g). Collectively, these data reveal a complex signalling network between hepatocytes, macrophages and HM, of which c-Rel signalling in both hepatocytes and macrophages is critical for the robust activation of HM and to evoke a fibrogenic response (Figure 4g).
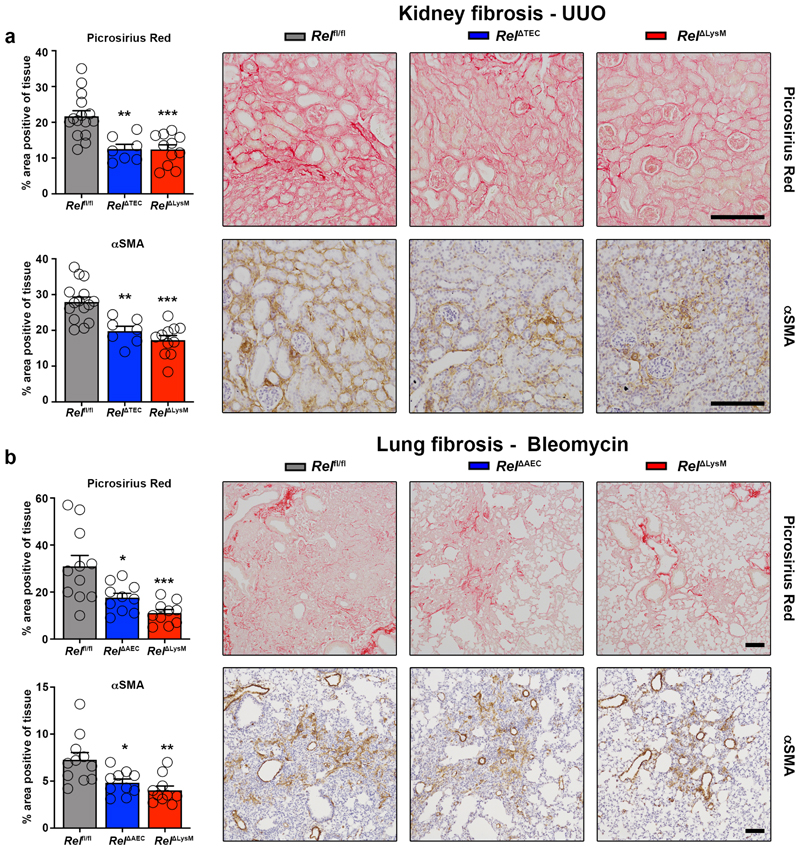
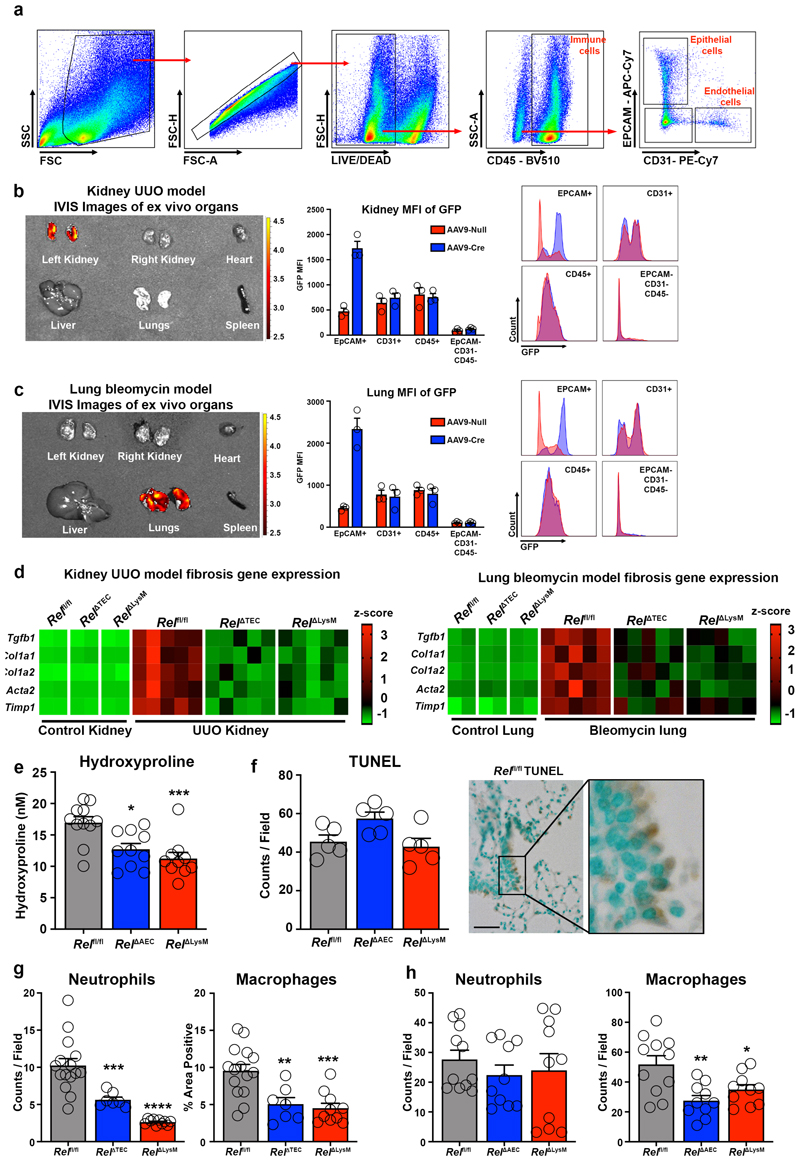
To determine the generality of requirement of epithelial and myeloid c-Rel for fibrogenesis we generated mice in which c-Rel was selectively deleted in kidney (RelΔTEC) or lung epithelium (RelΔAEC) by retrograde ureteric injection or intratracheal administration respectively, of an AAV9-CMV-Cre. Flow cytometry of isolated cells as well as ex vivo fluorescence imaging of whole organs confirmed epithelial-targeted recombination and expression of GFP (Extended data Figure 6a-c). We then employed the unilateral ureteric obstruction (UUO) and bleomycin models of chronic kidney and lung damage to compare response in epithelial, myeloid (RelΔLysM) and control backgrounds. Picrosirius red, αSMA staining and fibrogenic gene expression revealed similar protective effects of epithelial- or myeloid-targeted knockout of Rel in both the kidney and lung (Figure 5a-b and Extended data Figure 6d). In the lung we also observed a significant decrease in hydroxyproline levels in RelΔAEC and RelΔLysM mice despite comparable levels of tissue injury and cell death (Extended data Figure 6e-f). Noteworthy was that inflammatory infiltrates and markers were also reduced in the damaged RelΔTEC kidney and RelΔAEC lungs compared with controls, this supporting our proposal that c-Rel regulates inflammatory programming of the damaged epithelium (Extended data Figure 6g-h).
Figure 5. Epithelial or macrophage specific deletion of c-Rel limits renal and pulmonary fibrosis.
(a) Histological quantification and representative images of Picrosirius red stained collagen in UUO injured kidneys of Rel flfl, Rel ΔTEC (p value = 0.0013) and RelΔLysM (p value = 0.0002) mice and αSMA positive myofibroblasts in UUO injured kidneys of Rel flfl, Rel ΔTEC (p value = 0.002) and RelΔLysM mice (p value = 0.0005). (b) Histological quantification and representative images of Picrosirius red stained bleomycin injured lungs of Rel flfl, Rel ΔAEC (p value = 0.0155) and RelΔLysM (p value = 0.0004) mice and αSMA stained bleomycin injured lungs of Rel flfl, Rel ΔAEC (p value = 0.0161) and RelΔLysM (p value = 0.0013) mice. Data are mean ± s.e.m. in a minimum of 7 mice/group for the kidney and 10 mice/group for the lung. Scale bars equal 100 microns. All P values were calculated using a one-way ANOVA with Tukey post- hoc t-test. P values equal *P<0.05, **P<0.01 and ***P<0.001.
Dual hepatocyte and macrophage Rel deletion enhances suppression of fibrosis
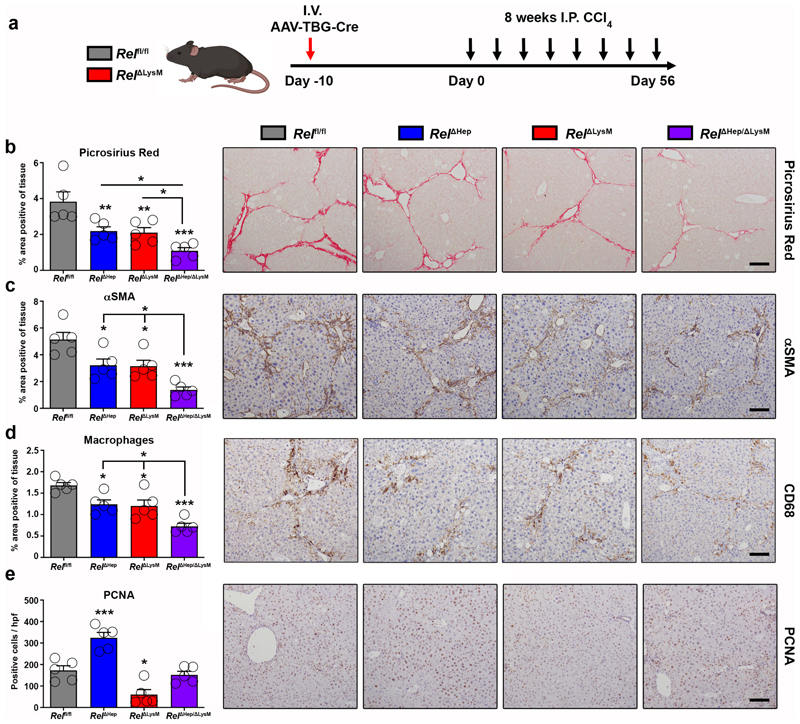
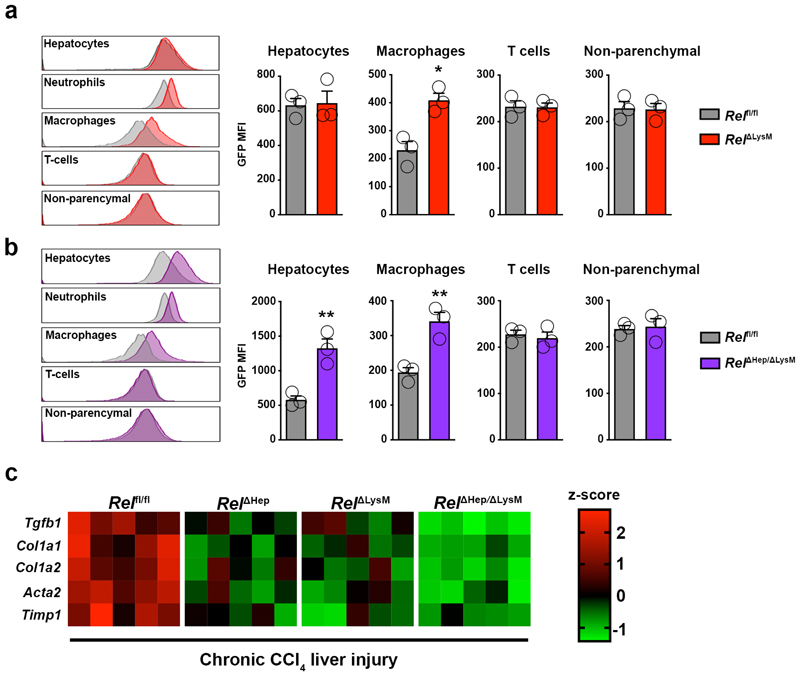
To determine the physiological impact of perturbation of combined c-Rel signalling in hepatocytes and macrophages we established an experimental protocol for dual in vivo knockout of c-Rel (Figure 6a). In this experiment, Relfl/fl and RelΔLysM mice were transduced with an AAV8-TBG-Cre virus to generate hepatocyte knockout either alone (RelΔHep) or in combination with macrophage specific deletion of c-Rel (RelΔHep/ΔLysM). GFP expression in hepatocytes and macrophages from these lines confirmed the anticipated genotypes (Extended data Figure 7a-b). We then subjected Relfl/fl, RelΔHep, RelΔLysM and RelΔHep/ΔLysM to chronic CCl4 liver damage for 8 weeks to induce fibrosis. Liver injury (elevated serum transaminases) was comparable in all four genotypes (Supplementary Table 1). As previously shown in Figure 3a, deletion of c-Rel in either hepatocytes or macrophages suppressed fibrosis as determined by quantification of Picrosirius red and αSMA stained liver sections as well as fibrogenic gene expression (Figure 6b-c and Extended data Figure 7c). Fibrosis and myofibroblast accumulation were further reduced in RelΔHep/ΔLysM mice indicative of an additive protective effect, consolidating our hypothesis that c-Rel signalling is required in both cellular compartments for induction of a robust fibrogenic response. By also quantifying CD68+ monocyte/macrophages we were able to show that underlying the dual protective effect of RelΔHep/ΔLysM knockout on fibrosis was an enhanced suppression of inflammation compared with RelΔHep and RelΔLysM livers (Figure 6d).
Figure 6. Figure 6. Epithelial and macrophage c-Rel signalling synergistically promote hepatic fibrosis but antagonistically regulate hepatic regeneration in mice.
(a) Schematic shows the timeline of intravenous injection administration of adeno-associated virus expressing Cre recombinase (AAV-TBG-Cre) to Rel flfl or RelΔLysM mice to create RelΔHep and RelΔHep/ΔLysM prior to chronic CCl4 injury. (b) Histological quantification and representative images of Picrosirius red stained sections from chronic CCl4 injured Rel flfl, RelΔHep (p value = 0.0093), RelΔLysM (p value = 0.0074) and RelΔHep/ΔLysM (p value = 0.0001) mice. (c) Histological quantification and representative images of αSMA stained sections from chronic CCl4 injured Rel flfl, RelΔHep (p value = 0.028), RelΔLysM (p value = 0.023) and RelΔHep/ΔLysM (p value = 0.0001) mice. (d) Histological quantification and representative images of CD68 (macrophages) sections from chronic CCl4 injured Rel flfl, RelΔHep(p value = 0.0316), RelΔLysM (p value = 0.0181) and RelΔHep/ΔLysM (p value = 0.00012) mice. (e) Histological quantification and representative images of PCNA stained sections from chronic CCl4 injured Rel flfl, RelΔHep (p value = 0.0008), RelΔLysM (p value = 0.0106) and RelΔHep/ΔLysM mice. Data are mean ± s.e.m. in 5 mice/group. Scale bars equal 100 microns. All P values were calculated using a one-way ANOVA with Tukey post-hoc t-test (* P <0.05, ** P <0.01, *** P <0.001).
Hepatocyte regeneration is subject to cell-specific regulation by c-Rel
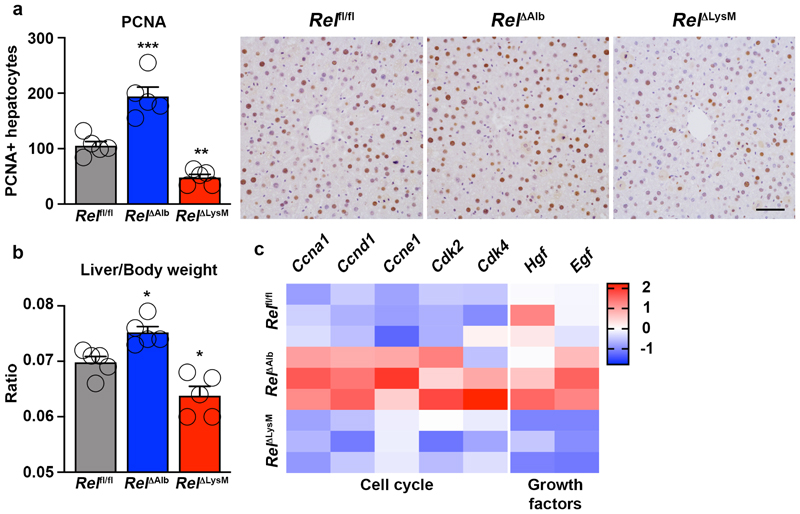
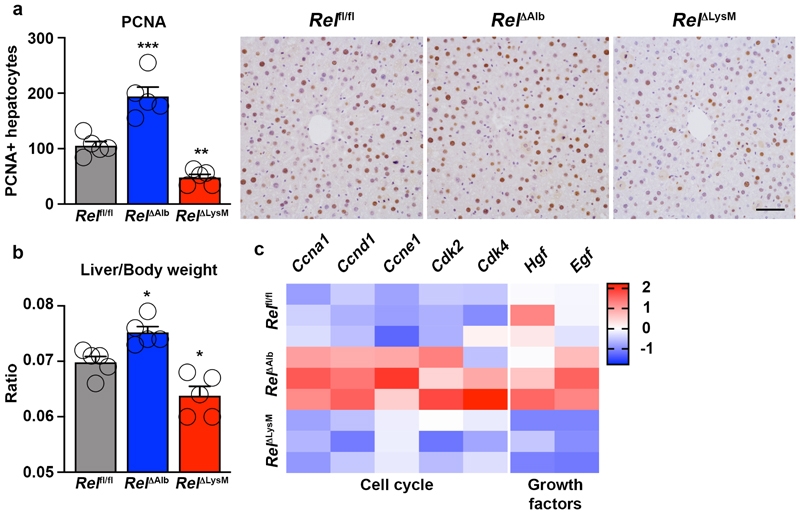
Quantification of numbers of PCNA positive hepatocytes in chronic CCl4 injured livers again confirmed the stimulatory effects of hepatocyte-targeted deletion of c-Rel (Figure 6e). But noteworthy was a suppression of hepatocyte proliferation in RelΔLysM mice relative to Relfl/fl controls. Moreover, in combined RelΔHep/ΔLysM knockouts numbers of proliferative hepatocytes were similar to those in Relfl/fl mice but intermediate between the measurements for RelΔHep and RelΔLysM livers (Figure 6e). To investigate these apparently contradictory observations, we performed a 70% partial hepatectomy in RelΔAlb and RelΔLysM mice. Consistent with data from acute toxic liver injury (Figure 1f), hepatocyte proliferation was significantly increased in regenerating RelΔAlb livers, however by contrast we observed suppressed hepatocyte proliferation in regenerating RelΔLysM livers (Extended data Figure 8a-b). Expression of cell cycle genes and the mitogenic factors HGF and EGF were elevated in the regenerating livers of RelΔAlb mice, however these mitogenic responses were suppressed in RelΔLysM mice (Extended data Figure 8c), these data being consistent with the regenerative phenotypes observed. These data support previous observations that hepatocyte regeneration is determined by signalling crosstalk from parenchymal and non-parenchymal cells and indicate cell-specific influences for c-Rel, with suppressive effects in hepatocytes and stimulatory properties in macrophages. Of note, we have previously reported that global deletion of c-Rel causes defective hepatocyte proliferation, this likely to reflect pro-regenerative functions for the NF-κB subunit in other resident non-parenchymal liver cells and infiltrating immune cells 63.
Pharmacological inhibition of c-Rel suppresses fibrosis
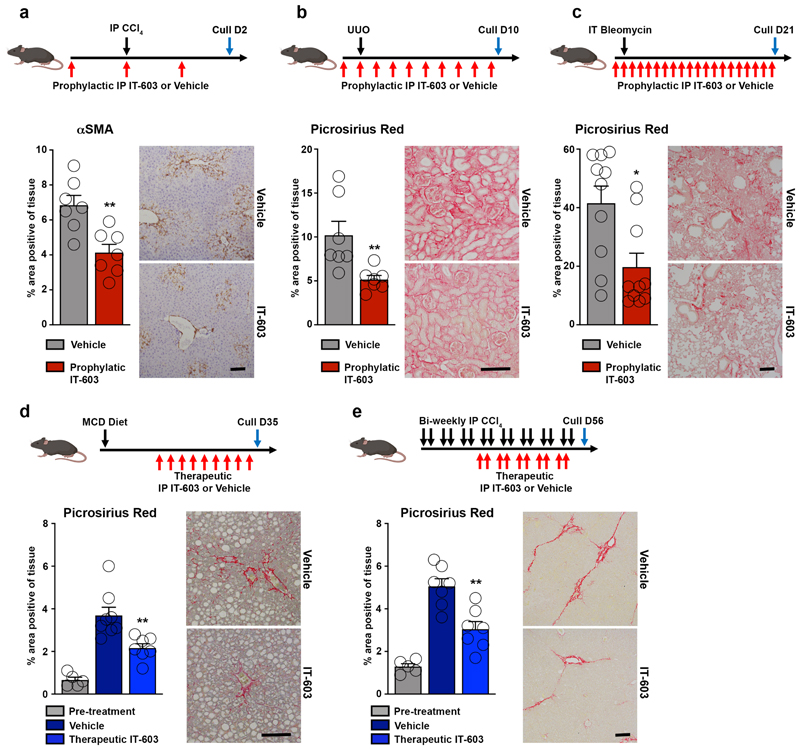
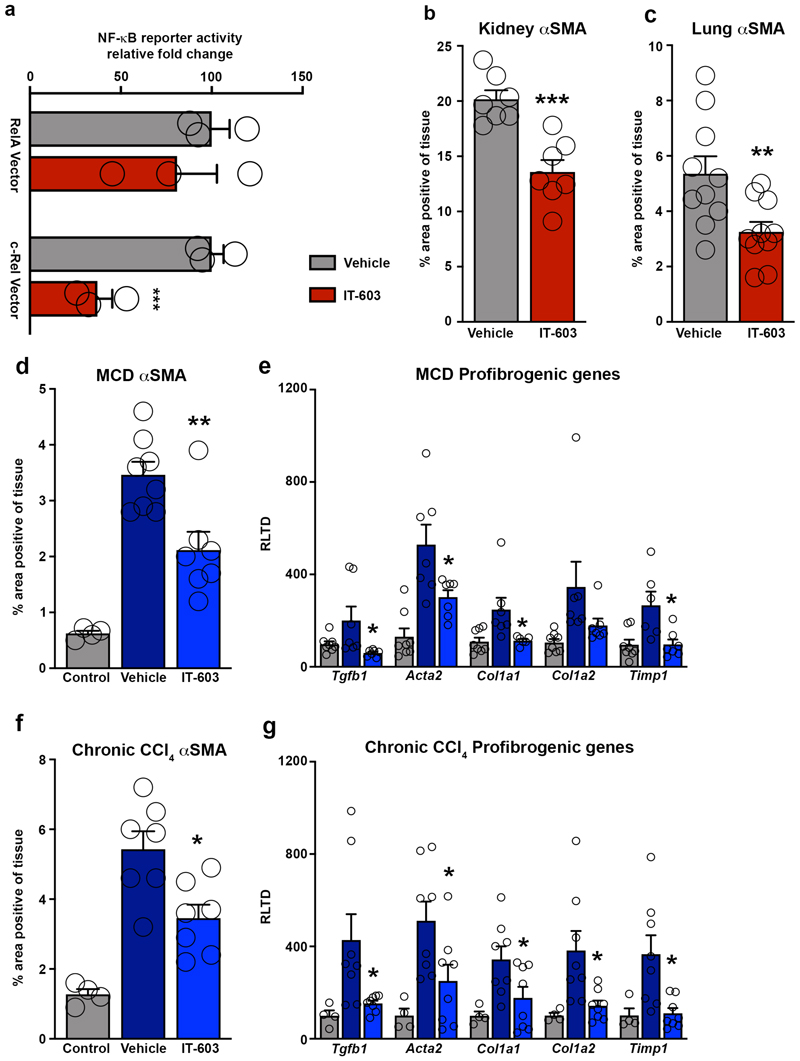
The data described above led us to investigate the therapeutic potential of targeting of c-Rel using the small molecule inhibitor IT-603 64. We began by showing that IT-603 selectively inhibits transcription from an NF-κB reporter construct co-expressed with a c-Rel expression vector, but of note the inhibitor had no effect on RelA-stimulated NF-κB activity (Extended data Figure 9a). We next determined the effects of intraperitoneal administration of IT-603 in models of acute liver (CCl4), chronic kidney (UUO) and chronic lung (bleomycin) damage. In all three models, IT-603 suppressed fibrogenesis characterised either by Picrosirius red stained collagen or histological examination of αSMA stained tissues (Figure 7a-c and Extended data Figure 9b-c). To evaluate the anti-fibrotic potential for c-Rel inhibition in established disease, IT-603 was administered therapeutically in the methionine choline deficient diet (MCD) model of steatosis-induced liver fibrosis. In addition, effects of IT-603 were determined in pre-established and progressive chronic CCl4-induced liver injury. In both models, ongoing hepatic fibrogenesis was significantly reduced by therapeutic intervention with IT-603 (Figure 7d-e, Extended data Figure 9d-g), this despite comparable levels of liver injury (Supplementary Table 1).
Figure 7. Pharmacological inhibition of c-Rel limits fibrogenesis in murine models of liver, kidney and lung injury.
(a-c) Diagrams show experimental timelines of CCl4, UUO or bleomycin induced liver, kidney or lung fibrosis ± prophylactic IT-603 (c-Rel inhibitor) therapy. Histological quantification and representative images of αSMA stained liver (p value = 0.0031) and Picrosirius red stained kidney (p value = 0.0099) or lungs (p value = 0.01) following their respective injury. Data are mean ± s.e.m. in 7, 7 and 10 mice/group for liver, kidney and lung respectively. (d-e) Diagrams show experimental timelines of methionine choline deficient diet (MCD) fed or chronic CCl4 induced liver fibrosis ± therapeutic administration of IT-603. Histological quantification and representative images of Picrosirius red stained MCD (p value = 0.0044) or chronic CCl4 (p value = 0.001) injured livers pre-treatment and ± therapeutic administration of IT-603. Data are mean ± s.e.m. in 5 pre-treatment mice, 8 vehicle treated MCD mice and 7 IT-603 treated MCD fed mice. Data are mean ± s.e.m. in 5 pre-treatment mice, 7 vehicle treated chronic CCl4 injured mice and 7 IT-603 treated chronic CCl4 injured mice. Scale bars equal 100 microns. (a-c) P values calculated using two-sided student T Test. (d-e) P values were calculated using a one-way ANOVA with Tukey post- hoc t-test. P values equal *P<0.05 and **P<0.01 versus vehicle treatment.
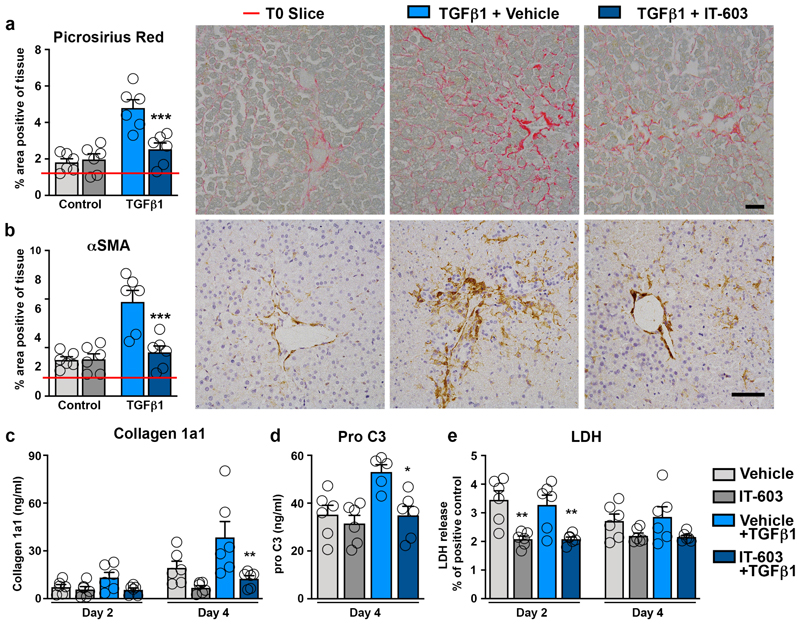
To translate these findings to humans we assessed the therapeutic effects of IT-603 in precision cut tissue slices (PCS). PCS cultures were established from the undamaged liver and kidney which were stimulated with TGFβ1 to induce fibrosis (Extended data Figure 10a)65. Of note, resident macrophages were present in the appropriate anatomical location in cultured PCS from both organs (Extended data Figure 10b). Remarkably, IT-603 ameliorated TGFβ1-induced fibrosis (Picrosirius red) and myofibroblast activation (αSMA positivity) in liver and kidney PCS (Figure 8a-b and Extended data Figure 10c-d). Quantification of soluble collagen 1a1 protein and the pro-fibrotic neo-epitope pro-C366, in the PCS media confirmed the potent anti-fibrotic properties of IT-603 in both human tissues (Figure 8c-d and Extended data Figure 10e-f). Moreover, these dramatic anti-fibrotic actions occurred in the absence of any obvious cytotoxicity (Figure 8e and Extended data Figure 10g). We conclude that pharmacological targeting of c-Rel with IT-603 is potently anti-fibrotic both in animal and human models of chronic tissue damage.
Figure 8. Pharmacological inhibition of c-Rel limits fibrogenesis in human precision cut liver slices.
(a-b) Representative images and histological quantification of (a) Picrosirius red (p value = 0.0009) and (b) αSMA (p value = 0.0006) stained liver slices ± TGFβ1 ± IT-603 therapy. Red line denotes the value for the T=0 slice. (c-d) Quantification of (c) soluble collagen (p value = 0.0023) and (d) the neo-epitope pro C3 (p value 0.0286) released from fibrotic liver slices ± IT-603 therapy. (e) Graph showing average LDH release in the media expressed as a percentage (%) of positive control (LDH levels in media from a PCS where maximal death was induced by multiple freeze/thaws – normalized to media volume) where p values = 0.0044 and 0.0004 for IT-603 and IT-603+TGFβ1 respectively. Images are representative of n=3 independent slice experiments. Data are mean ± s.e.m. and representative of slices generated from 3 independent donors performed in duplicate. Scale bars equal 100 microns. P values were calculated using two-way ANOVA with Tukey post- hoc t-test (*P<0.05, **P<0.01 and ***P<0.001).
Discussion
Fibrogenesis is an active and energy dependent process characterised by dynamic reprogramming of the phenotype and functions of multiple cell types. The concept of a “glycolytic switch” being required for cells to achieve a phenotypic change has emerged from a growing body of literature from investigators studying cell differentiation in a variety of cell lineages including T cells, dendritic cells and neurons67–70. In the context of fibrosis a role for metabolic reprogramming is also beginning to emerge, with recent reports that glycolysis inhibitors can suppress fibrosis in models of lung and renal damage71–73. However, the mechanisms for control of the glycolytic switch in wound healing and fibrosis are not well defined. Here we reveal that damage-induced activation of c-Rel in the liver stimulates expression of the glycolytic regulator Pfkfb3 in both hepatocytes and macrophages. In the absence of c-Rel/Pfkfb3 neither hepatocytes or macrophages are able to adopt a profibrogenic phenotypic state. Hence, the simultaneous targeted deletion of c-Rel in both of these cellular compartments was found to result in profound suppression of liver fibrosis. By genetically perturbing c-Rel/Pfkfb3 signalling in epitheial and macrophages we have illuminated a complex multicellular and multidirectional paracrine signalling network that drives progression of fibrosis in both the liver and kidney.
Our model for c-Rel/Pfkfb3 control of fibrosis proposes that it is required for hepatocytes to adopt an activated phenotype whereby they express a cytokine-rich secretome that promotes the fibrogenic activities of macrophages and activated HSC (Figure 4g). Recently, single cell RNAseq anlaysis of human liver identified six transcriptionally distinct hepatocyte populations, of which one cluster displayed a distinct inflammatory and fibrogenic state74. Similarly in a mouse model of cholestatic liver injury, scRNA-seq analysis identified four hepatocyte clusters directly linked to inflammatory processes75. We have demonstrated that TGFβ1 is likely to be pivotal for amplification of these hepatocyte phenotypes in the fibrogenic milieu. TGFβ1 is produced by activated macrophages and HSC and we have confirmed that it stimulates hepatocytes to secrete a variety of cytokines with the ability to promote paracrine positive feedback stimulation to both macrophages and HSC. We have shown how c-Rel is required for these TGFβ1-induced responses including hepatocyte secretion of CTGF, which is well known for its ability to enhance collagen production by activated HSC76–78. To note, CTGF has previously been described to be produced by hepatocytes by an incompletely defined TGFβ1-dependent mechanism79–81. Our work now highlights a critical role for c-Rel for TGFβ1 stimulation of hepatocytes. We propose that the combined activation of the c-Rel/Pfkfb3 metabolic axis in macrophages and hepatocytes maintains a network of paracrine signals that perpetuate inflammation and myofibroblast collagen production in the non-healing tissue microenvironment.
An extensive literature describes the role of classical canonical NF-κB (RelA/p50) signalling in tissue fibrosis14. Several independent research groups, including our own, have reported that global inhibition of canonical NF-κB inhibits fibrosis across multiple organs and disease models30,31,82–84. Canonical NF-κB is critically dependent on its upstream kinase IKKβ, the latter once being a major focus for drug development85,86. We have previously described how IKKβ inhibitors inhibit liver fibrosis and promote its regression by stimulating apoptosis of myofibroblasts87,88. However, IKKβ inhibition is associated with significant toxicities, these in-part reflecting the essential role of canonical NF-κB signalling in immunity and epithelial cell survival89–92. There is also concern over the non-NF-κB targets of IKKβ inhibitors which makes this approach less specific than originally anticipated93. In contrast to the extensive pharmacological investigation of IKKβ, drug targeting of the non-classical NF-κB transcription factors (c-Rel and RelB) has received surprisingly little attention85. Mice lacking c-Rel are viable and despite reports of functions for c-Rel in T cell development have a functional and healthy immune system without signs of autoimmune disease27. Hence, c-Rel emerges from our work as a promising new pharmacological target for the design of anti-fibrotic strategies. That rationale is strengthened by the recent discovery of molecules with specificity for inhibition of c-Rel DNA binding and transcriptional activity including the thiohydantoin IT-603 used in our studies and the napthalenethiobarbituate IT-90164,94. Our finding that IT-603 is a potent anti-fibrotic in human as well as murine pre-clinical models of liver and kidney fibrosis adds to the therapeutic opportunities for these molecules, which also includes cancer and transplantation94–96. Moreover, by defining the molecular mechanisms by which c-Rel stimulates fibrosis we provide a strong justification for further pre-clinical development of small molecule inhibitors of c-Rel and its downstream metabolic mediator Pfkfb3 for the prevention and treatment of tissue fibrosis.
Methods
Human Biopsies
Collection and use of human tissue was ethically approved The North East - Newcastle and North Tyneside 1 research committee. Human kidney tissue from surgical resections was obtained under full ethical approval (REC 13/EM/0311) and patient consent. Normal human kidney tissue was obtained from patients undergoing surgical resection. Renal biopsies were obtained from patients diagnosed with either focal segmented glomerulosclerosis (FSGS) or diabetic nephropathy.
Human liver tissue from surgical resections were obtained under full ethical approval (H10/H0906/41) and through the CEPA biobank (17/NE/0070) and used subject to patients written consent. Liver disease cohort consisted of patients diagnosed with alcoholic liver disease, non-alcoholic fatty liver disease, non-alcoholic steatohepatitis and primary biliary cirrhosis. Control human liver tissue was collected from patients undergoing cancer surgical resections.
Diseased human lung tissue was collected from patients undergoing either double or single lung transplants under full ethical approval (REC 11/NE/0291) and informed written consent from all study patients. Control human lung tissue was obtained from unused transplant lungs under full ethical approvals and informed consent from both donor families and lung transplant recipients (REC 11/NE/0342).
Mice
All animal experiments were approved by the Newcastle Ethical Review Committee and performed under a UK Home Office licence in accordance with the ARRIVE guidelines. Experiments using Pfkfb3 fl/fl mice97 were performed collaboratively in the laboratory of Peter Carmeliet (Leuven) and approved by the Newcastle Ethical Review Committee and the Animal Ethics Committee of KULeuven. Mice were housed in pathogen-free conditions and kept under standard conditions with a 12-hour day/night cycle and access to food and water ad libitum, at a temperature between 20-24°C (average 21(°C) and a humidity of 55%. Power calculations were not routinely performed; however, animal numbers were chosen to reflect the expected magnitude of response taking into account the variability observed in previous experiments. In vivo and in vitro experiments were performed on either C57BL/6 J Wild-Type (WT) control mice or c-Rel knockout mice (Rel -/-) on a C57BL/6 J background. Rel fl/fl were crossed with Alb-cre+/- or LysM-cre+/- or Lrat-cre+/- mice to generate Alb-cre+/- Rel fl/fl (Rel ΔAlb), LysM-cre+/- Rel fl/fl (Rel ΔLysM) or Lrat-cre+/- Rel fl/fl (RelΔLrat) mice (Jax labs stock No: 02434198, stock No: 004781 and stock No: 00357499. Relfl/fl mice are genetically engineered to express GFP upon Cre-mediated recombination. Adeno-associated virus mediated Cre recombinase delivery was used to target the epithelial cells of the liver, kidney and lung. Briefly, to deplete c-Rel or Pfkfb3 in hepatocytes, Rel fl/fl or Rel ΔLysM or Pfkfb3fl/fl mice received a single intravenous tail vein injection of 1x10¹¹ p.f.u. of AAV8-TBG-Cre to generate Rel ΔHep, Rel ΔHep/ΔLysM and Pfkfb3 Δhep mice respectively. To deplete c-Rel in epithelial cells in the kidney Rel fl/fl mice received a retrograde ureteric injection of 5x10⁸ p.f.u. of AAV9-CMV-Cre at the time of UUO surgery generating Rel ΔTEC mice. To deplete c-Rel in the epithelial cells of the lung Rel fl/fl mice received 5x10⁸ p.f.u. of AAV9-CMV-Cre via intratracheal administration to generate Rel ΔAEC mice. Control mice received an equal dose of either AAV8-TBG-null or AAV-CMV-Null.
Organ injury and fibrosis models
Animals used were aged within 8 to 12 weeks old at the start of the experiments. Liver injury and fibrosis was induced using the carbon tetrachloride model. To induce acute liver injury, male mice received a single intraperitoneal dose of CCl4 at 2μl/g body weight (CCl4:olive oil at 1:1 [vol/vol]). To induce liver fibrosis, male mice received biweekly intraperitoneal injections of CCl4 at 2μl/g body weight (CCl4:olive oil at 1:3 [vol/vol]) for 8 weeks. Kidney fibrosis was induced using the unilateral ureteral obstruction (UUO) model. Briefly, following a laparotomy, the left ureter of female mice was ligated and cut under general anaesthesia. Lung fibrosis was induced using the bleomycin model. Briefly, male mice received a single intratracheal dose of either saline or bleomycin (0.015U) under general anaesthesia. Prophylactic intervention utilising the c-Rel small molecule inhibitor IT-603 (Calbiochem) was performed using daily intraperitoneal injections of either vehicle (DMSO) or IT-603 24mg/kg starting 24 hours prior to CCl4 and on the day of bleomycin administration or UUO surgery. Therapeutic intervention in the MCD model utilising IT-603 or a DMSO control was commenced after 2 weeks of being on the diet. Mice received the 3 doses a week of the therapy for the duration of the experiment. Therapeutic intervention in the chronic CCl4 model utilising IT-603 or a DMSO control was commenced after 3 weeks of CCl4 injury. Mice received the therapy the day before CCl4 administration. Partial hepatectomy was performed on male mice aged 12 to 14 weeks old. Briefly, under isoflurane general anesthesia, following a laparotomy the left and median lobes were exposed, ligated and excised100. In all surgical models appropriate pain relief was provided.
Histology and Immunohistochemistry
Formalin fixed, paraffin embedded tissue sections were stained with 0.1% Picrosirius red and H&E using established protocols. Immunohistochemistry was performed on deparaffinised sections by first blocking endogenous peroxidase activity using 0.6% hydrogen peroxide/methanol solution. Antigen retrieval was performed using antigen unmasking solution (Vector) for αSMA 1:1000 (F3777 Sigma), CD68 1:200 (OABB00472 Aviva Systems Biology), CTGF 1:100 (ab6992 Abcam), Snail 1:50 (ab53519 Abcam), PFKFB3 1:50 (ab181861 Abcam), PCNA 1:4000 (ab18197 Abcam) and combined antigen unmasking solution and 0.2% trypsin for c-Rel 1:200 (SC-71 Santa Cruz) and NIMP-R14 1:100 (Ab 2557 Abcam). Endogenous avidin and biotin were blocked for 20 minutes using an Avidin/Biotin Blocking Kit (Vector Laboratories). Non-specific binding was blocked using 20% swine serum for 30 minutes and then the primary antibody was added overnight at 4°C. The next day slides were washed and incubated with biotinylated swine anti-rabbit 1:200 (eo353 Dako), biotinylated goat anti-fluorescein 1:300 (BA-0601 Vector) or goat anti-rat 1:200 (STAR80B Serotec). Slides were then washed and incubated with Vectastain Elite ABC Reagent. Staining was visualised using DAB peroxidase substrate kit and counterstained with mayers haematoxylin and then mounted. (TdT)-mediated dUTP nick end (TUNEL) labelling was carried out using the In-Situ Cell Death Detection kit (Merck, 11684817910) according to the manufacturers’ protocol. Liver and lung tissue sections were analysed at 100x whereas kidney cortex was imaged at 200x using a Nikon Eclipse Upright microscope and NIS-Elements BR analysis software. A minimum of twelve consecutive non-overlapping fields of liver, kidney and lung tissue were analysed per stain per mouse. For human sections a minimum of 5 fields were analysed per biopsy.
Immunofluorescence staining
Immunofluorescence was performed on deparaffinised sections. Antigen retrieval was performed using combined heat-mediated antigen unmasking solution (Vector) and then 0.2% trypsin at 37°C for 25 minutes. Non-specific binding was blocked using 10% normal goat serum in TBS-T (Vector) for 1 hour followed by 1x casein (Vector) for 1 hour. The c-Rel 1:50 (SC-71 Santa Cruz) and CD68 1:50 (clone KP1, thermofisher) primary antibodies were diluted in 10% normal goat serum in TBS-T and then slides were incubated in a humidified chamber overnight at 4°C. The next day slides were washed in TBS-T and then incubated with secondary antibodies; Alexa 594 donkey anti-rabbit (thermofisher) and Alexa 647 donkey anti-mouse (thermofisher) diluted 1:200 in 10% normal goat serum in TBS-T for 2 hours. Slides were then washed in TBS-T and stained with Hoechst stain for 15 minutes prior to mounting in vector mounting solution. Slides were imaged using a Zeiss LSM800 with Airyscan using Zen software.
Immunofluorescence was performed on 4% paraformalydehyde fixed murine hepatic stellate cells cultured in chamber slides. Cells were permeabilised with 0.2% saponin, blocked with 1% bovine serum albumin (BSA) to limit non-specific binding then washed in TBS-T. The FITC conjugated αSMA (F3777 Sigma) primary antibody was diluted 1:1000 in TBS-T 1% BSA and then incubated at room temperature for 1 hour. Slides were then washed in TBS-T and stained with Hoechst stain for 15 minutes prior to mounting in vector mounting solution. Slides were imaged at 20x magnification using a Zeiss LSM800 with Airyscan. Images were analysed using Zeiss Zen software image analysis nod).
RNAScope
In situ mRNA hybridization was performed on normal and fibrotic murine liver (chronic CCl4) and kidney (day 10 UUO) sections using RNAscope LS probes for Snail1 and PPIB control (451218 and 313918); Advanced Cell Diagnostics) as per the manufacturer’s instructions.
Precision Cut Slices
Tissue cores were generated using a 8mm Stiefel biopsy punch and then transferred to a metal mould and submerged in 3% low geling temperature agarose and allowed to set. Agarose embedded tissue cores were then cut using a Leica VT1200S microtome (Leica Biosystems, UK) to produced tissue slices (8 micron diameter and 250 micron depth) which were then cultured in BioR plates in our patented bioreactor platform patent (PCT/GB2016/053310). Liver PCLS were cultured in Williams E media supplemented with 1% penicillin and streptomycin, glutamine, 100mM dexamethasone, insulin trasnferrin-selenium X and 2% fetal bovine serum. Kidney slices were generated as above and cultured in DMEM-F12 (Gibco) supplemented with REGM SingleQuot Kit (Lonza) and 1% penicillin/streptomycin and L-glutamine. Human liver and kidney slices were treated 10 ng TGFβ1 to induce fibrosis. Tissue slices were treated ± 20 μM IT-603 c-Rel inhibitor. Murine liver PCS were generated from WT and Rel-/- mice were cultured ± 10ng TGFβ1 ± 50ng CTGF for 72 hours. All PCS were cultured at 37°C supplemented with 5% CO2 and media was changed daily.
Cell Isolation
Murine hepatocytes were isolated using a two-step perfusion method. Under terminal anaesthesia using pentobarbitol, mice underwent a laparotomy, the inferior vena cava was then cannulated and the superior vena cava was clamped to achieve retro-perfusion of the liver using the portal vein as an outlet. The liver was perfused sequentially with buffer a (Krebs Ringer buffer and EDTA) and then buffer B (Krebs Ringer buffer, CaCl2 and 1mg/ml Collagenase B) at a flow rate of 7mls per minute. In situ liver digestion was performed using collagenase from Clostridium histolyticum (Sigma). Post perfusion, the liver capsule was torn and hepatocytes were isolated by gently agitating the perfused liver in Krebs-ringer buffer and then sepreated into a single cell suspension using a 70-μm cell strainer. Hepatocytes were collected by three rounds of centrifugation (50g for 3 minutes) followed by washes in Krebs-Ringer buffer. A hepatocyte enriched fraction was obtained using a 40% Percoll density gradient (250g for 6 minutes). Pelleted hepatocytes were resuspended in 10% FCS Williams E and then cultured for subsequent experiments.
Bone marrow derived macrophages were isolated from the femur and tibia of WT and Rel -/- mice. Briefly, bone marrow was extracted by flushing the bones with 5% FCS HBSS-after which the cell suspension was washed and placed onto a 62% Percoll gradient and centrifuged (1000g for 30 minutes). The pellet contained polymorphonuclear cells and the interface mononuclear cells, which were then cultured for 10 days in RPMI-1640 media containing 10ng/ml MCSF to promote differentiation into mature macrophages. Mature macrophages were stimulated 100ng/ml LPS and 50ng/ml IFNγ to induce an M1 phenotype or 10ng/ml IL-4 and 10ng/ml IL-13 to induce an M2 phenotype. Control M0 macrophages received a complete media change without the addition of any additional factors.
Total leukocytes for flow cytometry were prepared from the livers of control or injured mice. First, the liver was diced and then digested in RPMI supplemented with DNase and Collagenase B for 1 hour at 37°C. The cell suspension was then filtered through a 70-μm cell strainer and then layered onto a 33% Percoll density gradient and centrifuged (1000g for 20 minutes) the cell pellet was resuspended in ACK lysis buffer to eliminate red blood cells prior to staining. The non-parenchymal fraction located at the Percoll interface was used for flow cytometric validation of conditional knockout mice.
Murine hepatic stellate cells (HSC) were isolated as previously described101 and grown in Nunc™ Lab-Tek™ II Chamber Slide™ System (thermoscientific) with complete media; Dulbecco's modified Eagle's medium containing 100 U/ml penicillin, 100 μg/ml streptomycin, 2 mmol/L L-glutamine, and 16% foetal calf serum. After 3 days in culture, HSC were simulated for 24 hours with media only (control) or conditioned media collected from either WT or Rel-/- hepatocytes stimulated with 10ng TGFβ, or WT or Rel-/- M1 or M2 polarised bone marrow derived macrophages. Conditioned media was passed through a 0.3 micron filter prior to a 1:1 dilution in complete DMEM and addition to the qHSC. Cells were then fixed in 4% paraformalydehyde ready for immunofluorescence staining.
Proximal tubule epithelial cells (PTECs) were isolated from the kidneys of WT and Rel-/- mice. Briefly, the cortex was the minced and digested with 1mg/ml collagenase IV at 37°C and then passed through a 40μm cell. The digest was then layered onto a discontinuous Percoll gradient with densities of 1.07 and 1.04 g/ml and centrifuged at 3000rpm for 30 minutes at 4°C. The middle layer containing PTECs was washed in RPMI. PTEC were then resuspended in DMEM/F-12 supplemented with REGM SingleQuot kit (Lonza), 0.5% foetal calf serum, 100U/ml penicillin and 100ug/ml streptomycin. PTECs were seeded onto collagen coated plates for experiments.
All cells were maintained in an incubator at 37°C in an atmosphere of 5% CO2.
Flow cytometry
Single cell suspensions were first resuspended in LIVE/DEAD™ Fixable Violet Dead Cell Stain (ThermoFisher) and then Fc blocked (CD16/32). Cells were then resuspended in FACS buffer (PBS 1% FCS) containing the antibodies for surface staining as listed in (Supplementary Table 2). Staining of intracellular antigens was performed by fixing the surface stained cells in 4% paraformaldehyde followed by permeabilisation using Perm Wash (BD Biosciences). Cells were then resuspended in Perm Wash containing the antibodies for intracellular staining. Cells were read on a FACSCanto II using FACSDIva software version 8 and analysed using FlowJo software version 10.
Seahorse
Mature bone marrow derived macrophages were seeded onto the seahorse cell culture microplate and the polarised using a combination of either LPS and IFNγ or IL-4 and IL-13 to generated M1 and M2 macrophages respectively. The injection ports were then loaded with the following compounds: A 2.5M (45%) glucose, B 5mM oligomycin A, C 5mM FCCP and 100mM sodium pyruvate, D 5mM antimycin A and 5mM rotenone. Seahorse metabolic flux assay was then performed according the manufacturer’s instructions with 3 rounds of 2 minute mix and 3 minute measure times. Flux assay measurements were normalised to total protein content determined by Bradford assay.
Enzyme-linked immunosorbent assay
Media samples collected from precision cut human liver, kidney and lung slices treated with IT-603. Quantifications of soluble human collagen 1A1 (COL1A1; DY6220, R&D systems) were performed as per manufacturer’s instructions. Levels of pro-C3 ELISA was performed on undiluted media samples (Nordic Bioscience). Quantification of mouse connective tissue growth factor (CTGF; LS-F21342, LSBio) in the culture media collected from WT and Rel-/- hepatocytes stimulated ± TGFβ1, Pfkfb3fl/fl and Pfkfb3 Δhep hepatocytes stimulated ± TGFβ1 and WT hepatocytes stimulated ± TGFβ1 and treated PFKFB3i was performed as per manufacturer’s instructions.
Colorimetric assays
Lactate dehydrogenase (Thermo Fisher), L-Lactate (Abcam ab65331) and Glucose (Abcam ab65333) assay kits were performed as per manufacturer’s instructions. Serum transaminase quantification was performed at the chemical pathology department at the Royal Victoria infirmary according to standard protocols.
Protein preparation for mass spectrometry
For secretome analysis proteins were precipitated from 1.5 ml of conditioned media (hepatocyte secretome) or 1 ml of conditioned media (macrophage secretome) using a chloroform/methanol protein precipitation. Protein pellets were resuspended in a final volume of 25 µl SDS lysis buffer (5% SDS, 50 mM triethylammonium bicarbonate (TEAB) pH 7.5). Protein concentration was determined by the bicinchoninic acid assay (BCA). A total of 2.4 µg protein (hepatocyte secretome) or 1 µg (macrophage secretome) was reduced by incubation with 5mM tris(2-carboxyethyl)phosphine (TCEP) for 15 minutes at 37°C, and subsequently alkylated with 40 mM iodoacetamide for 30 minutes at room temperature in the dark. Protein digestion was performed using the suspension trapping (S-Trap™) sample preparation method using the manufacturer’s guidelines (ProtiFi™, Huntington NY). Briefly, 2.5 µl of 12% phosphoric acid was added to each sample, followed by the addition of 2 µg trypsin. This was added to 165 µl S-Trap binding buffer (90% methanol in 100mM TEAB, pH 7.1) in the S-Trap Micro spin column. The samples were centrifuged at 4,000 x g for 1 minute until all the solution passed through the filter. Each S-Trap Mini-spin column was washed with 150 µl S-trap binding buffer by centrifugation at 4,000 x g for 1 minute. This process was repeated for a total of four washes. 25 µl of 50 mM TEAB, pH 8.0 containing 0.5 µg trypsin was added to each sample, followed by proteolytic digestion for 3 hours at 47°C using a thermomixer (Eppendorf) without shaking. Peptides were eluted with 50 mM TEAB pH 8.0 and centrifugation at 1,000 x g for 1 minute. Elution steps were repeated using 0.2% formic acid and 0.2% formic acid in 50% acetonitrile, respectively. The three eluates from each sample were combined and dried using a speed-vac before storage at -80°C.
Quantitative mass spectrometry
Peptides were dissolved in 5% formic acid, and each sample was independently analysed on an Orbitrap Fusion Lumos Tribrid mass spectrometer (Thermo Fisher Scientific), connected to a UltiMate 3000 RSLCnano System (Thermo Fisher Scientific). Peptides were injected on an Acclaim PepMap 100 C18 LC trap column (100 μm ID × 20 mm, 3 μm, 100 Å) followed by separation on an EASY-Spray nanoLC C18 column (75 ID μm × 500 mm, 2 μm, 100 Å) at a flow rate of 300 nl min-1. Solvent A was water containing 0.1% formic acid, and solvent B was 80% acetonitrile containing 0.1% formic acid. The gradient used was as follows: solvent B was maintained at 3% for 5 minutes, followed by an increase from 3 to 35% B in 120 min, 35-90% B in 0.5 min, maintained at 90% B for 4 minutes, followed by a decrease to 3% in 0.5 min and equilibration at 3% for 10 minutes. The Orbitrap Fusion Tribrid mass spectrometer was operated in data dependent, positive ion mode. Full scan spectra were acquired in a range from 400 m/z to 1600 m/z, at a resolution of 120,000, with an automated gain control (AGC) of 4e5 and a maximum injection time of 50 ms. Precursor ions were isolated with a quadrupole mass filter width of 1.6 m/z and HCD fragmentation was performed in one-step collision energy of 30%. Detection of MS/MS fragments was acquired in the linear ion trap in rapid mode using a Top 3s method, with an AGC target of 1e4 and a maximum injection time of 45 ms. The dynamic exclusion of previously acquired precursors was enabled for 35 s with a tolerance of +/-10 ppm.
Mass spectrometry data analysis
All spectra were analysed using MaxQuant 1.6.6.0 and searched against a SwissProt Mus musculus fasta file (25,691 entries, downloaded 14/09/2018). Peak list generation was performed within MaxQuant and searches were performed using default parameters and the built-in Andromeda search engine. The following search parameters were used: first search peptide tolerance of 20 ppm and second search peptide tolerance 4.5 ppm. Cysteine carbamidomethylation was set as a fixed modification and oxidation of methionine was set as variable modification. A maximum of two missed cleavage sites were allowed. False Discovery Rates were set to 1% for both peptides and proteins. LFQ intensities were calculated using the MaxLFQ algorithm from razor and unique peptides with a minimum ratio count of two peptides across samples. Statistical analysis was performed using R Studio (version 1.1.456.0). The data was first filtered to remove proteins that matched to a contaminant or a reverse database, or which were only identified by site. Only proteins identified by a minimum of 2 unique peptides were retained. LFQ intensity values were log2 transformed, and data filtered to contain at least 2 valid values in each group of the comparison being tested. The R package LIMMA was used for statistical analysis, where proteins with a p-value ≤ 0.05 were considered as statistically significant. Proteins were classified as unique if they were detected in all replicates of at least one group and none of the replicates of at least one other group.
Meso Scale Discovery
The cytokines Il-6, Cxcl1, Cxcl2, Cxcl10, Ccl2, Ccl3, Ccl4 and Ccl5 were quantified in conditioned media collected from WT and Rel-/- hepatocytes stimulated s IL-1β or TGFβ1, WT and Pfkfb3-/- hepatocytes stimulated s TGFβ1 or WT hepatocytes stimulated s TGFβ1 and treat PFKFB3i using a custom U-Plex MSD panel according to the manufacturer instructions.
Hydroxyproline assay
Tissue samples were hydrolysed in 1ml 6N HCl acid overnight at 110°C. Hydroxyproline standards were made up from 4mg/ml Calbiochem stocks. 20μl of the samples were then pipetted in triplicate. Solutions A and B were then prepared as follows: A. 0.282g Chloramine T-hydrate, 2ml water, 4ml isopropanol, 16ml Citrate Acetate buffer. Citrate acetate buffer consisted of 5% w/v Citric Acid, 1.2% w/v Glacial Acetic Acid, 7.24% w/v Sodium Acetate, 3.4% w/v Sodium Hydroxide with sterile water added for a complete volume of 200ml. B. 2.5g p-dimethylaminobenzaldehyde, 9.3ml Isopropanol, 7.3ml Perchloric acid. 100μl of solution A was added to each well of the 96 well plate and allowed to oxidise at room temperature for 30 minutes. 100μl of Solution B was the added to each well. The plate was then incubated at 60°C for 30 minutes and then measured using a spectrophotometric plate reader at 570nm.
RNA isolation, cDNA synthesis and RT-PCR
RNA was extracted from tissues using the QIAGEN RNeasy Mini kit (QIAGEN) according to the manufacturer’s instructions. RNA was then treated with DNase and then used to synthesise cDNA using the GoScript Reverse Transcription System (Promega). Real time PCR was performed using SYBR Green jumpstart ready mix and the primers listed in (Supplementary Table 3).
Chromatin Immunoprecipitation (ChIP) assay
Cross-link chromatin was prepared from WT hepatocytes after 4-hour treatment with TGFβ1 or M0, M1 and M2 polarised WT macrophages. ChIP was performed using 50μg of cross-linked chromatin (sheared by sonication to ~500bp fragments) per reaction and 10μg of antibody to c-Rel (SC-71 Santa Cruz) or Rabbit IgG control (Abcam) for immunoprecipitation. 3000bp sequence upstream of the transcription start site was analysed in silico using Promo (available via the ALGGEN server, Polytechnic University of Catalonia, Barcelona, Spain) for potential transcription factor binding sites. ChIP primers were then designed to amplify Snail, Pfkfb1 or Pfkfb3 promoter regions and the primers listed in (Supplementary Table 4).
Transient transfection and luciferase assay
U937-3xNF-kB-luc reporter cells (which express firefly luciferase driven by 3 NF-kB consensus sequences) were transiently transfected with either RelA or c-Rel pcDNA3 expression vectors using the non-liposomal Effectene kit (Qiagen) for 48h, according to manufacturer’s instructions. Luciferase assays were performed using the luciferase kit (Promega) and luciferase activity was normalised to protein concentration.
Statistical Analysis
Results are presented as means ± s.e.m. Graphpad prism version 8, was used to perform unpaired t-test or analysis of variance with a Tukey’s post hoc test for unmatched samples. For matched cell cultures either a paired t-test or paired Two-way analysis of variance with a Tukey’s post hoc test. * P<0.05, ** P<0.01, *** P<0.001 or **** P<0.0001 was considered statistically significant.
Extended Data
Extended Data Fig. 1. c-Rel correlates with disease progression in chronic kidney disease and is elevated in chronic lung disease. Investigation of the cell specific actions of c-Rel in preclinical models of liver injury.
(a) Graph showing average percentage area of c-Rel stained tissue in (n=5) normal lung and (n=7) chronic obstructive pulmonary disorder (COPD) (P value = 0.0003). (b) Graph showing average percentage area of c-Rel stained tissue in (n=5) normal human kidney and patients with stable (n=4, p value =0.0185) or progressive kidney disease (n=8, p value = 0.003). Normal vs progressive p value <0.0001) (c) Graphs showing the Mean Fluorescence Intensity (MFI) of GFP in hepatocytes (p value = 0.0026), Cholangiocytes (EPCAM+, p value = 0.0026) and non-parenchymal (EPCAM-) cells from the livers of Relfl/fl and RelΔAlb mice. Data are mean ± s.e.m of 3 mice/group. (d) Heatmap showing gene expression of Cxcl1, Cxcl2, Ccl2, Cxcl9, Cxcl10, Il1b, Il6 and Tnfα in olive oil vehicle control and acute CCl4 injured Relfl/fl and RelΔAlb mice. Asterisk denotes significance between CCl4 injured Relfl/fl and RelΔAlb mice; there is no significant difference between olive oil treated groups. (e) Histological assessment of αSMA, PCNA and CD68 stained liver sections in acute CCl4 injured Relfl/fl and RelΔLrat mice. Data in graphs are mean ± s.e.m of n=5. (a, c, e) P values were calculated using unpaired two-sided T test. (b) P value was calculated using a one-way ANOVA with Tukey post-hoc t-test (* P <0.05, ** P <0.01, *** P <0.001 and **** P <0.0001).
Extended Data Fig. 2. c-Rel regulates epithelial dedifferentiation and fibrogenic gene expression.
(a) Representative images of c-Rel staining in CCl4 injured Relflfl and RelΔHep mice. Representative of n=7 mice/group. Scale bar represents 100(m. (b) Graph shows mRNA levels of inflammatory cytokines Tnfa, Il1b (p=0.00038) and Il6(p value = 0.022)and the inflammatory chemokines Cxcl1 (p value = 0.0034), Cxcl2 (p=0.054) and Ccl2 (p=0.0029), in CCl4 injured livers of Relfl/fl and RelΔHep mice. Data are mean ± s.e.m of 7 mice/group. (c) Heatmap showing relative mRNA expression of Il-6, Cxcl1, Cxcl2, Ccl2, CCl4 and Ccl5 in WT and Rel-/- proximal tubular epithelial cells (PTEC) stimulated with or without TGFβ1. (d) Graphs show relative levels of Ctgf (p value = 0.034), Ctsd (p= 0.039), Serpine1 (p=0.04) and Bmp1 (p=0.0054) protein expressed as Intensity in control and TGFβ1 treated WT and Rel-/- hepatocytes. Data are from 4 independent cell isolations/group. (e) Quantification of soluble collagen (pg/ml) released from precision cut liver slices (PCLS) generated from WT and Rel-/- liver, stimulated ± TGFβ1 ± CTGF where (control p value = 0.012 and TGFβ1 p value = 0.045). Data are from PCLS generated 3 different donors/genotype. (b,d) P values were calculated using unpaired two-sided t-test. (d) P values were calculated using the R package LIMMA (* P <0.05, ** P <0.01 and ***P<0.001).
Extended Data Fig. 3. c-Rel regulates metabolic enzymes to induce epithelial dedifferentiation and fibrogenic gene expression.
(a) Seahorse analysis of basal (p<0.0001) and maximal (p<0.0001) glycolysis (extracellular acidification rate, ECAR) and basal (p<0.0007) and maximal (p<0.0004) mitochondrial respiration (oxygen consumption rate, OCR) in WT and Rel-/- hepatocytes stimulated ± TGFβ1. (b) Graph shows mRNA expression of Pfkfb1 in WT and Rel-/- hepatocytes stimulated ± TGFβ1. (c) Graph shows mRNA expression of Pfkfb3 in WT and Rel-/- hepatocytes stimulated ± IL-1β. (p value=0.025) (d) Schematic representation of RelA, NF-κB1 and NF-κB binding sites in the murine Pfkfb1 and Pfkfb3 promoters. (e) ChIP analysis of c-Rel at the proximal and distal regions of the Pfkfb1 promoter and the proximal (p<0.0001) and distal (p=0.0185) regions of the Pfkfb3 promoter in WT hepatocytes treated ± TGFβ1. (f) Representative images show PFKFB3 immunohistochemical staining in liver sections from acute CCl4 injured Pfkfb3flfl and Pfkfb3 Δhep mice. Images are representative of n=5 mice/group. Scale bar is 100(m. (g) Graphs show media lactate in control and TGFβ1 (p=0.0064) stimulated and glucose levels in control (p=0.0227) and TGFβ1 (p=0.00284) stimulated in hepatocytes isolated from Pfkfb3flfl and Pfkfb3 Δhep mice and stimulated ± TGFβ1. (h) Heatmap showing secreated Il-6, Cxcl1, Cxcl2, Cxcl10, Ccl2, Ccl3, CCl4 and Ccl5, measured by MSD in the media of hepatocytes isolated from Pfkfb3flfl and Pfkfb3Δhep mice and stimulated ± TGFβ1. (i) Quantification of connective tissue growth factor (CTGF) in pg/ml in the culture media of hepatocytes isolated from Pfkfb3flfl and Pfkfb3Δhep mice and stimulated ± TGFβ1 (p=0.0027) (j) Heatmap showing secreated Il-6, Cxcl1, Cxcl2, Cxcl10, Ccl2, Ccl3, CCl4 and Ccl5, measured by MSD in the media of WT hepatocytes stimulated ± TGFβ1 ± the Pfkfb3 inhibitor 3PO. (k) Quantification of connective tissue growth factor (CTGF) in pg/ml in the culture media of WT hepatocytes stimulated ± TGFβ1 ± the Pfkfb3 inhibitor 3PO (p=0.0013). Data in graphs are mean ± s.e.m. in n=3 (g,i,k), n=4 (a,b,c) or n=5 (e) independent cell isolations/condition. All p values were calculated using a two-way ANOVA with Tukey post-hoc t-test (* P <0.05, ** P <0.01 and *** P <0.001).
Extended Data Fig. 4. c-Rel dependent Snail regulation in chronic liver and kidney disease.
(a) Representative images show expression of Snail in normal and chronic CCl4 injured liver. (b) Representative images show Snail in normal and UUO injured kidney. (c) Representative images of Snail transcript in epithelial cells detected by RNAScope in fibrotic chronic CCl4 injured fibrotic mouse liver. (d) Representative images of Snail transcript in epithelial cells detected by RNAScope in fibrotic UUO mouse kidney. All representative images are representative of n=5 mice/group. (a-b) Scale bars equal 100 microns (c-d) Scale bars equal 50 microns. (e) Graph showing mRNA levels of Snail in TGFβ1 treated hepatocytes (p=0.0001) and proximal tubular epithelial cells (PTEC) (p=0.02) isolated from WT and Rel-/- mice. Data in graphs are mean ± s.e.m. in n=3 independent cell isolations. (f) Graph showing ChIP analysis of c-Rel binding to distal (p=0.0074) and proximal (p=0.0063) regions of the Snail promoter in WT hepatocytes stimulated ± TGFβ1. Data in graphs are mean ± s.e.m. in n=5 independent cell isolations. P values were calculated using unpaired two-sided t-test (e) and a ratio paired t-test (f) (* P <0.05, ** P <0.01 and *** P <0.001).
Extended Data Fig. 5. c-Rel regulates macrophages polarisation to drive tissue fibrosis.
(a) Histological assessment and representative images of αSMA stained liver sections in acute CCl4 injured in (n=13) Relflfl, (n=7) RelΔAlb (p=0.0116), and (n=10) Rel ΔLysM (p=0.0051) mice. Data are mean ± s.e.m. Scale bar equals 100 microns. P values were calculated using a one-way ANOVA with Tukey post- hoc t-test. (b) Representative low power immuno-fluorescence images show c-Rel (red), CD68 (green) and nuclear (blue) staining in diagnosed idiopathic pulmonary fibrosis lung sections. Yellow arrows denote co-localisaton of c-Rel and CD68. Scale bar equals 50 microns. Images are representative of n=8 IPF stained sections. (c) Heat map showing relative mRNA expression of fibrogenic markers; Tgfb1, Tgfb2, Tgfb3, TIMP1, Fn1, Pdgfa, Pdgfb, Mmp3, Mmp9 and Mmp13 in M1 and M2 polarised WT and Rel-/- BMDMs. (d) Graphs show, seahorse analysis of basal (p<0.0001) and maximal (p=0.0004) glycolysis (extracellular acidification rate, ECAR) and basal (p=0.0002) and maximal (p=0.0024) mitochondrial respiration (oxygen consumption rate, OCR) in M1 and M2 polarised WT and Rel-/- BMDMs. Data are mean ± s.e.m. from 3 independent cell isolations/group. (e) ChIP analysis of c-Rel binding to distal and proximal (p=0.004) regions of the Pfkfb3 promoter and to distal and proximal (p=0.003) regions of the Pfkfb1 promoters in WT BMDM in response to M1 and M2 polarisation. Data are mean ± s.e.m. from 3 independent cell isolations/group. (d-e) P values were calculated using two-way ANOVA with Tukey post-hoc t-test. Denoted significance refers to comparisons between WT and Rel-/- macrophages polarised to either an M1 or M2 phenotype. (f) Volcano plots show differentially expressed proteins detected by proteomic analysis of the secretome of M0, M1 and M2 polarised WT and Rel-/- BMDMs. (g) Graphs show relative levels of Galectin 1 (p=0.0031), Galectin 3 (p=0.0013), Vimentin (p=0.0128) and Matrix Metalloproteinase 12 (MMP12) (p<0.0001) expressed as Intensity x108 in M0, M1 and M2 polarised WT and Rel-/- BMDMs. Data are mean ± s.e.m. from 4 independent cell isolations/group generated 4 different donors/genotype. P values were calculated using the R package LIMMA (* P <0.05, ** P <0.01 and *** P <0.001).
Extended Data Fig. 6. Validation of epithelial specific deletion of c-Rel in kidney and lung fibrosis models.
(a) Flow cytometry gating strategy to identify immune cells (CD45+), epithelial cells (EPCAM+) and endothelial cells (CD31+) isolated from the kidney or lungs of Rel flfl, Rel ΔTEC or Rel ΔAEC mice respectively. (b-c) Ex vivo images of GFP fluorescence signal in the left and right kidneys, heart, liver, lungs and spleen of Rel ΔTEC mice (b) or Rel ΔAEC mice (c) imaged using an In Vivo Imaging System (IVIS). Graph and flow cytometry histograms show the Mean Fluorescence Intensity (MFI) of GFP in EpCAM+, CD31+, CD45+ and EpCAM-CD31-CD45- cells from the kidney of Rel ΔTEC and Relfl/flcontrol mice (b) or from the lung of Rel ΔAEC and Relfl/flcontrol mice (c), n=5 mice/group. (d) Heatmap showing mRNA levels of Tgfb1, Col1a1, Col1a2, Acta2 and Timp1 in control versus UUO kidney of Rel flfl, Rel ΔTEC and Rel ΔLysM mice (left) or control versus bleomycin lung of Rel flfl, Rel ΔAEC and Rel ΔLysM mice (right). Heatmap data are from 2 mice/group in control kidney or lung and 5 mice/group in the injured kidney or lung. (e) Quantification of hydroxyproline levels in nM per left lobe of lung tissue from bleomycin injured in Rel flfl, Rel ΔAEC (p=0.0105), and Rel ΔLysM (p=0.0006) mice. (f) Histological assessment and representative images of TUNEL stained lung sections in day 3 bleomycin injured in Rel flfl, Rel ΔAEC, and Rel ΔLysM mice. Scale bar is 50 microns. Data are mean ± s.e.m. in n=5 mice/group. (g) Quantification of neutrophil numbers in UUO injured kidneys of Rel flfl, Rel ΔTEC (p=0.0014) and Rel ΔLysM (p<0.0001) mice and macrophage numbers in UUO injured kidneys of Rel flfl, Rel ΔTEC (p=0.0045) and Rel ΔLysM (p=0.0004) mice. (h) Quantification of neutrophil numbers in Bleomycin injured lungs of Rel flfl, Rel ΔAEC and Rel ΔLysM mice and macrophage numbers in Bleomycin injured lungs of Rel flfl, Rel ΔAEC (p=0.0018) and Rel ΔLysM (p=0.0327) mice. (e,g,h) Data are mean ± s.e.m. in a minimum of 7 mice/group for the kidney and 10 mice/group for the lung. P values were calculated using one-way ANOVA with Tukey post-hoc t-test (* P <0.05, **P <0.01 and ***P <0.001).
Extended Data Fig. 7. Validation of single myeloid or dual hepatocyte- and myeloid- specific deletion of c-Rel in mice and analysis of fibrogenic gene expression in these mice during chronic liver injury.
(a) FACS plot and graphs show the Mean Fluorescence Intensity (MFI) of GFP expression in hepatocytes, macrophages (CD45+F4/80+CD11b+) (p=0.011), T-cells (CD45+CD3+) and non-parenchymal cells (CD45-) from the liver of Rel flfl versus Rel ΔLysM mice, n=3 mice/group. (b) FACS plot and graphs show the Mean Fluorescence Intensity (MFI) of GFP expression in hepatocytes (p=0.007), macrophages (CD45+F4/80+CD11b+) (p=0.007), T-cells (CD45+CD3+) and non-parenchymal cells (CD45-) from the liver of Rel flfl versus RelΔhep/ΔLysM mice, n=3 mice/group. (c) Heatmap showing mRNA levels of Tgfb1, Col1a1, Col1a2, Acta2 and Timp1 in the CCl4 injured liver of Rel flfl, Rel Δhep, Rel ΔLysM and Rel Δhep/ΔLysM mice. P values were calculated using two-sided t-test (* P <0.05)
Extended Data Fig. 8. c-Rel signaling in hepatocyte and macrophages differentially regulate liver regeneration via regulation of cell cycle genes and mitogenic factors.
(a) Histological assessment and representative images of PCNA positive hepatocytes in 48h partial hepatectomy injured Rel flfl, RelΔAlb (p=0.0003) and Rel ΔLysM (p=0.0096) mice. Scale bar is 100 microns. (b) Graph shows average liver/body weight ratio 48h post partial hepatectomy in Rel flfl, RelΔAlb (p=0.0318) and Rel ΔLysM (p=0.0178) mice. (c) Heat map showing relative hepatic mRNA expression of cell cycle genes; Ccna1, Ccnd1, Ccne1, Cdk2, Cdk4 and mitogenic proteins; Hgf and Egf at 48h post partial hepatectomy in Rel flfl, RelΔAlb and Rel ΔLysM mice. Data are mean ± s.e.m. in n=5 mice/group. P values were calculated using one-way ANOVA with Tukey post-hoc t-test (* P <0.05 and ** P <0.01).
Extended Data Fig. 9. IT-603 attenuates fibrogenesis in murine models of fibrosis.
(a) U937 cells stably expressing 3xNF-(B-Luc reporter were transiently transfected with RelA or c-Rel expression plasmids. Graph shows RelA and c-Rel induced NF-κ(B luciferase reporter activity ± IT-603 therapy. Data are mean ± s.e.m. P value = 0.0039. P value was calculated using an unpaired two-sided t-test (***P<0.001) of 3 independent experiments. (b-c) Histological quantification of αSMA stained kidney (p=0.0004) or lungs (p=0.009) following their respective injury. Data are mean ± s.e.m. in 7 and 10 mice/group for kidney and lung respectively. P values were calculated using an unpaired two-sided t-test. (d) Histological quantification of αSMA stained chronic MCD diet injured livers at 2 weeks (pre-treatment) and 5 weeks ± therapeutic administration of IT-603 (p=0.0044). (e) Graphs showing relative hepatic expression of the fibrogenic genes; Tgfb1 (p=0.039), Acta2 (p=0.028), Col1a1 (p=0.036), Col1a2, and Timp1(p=0.015) in 2-week (pre-treatment) and 5-week methionine choline deficient diet (MCD) fed mice ± therapeutic administration of IT-603. Data are mean ± s.e.m. in n=4 control mice 8 vehicle and n=7 IT-603 treated mice/group. (f) Histological quantification of αSMA stained chronic CCl4 injured livers at 3 weeks (pre-treatment) or 8 weeks ± therapeutic administration of IT-603 (p=0.0105). (g) Graphs showing relative hepatic expression of the fibrogenic genes; Tgfb1 (p=0.029), Acta2 (p=0.032), Col1a1 (p=0.04), Col1a2 (p=0.016), and Timp1 (p=0.009) in chronic CCl4 injured livers at 3 week (pre-treatment), 8 week and ± therapeutic administration of IT-603 (from weeks 3-8). Data are mean ± s.e.m. in n=4 control mice 7 experimental mice/group. (c,e) P values were calculated using one-way ANOVA with Tukey post-hoc t-test. (d,f) P values were calculated using two-way ANOVA with Tukey post-hoc t-test (*P<0.05, ***P<0.001).
Extended Data Fig. 10. IT-603 attenuates fibrosis in ex vivo human tissues slice models of liver and kidney fibrosis.
(a) Diagrams show the experimental timelines of TGF(1 induced fibrosis in ex vivo normal human liver and kidney precision cut slices (PCS). (b) Representative images of CD68 stained liver and kidney tissue slices. (c) Representative images and histological quantification of Picrosirius red stained fibrotic kidney slices ± IT-603 therapy (p<0.0001). Representative images and histological quantification of αSMA stained fibrotic kidney slices ± IT-603 therapy (p<0.0001). Red line denotes the value for the T=0 slice. (e) Quantification of soluble collagen released from fibrotic kidney slices ± IT-603 therapy (p=0.0015). (f) Quantification of the neo-epitope pro C3 released from fibrotic kidney slices ± IT-603 therapy (p=0.0493). (g) Graph showing average LDH release in the media expressed as a percentage (%) of positive control (LDH levels in media from a PCS where maximal death was induced by multiple freeze/thaws – normalized to media volume). (IT-603 p=0.023 and IT-603+TGFβ1 p=0.02). Images representative of n=3 independent slice experiments. Data are mean ± s.e.m. and representative of slices generated from 3 independent donors performed in duplicate. Scale bars equal 100 microns. P values were calculated using two-way ANOVA with Tukey post- hoc t-test (*P<0.05, **P<0.01, ***P<0.001 and ****P<0.0001).
Supplementary Material
Acknowledgements
This work was funded by a UK Medical Research Council PhD studentship to J.L. and program Grants MR/K0019494/1 to D.A.M, J.M and FO Grant MR/R023026/1 to D.A.M, J.M, L.A.B and FO. An Arthritis Research UK Grant (No 20812) supports F.O, D.A.M, J.L and J.C.W. A CRUK program grant, reference C18342/A23390 supports J.L. and D.A.M. The cross-council Lifelong Health and Wellbeing initiative, funded by the MRC (award reference i L016354) funds D.A.M and F.O. C.N. is supported by CRUK Beatson Institute Core funding A171196. T.G.B. is funded by the Wellcome Trust WT107492Z and a CRUK/AECC/AIRC Accelerator Award (A26813). M.Y.W.Z has a personal Ph.D award from Newton-Mosharafa fund. P.C., L. S., L.-A.T. are financed by Methusalem funding, FWO, ERC Proof of Concept (ERC-713758), and Advanced ERC Research Grant (EU-ERC743074). The IVIS spectrum was purchased under a Wellcome Trust Equipment Grant (087961) awarded to D.A.M and others. We would like to thank the Newcastle University bioimaging unit and the Newcastle University Flow cytometry core facility for technical assistance.
Footnotes
Author contributions: J.L. performed the majority of the laboratory-based work and analyses presented in the manuscript. S.L., A.K., C.B., G.C., L.A.B, J.C.W., A.C., R.A.B., L.M.G., R.C., S.M., M.T, B.S.B., X.X, M.Y.W.Z., W.J.R., H.L.P., C.N., T.B., C.B., M.G.M., L.S., L.-A.T, M.K., L.S., A.D.B., C.B.N. performed a portion of the laboratory experiments and their related analyses. S.M.R., D.M.M., G.S., J.F., S.A.W., J.L.Z., U.K., R.F.S. and I.M. contributed materials and/or analysis tools. L.A.B., A.F. N.S., P.C., J.M., and D.A.M. provided advice and/or contributed to the experimental design and writing. J.L., D.A.M. and F.O. conceived the studies, designed the experiments and wrote the manuscript. All authors read and commented on the final manuscript.
Competing interests: F.O, D.A.M, J.M, L.A.B are directors of Fibrofind limited. J.L, H.P, F.O, D.A.M, J.M, L.A.B are shareholders in Fibrofind limited. C.B.N is shareholder in GSK. M.K is a stock owner of Nordic Bioscience.
Data availability
Mass spectrometric raw data are available through the PRIDE repository (https://www.ebi.ac.uk/pride/archive/) and have been assigned the identifiers PXD017320.
References
- 1.Wynn TA, Ramalingam TR. Mechanisms of fibrosis: therapeutic translation for fibrotic disease. Nat Med. 2012;18(7):1028–104. doi: 10.1038/nm.2807. [DOI] [PMC free article] [PubMed] [Google Scholar]
- 2.Rockey DC, Bell PD, Hill JA. Fibrosis — A Common Pathway to Organ Injury and Failure. N Engl J Med. 2015;373(1):95–96. doi: 10.1056/NEJMc1504848. [DOI] [PubMed] [Google Scholar]
- 3.Bataller R, Brenner DA. Liver fibrosis. J Clin Invest. 2005;115(2):209–218. doi: 10.1172/JCI24282. [DOI] [PMC free article] [PubMed] [Google Scholar]
- 4.Friedman SL. Liver fibrosis – from bench to bedside. J Hepatol. 2003;38:38–53. doi: 10.1016/S0168-8278(02)00429-4. [DOI] [PubMed] [Google Scholar]
- 5.Cox TR, Erler JT. Molecular Pathways: Connecting Fibrosis and Solid Tumor Metastasis. Clin Cancer Res. 2014;20(14):3637–3643. doi: 10.1158/1078-0432.CCR-13-1059. [DOI] [PubMed] [Google Scholar]
- 6.Cernaro V, Lacquaniti A, Donato V, Fazio MR, Buemi A, Buemi M. Fibrosis, regeneration and cancer: what is the link? Nephrol Dial Transplant. 2012;27(1):21–27. doi: 10.1093/ndt/gfr567. [DOI] [PubMed] [Google Scholar]
- 7.Rybinski B, Franco-Barraza J, Cukierman E. The wound healing, chronic fibrosis, and cancer progression triad. Physiol Genomics. 2014;46(7):223. doi: 10.1152/PHYSIOLGENOMICS.00158.2013. [DOI] [PMC free article] [PubMed] [Google Scholar]
- 8.Klingler W, Jurkat-Rott K, Lehmann-Horn F, Schleip R. The role of fibrosis in Duchenne muscular dystrophy. [Accessed May 17, 2019];Acta Myolmyopathies cardiomyopathiesOff J Mediterr Soc Myol. 2012 31(3):184–195. [PMC free article] [PubMed] [Google Scholar]
- 9.Torres VE, Leof EB. Fibrosis, regeneration, and aging: playing chess with evolution. J Am Soc Nephrol. 2011;22(8):1393–1396. doi: 10.1681/ASN.2011060603. [DOI] [PubMed] [Google Scholar]
- 10.Hecker L, Logsdon NJ, Kurundkar D, et al. Reversal of persistent fibrosis in aging by targeting Nox4-Nrf2 redox imbalance. Sci Transl Med. 2014;6(231):231ra47. doi: 10.1126/scitranslmed.3008182. [DOI] [PMC free article] [PubMed] [Google Scholar]
- 11.Mehal WZ, Iredale J, Friedman SL. Scraping fibrosis: Expressway to the core of fibrosis. Nat Med. 2011;17(5):552–553. doi: 10.1038/nm0511-552. [DOI] [PMC free article] [PubMed] [Google Scholar]
- 12.Wynn T. Cellular and molecular mechanisms of fibrosis. J Pathol. 2008;214(2):199–210. doi: 10.1002/path.2277. [DOI] [PMC free article] [PubMed] [Google Scholar]
- 13.Koyama Y, Brenner DA. Liver inflammation and fibrosis. J Clin Invest. 2017;127(1):55–64. doi: 10.1172/JCI88881. [DOI] [PMC free article] [PubMed] [Google Scholar]
- 14.Hayden MS, Ghosh S. NF-κB, the first quarter-century: remarkable progress and outstanding questions. Genes Dev. 2012;26(3):203–234. doi: 10.1101/gad.183434.111. [DOI] [PMC free article] [PubMed] [Google Scholar]
- 15.Oeckinghaus A, Ghosh S. The NF-kappaB family of transcription factors and its regulation. Cold Spring Harb Perspect Biol. 2009;1(4):a000034. doi: 10.1101/cshperspect.a000034. [DOI] [PMC free article] [PubMed] [Google Scholar]
- 16.Lawrence T. The nuclear factor NF-kappaB pathway in inflammation. Cold Spring Harb Perspect Biol. 2009;1(6) doi: 10.1101/cshperspect.a001651. a001651. [DOI] [PMC free article] [PubMed] [Google Scholar]
- 17.Tak PP, Firestein GS. NF-kappaB: a key role in inflammatory diseases. J Clin Invest. 2001;107(1):7–11. doi: 10.1172/JCI11830. [DOI] [PMC free article] [PubMed] [Google Scholar]
- 18.Zhang Q, Lenardo MJ, Baltimore D. 30 Years of NF-κB: A Blossoming of Relevance to Human Pathobiology. Cell. 2017;168(1-2):37–57. doi: 10.1016/j.cell.2016.12.012. [DOI] [PMC free article] [PubMed] [Google Scholar]
- 19.Luedde T, Schwabe RF. NF-κB in the liver—linking injury, fibrosis and hepatocellular carcinoma. Nat Rev Gastroenterol Hepatol. 2011;8(2):108–118. doi: 10.1038/nrgastro.2010.213. [DOI] [PMC free article] [PubMed] [Google Scholar]
- 20.Perkins ND, Gilmore TD. Good cop, bad cop: the different faces of NF-κB. Cell Death Differ. 2006;13(5):759–772. doi: 10.1038/sj.cdd.4401838. [DOI] [PubMed] [Google Scholar]
- 21.Piva R, Belardo G, Santoro MG. NF-κB: A Stress-Regulated Switch for Cell Survival. Antioxid Redox Signal. 2006;8(3-4):478–486. doi: 10.1089/ars.2006.8.478. [DOI] [PubMed] [Google Scholar]
- 22.Wong D, Teixeira A, Oikonomopoulos S, et al. Extensive characterization of NF-κB binding uncovers non-canonical motifs and advances the interpretation of genetic functional traits. Genome Biol. 2011;12(7):R70. doi: 10.1186/gb-2011-12-7-r70. [DOI] [PMC free article] [PubMed] [Google Scholar]
- 23.Geisler F, Algül H, Paxian S, Schmid RM. Genetic Inactivation of RelA/p65 Sensitizes Adult Mouse Hepatocytes to TNF-induced Apoptosis In Vivo and In Vitro. Gastroenterology. 2007;132(7):2489–2503. doi: 10.1053/j.gastro.2007.03.033. [DOI] [PubMed] [Google Scholar]
- 24.Rosenfeld ME, Prichard L, Shiojiri N, Fausto N. Prevention of Hepatic Apoptosis and Embryonic Lethality in RelA/TNFR-1 Double Knockout Mice. Am J Pathol. 2000;156(3):997–1007. doi: 10.1016/S0002-9440(10)64967-X. [DOI] [PMC free article] [PubMed] [Google Scholar]
- 25.Beg AA, Sha WC, Bronson RT, Ghosh S, Baltimore D. Embryonic lethality and liver degeneration in mice lacking the RelA component of NF-κB. Nature. 1995;376(6536):167–170. doi: 10.1038/376167a0. [DOI] [PubMed] [Google Scholar]
- 26.Lenardo MJ, Baltimore D. NF-kappa B: a pleiotropic mediator of inducible and tissue-specific gene control. Cell. 1989;58(2):227–229. doi: 10.1016/0092-8674(89)90833-7. [DOI] [PubMed] [Google Scholar]
- 27.Fullard N, Wilson CL, Oakley F. Roles of c-Rel signalling in inflammation and disease. Int J Biochem Cell Biol. 2012;44(6):851–860. doi: 10.1016/J.BIOCEL.2012.02.017. [DOI] [PubMed] [Google Scholar]
- 28.Neo WH, Lim JF, Grumont R, Gerondakis S, Su I. c-Rel Regulates Ezh2 Expression in Activated Lymphocytes and Malignant Lymphoid Cells. J Biol Chem. 2014;289(46):31693–31707. doi: 10.1074/jbc.M114.574517. [DOI] [PMC free article] [PubMed] [Google Scholar]
- 29.Zeybel M, Luli S, Sabater L, et al. A Proof-of-Concept for Epigenetic Therapy of Tissue Fibrosis: Inhibition of Liver Fibrosis Progression by 3-Deazaneplanocin A. Mol Ther. 2017;25(1) doi: 10.1016/j.ymthe.2016.10.004. [DOI] [PMC free article] [PubMed] [Google Scholar]
- 30.Fullard N, Moles A, O’Reilly S, et al. The c-Rel subunit of NF-κB regulates epidermal homeostasis and promotes skin fibrosis in mice. Am J Pathol. 2013;182(6):2109–2120. doi: 10.1016/j.ajpath.2013.02.016. [DOI] [PMC free article] [PubMed] [Google Scholar]
- 31.Gaspar-Pereira S, Fullard N, Townsend PA, et al. The NF-κB Subunit c-Rel Stimulates Cardiac Hypertrophy and Fibrosis. Am J Pathol. 2012;180(3):929–939. doi: 10.1016/j.ajpath.2011.11.007. [DOI] [PMC free article] [PubMed] [Google Scholar]
- 32.Luli S, Di Paolo D, Perri P, et al. A new fluorescence-based optical imaging method to non-invasively monitor hepatic myofibroblasts in vivo. J Hepatol. 2016;65(1) doi: 10.1016/j.jhep.2016.03.021. [DOI] [PMC free article] [PubMed] [Google Scholar]
- 33.Hunter JE, Leslie J, Perkins ND. C-Rel and its many roles in cancer: An old story with new twists. Br J Cancer. 2016;114(1) doi: 10.1038/bjc.2015.410. [DOI] [PMC free article] [PubMed] [Google Scholar]
- 34.Wynn TA. Cellular and molecular mechanisms of fibrosis. J Pathol. 2008;214(2):199–210. doi: 10.1002/path.2277. [DOI] [PMC free article] [PubMed] [Google Scholar]
- 35.Schwabe RF, Tabas I, Pajvani UB. Mechanisms of Fibrosis Development in Nonalcoholic Steatohepatitis. Gastroenterology. doi: 10.1053/J.GASTRO.2019.11.311. Published online February 8, 2020. [DOI] [PMC free article] [PubMed] [Google Scholar]
- 36.Swamy M, Jamora C, Havran W, Hayday A. Epithelial decision makers: in search of the “epimmunome.”. Nat Immunol. 2010;11(8):656–665. doi: 10.1038/ni.1905. [DOI] [PMC free article] [PubMed] [Google Scholar]
- 37.Duffield JS, Forbes SJ, Constandinou CM, et al. Selective depletion of macrophages reveals distinct, opposing roles during liver injury and repair. J Clin Invest. 2005;115(1):56–65. doi: 10.1172/JCI22675. [DOI] [PMC free article] [PubMed] [Google Scholar]
- 38.Seki E, de Minicis S, Inokuchi S, et al. CCR2 promotes hepatic fibrosis in mice. Hepatology. 2009;50(1):185–197. doi: 10.1002/hep.22952. [DOI] [PMC free article] [PubMed] [Google Scholar]
- 39.Wynn TA, Vannella KM. Macrophages in Tissue Repair, Regeneration, and Fibrosis. Immunity. 2016;44(3):450–462. doi: 10.1016/j.immuni.2016.02.015. [DOI] [PMC free article] [PubMed] [Google Scholar]
- 40.Garcia-Lazaro JF, Thieringer F, Lüth S, et al. Hepatic over-expression of TGF-beta1 promotes LPS-induced inflammatory cytokine secretion by liver cells and endotoxemic shock. Immunol Lett. 2005;101(2):217–222. doi: 10.1016/j.imlet.2005.06.003. [DOI] [PubMed] [Google Scholar]
- 41.Yang L, Inokuchi S, Roh YS, et al. Transforming growth factor-β signaling in hepatocytes promotes hepatic fibrosis and carcinogenesis in mice with hepatocyte-specific deletion of TAK1. Gastroenterology. 2013;144(5):1042–1054.e4. doi: 10.1053/j.gastro.2013.01.056. [DOI] [PMC free article] [PubMed] [Google Scholar]
- 42.Bird TG, Müller M, Boulter L, et al. TGFβ inhibition restores a regenerative response in acute liver injury by suppressing paracrine senescence. Sci Transl Med. 2018;10(454) doi: 10.1126/scitranslmed.aan1230. [DOI] [PMC free article] [PubMed] [Google Scholar]
- 43.Niu L, Cui X, Qi Y, et al. Involvement of TGF-β 1/Smad3 Signaling in Carbon Tetrachloride-Induced Acute Liver Injury in Mice. Mukhopadhyay P, editor. PLoS One. 2016;11(5) doi: 10.1371/journal.pone.0156090. e0156090. [DOI] [PMC free article] [PubMed] [Google Scholar]
- 44.JF G-L, F T, S L, et al. Hepatic over-expression of TGF-beta1 promotes LPS-induced inflammatory cytokine secretion by liver cells and endotoxemic shock. Immunol Lett. 2005;101(2):217–222. doi: 10.1016/J.IMLET.2005.06.003. [DOI] [PubMed] [Google Scholar]
- 45.Travis MA, Sheppard D. TGF-β Activation and Function in Immunity. Annu Rev Immunol. 2014;32(1):51–82. doi: 10.1146/annurev-immunol-032713-120257. [DOI] [PMC free article] [PubMed] [Google Scholar]
- 46.Grgurevic L, Erjavec I, Grgurevic I, et al. Systemic inhibition of BMP1-3 decreases progression of CCl 4-induced liver fibrosis in rats. Growth Factors. 2017;35(6):201–215. doi: 10.1080/08977194.2018.1428966. [DOI] [PubMed] [Google Scholar]
- 47.Lipson KE, Wong C, Teng Y, Spong S. CTGF is a central mediator of tissue remodeling and fibrosis and its inhibition can reverse the process of fibrosis. Fibrogenesis Tissue Repair. 2012;5(Suppl 1):S24. doi: 10.1186/1755-1536-5-S1-S24. [DOI] [PMC free article] [PubMed] [Google Scholar]
- 48.Fox C, Cocchiaro P, Oakley F, et al. Inhibition of lysosomal protease cathepsin D reduces renal fibrosis in murine chronic kidney disease. Sci Rep. 2016;6 doi: 10.1038/srep20101. [DOI] [PMC free article] [PubMed] [Google Scholar]
- 49.Moles A, Tarrats N, Fernández-Checa JC, Marí M. Cathepsins B and D drive hepatic stellate cell proliferation and promote their fibrogenic potential. Hepatology. 2009;49(4):1297–1307. doi: 10.1002/hep.22753. [DOI] [PMC free article] [PubMed] [Google Scholar]
- 50.Ghosh AK, Vaughan DE. PAI-1 in tissue fibrosis. J Cell Physiol. 2012;227(2):493–507. doi: 10.1002/jcp.22783. [DOI] [PMC free article] [PubMed] [Google Scholar]
- 51.Lipson KE, Wong C, Teng Y, Spong S. CTGF is a central mediator of tissue remodeling and fibrosis and its inhibition can reverse the process of fibrosis. Fibrogenesis Tissue Repair. 2012;5(S1):S24. doi: 10.1186/1755-1536-5-S1-S24. [DOI] [PMC free article] [PubMed] [Google Scholar]
- 52.Kodama T, Takehara T, Hikita H, et al. Increases in p53 expression induce CTGF synthesis by mouse and human hepatocytes and result in liver fibrosis in mice. J Clin Invest. 2011;121(8):3343–3356. doi: 10.1172/JCI44957. [DOI] [PMC free article] [PubMed] [Google Scholar]
- 53.Mathieu J, Ruohola-Baker H. Metabolic remodeling during the loss and acquisition of pluripotency. Development. 2017;144(4):541–551. doi: 10.1242/dev.128389. [DOI] [PMC free article] [PubMed] [Google Scholar]
- 54.Sciacovelli M, Frezza C. Metabolic reprogramming and epithelial-to-mesenchymal transition in cancer. FEBS J. 2017;284(19):3132–3144. doi: 10.1111/febs.14090. [DOI] [PMC free article] [PubMed] [Google Scholar]
- 55.Nieto MA, Huang RY-J, Jackson RA, Thiery JP. EMT: 2016. Cell. 2016;166(1):21–45. doi: 10.1016/j.cell.2016.06.028. [DOI] [PubMed] [Google Scholar]
- 56.Kelly B, O’Neill LA. Metabolic reprogramming in macrophages and dendritic cells in innate immunity. Cell Res. 2015;25(7):771–784. doi: 10.1038/cr.2015.68. [DOI] [PMC free article] [PubMed] [Google Scholar]
- 57.Taura K, Miura K, Iwaisako K, et al. Hepatocytes do not undergo epithelial-mesenchymal transition in liver fibrosis in mice. Hepatology. 2010;51(3):1027–1036. doi: 10.1002/hep.23368. [DOI] [PMC free article] [PubMed] [Google Scholar]
- 58.Humphreys BD, Lin S-L, Kobayashi A, et al. Fate tracing reveals the pericyte and not epithelial origin of myofibroblasts in kidney fibrosis. Am J Pathol. 2010;176(1):85–97. doi: 10.2353/ajpath.2010.090517. [DOI] [PMC free article] [PubMed] [Google Scholar]
- 59.Grande MT, Sánchez-Laorden B, López-Blau C, et al. Snail1-induced partial epithelial-to-mesenchymal transition drives renal fibrosis in mice and can be targeted to reverse established disease. Nat Med. 2015;21(9):989–997. doi: 10.1038/nm.3901. [DOI] [PubMed] [Google Scholar]
- 60.Rowe RG, Lin Y, Shimizu-Hirota R, et al. Hepatocyte-derived Snail1 propagates liver fibrosis progression. Mol Cell Biol. 2011;31(12):2392–2403. doi: 10.1128/MCB.01218-10. [DOI] [PMC free article] [PubMed] [Google Scholar]
- 61.Hee Kim N, Hoon Cha Y, Lee J, et al. ARTICLE Snail reprograms glucose metabolism by repressing phosphofructokinase PFKP allowing cancer cell survival under metabolic stress. Nat Commun. doi: 10.1038/ncomms14374. Published online 2017. [DOI] [PMC free article] [PubMed] [Google Scholar]
- 62.Mills EL, O’Neill LA. Reprogramming mitochondrial metabolism in macrophages as an anti-inflammatory signal. Eur J Immunol. 2016;46(1):13–21. doi: 10.1002/eji.201445427. [DOI] [PubMed] [Google Scholar]
- 63.Gieling RG, Elsharkawy AM, Caamaño JH, et al. The c-Rel subunit of nuclear factor-kappaB regulates murine liver inflammation, wound-healing, and hepatocyte proliferation. Hepatology. 2010;51(3):922–931. doi: 10.1002/hep.23385. [DOI] [PubMed] [Google Scholar]
- 64.Shono Y, Tuckett AZ, Ouk S, et al. A small-molecule c-Rel inhibitor reduces alloactivation of T cells without compromising antitumor activity. Cancer Discov. 2014;4(5):578–591. doi: 10.1158/2159-8290.CD-13-0585. [DOI] [PMC free article] [PubMed] [Google Scholar]
- 65.Paish HL, Reed LH, Brown H, et al. A novel bioreactor technology for modelling fibrosis in human and rodent precision-cut liver slices. Hepatology. 2019 doi: 10.1002/hep.30651. Published online April 4, hep.30651. [DOI] [PMC free article] [PubMed] [Google Scholar]
- 66.Nielsen MJ, Veidal SS, Karsdal MA, et al. Plasma Pro-C3 (N-terminal type III collagen propeptide) predicts fibrosis progression in patients with chronic hepatitis C. Liver Int. 2015;35(2):429–437. doi: 10.1111/liv.12700. [DOI] [PubMed] [Google Scholar]
- 67.Krawczyk CM, Holowka T, Sun J, et al. Toll-like receptor-induced changes in glycolytic metabolism regulate dendritic cell activation. Blood. 2010;115(23):4742–4749. doi: 10.1182/blood-2009-10-249540. [DOI] [PMC free article] [PubMed] [Google Scholar]
- 68.Lees JG, Gardner DK, Harvey AJ. Mitochondrial and glycolytic remodeling during nascent neural differentiation of human pluripotent stem cells. Development. 2018;145(20):dev168997. doi: 10.1242/dev.168997. [DOI] [PubMed] [Google Scholar]
- 69.Peng M, Yin N, Chhangawala S, Xu K, Leslie CS, Li MO. Aerobic glycolysis promotes T helper 1 cell differentiation through an epigenetic mechanism. Science. 2016;354(6311):481–484. doi: 10.1126/science.aaf6284. [DOI] [PMC free article] [PubMed] [Google Scholar]
- 70.Kelly B, O’Neill LA. Metabolic reprogramming in macrophages and dendritic cells in innate immunity. Cell Res. 2015;25(7):771–784. doi: 10.1038/cr.2015.68. [DOI] [PMC free article] [PubMed] [Google Scholar]
- 71.Wei Q, Su J, Dong G, Zhang M, Huo Y, Dong Z. Glycolysis inhibitors suppress renal interstitial fibrosis via divergent effects on fibroblasts and tubular cells. Am J Physiol Physiol. 2019 doi: 10.1152/ajprenal.00422.2018. Published online April 10, ajprenal.00422.2018. [DOI] [PMC free article] [PubMed] [Google Scholar]
- 72.Ding H, Jiang L, Xu J, et al. Inhibiting aerobic glycolysis suppresses renal interstitial fibroblast activation and renal fibrosis. Am J Physiol Physiol. 2017;313(3):F561–F575. doi: 10.1152/ajprenal.00036.2017. [DOI] [PubMed] [Google Scholar]
- 73.Xie N, Tan Z, Banerjee S, et al. Glycolytic Reprogramming in Myofibroblast Differentiation and Lung Fibrosis. Am J Respir Crit Care Med. 2015;192(12):1462–1474. doi: 10.1164/rccm.201504-0780OC. [DOI] [PMC free article] [PubMed] [Google Scholar]
- 74.MacParland SA, Liu JC, Ma X-Z, et al. Single cell RNA sequencing of human liver reveals distinct intrahepatic macrophage populations. Nat Commun. 2018;9(1):4383. doi: 10.1038/s41467-018-06318-7. [DOI] [PMC free article] [PubMed] [Google Scholar]
- 75.Chang N, Tian L, Ji X, et al. Single-Cell Transcriptomes Reveal Characteristic Features of Mouse Hepatocytes with Liver Cholestatic Injury. Cells. 2019;8(9) doi: 10.3390/CELLS8091069. [DOI] [PMC free article] [PubMed] [Google Scholar]
- 76.Lipson KE, Wong C, Teng Y, Spong S. CTGF is a central mediator of tissue remodeling and fibrosis and its inhibition can reverse the process of fibrosis. Fibrogenesis Tissue Repair. 2012;5(S1):S24. doi: 10.1186/1755-1536-5-S-S24. [DOI] [PMC free article] [PubMed] [Google Scholar]
- 77.Huang G, Brigstock DR. Regulation of hepatic stellate cells by connective tissue growth factor. Front Biosci (Landmark Ed. 2012;17:2495–2507. doi: 10.2741/4067. [DOI] [PubMed] [Google Scholar]
- 78.Paradis V, Dargere D, Bonvoust F, Vidaud M, Segarini P, Bedossa P. Effects and Regulation of Connective Tissue Growth Factor on Hepatic Stellate Cells. Lab Investig. 2002;82(6):767–774. doi: 10.1097/01.LAB.0000017365.18894.D3. [DOI] [PubMed] [Google Scholar]
- 79.Gressner OA, Lahme B, Demirci I, Gressner AM, Weiskirchen R. Differential effects of TGF-beta on connective tissue growth factor (CTGF/CCN2) expression in hepatic stellate cells and hepatocytes. J Hepatol. 2007;47(5):699–710. doi: 10.1016/j.jhep.2007.05.015. [DOI] [PubMed] [Google Scholar]
- 80.Friedman SL. Hepatic stellate cells: protean, multifunctional, and enigmatic cells of the liver. Physiol Rev. 2008;88(1):125–172. doi: 10.1152/physrev.00013.2007. [DOI] [PMC free article] [PubMed] [Google Scholar]
- 81.Gressner OA, Lahme B, Siluschek M, Rehbein K, Weiskirchen R, Gressner AM. Intracrine signalling of activin A in hepatocytes upregulates connective tissue growth factor (CTGF/CCN2) expression. Liver Int. 2008;28(9):1207–1216. doi: 10.1111/j.1478-3231.2008.01729.x. [DOI] [PubMed] [Google Scholar]
- 82.Fearn A, Situmorang GR, Fox C, et al. The NF-κB1 is a key regulator of acute but not chronic renal injury. Cell Death Dis. 2017;8(6):e2883. doi: 10.1038/cddis.2017.233. [DOI] [PMC free article] [PubMed] [Google Scholar]
- 83.Wang F, Liu S, DU T, Chen H, Li Z, Yan J. NF-κB inhibition alleviates carbon tetrachloride-induced liver fibrosis via suppression of activated hepatic stellate cells. Exp Ther Med. 2014;8(1):95–99. doi: 10.3892/etm.2014.1682. [DOI] [PMC free article] [PubMed] [Google Scholar]
- 84.Chan LK, Gerstenlauer M, Konukiewitz B, et al. Epithelial NEMO/IKKγ limits fibrosis and promotes regeneration during pancreatitis. Gut. 2017;66(11):1995–2007. doi: 10.1136/gutjnl-2015-311028. [DOI] [PubMed] [Google Scholar]
- 85.Karin M, Yamamoto Y, Wang QM. The IKK NF-κB system: a treasure trove for drug development. Nat Rev Drug Discov. 2004;3(1):17–26. doi: 10.1038/nrd1279. [DOI] [PubMed] [Google Scholar]
- 86.Bennett J, Capece D, Begalli F, et al. NF-κB in the crosshairs: Rethinking an old riddle. Int J Biochem Cell Biol. 2018;95:108–112. doi: 10.1016/j.biocel.2017.12.020. [DOI] [PMC free article] [PubMed] [Google Scholar]
- 87.Oakley F, Meso M, Iredale JP, et al. Inhibition of inhibitor of kappaB kinases stimulates hepatic stellate cell apoptosis and accelerated recovery from rat liver fibrosis. [Accessed May 18, 2019];Gastroenterology. 2005 128(1):108–120. doi: 10.1053/j.gastro.2004.10.003. [DOI] [PubMed] [Google Scholar]
- 88.Oakley F, Teoh V, Ching-A-Sue G, et al. Angiotensin II activates I kappaB kinase phosphorylation of RelA at Ser 536 to promote myofibroblast survival and liver fibrosis. Gastroenterology. 2009;136(7):2334–2344.e1. doi: 10.1053/j.gastro.2009.02.081. [DOI] [PubMed] [Google Scholar]
- 89.Chen L-W, Egan L, Li Z-W, Greten FR, Kagnoff MF, Karin M. The two faces of IKK and NF-kappaB inhibition: prevention of systemic inflammation but increased local injury following intestinal ischemia-reperfusion. Nat Med. 2003;9(5):575–581. doi: 10.1038/nm849. [DOI] [PubMed] [Google Scholar]
- 90.Li Z-W, Chu W, Hu Y, et al. The IKKβ Subunit of IκB Kinase (IKK) is Essential for Nuclear Factor κB Activation and Prevention of Apoptosis. J Exp Med. 1999;189(11):1839–1845. doi: 10.1084/jem.189.11.1839. [DOI] [PMC free article] [PubMed] [Google Scholar]
- 91.Li Q, Van Antwerp D, Mercurio F, Lee KF, Verma IM. Severe liver degeneration in mice lacking the IkappaB kinase 2 gene. [Accessed May 18, 2019];Science. 1999 284(5412):321–325. doi: 10.1126/science.284.5412.321. [DOI] [PubMed] [Google Scholar]
- 92.Li Q, Verma IM. NF-κB regulation in the immune system. Nat Rev Immunol. 2002;2(10):725–734. doi: 10.1038/nri910. [DOI] [PubMed] [Google Scholar]
- 93.Perkins ND. Integrating cell-signalling pathways with NF-kappaB and IKK function. Nat Rev Mol Cell Biol. 2007;8(1):49–62. doi: 10.1038/nrm2083. [DOI] [PubMed] [Google Scholar]
- 94.Shono Y, Tuckett AZ, Liou H-C, et al. Characterization of a c-Rel Inhibitor That Mediates Anticancer Properties in Hematologic Malignancies by Blocking NF-κB-Controlled Oxidative Stress Responses. Cancer Res. 2016;76(2):377–389. doi: 10.1158/0008-5472.CAN-14-2814. [DOI] [PMC free article] [PubMed] [Google Scholar]
- 95.Shono Y, Tuckett AZ, Ouk S, et al. A small-molecule c-Rel inhibitor reduces alloactivation of T cells without compromising antitumor activity. Cancer Discov. 2014;4(5):578–591. doi: 10.1158/2159-8290.CD-13-0585. [DOI] [PMC free article] [PubMed] [Google Scholar]
- 96.Grinberg-Bleyer Y, Oh H, Desrichard A, et al. NF-κB c-Rel Is Crucial for the Regulatory T Cell Immune Checkpoint in Cancer. Cell. 2017;170(6):1096–1108.e13. doi: 10.1016/J.CELL.2017.08.004. [DOI] [PMC free article] [PubMed] [Google Scholar]
- 97.De Bock K, Georgiadou M, Schoors S, et al. Role of PFKFB3-Driven Glycolysis in Vessel Sprouting. Cell. 2013;154(3):651–663. doi: 10.1016/J.CELL.2013.06.037. [DOI] [PubMed] [Google Scholar]
- 98.Heise N, De Silva NS, Silva K, et al. Germinal center B cell maintenance and differentiation are controlled by distinct NF-κB transcription factor subunits. J Exp Med. 2014;211(10):2103–2118. doi: 10.1084/jem.20132613. [DOI] [PMC free article] [PubMed] [Google Scholar]
- 99.Mederacke I, Hsu CC, Troeger JS, et al. Fate tracing reveals hepatic stellate cells as dominant contributors to liver fibrosis independent of its aetiology. Nat Commun. 2013;4:2823. doi: 10.1038/ncomms3823. [DOI] [PMC free article] [PubMed] [Google Scholar]
- 100.Higgins GA, ANDERSON RE, Higgins G, Anderson R. Experimental pathology of liver: restoration of liver in white rat following partial surgical removal. [Accessed January 10, 2020]; Published online January 1, 1931. https://www.scienceopen.com/document?vid=57858414-5eff-4c8d-a028-ccb3fc1c44a6.
- 101.Oakley F, Mann J, Nailard S, et al. Nuclear Factor-κB1 (p50) Limits the Inflammatory and Fibrogenic Responses to Chronic Injury. Am J Pathol. 2005;166(3):695–708. doi: 10.1016/S0002-9440(10)62291-2. [DOI] [PMC free article] [PubMed] [Google Scholar]
Associated Data
This section collects any data citations, data availability statements, or supplementary materials included in this article.
Supplementary Materials
Data Availability Statement
Mass spectrometric raw data are available through the PRIDE repository (https://www.ebi.ac.uk/pride/archive/) and have been assigned the identifiers PXD017320.


