Abstract
Auditory localization experiments typically either require subjects to judge the location of a sound source from a discrete set of response alternatives or involve measurements of the accuracy of orienting responses made toward the source location. To compare the results obtained by both methods, we trained ferrets by positive conditioning to stand on a platform at the center of a circular arena prior to stimulus presentation and then approach the source of a broadband noise burst delivered from 1 of 12 loudspeakers arranged at 30° intervals in the horizontal plane. Animals were rewarded for making a correct choice. We also obtained a non-categorized measure of localization accuracy by recording head-orienting movements made during the first second following stimulus onset. The accuracy of the approach-totarget responses declined as the stimulus duration was reduced, particularly for lateral and posterior locations, although responses to sounds presented in the frontal region of space and directly behind the animal remained quite accurate. Head movements had a latency of ~200 ms and varied systematically in amplitude with stimulus direction. However, the final head bearing progressively undershot the target with increasing eccentricity and rarely exceeded 60° to each side of the midline. In contrast to the approach-to-target responses, the accuracy of the head orienting responses did not change much with stimulus duration, suggesting that the improvement in percent correct scores with longer stimuli was due, at least in part, to re-sampling of the acoustical stimulus after the initial head turn had been made. Nevertheless, for incorrect trials, head orienting responses were more closely correlated with the direction approached by the animals than with the actual target direction, implying that at least part of the neural circuitry for translating sensory spatial signals into motor commands is shared by these two behaviors.
Keywords: head movement, orienting response, auditory space, azimuth, mutual information
The natural tendency of many species to orient toward an unexpected sound has been exploited in numerous studies as a means of assessing the accuracy of auditory localization (Knudsen et al., 1979; Whittington et al., 1981; Perrott et al., 1987; Makous and Middlebrooks, 1990; Beitel and Kaas, 1993; Frens and Van Opstal, 1995; Hartline et al., 1995; May and Huang, 1996; Populin and Yin, 1998; Poganiatz and Wagner, 2001). However, this normally limits the studies to the spatial region covered by the orientation responses, the frontal hemifield, leaving the rest of space unexplored, and therefore ignoring one of the main characteristics of the auditory system, its omnidirectionality. Another, popular experimental approach is to shape the natural phonotaxic behavior exhibited by most mammalian species in order to train animals to approach the location of the sound source (e.g. Jenkins and Master-ton, 1982; Heffner, 1997; Kavanagh and Kelly, 1987; Parsons et al., 1999; Malhotra et al., 2004). Although this form of operant behavior can be used to assess sound localization abilities throughout the full 360° of azimuth, most studies have again focused on the frontal hemifield only.
The acoustic orienting response consists of coordinated movements of the eyes, head, and body toward the perceived location of the stimulus. The importance of considering head movements, rather than relying solely upon saccadic eye movements, has been demonstrated in studies showing that auditory localization responses become less accurate when assessed by a change in eye position alone in head-restrained animals (Tollin et al., 2005; Populin, 2006). Because approach-to-target behavior is typically preceded by head orienting movements that redirect an animal’s eyes and pinnae toward the source of the sound (e.g. Jenkins and Masterton, 1982; Smith et al., 2004), it seems reasonable to regard natural localization behavior as a sequence of sound-evoked responses, beginning with orientation and followed by the locomotor response (Beitel and Kaas, 1993). Nevertheless, it has been suggested on the basis of lesion experiments that different neural pathways might be responsible for unconditioned orientation and operant conditioned spatial behaviors (Thompson and Masterton, 1978). Indeed, unilateral lesions or inactivation of the auditory cortex has been shown to cause localization deficits when animals have to walk toward sound sources in the contralateral hemifield (Kavanagh and Kelly, 1987; Malhotra et al., 2004), whereas head orienting behavior is unaffected (Beitel and Kaas, 1993; Smith et al., 2004).
The superior colliculus (SC) has been widely implicated in the control of orienting movements of the eyes, head and, in species where they are mobile, the external ears, toward novel sensory, including auditory, targets (e.g. Stein and Clamann, 1981; Lomber et al., 2001; Sparks et al., 2001; Burnett et al., 2004). Although there is extensive physiological and behavioral evidence that multisensory processing relies on close interactions between the cortex and the SC (reviewed by Stein, 2005), it remains unclear to what extent the neural circuits responsible for sound-evoked orientation and approach behaviors operate independently. To explore the relationship between these two aspects of auditory localization, we trained ferrets by positive conditioning in a 360° approach-to-target task while recording the head orienting responses. By altering the spatial location, intensity and duration of the stimuli, we were able to examine the consequences of varying the difficulty of the task on each measure of localization performance.
Experimental Procedures
All procedures involving animals were performed following local ethical review committee approval and under license from the UK Home Office in accordance with the Animal (Scientific Procedures) Act (1986). Every effort was made to minimize the number of animals used and their suffering. The data for the present study were collected from ten adult pigmented ferrets (Mustela putorius furo) from our breeding colony, which also contributed to other behavioral studies. The apparatus and methods used to train the ferrets have been described in detail in previous reports and are outlined briefly below (Parsons et al., 1999; Kacelnik et al., 2006).
Animal welfare
The ferrets were housed in standard laboratory cages, either individually if male or in small groups if female. The cages were equipped with different objects such as balls, plastic tubes and shelters for the animals to play with. The animals were given at least two opportunities each week during which they were allowed to explore outside their cages and interact with other ferrets. During the behavioral testing periods, which each lasted a maximum of 14 consecutive days, the animals received free access to their usual dry food in their cages but were provided with drinking water only during the twice daily training sessions in the test apparatus (see below). If the total daily volume of water consumed during these sessions was <60–70 ml/kg, which we have determined to be the average daily water consumption by ferrets, supplementary fluid was provided at the end of each day’s testing in the form of a puree comprising ground food pellets and an appropriate amount of water. Body weights were recorded daily and compared with the baseline weight for each animal determined before the start of the water regulation paradigm. The maximum weight drop allowed was 2 standard deviation (SD) below this mean baseline weight, which therefore took into account individual differences in the amount by which the animals’ weight varied naturally over time. Between each 14-day testing period, animals were allowed breaks of ≥4 days, during which they given ad libitum access to water.
Apparatus and stimuli
The localization task was carried out in a circular arena of 70 cm radius enclosed by a hemispheric mesh dome, which was located inside a double-walled testing chamber. Twelve loudspeakers were positioned at 30° intervals around the perimeter of the arena and hidden from the animal by a muslin curtain. A raised platform was positioned near the center of the arena. The animal had to stand on this platform and initiate a trial by licking a centrally positioned waterspout. This ensured that its head was positioned at the center of the arena, facing the speaker at 0°, when sound stimuli were delivered at the beginning of each trial. Speakers to the animal’s left are denoted by negative numbers and those to the right by positive numbers. A waterspout was also positioned below each of the speakers from which the animal received a small amount of water if it correctly judged the location of the sound source. Our software recorded which reward spout the animal licked first on each trial, thereby registering the magnitude and direction of the localization errors.
All stimuli were broadband noise bursts (with a low-pass cut off frequency of 30 kHz) generated afresh each time using Tucker-Davis Technologies (Alachua, FL, USA) System 2 hardware. The stimuli were filtered using the inverse transfer function for each speaker in order to obtain a flat spectrum, and matched for overall level across the different speakers. The animals were initially trained to approach the speakers using continuous noise. Once the animals had learned the task, data were collected using sound durations of 2000, 1000, 500, 200,100 and 40 ms. In each testing session, the sound duration was kept constant while the level was roved pseudorandomly from trial to trial in 7 dB steps from 56 to 84 dB SPL. This was done in order to disrupt potential ‘absolute level cues’ arising from the acoustic shadowing caused by the animal’s body and which could allow target localization based on the relative loudness of the stimulus.
Training
Naïve animals took about a week to learn the task. They were trained to stand on the central platform and lick the start spout continuously for 500–2000 ms until the stimulus was presented from 1 of the 12 possible speaker locations. They were allowed up to 15 s to approach and lick 1 of the 12 corresponding reward spouts before the next trial could be started. Water rewards were delivered only if the animal made a correct response by licking the spout associated with the speaker from which the stimulus had been presented. To avoid bias toward particular speaker locations, an incorrect response was followed by a correction trial (same stimulus and location) up to two times. If the animal continued to mislocalize the sound, an easy trial (comprising a continuous series of noise bursts from the same location) was presented. Neither the correction nor the easy trials were included in the analysis. Typically each 14-day testing period started with the longest sound duration (2000 ms), which was gradually reduced after at least 300 trials had been performed at each of the stimulus durations.
Head orienting responses
In addition to the approach-to-target responses, we measured the change in head orientation following the presentation of the stimulus by tracking the movement of a self-adhesive reflective strip attached to an area of shaved skin along the midline of the animal’s head. Using an overhead infrared-sensitive camera and video contrast detection device (HVS Image, Harlow, UK), the x–y coordinates of the reflective strip were registered for 1 s following stimulus onset at a rate of 50 frames per second. From these coordinates we calculated the angular extent of the orienting response relative to the initial head position. A head turn was defined as a movement in the same direction over three consecutive frames, with the timing of the first frame following stimulus onset being taken as the latency of the movement. The initial head orienting response was considered to be complete when a change in the direction of the movement was recorded. The timing of the last frame before the head direction changed was taken as the end of the initial head turn. The final head bearing was calculated as the mean angle from the last three frames of the initial movement or, if a change in direction was not observed, from the last three frames recorded during the 1 s over which the head coordinates were sampled. Trials were excluded if the initial head angle (at the time of sound onset) deviated by >7° from straight ahead or if the head movement latency exceeded 500 ms.
Data analysis
Our software registered the reward spout licked by the animal and converted this to a percent correct-score and error magnitude and direction for each trial. These values, along with the head movement data and the associated stimulus parameters (location, duration and level), were exported to Excel (Microsoft Corporation, Redmond, WA, USA) for further analysis and presentation. The algorithms used to measure head movement latency and accuracy were implemented in advance and carried out automatically, therefore avoiding any possibility of subjective variations in the data analysis. The statistical analysis was done with SPSS software (SPSS Inc., Chicago, IL, USA).
Results
All naïve animals typically learned the approach to target task within a week of commencing training, after which we started the data collection. The results presented here are based on the analysis of 43,776 approach-to-target trials that each yielded a good head tracking signal.
Approach to target responses
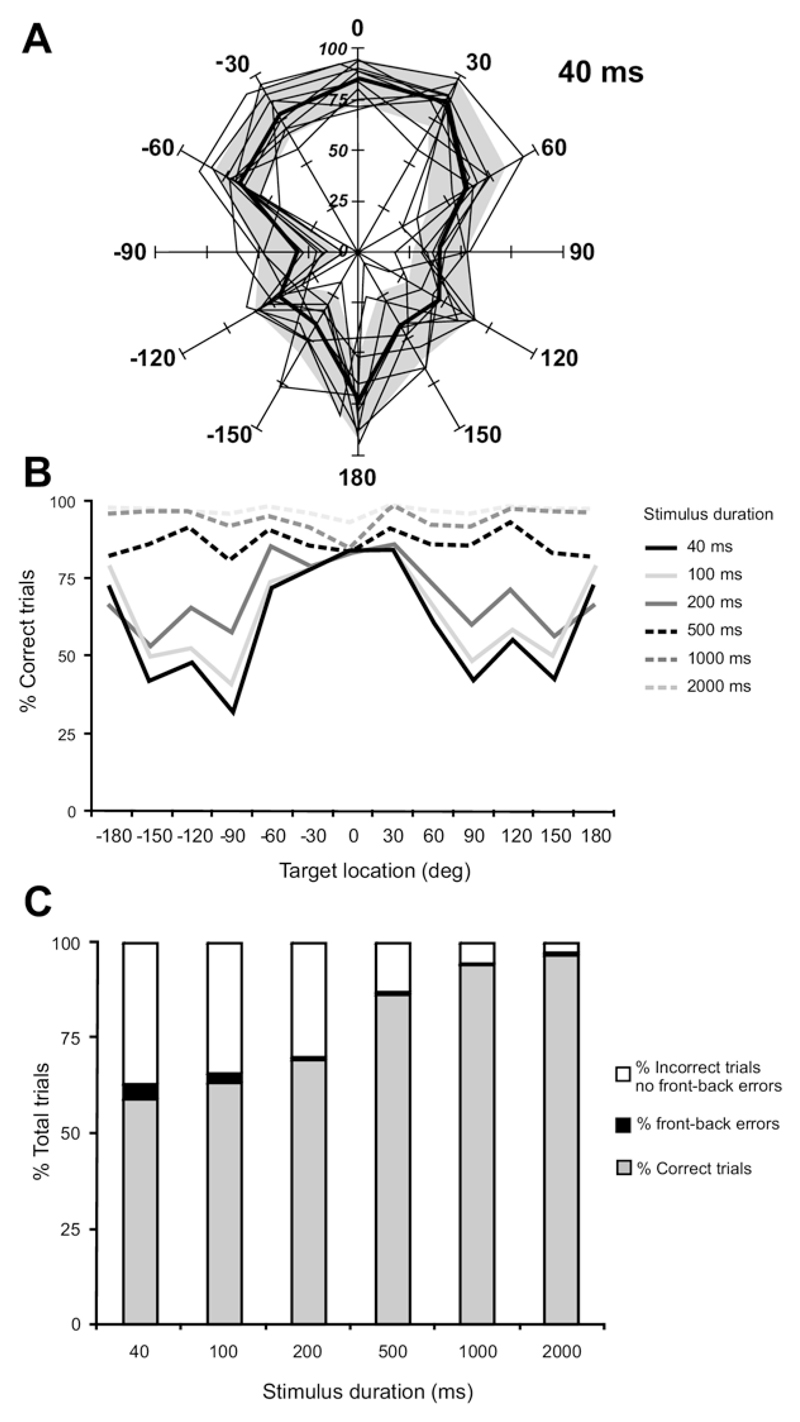
Despite some differences in the overall performance of individual animals in the 360° approach-to-target task (ANOVA F 9,3554 = 7.019; P<0.001), a consistent pattern was observed (Fig. 1A). Typically, the performance measured as the percent correct score declined as the stimulus duration was reduced and with more lateral and posterior target locations (Fig. 1A–C).
Fig. 1.
Effect of stimulus duration and direction on auditory localization accuracy. (A) Percent correct scores at each of the 12 speakers positioned at equal intervals in the horizontal plane. 0° Is directly in front of the animal; negative speaker angles indicate stimulus locations on the animal’s left. Data are shown for a sound duration of 40 ms. The performance of individual animals is indicated by the thin lines and the overall mean performance by the thick black line. The gray area corresponds to 1 standard deviation on either side of this group mean. (B) Mean percentage correct scores for all animals at each sound duration and azimuth location tested. Data obtained at the speaker location directly behind the animals are shown as both 180° and − 180° in order to highlight the left–right symmetry of the responses. (C) Data pooled from all animals and speaker locations showing the percentage of correct trials, front–back error trials and all other error trials for each stimulus duration.
At the longest stimulus durations (≥500 ms), performance was constant across different target locations, with most animals achieving scores of >80% correct at all angles tested (Fig. 1B). At shorter stimulus durations (≤200 ms), similarly high scores were obtained in the anterior region of space, whereas performance declined markedly for lateral and posterior locations (Fig. 1A, B). This decrease in percent correct score for the briefest stimuli to about 50% for target locations from 90 to 150° on both sides accounted for most of the overall decline in localization accuracy as the stimulus duration was reduced (Fig. 1B, C). In contrast to the relatively poor performance in these regions of space, the ferrets accurately localized brief noise bursts presented at 180°, directly behind the animal. Indeed, the percent correct score for this location consistently approached that found for anterior targets. Because we roved the level of the stimuli over a 28 dB range within each testing session, we can be confident that the high scores obtained for sounds presented directly behind the body were not a result of the animals learning to identify specific stimulus locations on the basis of loudness cues.
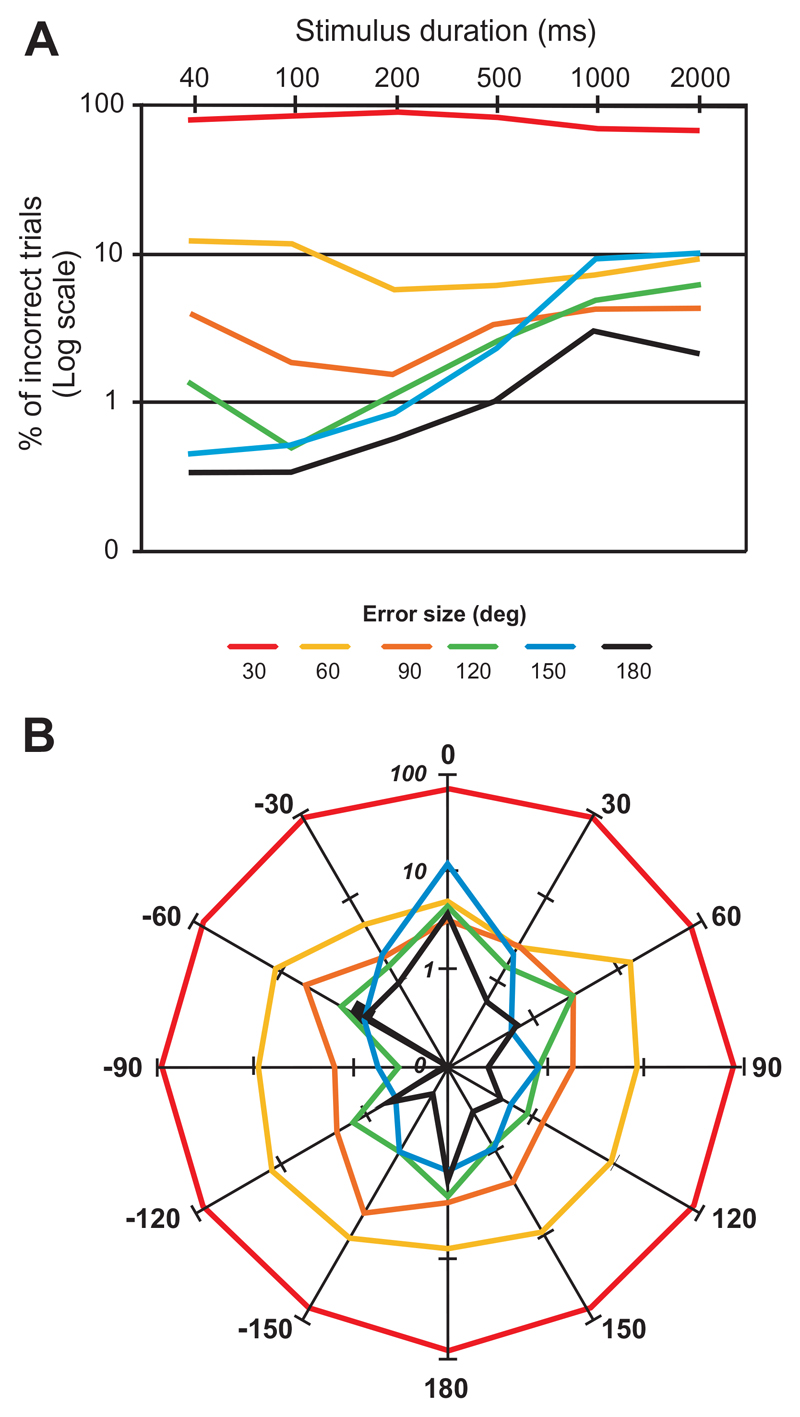
The percent correct values provide a measure of the accuracy of localization behavior, whereas the distribution of the errors indicates the precision of the responses. Although the number of incorrect responses increased as the stimulus duration was reduced (Fig. 1C), the precision was less affected (Fig. 2A). In fact, in almost 85% of trials in which an incorrect response was made the error was 30°, i.e. the animal licked the adjacent reward spout. This was found to be the case independent of stimulus duration (Fig. 2A) or target location (Fig. 2B).
Fig. 2.
Variation in localization error magnitude with stimulus duration and target direction. (A) Incidence of error magnitude (in increments of 30°, the intervals between the speakers) at each sound duration; data are pooled for all speaker locations. (B) Incidence of error magnitude at each of the 12 speaker locations; data are pooled for different sound durations.
In our 360° 12-speaker setup, the smallest error that could be registered in the approach-to-target task was 30°. Where larger errors were made, most of these were of 60°, which represented ~10% of the total number of errors. Again, this was found for all stimulus durations (Fig. 2A) and speaker locations (Fig. 2B). Although the overall proportion of incorrect responses increased as the stimulus duration was reduced, the relative incidence of errors >60° was higher for the longest sound durations than for shortest ones (Fig. 2A), particularly for midline locations (Fig. 2B).
Mislocalizations of sounds presented on one side to the opposite side (left-right errors) were extremely rare at any stimulus duration, representing <0.1% of all trials and <0.7% of the trials in which incorrect responses were made (Table 1). Consequently, when the animals made errors that were >60° in magnitude, these tended to be on the ipsilateral side and usually fell into the category of front–back errors (sounds presented in the frontal hemifield that are mislocalized into the posterior ipsilateral hemifield or vice versa). In keeping with the other measures of performance, the incidence of front–back errors was highest, at ~4% of all trials, for the 40 ms noise bursts. However, in the very few trials where the stimuli were mislocalized at the longest sound durations (>1000 ms), front–back errors made up a larger proportion of those errors than was the case at shorter durations (Table 1).
Table 1. Localization performance combined across all animals (n = 10) as a function of the duration of the broadband noise stimulus.
| Sound duration (ms) | ||||||
|---|---|---|---|---|---|---|
| 40 | 100 | 200 | 500 | 1000 | 2000 | |
| Total number of trials | 6359 | 7177 | 7382 | 7898 | 7688 | 7272 |
| % Correct | 59.03 | 63.48 | 69.53 | 86.50 | 94.16 | 96.84 |
| % Front–back errors | 4.01 | 2.23 | 0.75 | 0.85 | 0.65 | 0.63 |
| % Left–right errors | 0.08 | 0.03 | 0.03 | 0.03 | 0.04 | 0.01 |
| % Other errors | 35.84 | 33.52 | 28.69 | 11.74 | 4.58 | 2.27 |
| Number of incorrect trials | 2605 | 2621 | 2249 | 1066 | 449 | 230 |
| % Front–back errors | 9.79 | 6.10 | 2.45 | 6.29 | 11.14 | 20.00 |
| % Left–right errors | 0.19 | 0.08 | 0.09 | 0.19 | 0.67 | 0.43 |
| Error size (deg) (mean±SD) | ||||||
| All incorrect trials | 33.84±14.71 | 33.62 ±13.87 | 34.08 ±17.76 | 35.57 ±20.67 | 45.45 ±36.76 | 39.67± 30.16 |
| Front–back errors | 78.24±24.46 | 76.50±26.45 | 90.00±34.16 | 110.15±39.22 | 126.00±37.85 | 120.00±32.86 |
| Left–right errors | 90.00±21.21 | 60.00±0.00 | 135.00±21.21 | 90.00±42.43 | 140.00±17.32 | 120.00 |
| Time to response (s) (mean±SD) | ||||||
| Correct trials | 1.96±0.56 | 1.98±0.67 | 1.89±0.62 | 1.83±0.61 | 1.79±0.58 | 1.76±0.60 |
| All incorrect trials | 2.15±1.2 | 2.11±0.94 | 2.17±1.13 | 2.54±1.71 | 2.93±2.10 | 2.91±2.1 |
| Front–back errors | 2.31±0.86 | 2.85±2.89 | 3.16±3.2 | 3.50±3.22 | 2.63±1.9 | 2.51±2.2 |
| Left–right errors | 3.54±3.15 | 2.85±0.07 | 11.55±1.76 | 2.15±1.34 | 4.63±4.66 | 3.00 |
| Head latency (ms) (mean SD) | ||||||
| Correct trials | 218.15±139.53 | 197.02±129.81 | 180.37±107.95 | 186.84±110.16 | 198.15±123.9 | 195.50±125.79 |
| All incorrect trials | 237.40±150.67 | 214.52±136.37 | 211.01±127.08 | 258.28±165.07 | 268.71±165.27 | 256.58±162.6 |
We did not find any systematic effects of varying the sound level (from 56 to 84 dB SPL) on the accuracy or precision of auditory localization (Fig. 3) (ANOVA F 4,3559 = 1.314, P 0.26). Moreover, and in line with a previous study (Smith et al., 2004), the performance of the animals remained at a constant level over the period of testing, with similar scores achieved in the first testing run, carried out after only 2 weeks of training, and the last run, which, in some cases, took place several months later.
Fig. 3.
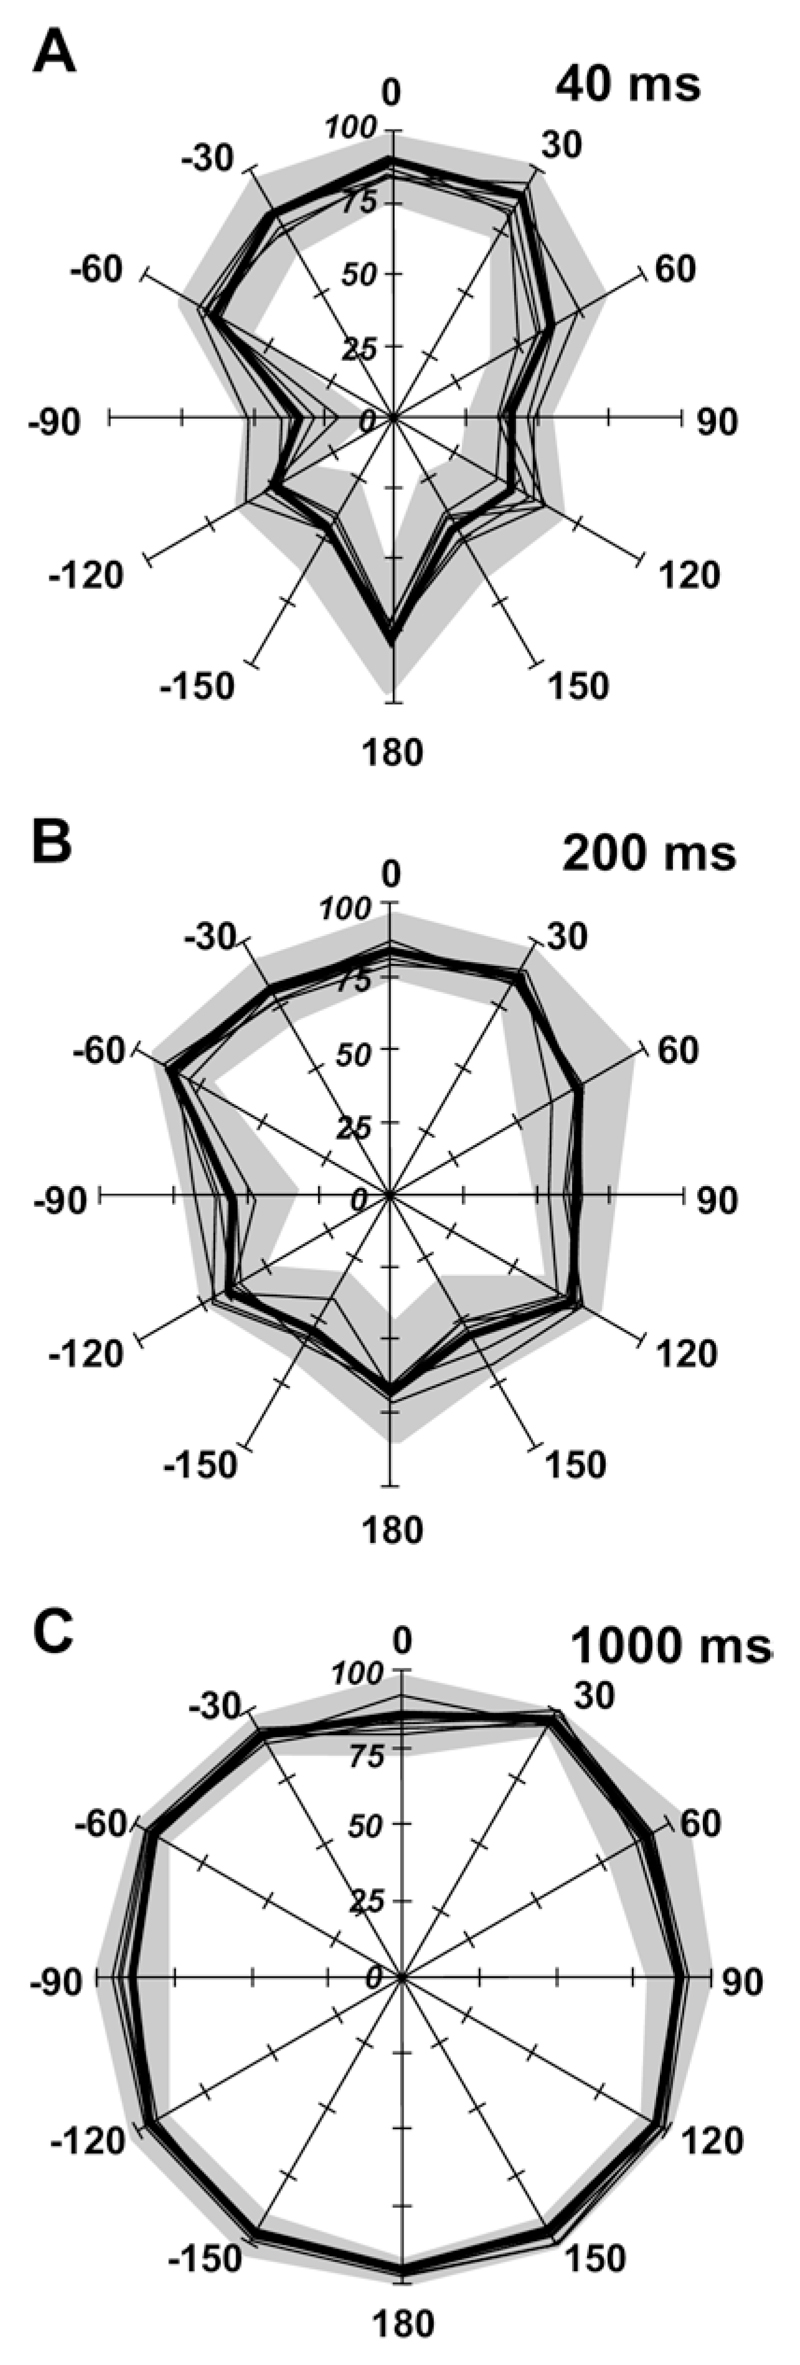
Effect of sound level on auditory localization accuracy. Percentage correct scores at each of the 12 speakers for 40 ms (A), 200 ms (B) and 1000 ms (C) noise bursts. The mean values obtained at each of the five sound levels used (from 56 to 84 dB SPL) are indicated by the thin lines and the overall mean performance by the thick black line. The gray area corresponds to 1 standard deviation on either side of this group mean. Varying sound level had little effect on localization accuracy at any of the stimulus durations.
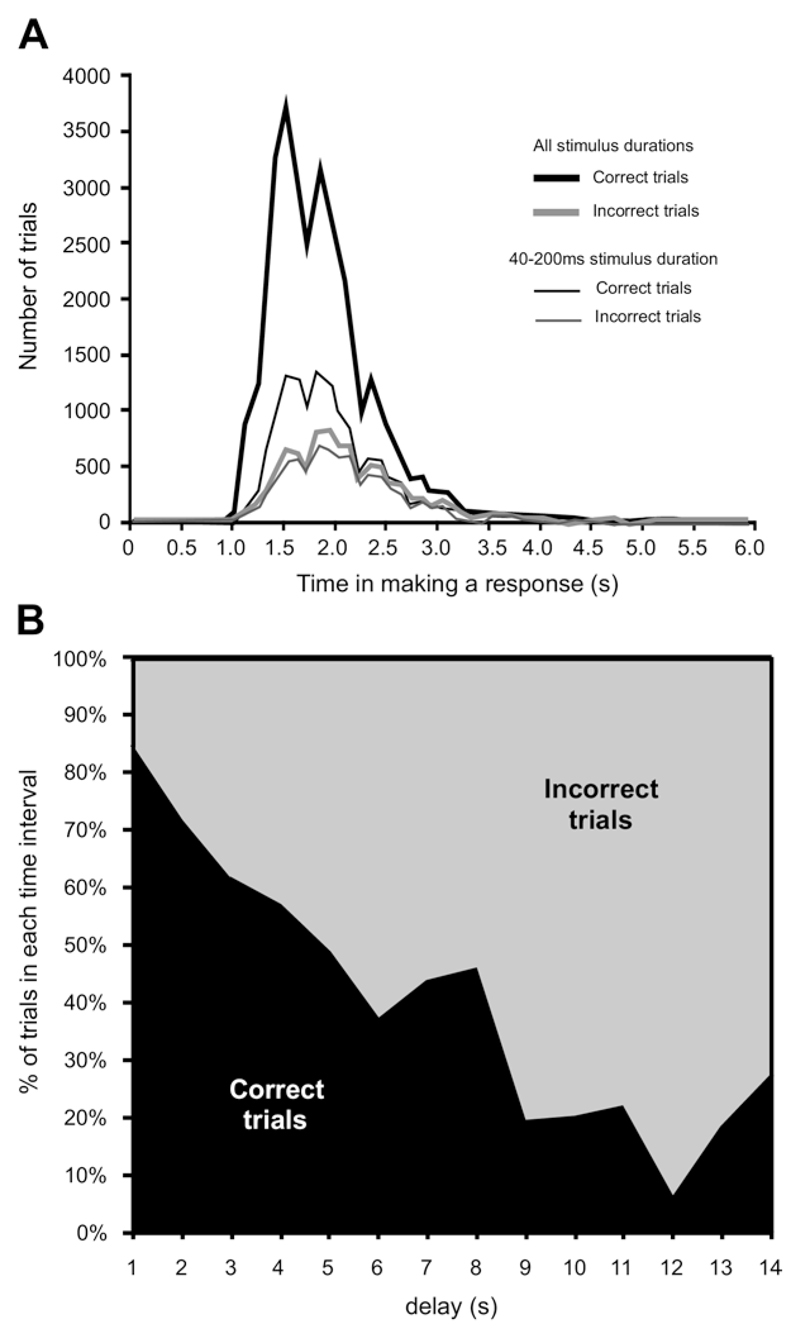
The ferrets were allowed up to 15 s to respond following the onset of the stimulus, after which a new trial had to be initiated by the animal returning to the central platform. The mean response time from sound onset to the animal licking a reward spout was ~2 s (see Table 1 for a detailed breakdown by stimulus duration) and 99.47% of the responses were made within the first 6 s (Fig. 4A). These short response times indicate that at the longest stimulus duration (2000 ms), the animals normally reached the reward spout while the stimulus was still being presented. Moreover, for stimulus durations ≥500 ms, the animals could potentially receive auditory feedback or track the sound source to some extent while moving. The response times were, however, slightly longer with the short noise bursts (≤200 ms), which were over before the animals started to move (see following text on head movements). No clear differences were found at any stimulus duration in the time it took for the animals to reach the different reward spouts.
Fig. 4.
Response time in the auditory localization approach-to-target task. (A) Distribution of times between stimulus onset and the animal licking a reward spout, subdivided by whether the animals approached the correct reward spout (‘correct trials’) or not (‘incorrect trials’). The thick lines represent all trials, whereas the thin lines represent only the trials for the three shortest stimulus durations (40, 100 and 200 ms). (B) Proportion of correct and incorrect trials for different response times, grouped in 1 s intervals, for all sound durations and target locations. Note that correct responses tended to be made more quickly than incorrect ones.
We observed that correct responses tended to be faster than incorrect ones (Fig. 4A, B). To confirm this, we constructed a two-dimensional contingency table, with one variable being whether a correct approach-to-target response was made or not and the other the time to respond binned in 1 s intervals. To avoid any bias due to infrequent long trials, we considered only those trials that took less than 6 s and only the data for the three shortest sound durations, in order to ensure that the animals could not scan the sound field or follow the sound. The statistical significance of the contingency table (χ 2 5 = 199.14; P<0.001) shows that the two variables were indeed correlated, and therefore that the response time provides some indication of the outcome of a given trial. Furthermore, the response times were found to increase when larger errors were made.
Head orienting responses
Prior to leaving the central start platform in order to approach the perceived location of the sound source, the ferrets typically oriented the head in that direction. The only trials in which no sound-evoked head movements were observed were those in which the animals were engaged in other activities, like chewing the central spout or scratching themselves. Some analyzed trials showed either small amplitude or no head movements; those trials normally corresponded to stimulus presentations at 0° or, more infrequently, at 180°, and were interpreted as normal orienting behavior for those locations (Fig. 5).
Fig. 5.
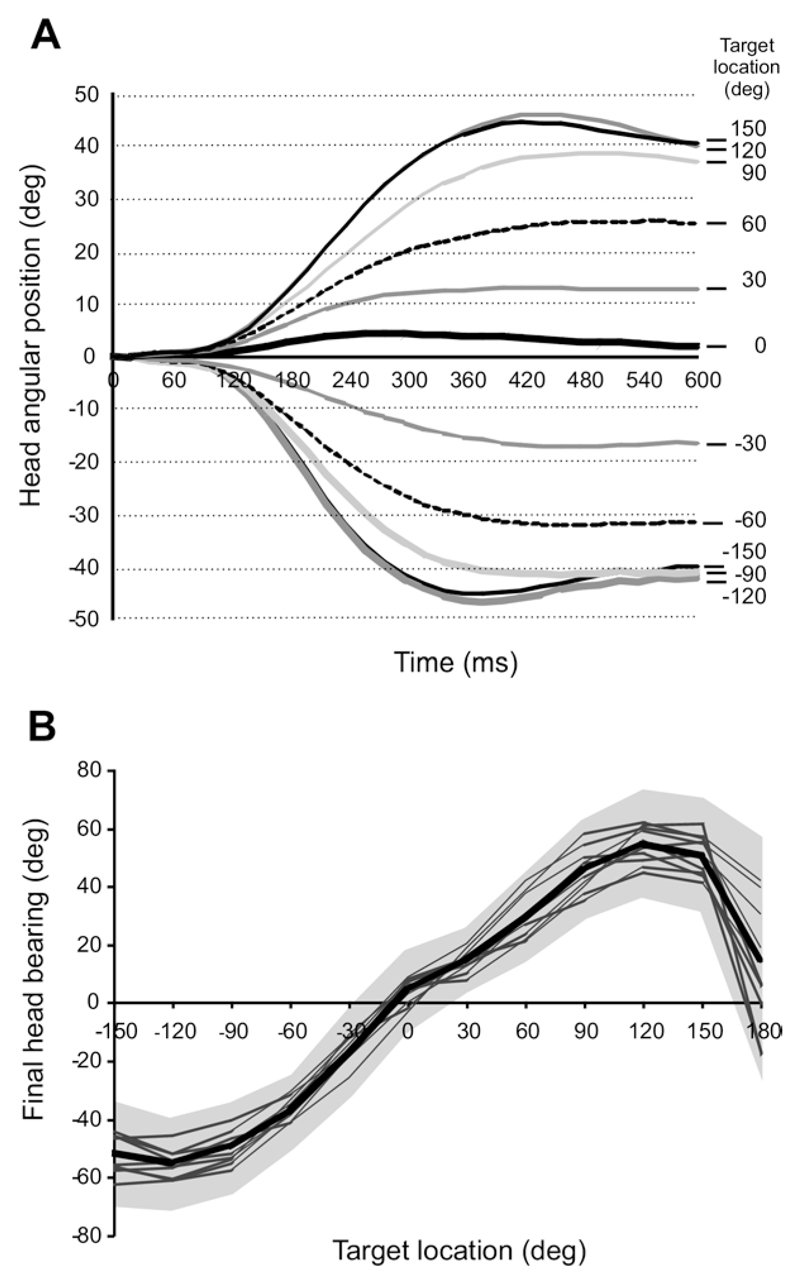
Sound-evoked head orienting responses. (A) Plot showing how the mean horizontal angle of the head changes over time after stimulus onset for the different target locations. Only data from correct approach-to-target trials are shown. Negative values indicate positions toward the left and positive values to the right. (B) Mean final head bearing plotted against stimulus location. Mean values from individual animals are indicated by thin lines and the overall mean by the thick line. The gray area corresponds to ±1 SD of the overall mean. Note the increasing undershoot in the final head bearing with increasing eccentricity of the target location and the greater variability for targets at 180°.
Because the final head bearing did not determine whether or not the animals were rewarded, we used the approach-to-target responses to subdivide the head movements into correct or incorrect trials. The following description of the head movement dynamics is based on correct trials only, where stimulus and approach-to-target response locations were the same. Below we will compare head movements in trials with correct and incorrect approach-to-target responses. Typical head movements for the different target locations are plotted as angular position versus time following sound onset in Fig. 5A. The head movements formed a series of approximately sigmoidal curves, with both the slopes (angular velocities) of the exponential phases and the asymptotes (final bearing) varying systematically with the target location (Fig. 5). The absolute values of the slopes and final head bearing increased systematically as the stimulus location was changed progressively from 0° out to ±120°. No further increases in the amplitude of the head turn were observed when the stimulus was presented in the posterior hemifield (±150°), presumably because the animal left the central platform and then turned its whole body in the direction of these stimulus locations. A different pattern of orienting behavior was found for stimuli presented directly behind the animal (±180°), which is considered in more detail in a later section.
A linear relationship was found between target location and final head bearing for stimuli presented within the frontal hemifield, irrespective of their duration (Fig. 5B; R 2 varied from 0.992–0.996), with no differences in the slope or the intercept between the regression lines for different stimulus durations (ANOVA slopes: F 5,35 = 0.496, P = 0.77; intercepts: F 5,35 = 0.93, P = 0.93). Nevertheless, a consistent undershoot was observed at all speaker positions (Fig. 5A, B) and the maximum single head movement recorded was ~60°.
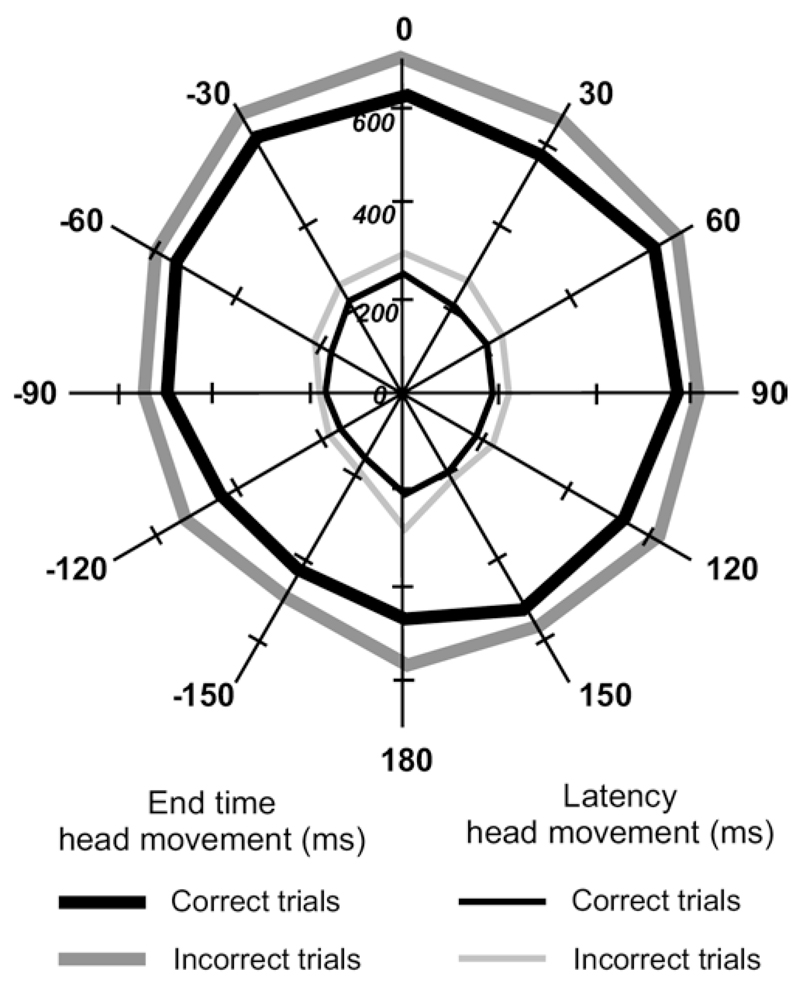
The mean ± SD latency of the head orienting movements for correct approach responses was 195.71±122.58 ms, but significantly longer, at 221.81±145.76 ms, when the animal subsequently approached and licked the wrong reward spout (F 1,43775 = 303.42, P<0.01). Thus, as for the response time from sound onset to the animal licking a reward spout, the latency of the orienting movements varied according to whether a correct response was made or not (Fig. 6). Similarly, the final head bearing was reached later (F 1,43775 = 595.66, P<0.01) on incorrect trials (594.51±203.89 ms) than on correct ones (540.47±184.73 ms).
Fig. 6.
Mean latency (thin lines) and end time (thick lines) of the initial head turns, shown for trials in which the animal approached and licked either the correct or incorrect reward spout. Note that head orienting movements tended to have shorter latencies on correct trials.
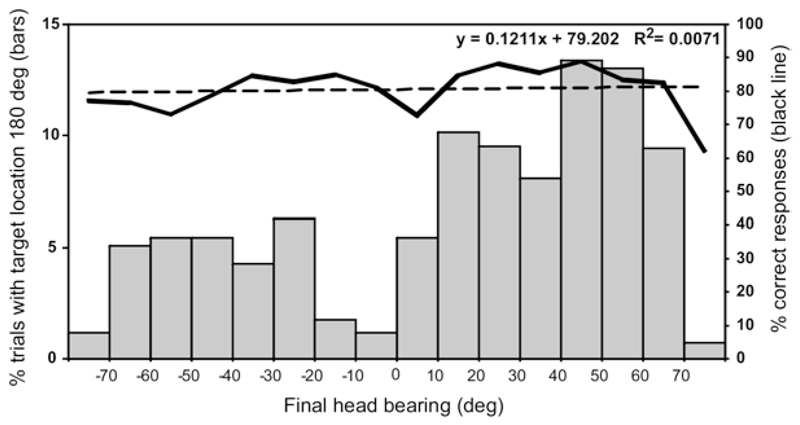
Consistent with the lack of left–right errors in the approach-to-target responses, the animals made orienting movements in the appropriate direction for stimuli presented to each side of the midline (Fig. 5). When stimuli were presented directly in front at 0°, either no measurable head movement was observed or a small movement (<10°), normally toward the right, was recorded. By contrast, sounds presented behind the animal, at ±180°, gave rise to head movements that were highly variable in amplitude (final bearing) and direction (Fig. 7). Most commonly, large head movements were made similar to those observed in response to adjacent target locations in the posterior hemifield, although a very poor correlation was found between the final head bearing and the correct-score percentage derived from the approach-to-target responses for this stimulus location. As observed for stimuli presented at 0°, the responses to targets at 180° exhibited a rightward bias. We have also observed this bias in other setups in which ferrets were trained to use their paws to press a button, raising the possibility that they tend to be right handed.
Fig. 7.
Distribution of final head bearings in response to target location at 180°, grouped in 10° intervals. The direction and magnitude of these head movements were highly variable and showed no correlation with the consistently high percent correct score for that target location (shown by the thick black line; the dashed line is the linear regression line for the percentage correct score versus head bearing angle).
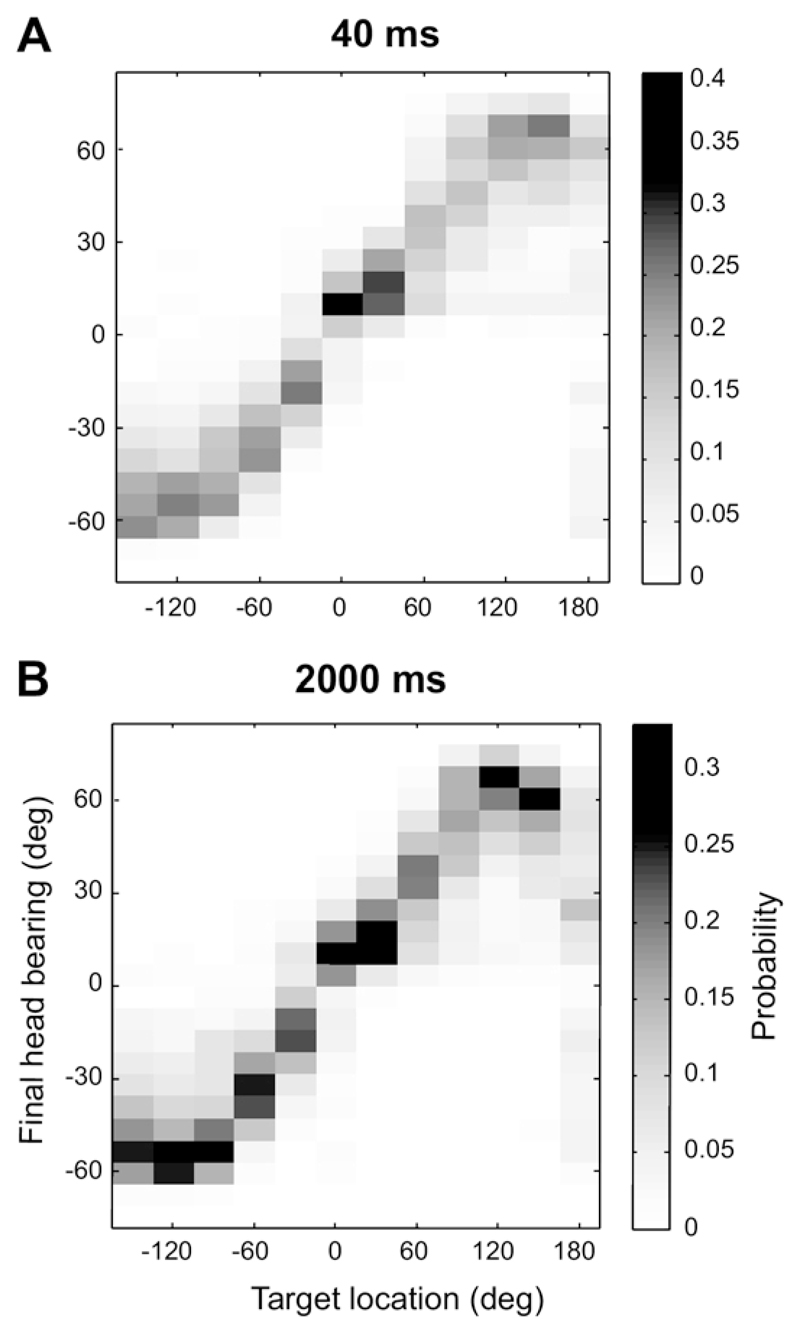
As shown in Fig. 1, the accuracy of the approach-totarget responses varied quite markedly with the duration of the stimulus. To explore the possible effect of stimulus duration on the final head bearing, we pooled the data from all animals for the shortest (40 ms, 6359 trials), and longest (2000 ms, 7272 trials) durations. Final head bearings were grouped in 7.5°-wide bins and the observed frequencies normalized for each target location, so that the resulting values could be read as estimates of the conditional probability of a particular final head bearing given a particular target location (Fig. 8). We used those distributions to calculate the mutual information between the final head bearing and the target location using the formula:
where r is the final head bearing, s is the stimulus location, MI(r;s) is the mutual information between r and s, p(r, s) is the joint probability of r and s (which was obtained from the conditional probability values; see Fig. 8) and is equivalent to p(r|s) p(s), where p(s) equals 1/12, as there are 12 equiprobable speakers, and p(r) is obtained from the overall distribution of head bearings (or, equivalently, from summing p(r, s) across all s).
Fig. 8.
Distribution of the conditional probabilities of final head bearings given the target locations shown on the x axis for stimulus durations of 40 ms (A) and 2000 ms (B). See main text for details. These conditional probabilities were estimated from the observed response frequencies.
The mutual information values between head bearing and target location obtained for both stimulus durations were very similar, 1.21 bits for 2000 ms and 1.22 bits for 40 ms indicating that, despite the differences in performance in the approach to target task, the final head bearing is equally informative for both stimulus durations. This is perhaps not entirely surprising: long stimulus durations provide the animal with an opportunity to collect further information and to correct initial misjudgments as it moves toward the reward spouts, thus improving the performance in the approach-to-target task, but by that time it is too late to correct mistakes in the initial, short-latency head orienting response.
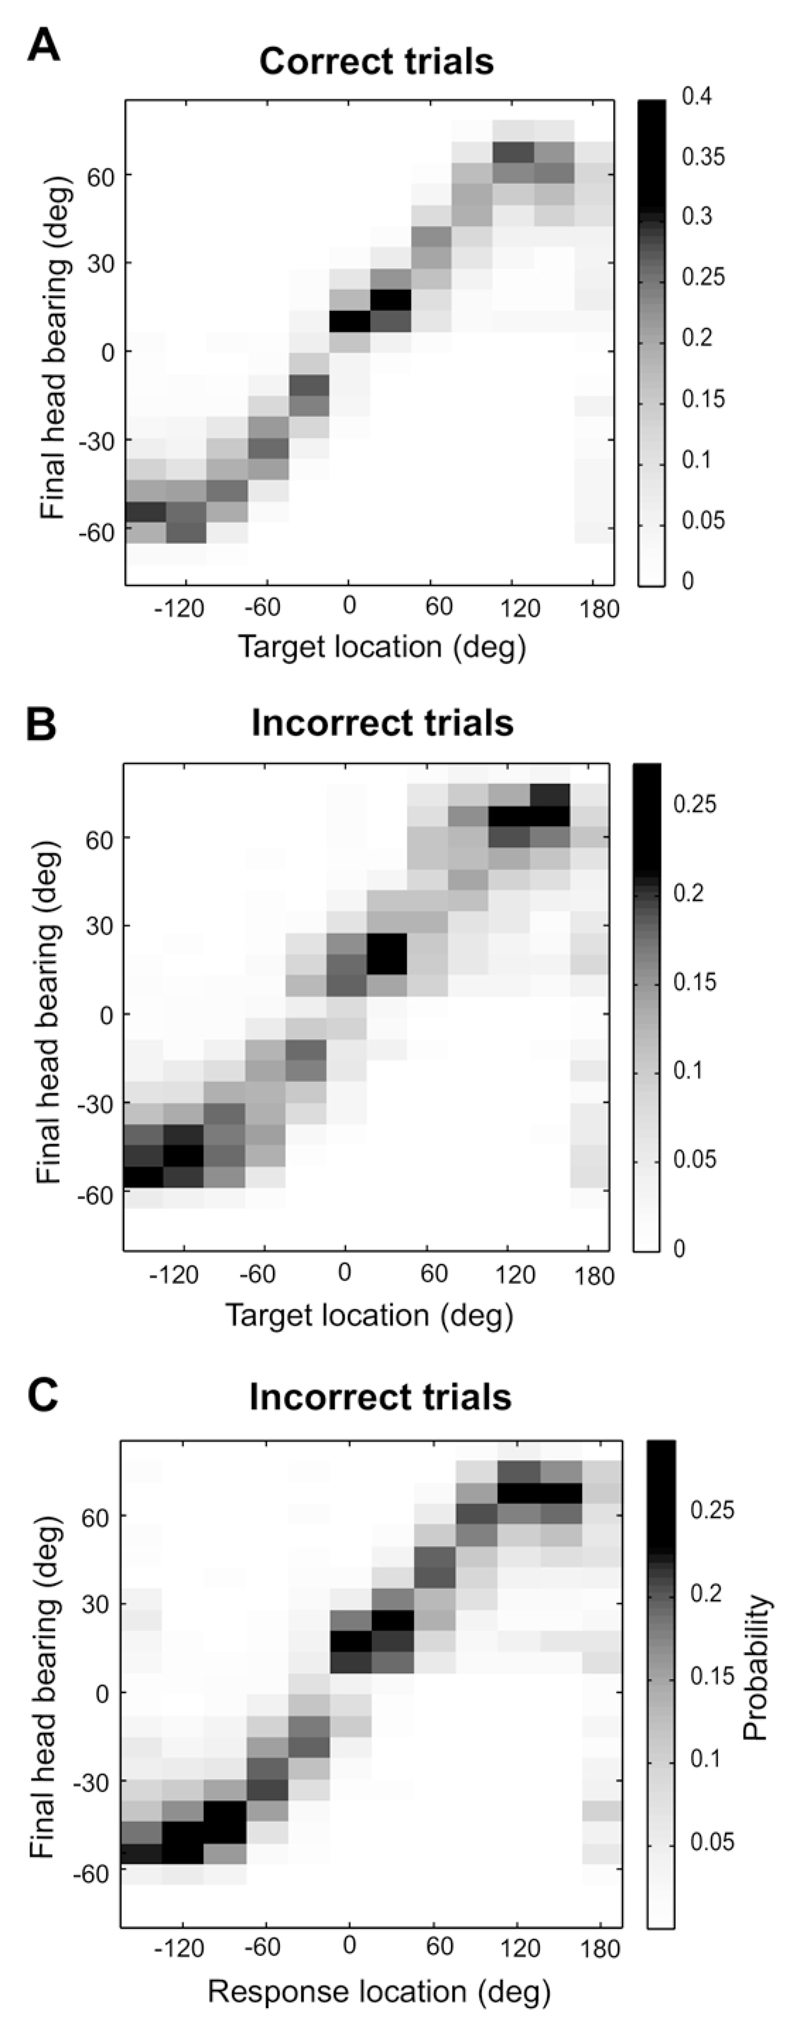
One question of particular interest to us is the extent to which approach-to-target and head orienting responses are mediated by the same neural circuits. If they are controlled independently, then we would expect the two types of localization response to exhibit independent errors. On the other hand, if errors arise predominantly in the parts of the neural processing streams that are common to both, then we would expect errors in head orienting and approach-to-target responses to be correlated. To distinguish these possibilities, we further analyzed the head turn data for all trials where the stimulus duration was ≤200 ms, where both the head turn and the approach-to-target response must be based on the acoustical cues values available at sound onset. The distribution of head orienting responses is shown for correct and incorrect approach-totarget trials in Fig. 9A and 9B, respectively. Although similar, the distribution of head turns in incorrect trials is more scattered than that observed when the animals subsequently approached the correct speaker location. This is confirmed by the greater mutual information between the final head bearing and target location for the correct trials (1.39 bits) than for the incorrect trials (1.00 bit).
Fig. 9.
Distribution for the three shortest stimulus durations (40–200 ms) of the conditional probabilities of the final head bearings as a function of target location for correct trials (A, n = 13443) and for trials where the approach-to-target response was incorrect (B, n = 7475). The distribution for the incorrect trials shown in B shows greater dispersion than that for the correct trials shown in A. (C) Conditional probabilities of final head bearing for each approach-to-target response location in the trials where the animal approached the wrong reward spout (same trials as in B). Note that the data shown in B are more dispersed than those in C, suggesting that the head orienting response is more closely related to the location approached by the animals than by the actual direction of the target.
This relationship between the distribution of head orienting responses and the accuracy of the conditioned localization behavior suggests that the final head bearing should be more predictive of approach-to-target response directions than of the actual target direction. This was indeed the case, as shown by our finding that, for incorrect trials, the distribution of head orienting responses at different approach-to-target response locations (Fig. 9C) was less scattered and carried more information (1.14 bits) than when the final head bearing was plotted as a function of target location (Fig. 9B). To investigate whether these differences are statistically significant, we devised a simple ‘head-bearing decoder’ based on the observed head bearing distributions for the correct trials shown in Fig. 9A. By inverting the conditional probability distribution shown in Fig. 9A using Bayes’ formula, we obtained the distribution of ‘target direction’ given a particular head bearing. With this we can easily ‘decode’ a final head bearing, simply by looking up which direction is the most probable. For these correct trials, the stimulus and the approach-to-target response directions are obviously the same.
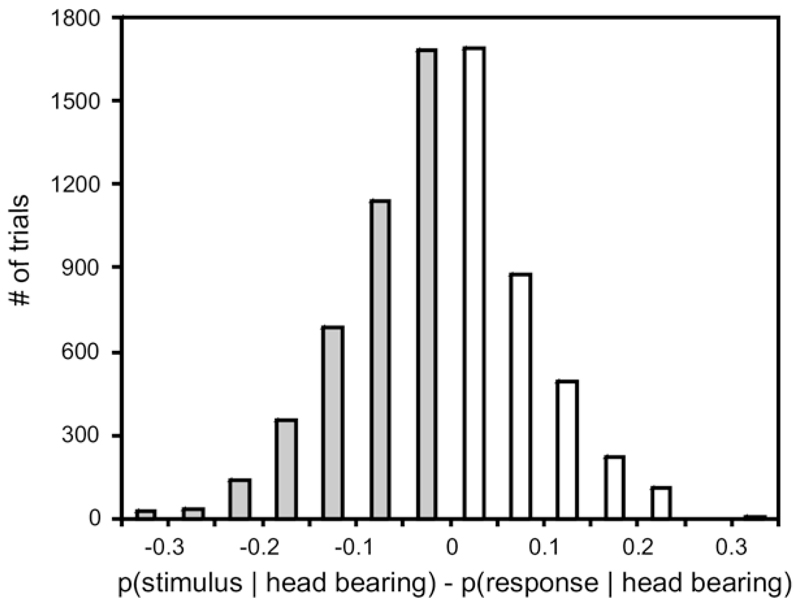
We used this decoding scheme to analyze the incorrect trials, asking, for each of those trials, whether, given an observed head bearing, the stimulus direction or the approach-to-target response direction is the more likely. We found that the probability of the approach-to-target response direction, p(response | head bearing), was 0.151±0.094 (mean±SD), and was, on average, slightly larger than the probability of the sound source direction, p(stimulus | head bearing), which was 0.135 0.092. In other words, the head bearing predicted the subsequent approach-to-target response direction more accurately than the actual stimulus direction, which would not be expected unless errors in the head movement and the approach behaviors were correlated. The difference is not large, but, statistically highly significant (P<0.0001, paired t-test). Fig. 10 further illustrates this by showing the differences between p(stimulus head bearing) and p(response head bearing) in histogram form. Note that the distribution is not symmetrically distributed around zero, but shifted slightly toward negative values, indicating that p(response | head bearing) was indeed, on average, larger than p(stimulus | head bearing).
Fig. 10.
Histogram of differences between the conditional probabilities p(target location | final head bearing) and p(response location | final head bearing) for the 7475 incorrect trials obtained with stimulus durations of ≤200 ms. The histogram is centered around slightly negative values (mean= -0.016), which indicates that, on average, head bearing predicts approach-to-target response direction more accurately than stimulus direction.
Discussion
We have examined the accuracy with which ferrets localize broadband sounds of varying level and duration presented from 1 of 12 loudspeakers within the horizontal plane. We analyzed both the initial head orienting response toward the source of the sound and the subsequent locomotor behavior as the animals approached the speaker from which the stimulus had been presented in order to receive a water reward. Although both measures can be regarded as part of the natural response to sounds presented from different directions in space, there are fundamental differences between them. By conditioning the animals to approach the source of the sound to obtain a reward, we were using a categorization task in which they had to select which of the 12 loudspeaker/reward-spout combinations most closely matched the perceived source direction. By contrast, the initial head turns were unconstrained by the location of the reward spouts and therefore provided a more absolute measure of localization accuracy. Despite some differences in the pattern of responses, particularly as the duration of the stimulus was varied, we observed a good correlation between the head orienting and approach-to-target responses, suggesting that there are commonalities in the neural processing strategies involved in these behaviors.
Auditory localization in ferrets
In contrast to most other animal studies, which have focused exclusively on localization within the frontal hemifield source (e.g. Jenkins and Masterton, 1982; Kavanagh and Kelly, 1987; Heffner, 1997; Malhotra et al., 2004), we measured responses over the full 360° azimuthal range. As a result, the speakers had to be spaced at 30° intervals, which is comparable to the minimum audible angles that have been reported for ferrets in the lateral sound field (Kavanagh and Kelly, 1987; Parsons et al., 1999). Spatial acuity is much better in this species at the anterior midline (Kavanagh and Kelly, 1987; Parsons et al., 1999), which is supported by our finding in the present study that the ferrets localized brief noise bursts more accurately in the frontal sound field than at more lateral or posterior locations. Similar findings have also been made in other species (Mills, 1958; Knudsen et al., 1979; Oldfield and Parker, 1984; Rauschecker and Kniepert, 1994; May and Huang, 1996).
It is possible that the dependence of auditory localization accuracy on the direction of the sound source reflects the acoustical cues available in different regions of space. For instance, richer spectral cues are produced by anterior sound sources than by those located more peripherally (Huang and May, 1996), while the rate at which these features change has been found to vary across azimuth (Carlile, 1990). Neural correlates of the azimuth dependence of localization accuracy have also been described. Thus, in the SC, where sound source direction is represented topographically, neurons with anterior receptive fields are more sharply tuned than those that prefer more lateral locations (Knudsen, 1982; Middlebrooks and Knudsen, 1984; King and Hutchings, 1987). Moreover, in non– space-mapped structures, such as the auditory cortex, the slopes of neuronal azimuth-response functions tend to be greatest, and therefore potentially convey most spatial information, near the midline (Stecker et al., 2005).
Despite the decline in their performance for lateral and posterior regions of space, we found that the ferrets achieved consistently high scores in the approach-to-target task when brief stimuli were presented from the speaker directly behind them. This has also been observed in humans (Oldfield and Parker, 1984) and indicates that azimuth localization is particularly accurate on the midsagittal plane, irrespective of whether the source is located in front of or behind the subject. This is compatible with the existence of two overlapping perceptual channels (Boehnke and Phillips, 1999), each occupying one side of space, and with the azimuth sensitivity of neurons in the auditory cortex, which are typically broadly tuned to the contralateral hemifield (e.g. Mrsic-Flogel et al., 2005; Stecker et al., 2005). If the slopes of the azimuth-response functions cross the midline both in front of and behind the animal, this could account for the heightened localization acuity in these regions of space.
Acoustic orientation in ferrets
The mean latency of the head orienting movements on trials in which the ferrets made a correct approach-to-target response was ~200 ms. This is much longer than the latency of acoustically-triggered head movements that have been measured in cats (Thompson and Masterton, 1978; Beitel and Kaas, 1993), but closer to the values reported in monkeys (Whittington et al., 1981) and much shorter than those made by humans instructed to turn toward a sound source (Perrott et al., 1987). Because our ferrets initiated each trial by licking a spout at the center of the testing chamber and then turned toward and approached the apparent source of the sound, it is possible that the initial head turn is not strictly equivalent to reflexive orienting responses made following the presentation of unexpected sounds. However, the latency of the initial head orienting response made by the ferrets may also have been influenced by the fact that the animals had been trained to maintain contact with the central spout for a variable amount of time before the sound was presented. Moreover, although a close relationship between the accuracy of the approach-to-target and head orienting responses was observed for most stimulus directions, the final head bearings were continuously distributed within a ±60° range of the anterior midline. This shows that the head orienting responses were not constrained by the actual speaker locations and suggests that they can be regarded as unconditioned.
As in previous studies (Perrott et al., 1987; Beitel and Kaas, 1993; May and Huang, 1996), the head orienting response progressively undershot the auditory target location as the speaker eccentricity was increased. We cannot rule out the possibility that eye movements might have contributed to larger gaze shifts that were more closely directed to the sound sources, although our own unpublished observations of eye position in awake, head-restrained ferrets suggest that these movements are quite limited. Moreover, ferret pinnae are not mobile and cannot therefore have contributed independently to the orientation response.
That the largest single head movements that we recorded were about 60° could reflect a limit on the capacity of the motor system to turn the head toward the target before the animal leaves the central platform in order to approach the sound source. Nevertheless, it is interesting to note that the amplitude of these movements increased systematically as the speaker angle was changed progressively from 0° out to 120°, which approximately matches the range of azimuths represented by the preferred sound directions of neurons in the ferret SC (King and Hutchings, 1987). By contrast, the final head bearings recorded for sounds presented directly behind the animal at ±180° were highly variable and bore no relationship to the associated approach-to-target response.
The effect of stimulus duration on auditory localization and orienting behavior
No differences were found in the accuracy of the approach-to-target responses over the 28 dB range of sound levels used, but we did find that performance varied substantially with the duration of the stimulus. However, a marked reduction in localization accuracy with short-duration noise bursts was observed only for lateral and posterior sound sources. Our finding that the percent correct scores were much less affected in the frontal region of space is consistent with a study of frontal spatial acuity in cats (Heffner and Heffner, 1988).
In contrast to the direction-dependent influence of stimulus duration on approach-to-target performance, we observed much less change in the pattern of head orienting errors as the noise burst duration was varied from 40 ms to 2000 ms. A lack of effect of stimulus duration on cat acoustic orientation behavior was also reported by May and Huang (1996), suggesting that the metrics of those responses are determined solely by the auditory localization cues available at sound onset. By contrast, Beitel and Kaas (1993) found that the mean head orientation error made by cats decreased in size as the duration of the acoustic stimulus was increased, which they attributed to corrective responses being made on the basis of auditory feedback while the longer stimuli were still present. We attempted to measure single, saccadic head movements in response to each stimulus, so it is possible that if we had sampled these movements over a longer period of time or prevented the animals from leaving the start platform, then we would also have observed scanning orienting responses that varied in accuracy with the duration of the stimulus.
A corollary of the lack of minimal effect of stimulus duration on the direction and magnitude of the head turns is that the improvement in approach behavior with longer sounds reflects the availability of dynamic auditory localization cue values once the head changes position or even, for the longest durations, the ability of the animals to track the sound. Indeed, some studies have shown that head movements can result in improved elevation judgments and front–back discrimination by human listeners (Perrett and Noble, 1997; Wightman and Kistler, 1999, but see Vliegen and Van Opstal, 2004). We found that ferret auditory localization accuracy changed most when the stimulus duration was reduced from 500 to 200 ms. Given that the head orientation latency was approximately 200 ms, this is consistent with a contribution of head movements to the improvement that occurred with longer stimuli. It should be noted, however, that the ferrets took no longer to respond to lateral and posterior locations, where localization accuracy improved with longer signals, than they did to the frontal speakers where varying the stimulus duration had very little effect. This suggests that the animals approached the perceived sound source equally directly at all stimulus directions and that they did not spend time exploring the chamber, searching for the location where the sound was most intense, for those sources directions where performance improved at longer durations. We also found that performance improved, albeit to a lesser extent, as the stimulus duration was increased from 40 ms to 200 ms, which cannot be attributed to a change in head position. It is possible that the lower scores achieved under the open-loop conditions where the sound terminates before the head movement begins might be due to the animals having to remember from which of the 12 speakers the sound was presented. This seems unlikely, however, as performance declined with brief stimuli only in certain regions of space.
Neural circuits responsible for acoustic orientation and sound localization
Auditory localization in the horizontal plane relies principally on binaural cues, interaural differences in level and time of arrival (King et al., 2001), although spectral cues also play an important role, particularly in allowing front– back errors to be resolved (Parsons et al., 1999; Kacelnik et al., 2006). These spatial cues are initially processed in parallel brainstem pathways (Yin, 2002; Young and Davis, 2002), which converge in the inferior colliculus (IC), where individual neurons exhibit sensitivity to multiple cues (Chase and Young, 2005, 2006). From the IC, the spatial information splits in two streams, one targeting the SC via the nucleus of the brachium of the IC (King et al., 1998; Nodal et al., 2005) and other the auditory cortex via the medial geniculate body.
A role for the SC in the control of eye and head orienting movements is well established (e.g. Stein and Clamann, 1981; Lomber et al., 2001; Sparks et al., 2001; Burnett et al., 2004). These movements are guided by signals from different sensory modalities, which are represented in the SC in the form of maps of space (King, 2004). Although sound source direction is not represented topographically in the auditory cortex, lesions or reversible inactivation of the cortex does result in severe localization deficits in the contralateral hemifield in both carnivores and primates. This has been shown most clearly when, as in the present study, animals are conditioned to approach a sound source in order to obtain a reward (Kavanagh and Kelly, 1987; Malhotra et al., 2004) or to break contact with a spout when a change in sound source location is detected (Heffner and Heffner, 1990).
However, the effects of cortical lesions on reflexive head orienting responses are less clear cut. Thompson and Masterton (1978) reported that large, bilateral lesions of auditory cortex in cats did not impair acoustic orientation, unless the lesion extended ventrally to include insular and temporal cortex, in which case the probability of making an accurate orienting response was reduced. The same authors found, however, that much larger head orientation deficits were produced by lesions of the hindbrain or midbrain. Beitel and Kaas (1993) also found that in cats with bilateral cortical lesions, acoustic orienting responses were less frequent than in control animals. When they occurred, the head turns were initiated in the appropriate direction, but onset latencies were increased and larger errors were made than in the controls. Although consistent with a more general role for the auditory cortex in sound localization, Beitel and Kaas (1993) found no impairment in head orienting responses following unilateral cortical lesions. This is in contrast to the contralateral deficits that have been reported in approach-to-target behavior following ablation (Kavanagh and Kelly, 1987; Malhotra et al., 2004) or reversible inactivation (Malhotra et al., 2004; Smith et al., 2004) of the cortex on one side.
The fact that acoustic orientation almost invariably preceded the conditioned sound localization response in our ferrets implies that both behaviors rely on the same neural processing of auditory localization cues. Nevertheless, on the basis of the lesion studies, it has been concluded that different neural circuits are responsible for orientation of the head toward a sound source and the ability to associate a sound with a location in space (Thompson and Masterton, 1978; Heffner and Heffner, 1990; Beitel and Kaas, 1993). It has been further proposed that the head orienting deficits observed following bilateral cortical lesions reflect the loss of descending corticofugal projections (Thompson and Masterton, 1978; Beitel and Kaas, 1993). Indeed, an interaction between forebrain and midbrain pathways in the auditory spatial processing is suggested by the recent finding that the localization deficits exhibited by cats following inactivation of the SC are reversed if the contralateral auditory cortex is cooled (Lomber et al., 2007).
In addition to trying to dissect out the relative contributions of different neural circuits to auditory localization behavior by reversibly inactivating or ablating them, another approach, which we adopted in the present study, is to compare the pattern of errors in the head orienting and approach-to-target responses. We found that the latency and duration of the head turns as well as the response time in the approach-to-target task were longer on incorrect trials than when the animals correctly localized the sound source. Moreover, on trials in which the ferrets mislocalized noise bursts that were over before the head began to move, the final head bearing was more predictive of the location approached by the animal than that of the target. These observations indicate that the neural processing stage at which the localization errors occur is common to both head orientation and conditional spatial responses and is therefore likely to be found at a relatively early level of the auditory pathway.
Acknowledgments
We are grateful to Susan Spires, Jenny Bizley, Rob Campbell and Dan Kumpik for assistance with the data collection. This study was supported by the Wellcome Trust through a Wellcome Principal Research Fellowship to A. J. King and BBSRC grant BB/D009758/1 to J. W. Schnupp and A. J. King.
Abbreviations
- IC
inferior colliculus
- SC
superior colliculus
- SD
standard deviation
References
- Beitel RE, Kaas JH. Effects of bilateral and unilateral ablation of auditory cortex in cats on the unconditioned head orienting response to acoustic stimuli. J Neurophysiol. 1993;70:351–369. doi: 10.1152/jn.1993.70.1.351. [DOI] [PubMed] [Google Scholar]
- Boehnke SE, Phillips DP. Azimuthal tuning of human perceptual channels for sound location. J Acoust Soc Am. 1999;106:1948–1955. doi: 10.1121/1.428037. [DOI] [PubMed] [Google Scholar]
- Burnett LR, Stein BE, Chaponis D, Wallace MT. Superior colliculus lesions preferentially disrupt multisensory orientation. Neuroscience. 2004;124:535–547. doi: 10.1016/j.neuroscience.2003.12.026. [DOI] [PubMed] [Google Scholar]
- Carlile S. The auditory periphery of the ferret. II: The spectral transformations of the external ear and their implications for sound localization. J Acoust Soc Am. 1990;88:2196–2204. doi: 10.1121/1.400116. [DOI] [PubMed] [Google Scholar]
- Chase SM, Young ED. Limited segregation of different types of sound localization information among classes of units in the inferior colliculus. J Neurosci. 2005;25:7575–7585. doi: 10.1523/JNEUROSCI.0915-05.2005. [DOI] [PMC free article] [PubMed] [Google Scholar]
- Chase SM, Young ED. Spike-timing codes enhance the representation of multiple simultaneous sound-localization cues in the inferior colliculus. J Neurosci. 2006;26:3889–3898. doi: 10.1523/JNEUROSCI.4986-05.2006. [DOI] [PMC free article] [PubMed] [Google Scholar]
- Frens MA, Van Opstal AJ. A quantitative study of auditory-evoked saccadic eye movements in two dimensions. Exp Brain Res. 1995;107:103–117. doi: 10.1007/BF00228022. [DOI] [PubMed] [Google Scholar]
- Hartline PH, Vimal RL, King AJ, Kurylo DD, Northmore DPM. Effects of eye position on auditory localization and neural representation of space in superior colliculus of cats. Exp Brain Res. 1995;104:402–408. doi: 10.1007/BF00231975. [DOI] [PubMed] [Google Scholar]
- Heffner HE, Heffner RS. Effect of bilateral auditory cortex lesions on sound localization in Japanese macaques. J Neurophysiol. 1990;64:915–931. doi: 10.1152/jn.1990.64.3.915. [DOI] [PubMed] [Google Scholar]
- Heffner RS. Comparative study of sound localization and its anatomical correlates in mammals. Acta Otolaryngol Suppl. 1997;532:46–53. doi: 10.3109/00016489709126144. [DOI] [PubMed] [Google Scholar]
- Heffner RS, Heffner HE. Sound localization acuity in the cat: effect of azimuth, signal duration, and test procedure. Hear Res. 1988;36:221–232. doi: 10.1016/0378-5955(88)90064-0. [DOI] [PubMed] [Google Scholar]
- Huang AY, May BJ. Spectral cues for sound localization in cats: effects of frequency domain on minimum audible angles in the median and horizontal planes. J Acoust Soc Am. 1996;100:2341–2348. doi: 10.1121/1.417943. [DOI] [PubMed] [Google Scholar]
- Jenkins WM, Masterton RB. Sound localization: effects of unilateral lesions in central auditory system. J Neurophysiol. 1982;47:987–1016. doi: 10.1152/jn.1982.47.6.987. [DOI] [PubMed] [Google Scholar]
- Kacelnik O, Nodal FR, Parsons CH, King AJ. Training-induced plasticity of auditory localization in adult mammals. PLoS Biol. 2006;4:e71. doi: 10.1371/journal.pbio.0040071. [DOI] [PMC free article] [PubMed] [Google Scholar]
- Kavanagh GL, Kelly JB. Contribution of auditory cortex to sound localization by the ferret: (Mustela putorius) J Neurophysiol. 1987;57:1746–1766. doi: 10.1152/jn.1987.57.6.1746. [DOI] [PubMed] [Google Scholar]
- King AJ. The superior colliculus. Curr Biol. 2004;14:R335–R338. doi: 10.1016/j.cub.2004.04.018. [DOI] [PubMed] [Google Scholar]
- King AJ, Hutchings ME. Spatial response properties of acoustically responsive neurons in the superior colliculus of the ferret: a map of auditory space. J Neurophysiol. 1987;57:596–624. doi: 10.1152/jn.1987.57.2.596. [DOI] [PubMed] [Google Scholar]
- King AJ, Jiang ZD, Moore DR. Auditory brainstem projections to the ferret superior colliculus: anatomical contribution to the neural coding of sound azimuth. J Comp Neurol. 1998;390:342–365. [PubMed] [Google Scholar]
- King AJ, Schnupp JWH, Doubell TP. The shape of ears to come: dynamic coding of auditory space. Trends Cogn Sci. 2001;5:261–270. doi: 10.1016/s1364-6613(00)01660-0. [DOI] [PubMed] [Google Scholar]
- Knudsen EI. Auditory and visual maps of space in the optic tectum of the owl. J Neurosci. 1982;2:1177–1194. doi: 10.1523/JNEUROSCI.02-09-01177.1982. [DOI] [PMC free article] [PubMed] [Google Scholar]
- Knudsen EI, Blasdel GG, Konishi M. Sound localization by the barn owl (Tyto alba) measured with the search coil technique. J Comp Physiol A. 1979;133:1–11. [Google Scholar]
- Lomber SG, Malhotra S, Sprague JM. Restoration of acoustic orienting into a cortically deaf hemifield by deactivation of the contralesional superior colliculus: the acoustic Sprague effect. J Neurophysiol. 2007;97:979–993. doi: 10.1152/jn.00767.2006. [DOI] [PubMed] [Google Scholar]
- Lomber SG, Payne BR, Cornwell P. Role of the superior colliculus in analyses of space: superficial and intermediate layer contributions to visual orienting, auditory orienting, and visuospatial discriminations during unilateral and bilateral deactivations. J Comp Neurol. 2001;441:44–57. doi: 10.1002/cne.1396. [DOI] [PubMed] [Google Scholar]
- Makous JC, Middlebrooks JC. Two-dimensional sound localization by human listeners. J Acoust Soc Am. 1990;87:2188–2200. doi: 10.1121/1.399186. [DOI] [PubMed] [Google Scholar]
- Malhotra S, Hall AJ, Lomber SG. Cortical control of sound localization in the cat: unilateral cooling deactivation of 19 cerebral areas. J Neurophysiol. 2004;92:1625–1643. doi: 10.1152/jn.01205.2003. [DOI] [PubMed] [Google Scholar]
- May BJ, Huang AY. Sound orientation behavior in cats. I. Localization of broadband noise. J Acoust Soc Am. 1996;100:1059–1069. doi: 10.1121/1.416292. [DOI] [PubMed] [Google Scholar]
- Middlebrooks JC, Knudsen EI. A neural code for auditory space in the cat’s superior colliculus. J Neurosci. 1984;4:2621–2634. doi: 10.1523/JNEUROSCI.04-10-02621.1984. [DOI] [PMC free article] [PubMed] [Google Scholar]
- Mills AV. On the minimum audible angle. J Acoust Soc Am. 1958;30:237–246. [Google Scholar]
- Mrsic-Flogel TD, King AJ, Schnupp JWH. Encoding of virtual acoustic space stimuli by neurons in ferret primary auditory cortex. J Neurophysiol. 2005;93:3489–3503. doi: 10.1152/jn.00748.2004. [DOI] [PubMed] [Google Scholar]
- Nodal FR, Doubell TP, Jiang ZD, Thompson ID, King AJ. Development of the projection from the nucleus of the brachium of the inferior colliculus to the superior colliculus in the ferret. J Comp Neurol. 2005;485:202–217. doi: 10.1002/cne.20478. [DOI] [PubMed] [Google Scholar]
- Oldfield SR, Parker SP. Acuity of sound localisation: a topography of auditory space. I. normal hearing conditions. Perception. 1984;13:581–600. doi: 10.1068/p130581. [DOI] [PubMed] [Google Scholar]
- Parsons CH, Lanyon RG, Schnupp JWH, King AJ. Effects of altering spectral cues in infancy on horizontal and vertical sound localization by adult ferrets. J Neurophysiol. 1999;82:2294–2309. doi: 10.1152/jn.1999.82.5.2294. [DOI] [PubMed] [Google Scholar]
- Perrett S, Noble W. The effect of head rotations on vertical plane sound localization. J Acoust Soc Am. 1997;102:2325–2332. doi: 10.1121/1.419642. [DOI] [PubMed] [Google Scholar]
- Perrott DR, Ambarsoom H, Tucker J. Changes in head position as a measure of auditory localization performance: auditory psychomotor coordination under monaural and binaural listening conditions. J Acoust Soc Am. 1987;82:1637–1645. doi: 10.1121/1.395155. [DOI] [PubMed] [Google Scholar]
- Poganiatz I, Wagner H. Sound-localization experiments with barn owls in virtual space: influence of broadband interaural level different on head-turning behavior. J Comp Physiol. 2001;187:225–233. doi: 10.1007/s003590100193. [DOI] [PubMed] [Google Scholar]
- Populin LC. Monkey sound localization: head-restrained versus head-unrestrained orienting. J Neurosci. 2006;26:9820–9832. doi: 10.1523/JNEUROSCI.3061-06.2006. [DOI] [PMC free article] [PubMed] [Google Scholar]
- Populin LC, Yin TCT. Behavioral studies of sound localization in the cat. J Neurosci. 1998;18:2147–2160. doi: 10.1523/JNEUROSCI.18-06-02147.1998. [DOI] [PMC free article] [PubMed] [Google Scholar]
- Rauschecker JP, Kniepert U. Auditory localization behaviour in visually deprived cats. Eur J Neurosci. 1994;6:149–160. doi: 10.1111/j.1460-9568.1994.tb00256.x. [DOI] [PubMed] [Google Scholar]
- Smith AL, Parsons CH, Lanyon RG, Bizley JK, Akerman CJ, Baker GE, Dempster AC, Thompson ID, King AJ. An investigation of the role of auditory cortex in sound localization using muscimolreleasing Elvax. Eur J Neurosci. 2004;19:3059–3072. doi: 10.1111/j.0953-816X.2004.03379.x. [DOI] [PubMed] [Google Scholar]
- Sparks DL, Freedman EG, Chen LL, Gandhi NJ. Cortical and subcortical contributions to coordinated eye and head movements. Vision Res. 2001;41:3295–3305. doi: 10.1016/s0042-6989(01)00063-3. [DOI] [PubMed] [Google Scholar]
- Stecker GC, Harrington IA, Middlebrooks JC. Location coding by opponent neural populations in the auditory cortex. PLoS Biol. 2005;3:e78. doi: 10.1371/journal.pbio.0030078. [DOI] [PMC free article] [PubMed] [Google Scholar]
- Stein BE. The development of a dialogue between cortex and midbrain to integrate multisensory information. Exp Brain Res. 2005;166:305–315. doi: 10.1007/s00221-005-2372-0. [DOI] [PubMed] [Google Scholar]
- Stein BE, Clamann HP. Control of pinna movements and sensorimotor register in cat superior colliculus. Brain Behav Evol. 1981;19:180–192. doi: 10.1159/000121641. [DOI] [PubMed] [Google Scholar]
- Thompson GC, Masterton RB. Brain stem auditory pathways involved in reflexive head orientation to sound. J Neurophysiol. 1978;41:1183–1202. doi: 10.1152/jn.1978.41.5.1183. [DOI] [PubMed] [Google Scholar]
- Tollin DJ, Populin LC, Moore JM, Ruhland JL, Yin TCT. Sound-localization performance in the cat: the effect of restraining the head. J Neurophysiol. 2005;93:1223–1234. doi: 10.1152/jn.00747.2004. [DOI] [PubMed] [Google Scholar]
- Vliegen J, Van Opstal AJ. The influence of duration and level on human sound localization. J Acoust Soc Am. 2004;115:1705–1713. doi: 10.1121/1.1687423. [DOI] [PubMed] [Google Scholar]
- Whittington DA, Hepp-Reymond MC, Flood W. Eye and head movements to auditory targets. Exp Brain Res. 1981;41:358–363. doi: 10.1007/BF00238893. [DOI] [PubMed] [Google Scholar]
- Wightman FL, Kistler DJ. Resolution of front-back ambiguity in spatial hearing by listener and source movement. J Acoust Soc Am. 1999;105:2841–2853. doi: 10.1121/1.426899. [DOI] [PubMed] [Google Scholar]
- Yin TCT. Neural mechanisms of encoding binaural localization cues in the auditory brainstem. In: Oertel D, Fay RR, Popper AN, editors. Integrative functions in the mammalian auditory pathway. New York: Springer; 2002. pp. 99–159. [Google Scholar]
- Young ED, Davis KA. Circuitry and function of the dorsal cochlear nucleus. In: Oertel D, Fay RR, Popper AN, editors. Integrative functions in the mammalian auditory pathway. New York: Springer; 2002. pp. 160–206. [Google Scholar]


