Summary
Current understanding of cell specification in early mammalian preimplantation development is mainly based on mouse studies. The first lineage differentiation event occurs at the morula stage with outer cells initiating a trophectoderm (TE) placental progenitor program. At subsequent developmental stages, the inner cell mass (ICM) arises from inner cells and is comprised of precursor cells of the embryo proper and yolk sac1. Recent gene expression analyses suggest that the mechanisms regulating early lineage specification in the mouse may differ in other mammals, including human2–5 and cow6. Here we show evolutionary conservation of a molecular cascade initiating TE segregation in human, cow and mouse embryos. Specifically, at the morula stage outer cells acquire an apico-basal cell polarity, with expression of atypical protein kinase C (aPKC) at the contact-free domain, nuclear expression of Hippo signaling pathway effectors, and restricted expression of TE-associated factors, such as GATA3, suggesting initiation of a TE program. Furthermore, we demonstrate that inhibition of aPKC, by small-molecule pharmacological modulation and TRIM-Away protein depletion, impairs TE initiation at the morula stage. Altogether, our comparative embryology analysis provides novel insights into early lineage specification and suggests a similar mechanism initiating a TE program in human, cow and mouse embryos.
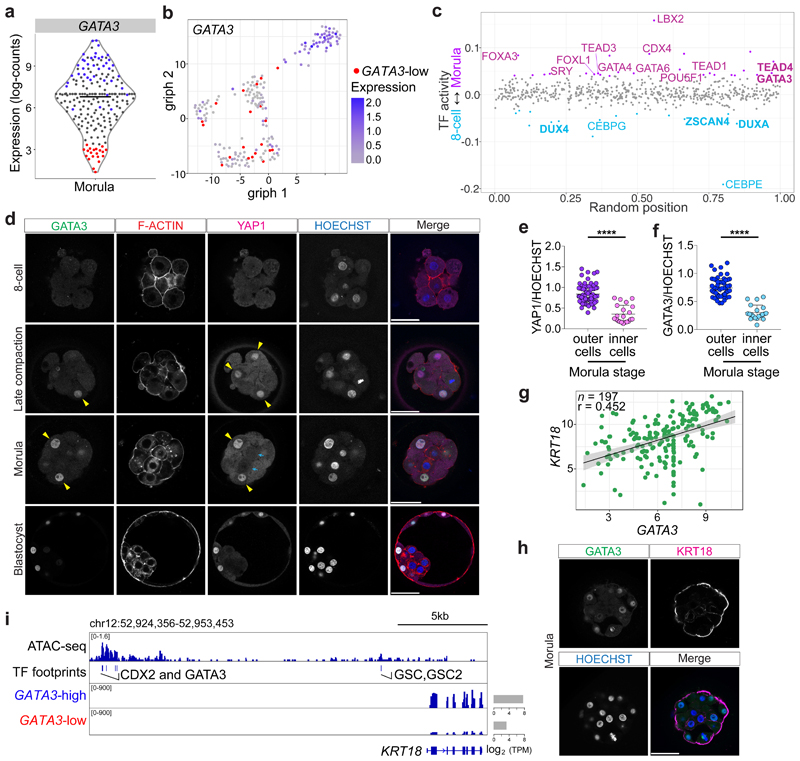
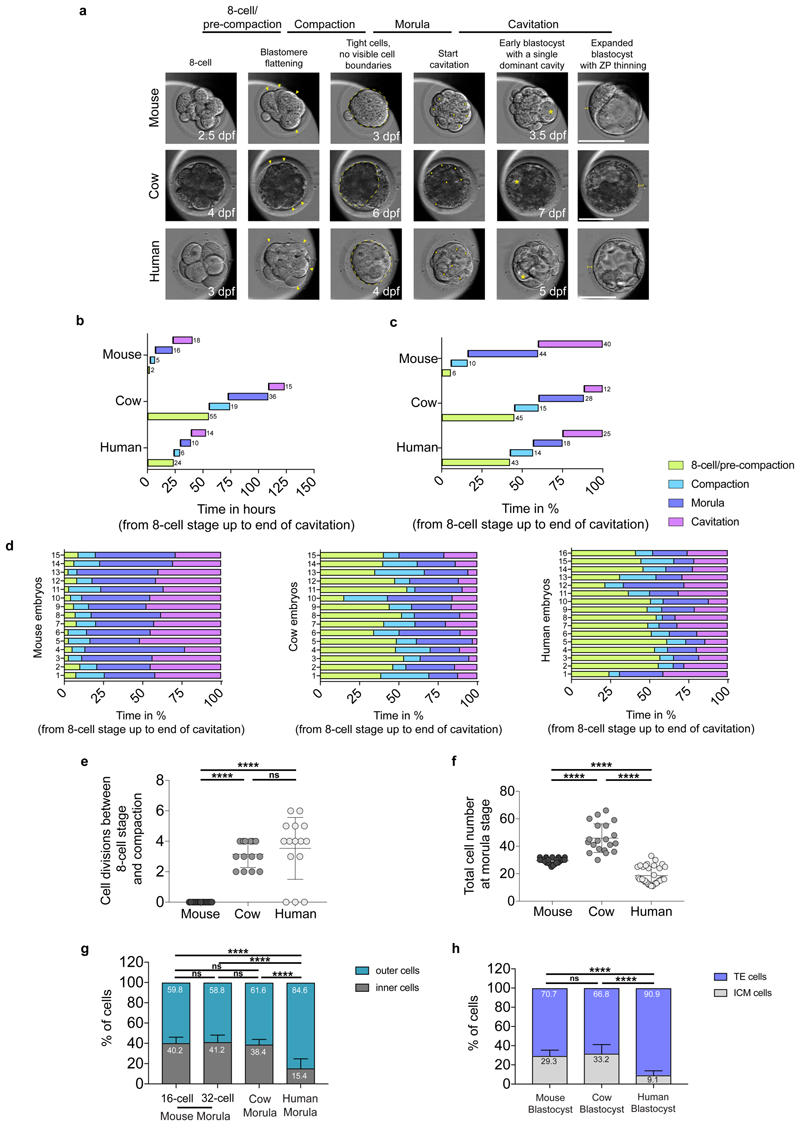
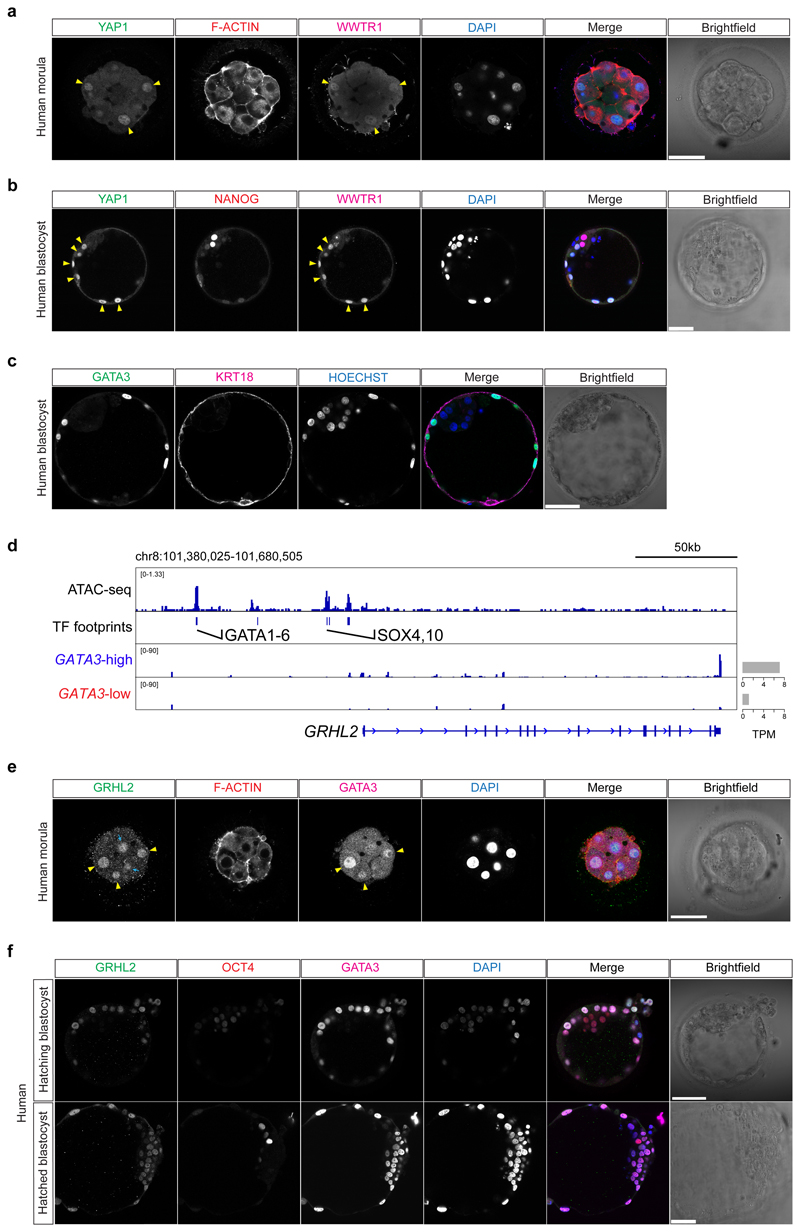
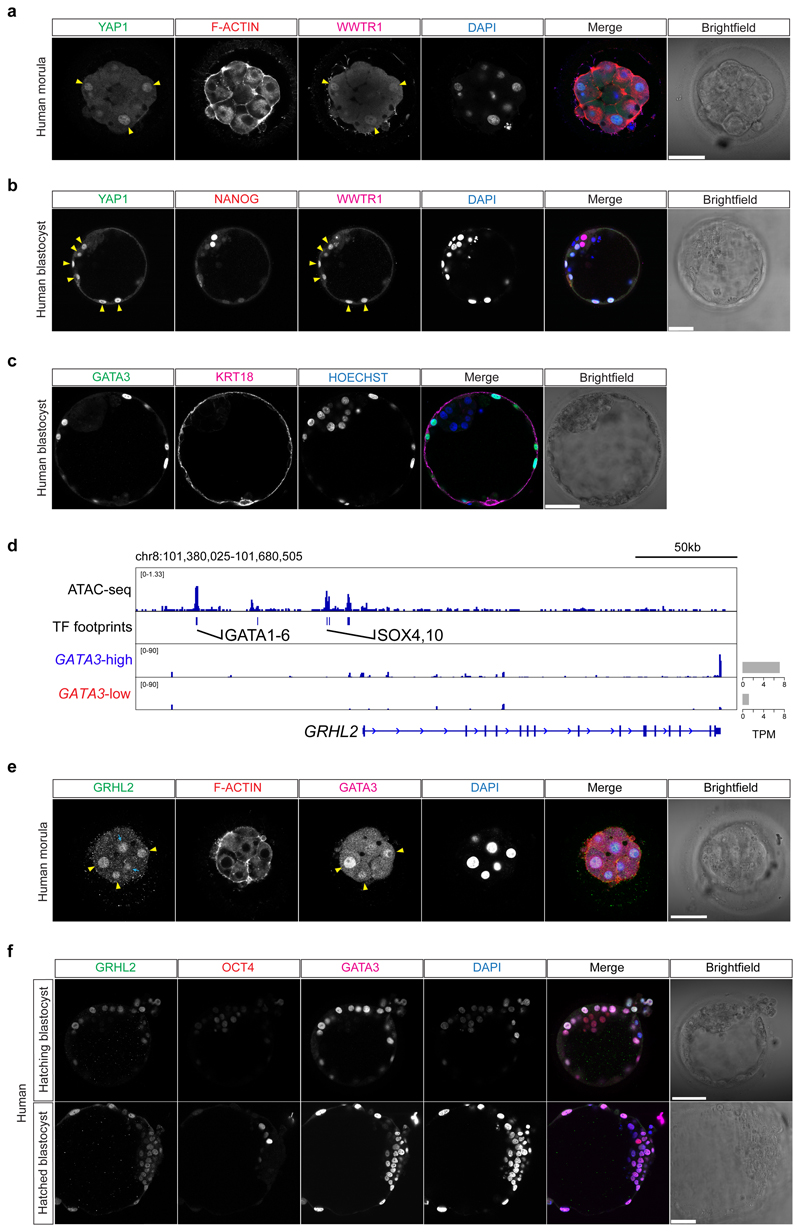
The length of preimplantation development varies between human, cow and mouse embryos. We therefore initially performed a morphokinetic analysis to benchmark the initiation and duration of key morphological events (Supplementary Videos 1-3, Extended Data Fig. 1 and Supplementary Table 1). We next sought to determine whether TE-associated genes may be expressed prior to blastocyst formation, which would suggest initiation of a differentiation program. We mined published human preimplantation scRNA-seq datasets4,5,7 and observed heterogeneous expression of GATA3 in human morula cells (Fig. 1a, b). Reanalysis of a human preimplantation chromatin accessibility dataset8 revealed enrichment of GATA and TEAD motifs in open chromatin regions at the morula stage, whereas at the 8-cell stage we observed motif enrichment of genes involved in embryonic genome activation, such as DUXA/DUX49 and ZSCAN410 (Fig. 1c). In the mouse, the transcription factor GATA3 functions to promote TE differentiation in outer cells at the morula stage, downstream of Hippo signaling transcription factor TEA-domain family member 4 (TEAD4)11. By immunofluorescence analysis, we confirmed that TEAD4 is detected in all nuclei of human morula stage embryos (Extended Data Fig. 2a-d), similar to the mouse12. We also observed co-localisation of GATA3 and the TEAD4 co-factor Yes-associated protein 1 (YAP1) in outer cells at the morula stage in human, cow and mouse embryos (Fig. 1d-f and Extended Data Fig. 2e-k), consistent with previous findings in the mouse11,13,14. Similar to the mouse13, we observed overlapping nuclear expression of YAP1 and its transcriptional co-factor WW domain-containing transcription regulator protein 1 (WWTR1) in outer and TE cells in human morula and blastocyst stages, respectively (Extended Data Fig. 3a, b). GATA2 is considered a TE marker in human blastocysts3–5,15. Importantly, at the morula stage GATA2 was not detected (Extended Data Fig. 2l), despite its restriction to TE cells at the blastocyst stage (Extended Data Fig. 2m). Altogether, this suggests that GATA3 and Hippo signaling components are conserved in distinguishing cells initiating a TE program in human, cow and mouse morula stage embryos.
Fig. 1. Transcriptional and protein expression differences between cells at the morula stage in human embryos.
a, Violin plot showing log-transformed size-factor-normalized expression of GATA3 in human morula cells. n = 197 cells. Black line corresponds to the median. Red highlights cells with lowest GATA3 expression and in blue are cells with high GATA3 expression. b, Graph interference of population heterogeneity dimensionality reduction analysis of human morula cells. Single cells colored with the log-transformed size-factor-normalized expression of GATA3. c, ATAC-seq chromatin accessibility in human embryos at the morula stage compared to the 8-cell stage. Examples of transcription factors with a significant change in activity score (p < 0.05) are highlighted in purple in the morula and in cyan in the 8-cell stage. d, Time-course immunofluorescence analysis of GATA3 (green), F-ACTIN (red), YAP1 (magenta) and HOECHST-33342 nuclear staining (blue) in human embryos at pre-compaction (n = 5), late compaction (n = 5), morula (n = 10), expanded blastocyst (n = 4) stages. e, f, Quantification of YAP1 (e) and GATA3 (f) fluorescence intensity, normalized to HOECHST-33342 intensity, in either inner or outer cells in human morula embryos (n = 95 cells for YAP1 and n = 79 for GATA3 from 10 embryos). t-test for YAP1 distribution, ****p < 0.0001; Mann-Whitney U test for GATA3 distribution, ****p < 0.0001. Yellow arrowheads point to outer cells expressing YAP1 and GATA3, cyan arrows mark inner cells lacking detectable YAP1 and GATA3 expression. g, Scatter plots showing positive correlation of GATA3 and KRT18 expression profile in human morula cells. n = 197 cells. r = Pearson correlation coefficient. Values displayed as log-transformed size-factor-normalized counts. The black line corresponds to a linear regression model fitted to the data with 95% confidence bands. h, Immunofluorescence analysis of GATA3 (green), KRT18 (magenta) and DAPI nuclear staining (blue) in human morula stage embryos (n = 3). i, Genome browser view of the ATAC-seq signal at the KRT18 locus. High confidence peaks (FDR < 0.001) were used to identify transcription factor motifs. Representative binding motifs associated with the footprints are highlighted. The average expression of KRT18 in high GATA3-high and GATA3-low expressing cells at the morula is shown and the TPM units indicated. Scale bars, as displayed in figures.
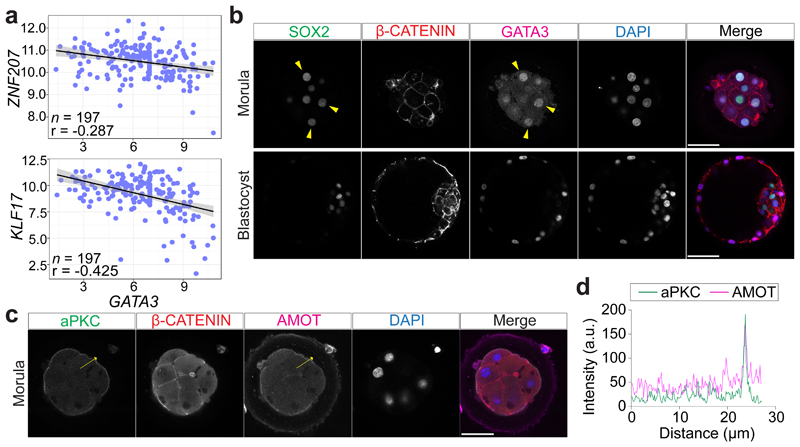
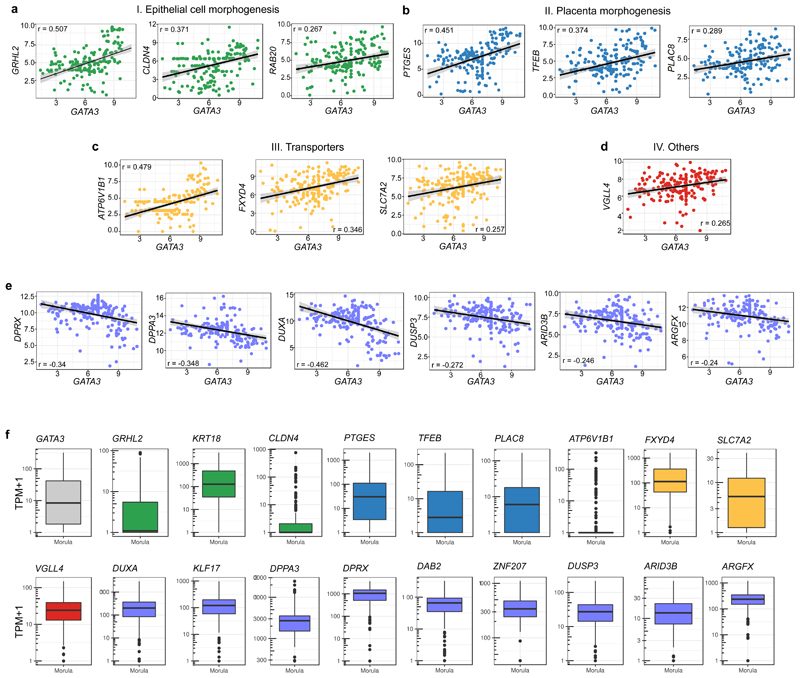
We next sought to identify genes that were co-expressed with GATA3 in human morula cells using the aforementioned scRNA-seq datasets4,5,7. We identified 22 TE-enriched genes that showed a positive correlation (Pearson’s r > 0.25) with GATA3 when comparing all human morula cells (Supplementary Table 2). Genes related to epithelial cell formation (KRT18, CLDN4, RAB20, RAB25), and placenta morphogenesis (PTGES, TFEB, PLAC8) and genes encoding transporter subunits (ATP6V1B1, ATP6V1C2, FXYD4, ATP6V0A4, SLC7A2) positively correlate with GATA3 (Fig. 1g, Extended Data Fig. 4a-c, f and Supplementary Table 3). Interestingly, we observed that Vestigial-like protein 4 (VGLL4), a transcriptional co-factor and regulator of TEAD transcriptional activity16,17, also showed positive correlation with GATA3 (Extended Data Fig. 4d, f and Supplementary Table 3). Immunofluorescence analysis confirmed specific expression of KRT18 in outer and TE cells in human morula and blastocyst stage embryos, respectively (Fig. 1h and Extended Data Fig. 3c), as previously described18. Furthermore, we identified enrichment of GATA3 binding motifs at the KRT18 locus in open chromatin regions (Fig. 1i), suggesting that KRT18 may be a target gene of GATA3 in human embryos. In the positively correlated gene list, we also detected Grainyhead-like transcription factor 2 (GRHL2) (Extended Data Fig. 4a, f and Supplementary Table 3), a gene important for epithelial morphogenesis and trophoblast branching in mouse embryos19. We also observed enrichment of GATA3 binding motifs upstream the GRHL2 locus (Extended Data Fig. 3d). By immunofluorescence analysis, we observed that GRHL2 was expressed in both outer and inner cells at the morula stage (Extended Data Fig. 3e), then specifically restricted to the TE in blastocysts (Extended Data Fig. 3f). Next, we analyzed scRNA-seq datasets to identify genes that exhibited an anti-correlated expression pattern to GATA3 in human morula cells and that could be putative inner cell-associated markers. Interestingly, genes involved in embryonic stem cell pluripotency and/or genes enriched in the blastocyst EPI/ICM, such as ZNF20720 and KLF17 4,21 were transcriptionally negatively correlated with GATA3 (Fig. 2a, Extended Data Fig. 4e, f and Supplementary Tables 4, 5). Altogether, our analysis suggests transcriptional differences between inner and outer cells in human morula stage embryos, with outer cells initiating a TE program.
Fig. 2. Apical expression of aPKC and AMOT in outer cells in human morula stage embryos, where SOX2 expression is retained.
a, Scatter plots showing negative correlation of GATA3 expression profile with DUXA and KLF17 expression profiles in human morula cells. n = cells considered. r = Pearson correlation coefficient. Values are displayed as log-transformed size-factor-normalized counts. The black line corresponds to a linear regression model fitted to the data with 95% confidence bands. Scale bars, as displayed in figures. b, Immunofluorescence analysis of SOX2 (green), β-CATENIN (red), GATA3 (magenta) and DAPI nuclear staining (blue) in human embryos at the morula (n = 6) or expanded blastocyst (n = 5) stages. Yellow arrowheads point to outer cells expressing SOX2 and GATA3. c, Immunofluorescence analysis of aPKC (green), β-CATENIN (red), AMOT (magenta) and DAPI nuclear staining (blue) in human morula stage embryos (n = 10). d, Fluorescence intensity profile of aPKC and AMOT shown along the yellow arrows in human morula stage embryos. Scale bars, as displayed in figures.
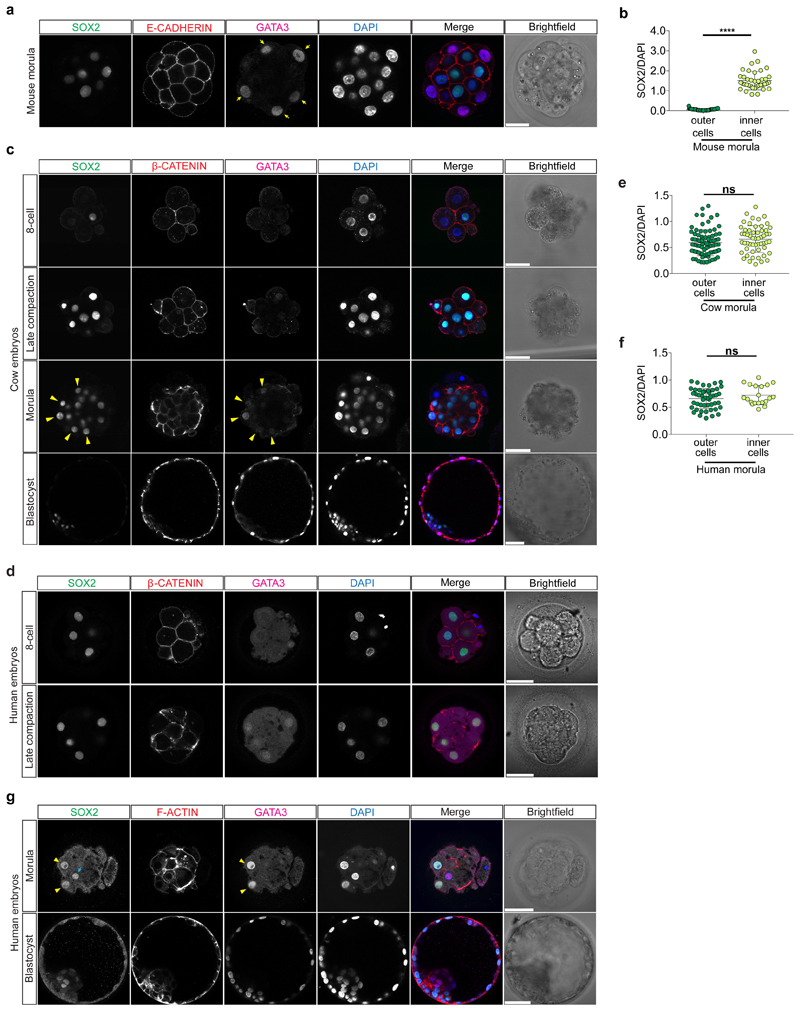
In the mouse morula, the transcription factor SOX2 is specifically restricted to inner cells by Hippo pathway members and considered the first marker of ICM pluripotency22 (Extended Data Fig. 5a, b). At the 8-cell stage, SOX2 was detected in a few blastomeres in cow embryos, while in human embryos SOX2 was expressed in all nuclei (Extended Data Fig. 5c, d). Expression of SOX2 in all nuclei continues in both human and cow embryos up to the formation of an early blastocyst, which is in contrast to earlier restriction in the mouse (Fig. 2b and Extended Data Fig. 5c, e-g). SOX2 was eventually restricted to ICM cells in expanded blastocysts (Fig. 2b and Extended Data Fig. 5c, g), thus confirming previously published data in human embryos18. Altogether, these data indicate that SOX2, the specific inner cell marker in the mouse, displays a different expression pattern in human and cow embryos, suggesting differences in the regulation of the ICM between these species.
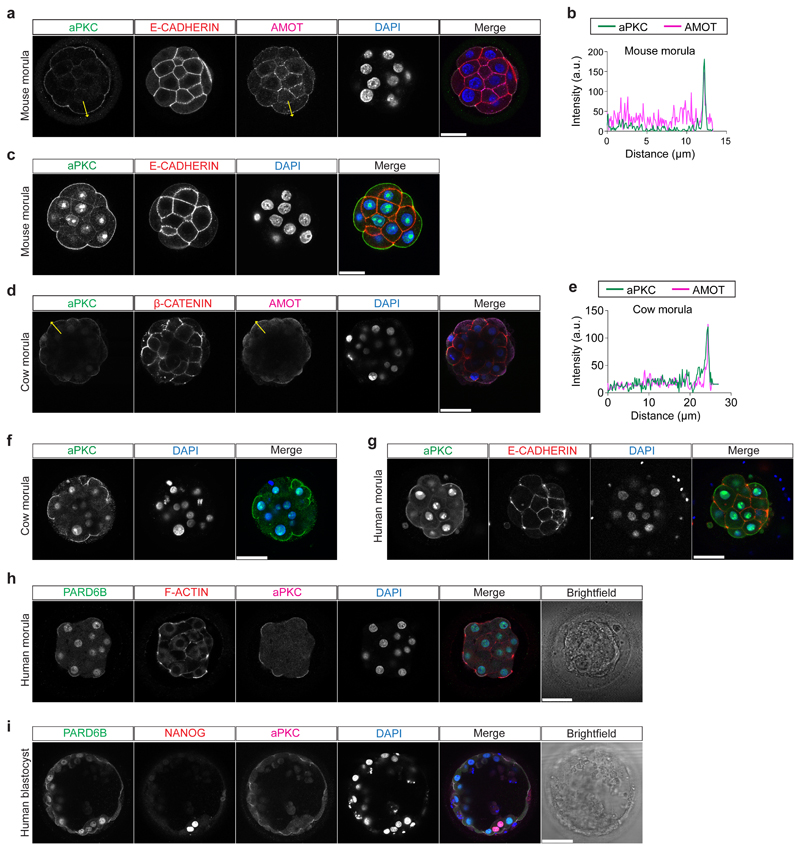
Given the restricted localization of YAP1 and GATA3 at the morula stage in these three species, we next sought to investigate upstream regulators of this pathway. We analyzed the expression pattern of aPKC and Angiomotin (AMOT), a modulator of the Hippo pathway, which influence YAP1 cellular localization in mouse outer cells23. We confirmed that in the mouse morula, aPKC and AMOT were expressed at the apical membrane of outer cells, while in inner cells AMOT and E-CADHERIN were enriched at the cell-cell contact sites (Extended Data Fig. 6a-c). We detected a similar expression pattern in human and cow morula stage embryos with aPKC and AMOT co-localized at the apical domain of outer cells and β-CATENIN at the basolateral domain (Fig. 2c, d and Extended Data Fig. 6d-g). Moreover, we observed co-localization of aPKC and its partner, PARD6B, at the apical domain of cells in both human morula and blastocyst stage embryos (Extended Data Fig. 6h, i). These data reveal differential cell polarization between outer and inner cells in human and cow embryos, with apical and basolateral proteins showing a similar expression pattern to that of the mouse24,25.
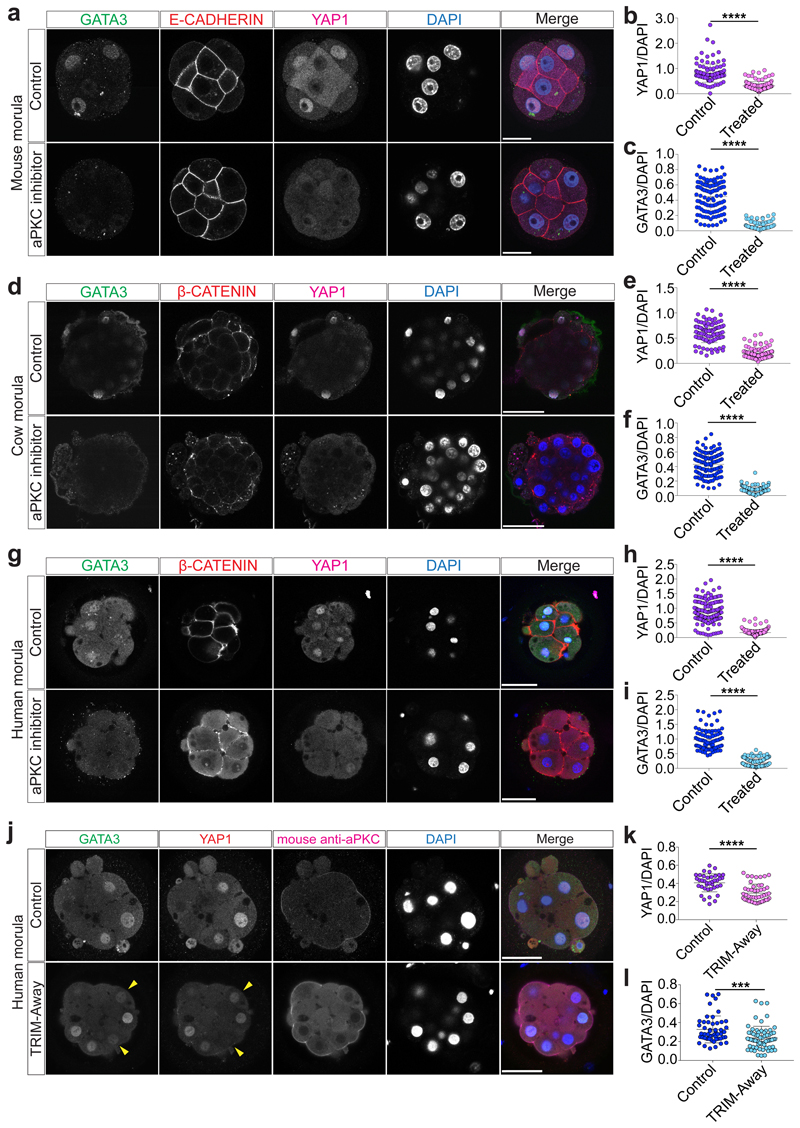
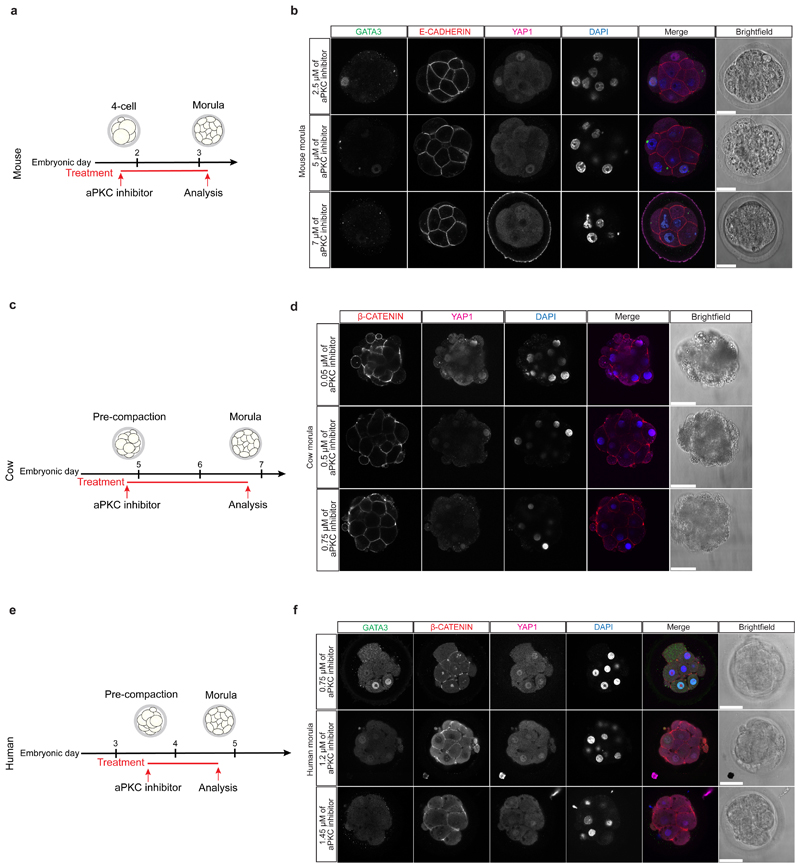
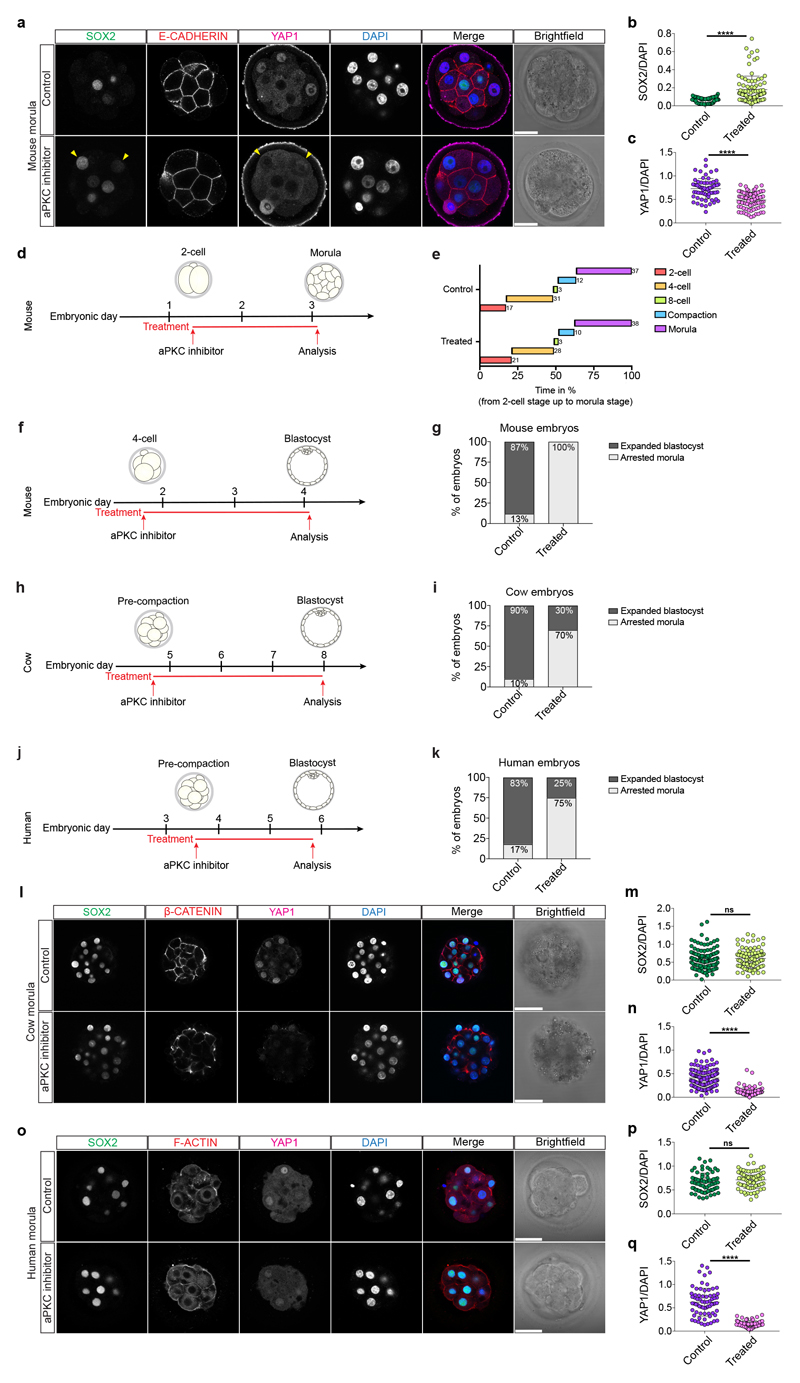
Our data suggest a functional link between cell polarity and TE lineage initiation at the morula stage in human and cow embryos. In order to test this hypothesis, we used a potent aPKC inhibitor, CRT0276121, a derivative of CRT0103390, which has previously been shown to specifically inhibit aPKC in various biological and cellular contexts26–28. Initially, we performed a dose-response experiment in mouse embryos to determine the effective concentration of the aPKC inhibitor (Extended Data Fig. 7a, b and Supplementary Table 6). Following aPKC inhibition, we observed that YAP1 was restricted to the cytoplasm in mouse outer cells (Fig. 3a, b), consistent with previous descriptions in aPKC knockdown and knockout studies23,29,30. We also observed that inhibition of aPKC led to reduced GATA3 expression at the morula stage (Fig. 3a, c), indicating that aPKC is required to initiate TE-associated gene expression in outer cells. Moreover, SOX2 was ectopically expressed in outer cells at the morula stage following aPKC inhibition in the mouse (Extended Data Fig. 8a-c). These data phenocopy the Yap1-/-;Wwtr1-/- phenotype and the effects of ROCK inhibition in mouse embryos31, thus indicating specificity of the aPKC inhibitor. By morphokinetic analysis, we could not detect differences in cleavage rate between control and treated embryos (Extended Data Fig. 8d, e). While DMSO-treated control mouse embryos developed to the blastocyst stage, aPKC inhibitor-treated embryos failed to cavitate and underwent developmental arrest at the morula stage (Extended Data Fig. 8f, g), phenocopying aPKC null mutant embryos23,30.
Fig. 3. aPKC activity is required for YAP1 and GATA3 expression in mouse, cow and human morula stage embryos.
a, Immunofluorescence analysis of GATA3 (green), E-CADHERIN (red), YAP1 (magenta) and DAPI nuclear staining (blue) in control and aPKC inhibitor-treated mouse morula stage embryos. b, c, Quantification of YAP1 (b) and GATA3 (c) fluorescence intensity, normalized to DAPI intensity, in outer cells in control and aPKC-inhibitor treated mouse morula stage embryos (n = 243 cells for YAP1 from 28 embryos, and n = 191 for GATA3 from 26 embryos). t-test, ****p < 0.0001. d, Immunofluorescence analysis of GATA3 (green), β-CATENIN (red), YAP1 (magenta) and DAPI nuclear staining (blue) in control and aPKC inhibitor-treated cow morula stage embryos. e, f, Quantification of YAP1 (e) and GATA3 (f) fluorescence intensity, normalized to DAPI intensity, in outer cells in control and aPKC-inhibitor treated cow morula stage embryos (n = 209 cells for YAP1 from 19 embryos, and n = 218 cells for GATA3 from 21 embryos). Mann-Whitney U test, ****p < 0.0001. g, Immunofluorescence analysis of GATA3 (green), β-CATENIN (red), YAP1 (magenta) and DAPI nuclear staining (blue) in control and aPKC inhibitor-treated human morula stage embryos. h, i, Quantification of YAP1 (h) and GATA3 (i) fluorescence intensity, normalized to DAPI intensity, in outer cells in control and aPKC-inhibitor treated human morula stage embryos (n = 406 cells for YAP1 from 37 embryos, and n = 218 cells for GATA3 from 21 embryos). Mann-Whitney U test, ****p < 0.0001. j, Immunofluorescence analysis of GATA3 (green), YAP1 (red), anti-mouse secondary antibody to detect the electroporated aPKC antibody (magenta) and DAPI nuclear staining (blue) at the morula stage in embryos electroporated either with mCherry-TRIM21 mRNA only or with mCherry-TRIM21 mRNA and mouse anti-aPKC antibody. k, l, Quantification of YAP1 (k) and GATA3 (l) fluorescence intensity, normalized to DAPI intensity, in outer cells at the morula stage in embryos electroporated either with mCherry-TRIM21 mRNA only or with mCherry-TRIM21 mRNA and mouse anti-aPKC antibody (n = 281 cells for YAP1 from 32 embryos and n = 263 cells for GATA3 from 31 embryos). t-test, **p < 0.01, ****p < 0.0001. m, Immunofluorescence analysis of GATA3 (green), YAP1 (red), anti-mouse secondary antibody to detect the electroporated aPKC antibody (magenta) and DAPI nuclear staining (blue) at the morula stage in human control embryos and embryos electroporated with mCherry-TRIM21 mRNA and mouse anti-aPKC antibody. Yellow arrowheads point to decrease YAP1 and GATA3 expression in the TRIM-Away experiment. 2 independent experiments. n, o, Quantification of YAP1 (n) and GATA3 (o) fluorescence intensity, normalized to DAPI intensity, in outer cells at the morula stage in human control embryos and embryos electroporated with mCherry-TRIM21 mRNA and mouse anti-aPKC antibody (n = 88 cells from 8 embryos for YAP1 and n = 116 cells from 11 embryos for GATA3). Mann-Whitney U test, ****p < 0.0001. Scale bars as displayed in figures.
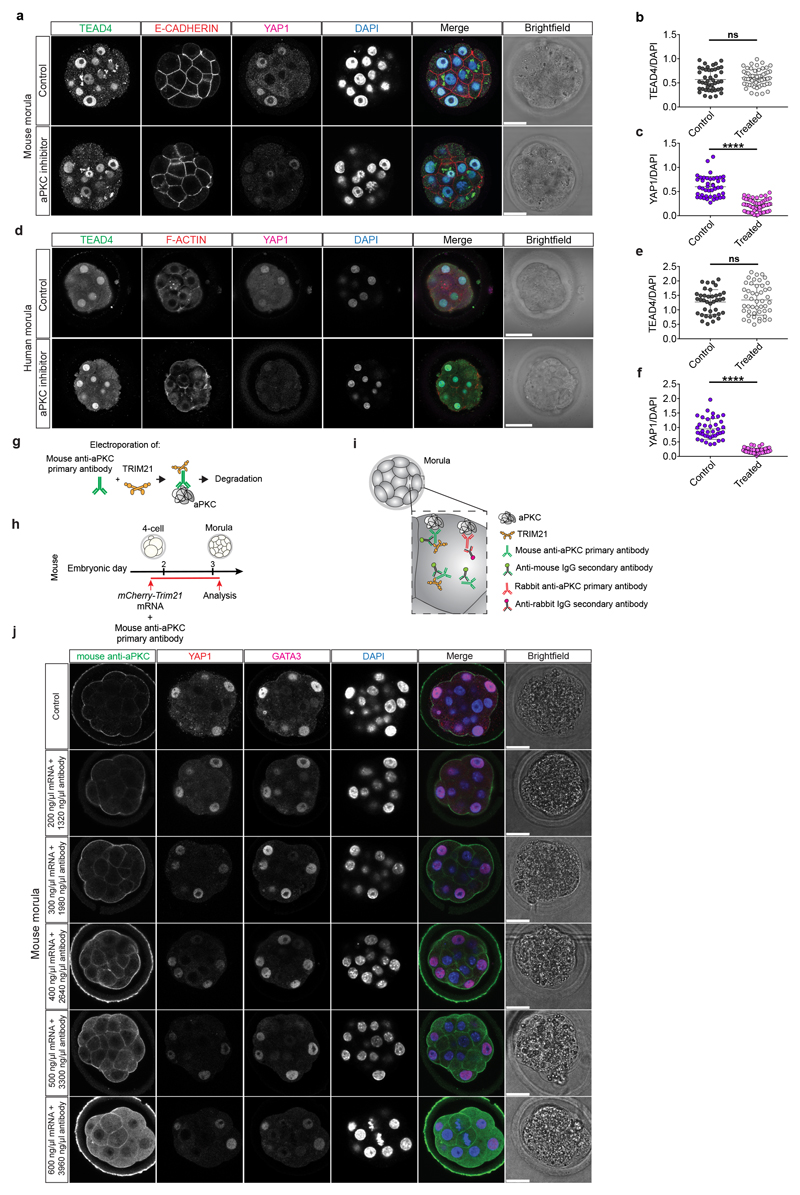
We next analyzed the effects of aPKC inhibition on cow and human embryos by treating from pre-compaction until the morula stage, following dose-response experiments (Extended Data Fig. 7c-f and Supplementary Tables 7, 8). Inhibition of aPKC in cow embryos resulted in reduction of nuclear YAP1 and GATA3 expression in outer cells at the morula stage (Fig. 3d-f). Similarly, human embryos at the morula stage exhibited reduced expression of YAP1 and GATA3 in outer cells following aPKC inhibition (Fig. 3g-i). Moreover, when both cow and human embryos were allowed to develop to the blastocyst stage, the DMSO-treated embryos were able to form expanded blastocysts, while a significant number of aPKC-inhibitor treated embryos arrested at cavitation (Extended Data Fig. 8h-k). Interestingly, aPKC inhibition had no discernible effect on SOX2 expression (Extended Fig. 8l-q), which was in striking contrast to the mouse. As expected, TEAD4 expression was unchanged in both mouse and human aPKC-inhibitor treated embryos (Extended Data Fig. 9a-f), thus further corroborating the specificity of the aPKC inhibitor.
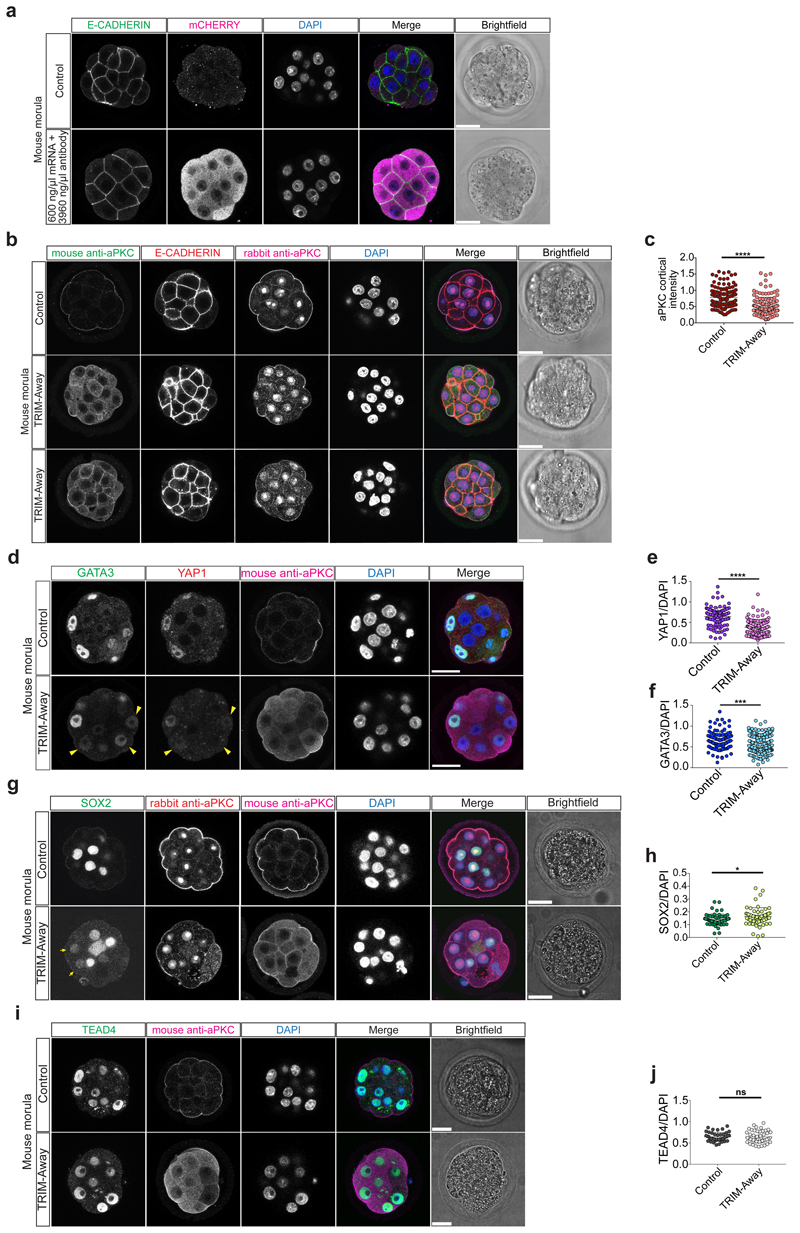
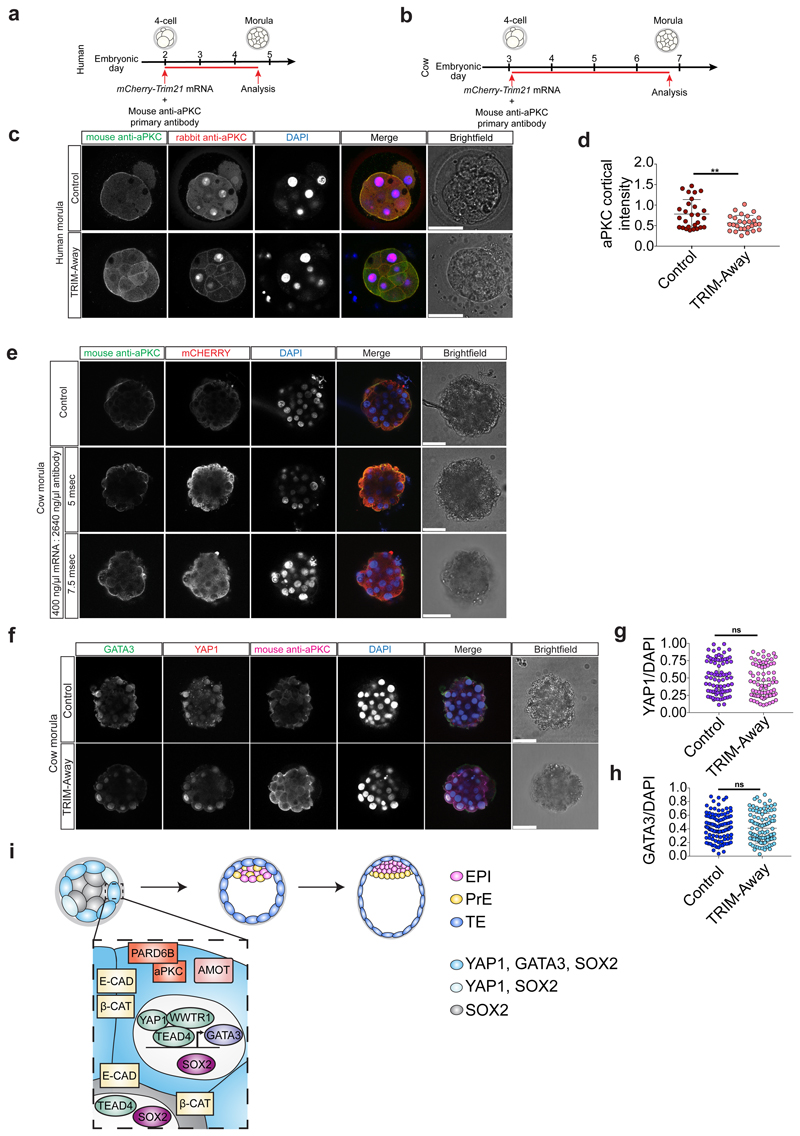
We sought to further test our hypothesis by applying a TRIM-Away protein depletion method. TRIM-Away has been recently reported to induce rapid and efficient degradation of proteins of interest in mouse oocytes32 and leads to sustained downregulation of a target protein of interest across three days of development in mouse embryos33,34. Firstly, we optimized electroporation of mCherry-TRIM21 mRNA with an antibody against aPKC in mouse embryos at the 4-cell stage (Extended Data Figs. 9g-j, 10a and Supplementary Table 9). We confirmed that expression of endogenous aPKC was reduced following mCherry-TRIM21 mRNA and aPKC antibody electroporation compared to the control mouse embryos where only mCherry-TRIM21 mRNA was provided (Extended Data Fig. 10b, c). Similar to the effect observed with the aPKC inhibitor, we detected a reduction of YAP1 and GATA3 protein expression in embryos electroporated with mCherry-TRIM21 mRNA and aPKC antibody (Fig. 3j-l). We also observed ectopic induction of SOX2 in the outer cell of mouse morula stage embryos (Extended Data Fig. 10d, e). Moreover, TEAD4 and E-CADHERIN expression were unaffected in aPKC TRIM-Away mouse embryos (Extended Data Figure 10b, f, g), consistent with inhibitor treatment (Extended Data Fig. 9a, b) and knockdown of Pard6b 35, respectively. Altogether, this suggests that, while the effect of aPKC TRIM-Away was not as pronounced as the inhibitor, the results were consistent and there was no obvious toxicity. Electroporation of 4-cell stage human embryos led to a similar reduction of aPKC, YAP1 and GATA3 protein expression at the morula stage compared to control embryos (Fig. 3m-o and Extended Data Fig. 11a-c), confirming the effect seen with the aPKC inhibitor. Despite attempts to optimize electroporation in cow embryos, we were unable to identify a concentration of TRIM-Away components that affected YAP1 and GATA3 protein expression without affecting embryo viability (Extended Data Fig. 11d-h and Supplementary Table 10), suggesting that further refinement of the method is needed in this species.
Altogether, we propose that cell polarity, through aPKC activity, initiates a TE program at the morula stage in the outer cells of human and cow embryos (Extended Data Fig. 11i), similar to the mouse23,29,30. Our data suggest that aPKC sequesters AMOT at the apical domain, thus keeping the Hippo signaling pathway in an inactive state. YAP1 subsequently translocates to the nucleus, where together with TEAD4, it promotes the transcriptional activation of a TE program, in order to support cavitation and formation of a blastocyst (Extended Data Fig. 11i). Additional molecular characterization and functional analyses are needed in human and cow embryos to elucidate how differences in cell polarity leads to differential Hippo signaling in outer and inner cells to drive a placental progenitor program, and whether it involves mechanisms that are conserved or divergent compared to the mouse. While our data reveal a molecular cascade that leads to the initiation of a TE program, cells are unlikely to be committed at this stage, which is supported by studies suggesting that cell fate determination occurs later5,36.
Methods
Ethics statement
For experiments performed in the UK
This study was approved by the UK Human Fertilisation and Embryology Authority (HFEA): research licence number 0162, and the Health Research Authority’s Research Ethics Committee (Cambridge Central reference number 19/EE/0297).
The process of licence approval entailed independent peer review along with consideration by the HFEA Licence and Executive Committees. Our research is compliant with the HFEA Code of Practice and has undergone inspections by the HFEA since the licence was granted. Research donors were recruited from patients at Bourn Hall clinic, Homerton University Hospital, The Bridge Centre and IVF Hammersmith.
Informed consent was obtained from all couples that donated spare embryos following IVF treatment. Before giving consent, people donating embryos were provided with all of the necessary information about the research project, an opportunity to receive counselling and the conditions that apply within the licence and the HFEA Code of Practice. Donors were informed that after embryos used in the experiments would be stopped before 14 days post-fertilization and that subsequent biochemical and genetic studies would be performed. Informed consent was also obtained from donors for all the results of these studies to be published in scientific journals. No financial inducements were offered for donation. Consent was not obtained to perform genetic tests on patients and no such tests were performed. The patient information sheets and consent document provided to patients are publicly available (https://www.crick.ac.uk/research/a-z-researchers/researchers-k-o/kathy-niakan/hfea-licence/). Embryos surplus to the patient’s IVF treatment were donated cryopreserved and were transferred to the Francis Crick Institute where they were thawed and used in the research project.
For experiments performed in France
The use of human embryo donated to research as surplus of IVF treatment was allowed by the French embryo research oversight committee: Agence de la Biomédecine, under approval number RE13-010. All human preimplantation embryos used in this study were obtained from and cultured at the Assisted Reproductive Technology unit of the University Hospital of Nantes, France, which are authorized to collect embryos for research under approval number AG110126AMP of the Agence de la Biomédecine. Embryos used were initially created in the context of an assisted reproductive cycle with a clear reproductive aim and then voluntarily donated for research once the patients have fulfilled their reproductive needs or tested positive for the presence of monogenic diseases. Informed written consent was obtained from both parents of all couples that donated spare embryos following IVF treatment. Before giving consent, people donating embryos were provided with all of the necessary information about the research project and opportunity to receive counseling. No financial inducements are offered for donation. Molecular analysis of the embryos was performed in compliance with the embryo research oversight committee and The International Society for Stem Cell Research (ISSCR) guidelines37.
For experiments performed in Belgium
The use of human embryos donated to research was allowed by the Local Ethical Committee of UZ Brussel (BUN 143201526417) and the Belgian Federal Committee for research on human embryos (AdV057). The embryos were surplus after IVF treatment in the Centre for Reproductive Medicine at UZ Brussel. The embryos were cryopreserved at the 8-cell stage and donated to research following informed consent following the legally determined period of five years of cryopreservation.
Human embryo thaw
For embryos thawed in the UK, slow frozen human cleavage stage embryos were thawed using Quinn’s Advantage thaw kit (Origio; ART-8016). Briefly, with Quinn’s Advantage thaw kit, after thawing the embryos were transferred to 0.5% sucrose thawing medium and incubated for 5 min at 37 °C, followed by 0.2% sucrose thawing medium for 10 min at 37 °C. The embryos were then washed through seven drops of diluent solution before culture. For vitrified cleavage stage embryos and blastocyst stage embryos were thawed using vitrification thaw kit (Irvine Scientific; 90137-SO). With vitrification, embryos were thawed in TS thawing solution for 1 minute and transferred to DS thawing solution for 4 min at RT. Then, embryos were washed twice in washing solution for 4 min at RT before culture. Slow frozen human blastocysts were thawed using a Blast thaw kit (Origio; 10542010A). Briefly, upon thawing blastocysts were incubate in vial 1 thawing medium for 10 min at RT in the dark. Then, embryos were moved to vial 2 thawing medium for 10 min at RT in the dark before culture.
For embryos donated in France, the embryos were thawed as previously described38.
For embryos donated in Belgium, the embryos were thawed as previously described39.
Mouse zygote collection
Four- to eight-week-old (C57BL6 × CBA) F1 female mice were super-ovulated using injection of 5 IU of pregnant mare serum gonadotrophin (PMSG; Sigma-Aldrich). Forty-eight hours after PMSG injection, 5 IU of human chorionic gonadotrophin (HCG; Sigma-Aldrich) was administered. Superovulated females were set up for mating with eight-week-old or older (C57BL6 × CBA) F1 males. Mice were maintained on a 12 h light–dark cycle. Mouse zygotes were isolated in FHM under mineral oil (Origio; ART-4008-5P) and cumulus cells were removed with hyaluronidase (Sigma-Aldrich; H4272). All animal research was performed in compliance with the UK Home Office Licence Number 70/8560.
Human and mouse embryo culture
Mouse embryos or human embryos were cultured in drops of pre-equilibrated Global medium (LifeGlobal; LGGG-20) supplemented with 5 mg/ml protein supplement (LifeGlobal; LGPS-605) and overlaid with mineral oil (Origio; ART-4008-5P). Preimplantation embryos were incubated at 37 °C and 5.5% CO2 in an EmbryoScope+ time-lapse incubator (Vitrolife) and cultured up to the day of analysis.
Human embryos donated in France were cultured as previously described38.
Human embryos donated in Belgium were cultured as previously described39.
Cow embryo generation and culture
In-vitro matured oocytes were fertilized as previously described40, with some modifications. Briefly, motile spermatozoa were prepared after 30 min swim-up in calcium free medium, followed by centrifugation (300 g) at RT and resuspension of the pellet in fertilization medium (1 × 10⁶ spermatozoa per ml). Cumulus–oocyte complexes (COC) were gently pipetted in order to remove adhering granulosa cells and break up aggregated COC. Disaggregated COC were then washed once in oocyte wash medium and transferred into 45 µl microdrops of spermatozoa and cultured for 24 h at 38.5°C in a humidified incubator in an atmosphere of 5% CO2 and atmospheric O2. After 24 h, all presumptive zygotes were denuded from cumulus cells and cultured in 5 µl/embryo synthetic oviductal medium (SOF)41 at 38.5°C in a humidified incubator in an atmosphere of 5% O2 and 5% CO2. The medium was renewed every 2 days up to the day of analysis.
Morphokinetic analysis and embryo staging
Time-lapse imaging was performed using an EmbryoScope+ (for mouse and human embryos) and an Embryoscope (for cow embryos) time-lapse incubator (Vitrolife). 8-cell stage was considered to begin when the embryos display 8 obvious blastomeres. We observed an elongated 8-cell to compaction transition with multiple cell divisions in cow and human embryos (Extended Data Fig. 1b-f), which we term “pre-compaction”. The beginning of compaction was defined when blastomeres start to flatten and adhere to each other. The morula stage starts when the embryos appear as a compacted group of cells until the formation of small microlumens. We considered the blastocyst stage to start when embryos show a single dominant blastocoel cavity. Mouse embryos exhibited a long morula stage, while cow and in particular human embryos showed a comparatively rapid transition between compaction and cavitation to initiate formation of a blastocyst (Extended Data Fig. 1b-d and Supplementary Table 1). In our analysis, cavitation was considered from the end of the morula stage until the formation of an expanded blastocyst, when TE cells touch and start to stretch the zona pellucida, causing zona pellucida thinning (see Extended Data Fig.1a for representative images of stages). Hatched blastocyst was defined as when part of the blastocyst was hatched outside of the zona pellucida. In addition, from time-lapse imaging we manually counted the number of cell divisions occurring between the 8-cell stage and beginning of compaction (Extended Data Fig. 1e). We also performed quantification of inner and outer cells at the morula stage which revealed that cow and mouse embryos have a similar percentage of inner cells, while human embryos show a strikingly reduced proportion of inner cells (Extended Data Fig. 1g). Similarly, we observed a difference in the number of ICM cells in mouse and cow compared to human blastocyst stage embryos (Extended Data Fig. 1h).
Inner/outer cell and ICM/TE quantification at morula and blastocyst stage
Quantification of inner and outer cells was performed with Imaris 8.2 3D viewer (Bitplane) by counting the number of cells in an inside or outside position in z-stack confocal images of morula stage embryos from this publication. Quantification of ICM/TE cells was obtained by reanalyzing data from previous publications of mouse29, cow42–45 and human2 blastocysts.
Immunofluorescence
Due to high background signal in the zona pellucida of cow embryos, prior to fixation the zona pellucida was removed with acidic Tyrode (Sigma) with 1 mg/ml polyvinyl alcohol (Sigma). Embryos were fixed with freshly prepared 4% paraformaldehyde in PBS that was pre-chilled at 4°C. Embryo fixation was performed for 20 min at RT and then the embryos were transferred through 3 washes of 1X PBS with 0.1% Tween-20 to remove residual paraformaldehyde. Embryos were permeabilized with 1X PBS with 0.5% Triton X-100 and then blocked in blocking solution (3% BSA in 1X PBS with 0.2% Triton X-100) for 2 h at RT on a rotating shaker. Then, embryos were incubated with primary antibodies diluted in blocking solution overnight at 4°C on rotating shaker. The antibodies and the concentrations used are reported in Supplementary Table 11. The following day, embryos were washed in 1X PBS with 0.2% Triton X-100 for 20 min at RT on a rotating shaker and then incubated with secondary antibodies diluted in blocking solution for 1 h at RT on a rotating shaker in the dark. Next, embryos were washed in 1X PBS with 0.2% Triton X-100 for 20 min at RT on rotating shaker. Finally, embryos were placed in 1X PBS with 0.1% Tween-20 with Vectashield and DAPI mounting medium (Vector Lab; H-1200) (1:30 dilution). Phalloidin staining was performed after secondary antibody incubation diluted in blocking solution for 1 h at RT on a rotating shaker in the dark. Embryos were placed on µ-Slide 8 well dishes (Ibidi; 80826) for confocal imaging.
For human embryos donated in France, the embryos were stained and imaged as previously described38.
For human embryos donated in Belgium, the embryos were stained and imaged as previously described39, with slight modifications. Briefly, the blocking solution was performed with 10% FBS, 1 h at RT. Moreover, the primary and secondary antibodies were diluted in 2% FBS and the washing time was extended to 10 minutes. Nuclei were stained with Hoechst-33342 (ThermoFisher).
Quantification of YAP1 and GATA3 expression
The measurement of YAP1 and GATA3 expression was performed using the 3D Fiji/ImageJ Suite. Briefly, the nuclei of immunofluorescently stained embryos was segmented automatically based on DAPI or HOECHST signal using Fiji, and YAP1, GATA3, SOX2 and TEAD4 fluorescence intensities were measured within the nuclei. We manually verified that the 3D segmentation did not count the same nucleus twice or fused together two adjacent nuclei, and in that case the measurement was excluded from the quantification.
Quantification of aPKC and AMOT expression at the apical membrane
The fluorescence intensity profile of aPKC and AMOT at the apical domain in Fig. 2d and Extended Data Fig. 6b, e of outer blastomeres were determined using the plot profile tool in Fiji. For cortical signal intensity of aPKC shown in Extended Data Fig. 10c and 11c, we draw a ~1-μm-thick line on the apical domain and measure the mean fluorescence intensity of aPKC. This value is normalized by dividing it by the mean fluorescence intensity measured in the nucleus. We pick confocal slices cutting the cell in the middle, in order to cover the whole apical domain, as previously performed27,46,47.
Confocal Imaging
For embryos imaged in the UK, confocal immunofluorescence images were taken with a Leica SP5 and SP8 confocal microscopes and 1-2-μm-thick optical sections were collected.
For the embryos imaged in France, images were taken with a Nikon confocal microscope.
For the embryos imaged in Belgium, images were taken with a LSM800 (Zeiss) confocal microscope.
Single cell RNA-sequencing datasets re-analysis
We integrated single cell RNA-sequencing (scRNA-seq) time course data from two different studies, which interrogate the transcriptome at different stages of human pre-implantation embryo development. The dataset from Yan et al. (ENA study ID: PRJNA153427)7 measures gene expression of individual cells from the oocyte to the late blastocyst stage, whereas the dataset from Petropoulos et al. (ENA study ID: PRJEB11202)5 performed this analysis from the 8-cell to the late blastocyst stage. Also, we considered the scRNA-seq data from Blakeley et al. (ENA study ID: PRJNA277181)4, which assayed the transcriptome of the three cell lineages of the human blastocyst (epiblast, primitive endoderm and trophectoderm).
Briefly, reads were mapped to the hg19 reference genome using STAR v2.7.0e with default settings48. Read summarization at the gene level was performed using Subread’s featureCounts v1.6.249. Then, we applied the quality control and normalization pipeline described in Lun et al.50 and performed imputation of drop-out events with DrImpute v1.151.
We focused on trophectoderm cells with gene expressions of the GATA3 gene above the median in Blakeley’s dataset. Next, we used package MGFR v1.8.152 to detect genes whose expression is high in all the selected trophectoderm samples compared to the epiblast and primitive endoderm samples. Then, we looked at the expression of the resulting list of genes at the morula stage using the integrated scRNA-seq data from Yan and Petropoulos. Finally, genes with average expression above 0 at the morula stage were selected to study the Pearson and Spearman correlation of their expression profile against the profile of GATA3 at the same developmental stage. Functional enrichment analysis of the selected genes was performed with enrichR v1.053.
To identify genes with the opposite trend, we centered our attention on the 10% of the morula samples with the lowest gene expression levels of GATA3. We identified 1722 genes highly expressed in these cells and 166 showed a negative correlation (Pearson’s r < -0.25) with GATA3 in all of the human morula cells analysed. Genes with average expression at least two-fold higher than that of GATA3 in these samples were shortlisted for correlation analysis against the expression profile of GATA3 at the morula stage as above.
The data processing and analysis pipelines are publicly available at https://github.com/galanisl/TE_differentiation.
Dimensionality reduction with griph
Griph is a tool to automatically identify clusters of cell types even in the presence of confounding factors that are difficult to control for (e.g. cell cycle stage or batch effects)54. griph uses an ensemble of dissimilarity measures between samples to construct a graph in which only very similar nodes are connected with each other. Then, it applies a community detection algorithm to unsupervised spot groups of highly connected nodes that are linked to other groups by only a few edges. These results can be visualized in low-dimensional space using a graph layout algorithm. We applied griph to the gene expression matrix of raw counts from the morula stage (Yan and Petropoulos integrated dataset) and colored cells by size-factor normalized log expression of the GATA3 gene at this stage. We used the method’s default parameters except from BatchAssignment, which we set to a character vector indicating each cell’s dataset of origin (i.e. Yan or Petropoulos).
LiCAT-sequencing dataset re-analysis
We reanalysed publicly available ATAC-seq chromatin accessibility datasets at the 8-cell and morula stages of human pre-implantation development (https://www.ebi.ac.uk/ena/browser/view/PRJNA494280) produced by LiCAT-seq (low-input chromatin accessibility and transcriptome sequencing)8. For this, we employed version 1.1.0 of the nf-core55 bioinformatics pipeline for ATAC-seq datasets. Briefly, adapters and low quality reads were removed with Trim Galore!, trimmed FastQ files were mapped to the GRCh38 human reference genome with BWA and narrow peaks were called with MACS2. For tool versions and full details of the pipeline see https://nf-co.re/atacseq. For the identification of transcription factor footprints in ATAC-seq peaks, we used the HINT tool in version 0.13.0 of the Regulatory Genomics Toolbox56. Then, we used the MotifAnalysis tool from the same toolbox to do identify transcription factor motifs reported in JASPAR57. Finally, we used HINT again to perform differential transcription factor activity analysis between the binding sites predicted at the morula versus the 8-cell stages. Transcription factor activity scores measure the strength of binding in a particular biological context and are a function of the difference between the Tn5 transposase cleavage events in the transcription factor footprint and flanking regions, as well as the cleavage events around the predicted binding site56.
Generation of scRNA-seq consensus coverage tracks
To generate the consensus coverage tracks for the morula scRNA-seq data (Fig. 1i and Extended Data Fig. 3d), we merged the BAM files associated with the high GATA3-expressing group of morula cells (top-right cluster in Fig. 1b) using the merge functionality in SAMtools v1.3.158. After indexing the merged BAM file, we scaled it with BAMscale v0.0.5-159. The same operations were applied to the low GATA3-expressing group of morula cells (red cells in Fig. 1b). The gene expression values of KRT18 and GRHL2 shown in the figures correspond to the average TPM expression of these genes in each group of morula cells.
Inhibitor treatment
The aPKC inhibitor CRT0276121 (Cancer Research Technology LTD) was dissolved in DMSO to 10 mM stock concentration and diluted at the required concentrations in pre-equilibrated embryo culture media. The tested concentrations of CRT0276121 are reported in Supplementary Table 6 for mouse embryos, in Supplementary Table 7 for cow embryos and in Supplementary Table 8 for human embryos. The following concentrations were used for the characterization experiments: 7-8 μM for mouse embryos, 1.0 μM for cow embryos and 1.5 μM for human embryos. Control embryos were developed in pre-equilibrated media where the same amount of DMSO was added. Schematic representations of the treatment timeline for each species are shown in Extended Data Figure 7a, c, e.
TRIM-Away experiment
pSMPP-mCherry-hTRIM21 vector was purchased from Addgene (https://www.addgene.org/104972/). mCherry-hTRIM21 was cloned into pCMV6-XL6 expression vector (https://www.addgene.org/vector-database/5211/) using EcoRI and XmaI restriction sites. To make in vitro transcribed mCherry-hTRIM21 mRNA, the template DNA was linearized by AgeI-HF digestion. mRNA was generated by in vitro transcription using mMESSAGE mMACHINE T7 Transcription kit (#AM1344; Thermo Fisher Scientific) and purified using RNeasy MinElute Cleanup Kit (#74204; Qiagen). mRNA was aliquoted at a concentration of 5 mg/ml and stored at -80°C. aPKC antibody (antibody raised in mouse, sc-17781, Santa Cruz) used for electroporation was passed through Amicon Ultra-0.5 100 KDa filter devices (Millipore) to concentrate it and to remove traces of azide and replace the buffer with Opti-MEM I medium (#31985062; Thermo Fisher Scientific), as previously described32. Concentrated antibody was stored in aliquots at -80°C. Prior to electroporation, the mCherry-TRIM21 mRNA and aPKC antibody complex was prepared at various concentration of mCherry-TRIM21 mRNA (200 - 700ng/μl) and 1320 - 4620 ng/μl of aPKC antibody diluted in Opti-MEM I medium.
We electroporated embryos using the mouse anti-aPKC antibody for TRIM-Away aPKC downregulation experiments. We used an anti-mouse IgG secondary antibody to recognise the mouse anti-aPKC antibody that was electroporated for the depletion experiment. To specifically detect the endogenous expression of aPKC, we used a rabbit anti-aPKC rabbit antibody together with an anti-rabbit IgG secondary antibody (schematic representation in Extended Data Figure 9e).
Electroporation experiment
Mouse, human or cow embryos were placed in drops of FHM (#MR-024D; Millipore) or oocyte and embryo wash media (#51002; Egg Technologies Ltd) respectively, in a petri dish overlaid with mineral oil (#ART-4008-5P; Origio); the dish was placed on a heated microscope stage (Olympus IX70) and a single hole was created in the zona pellucida using a Saturn 5 laser (Research Instruments). The embryos were then washed through Opti-MEM I medium (#31985062, Thermo Fisher Scientific). 5-8μl of the mCherry-TRIM21 mRNA and aPKC antibody complex was added between the electrodes of the plate (CUY501P1-1.5, NEPA GENE Co. Ltd, Sonidel, Ireland); the impedance of the solution was checked and adjusted to between 0.19Ω and 0.21Ω (typically 0.20 Ω). Electroporation of the embryos was performed using the NEPA21 system (NEPA GENE Co. Ltd, Sonidel, Ireland). For mouse and human embryos, the following electroporation parameters were used: voltage of 20 V, pulse length of 25ms, pulse interval of 50ms and the number of pulses was 2. For mouse embryos, various concentrations were tested (Supplementary Table 9) and the concentration used for phenotyping was 600 ng/μl of mCherry-TRIM21 and 3960 ng/μl of aPKC antibody. For human embryos, the concentration used for phenotyping was 700 ng/μl of mRNA and 4620 ng/μl of aPKC antibody. For cow embryos the following electroporation parameters were used: voltage of 20 V, pulse length of 5ms or 7.5ms, pulse interval of 50ms and the number of pulses was 2. For cow embryos, various concentrations were tested (Supplementary Table 10), and conditions for phenotyping were 400 ng/μl of mCherry-TRIM21 and 2640 ng/μl of aPKC antibody at a pulse length of 7.5 msec. Immediately after electroporation, the mouse and human embryos were removed from the plate washed through FHM and cultured in Global medium (#LGGG-20; LifeGlobal) supplemented with 5 mg/ml protein supplement (#GHSA125: LifeGlobal) and overlaid with mineral oil until the morula stage when they were fixed for phenotyping. In the case of the cow experiments, the embryos were removed from the plate and washed in oocyte and embryo wash media and cultured in BO-IVC media (#71005; Egg Technologies Ltd) until the morula stage upon which the zona was removed using acidic Tyrode’s solution (#T1788; Sigma-Aldrich) followed by fixation and phenotyping. In the mouse experiments, the control embryos are embryos electroporated with mCherry-TRIM21 mRNA only, while in cow and human experiments control embryos are absolute control embryos.
Statistical analysis
All statistical analyses in this study were performed using GraphPad Prism 6.0 or using the R environment for statistical computing. The number of cells or embryos analyzed (n), statistical tests, and p values are all stated in each figure or figure legend. The t-test is an unpaired two-tailed t-test and two-tailed Mann Whitney U test. Data are represented as mean ± s.d. Unless otherwise noted, each experiment was performed at least three times.
Extended Data
Extended Data Figure 1.
a, Representative images of mouse, cow and human embryos at each developmental stage analyzed. Yellow arrows point to blastomere flattening. Yellow outline remarks the compacted morula. Yellow arrowheads mark microlumens. Yellow asterisks show single dominant cavity. Yellow bars show zona pellucida (ZP) thinning. Embryos are not shown to scale. dpf = days post fertilization. b, c, Morphokinetic analysis of mouse, cow and human preimplantation development showing relative time in hours (b) and in percentage (c) (from 8-cell stage to the end of cavitation). d, Morphokinetic analysis for each of the mouse, cow and human preimplantation embryos used in the analysis, showing relative time in percentage (from the 8-cell stage up to the end of cavitation). n = 15 embryos for mouse and cow, and n = 16 for human. e, Quantification of the number of individual cells that divided between 8-cell stage and start of compaction in mouse, cow and human embryos. n = 15 embryos for mouse and human, and n = 14 for cow. f, Quantification of the total cell number in mouse (32-cell stage), cow and human morula stage embryos. n = 25 for mouse, n = 20 for cow and n = 34 for human. g, Quantification of the number of inner and outer cells in percentage in mouse, cow and human morula. n = 25 for mouse, n = 20 for cow and n = 34 for human. h, Quantification of the number of ICM and TE cells in percentage in mouse, cow and human blastocysts. n = 14 for mouse, n = 10 for cow and n = 12 for human. Mann Whitney U test, *** P < 0.001, **** P < 0.0001, ns = not significant.
Extended Data Figure 2.
a, b, Immunofluorescence analysis of F-ACTIN (red), TEAD4 (magenta) and HOECHST-33342 nuclear staining (blue) in human morula embryo. Yellow arrowheads point to a cell without TEAD4 expression. c, Percentage of TEAD4-positive and -negative cells in human morula embryos (n = 112 cells from 5 embryos). d, Quantification of TEAD4 fluorescence intensity, normalized to HOECHST-33342 intensity, in either inner or outer cells in human morula embryos (n = 63 cells from 5 embryos). t-test, ns = not significant. e, Immunofluorescence analysis of GATA3 (green), E-CADHERIN (red), YAP1 (magenta) and DAPI nuclear staining (blue) in mouse morula stage embryos. f, g, Quantification of YAP1 (f) and GATA3 (g) fluorescence intensity, normalized to DAPI intensity, in either inner or outer cells in mouse morula stage embryos (n = 182 cells for YAP1 from 13 embryos and n = 139 cells for GATA3 from 9 embryos). t-test, ****p < 0.0001. h, Immunofluorescence analysis using various secondary-antibodies used in this paper and DAPI nuclear staining (blue) in mouse morula stage embryos (n = 3). i, Time-course immunofluorescence analysis of GATA3 (green), β-CATENIN (red), YAP1 (magenta) and DAPI nuclear staining (blue) in cow embryos at different developmental stages: pre-compaction (n = 5) and late compaction (n = 5), morula (n = 11) and expanded blastocyst (n = 5). j,k, Quantification of YAP1 (j) and GATA3 (k) fluorescence intensity, normalized to DAPI intensity, in either inner or outer cells in cow morula stage embryos (n = 97 cells from 11 embryos). t-test, ****p < 0.0001. l, Immunofluorescence analysis of GATA3 (green), GATA2 (red) and DAPI nuclear staining (blue) in a human morula stage embryo (n = 3). m, Immunofluorescence analysis of GATA3 (green), OCT4 (red), GATA2 (magenta) and DAPI nuclear staining (blue) in a human blastocyst stage embryo (n = 3). Yellow arrowheads point to outer cells expressing GATA3, while cyan arrow points to an inner cell devoid of GATA3 expression. Scale bars, as displayed in figures.
Extended Data Figure 3.
a, Immunofluorescence analysis of YAP1 (green), F-ACTIN (red), WWTR1 (magenta) and DAPI nuclear staining (blue) in a human morula stage embryo (n = 3). b, Immunofluorescence analysis of YAP1 (green), NANOG (red) and WWTR1 (magenta) and DAPI nuclear staining (blue) in a human blastocyst stage embryo (n = 3). Yellow arrowheads point to outer and TE cells co-expressing YAP1 and WWTR1. c, Immunofluorescence analysis of GATA3 (green), KRT18 (magenta) and HOECHST-33342 nuclear staining (blue) in a human blastocyst stage embryo (n = 3). d, Genome browser view of the ATAC-seq signal at the GRHL2 locus. High confidence peaks (FDR < 0.001) were used to identify transcription factor motifs. Representative binding motifs associated with the footprints are highlighted. The average expression of GRHL2 in high GATA3-high and GATA3-low expressing cells at the morula is shown and the TPM units indicated. Scale bars, as displayed in figures. e, Immunofluorescence analysis of GRHL2 (green), F-ACTIN (red), GATA3 (magenta) and DAPI nuclear staining (blue) in human morula stage embryos (n = 3). Yellow arrowheads point to outer cells co-expressing GRHL2 and GATA3, and cyan arrows point to inner cells expressing GRHL2. f, Immunofluorescence analysis of GRHL2 (green), OCT4 (red), GATA3 (magenta) and DAPI nuclear staining (blue) in human expanded and hatching blastocyst stage embryo (n = 3 each stage). Scale bars, as displayed in figures.
Extended Data Figure 4.
a-d, Scatter plots showing positive correlation of GATA3 expression profile with GRHL2, CLDN4, RAB20 (a), PTGES, TFEB, PLAC8 (b), ATP6V1B1, FXYD4, SLC7A2 (c), and VGLL4 (d) expression profiles in human morula cells. n = 197 cells. r = Pearson correlation coefficient. Values are displayed as log-transformed size-factor-normalized counts. The black line corresponds to a linear regression model fitted to the data with 95% confidence bands. e, Scatter plots of selected genes implicated in embryonic stem cell pluripotency and/or enriched in EPI/ICM precursors in human morula cells that were identified as negatively correlated with GATA3 expression. n = 197 cells. r = Pearson correlation coefficient. Values are displayed as log-transformed size-factor-normalized counts. The black line corresponds to a linear regression model fitted to the data with 95% confidence bands. f, Boxplots representing genes coincidently highly expressed in GATA3-high versus GATA3-low cells in human morula cells. Data are shown as Transcripts Per Million (TPM) + 1. Boxes correspond to the first and third quartiles, horizontal lines to the median, whiskers extend to 1.5 times the interquartile range and dots are outliers.
Extended Data Figure 5.
a, Immunofluorescence analysis of SOX2 (green), E-CADHERIN (red), GATA3 (magenta) and DAPI nuclear staining (blue) in mouse morula stage embryos. b, Quantification of SOX2 fluorescence intensity, normalized to DAPI intensity, in either inner or outer cells in mouse morula stage embryos (n = 93 cells from 7 embryos). Yellow arrows mark outer cells expressing only GATA3. c, Time-course immunofluorescence analysis of SOX2 (green), β-CATENIN (red), GATA3 (magenta) and DAPI nuclear staining (blue) in cow embryos at pre-compaction (n = 5), late compaction (n = 5), morula (n = 9) and expanded blastocyst (n = 5) stages. d, Immunofluorescence analysis of SOX2 (green), β-CATENIN (red), GATA3 (magenta) and DAPI nuclear staining (blue) in human pre-compaction (n = 5) and late-compaction (n = 5) stage embryos. e, Quantification of SOX2 fluorescence intensity, normalized to DAPI intensity, in either inner or outer cells in cow morula stage embryos (n = 136 cells from 9 embryos). f, Quantification of SOX2 fluorescence intensity, normalized to DAPI intensity, in either inner or outer cells in human morula stage embryos (n = 68 cells from 6 embryos). Yellow arrowheads point to outer cells expressing SOX2 and GATA3. t-test, ****p < 0.0001, ns = not significant. g, Immunofluorescence analysis of SOX2 (green), F-ACTIN (red), GATA3 (magenta) and DAPI nuclear staining (blue) in human morula and blastocyst stage embryo (n = 3 each stage). The SOX2 antibody used in panel g in this figure is MAB2018 (R&D), while the one used in Figure 2 is 14-9811-82 (Ebioscience), both show a consistent signal for SOX2. Yellow arrowheads point to outer cells co-expressing GATA3 and SOX2, while cyan arrow points to an inner cell showing SOX2 expression only. Scale bar, as displayed in figure.
Extended Data Figure 6.
a, Immunofluorescence analysis of aPKC (green), E-CADHERIN (red), AMOT (magenta) and DAPI nuclear staining (blue) in mouse morula stage embryos (n = 10). b, Fluorescence intensity profile of aPKC and AMOT shown along the yellow arrows in mouse morula stage embryos. c, Immunofluorescence analysis of aPKC (green), E-CADHERIN (red) and DAPI nuclear staining (blue) in mouse morula stage embryo. d, Immunofluorescence analysis of aPKC (green), β-CATENIN (red), AMOT (magenta) and DAPI nuclear staining (blue) in cow morula stage embryos (n = 10). e, Fluorescence intensity profile of aPKC and AMOT shown along the yellow arrows in cow morula stage embryos. f, Immunofluorescence analysis of aPKC (green) and DAPI nuclear staining (blue) in cow morula stage embryo (n = 3). g, Immunofluorescence analysis of aPKC (green), E-CADHERIN (red) and DAPI nuclear staining (blue) in human morula stage embryo (n = 3). aPKC antibody used in this figure panel c, f, g is LC-C354069 (LSBio), while aPKC antibody used in Figure 3 and in this figure panel a, d is sc-17781 (Santa Cruz). Both antibodies show strong aPKC apical expression. h, Immunofluorescence analysis of PARD6B (green), F-ACTIN (red), aPKC (magenta) and DAPI nuclear staining (blue) in human morula stage embryo (n = 3). i, Immunofluorescence analysis of PARD6B (green), NANOG (red), aPKC (magenta) and DAPI nuclear staining (blue) in human blastocyst stage embryo (n = 3). Scale bar, as displayed in figure.
Extended Data Figure 7.
a, Schematic of aPKC inhibitor treatment in mouse embryos. b, Immunofluorescence analysis of GATA3 (green), E-CADHERIN (red), YAP1 (magenta) and DAPI nuclear staining (blue) in mouse morula stage embryos treated with different concentration of aPKC inhibitor (n = reported in Supplementary Table 6 for each condition). c, Schematic of aPKC inhibitor treatment in cow embryos. d, Immunofluorescence analysis of β-CATENIN (red), YAP1 (magenta) and DAPI nuclear staining (blue) in cow morula stage embryos treated with different concentration of aPKC inhibitor (n = reported in Supplementary Table 7 for each condition). e, Schematic of aPKC inhibitor treatment in human embryos. f, Immunofluorescence analysis of GATA3 (green), β-CATENIN (red), YAP1 (magenta) and DAPI nuclear staining (blue) in human morula stage embryos treated with different concentration of aPKC inhibitor (n = reported in Supplementary Table 8 for each condition). Scale bars, as displayed in figures.
Extended Data Figure 8.
a, Immunofluorescence analysis of SOX2 (green), E-CADHERIN (red), YAP1 (magenta) and DAPI nuclear staining (blue) in control and aPKC inhibitor-treated mouse morula stage embryos. Yellow arrowheads point to outer cells expressing SOX2 in a mouse morula stage embryo. b, c, Quantification of SOX2 (b) and YAP1 (c) fluorescence intensity, normalized to DAPI intensity, in outer cells in control and aPKC-inhibitor treated mouse morula stage embryos (n = 155 cells from 19 embryos). t-test, ***p < 0.001, ****p < 0.0001. d, Schematic of aPKC inhibitor treatment in mouse embryos. e, Morphokinetic analysis of control and aPKC-treated mouse embryos showing relative time in percentage (from 2-cell stage to morula stage) (n = 88). f, Schematic of aPKC inhibitor treatment in mouse embryos. g, Quantification of percentage of mouse embryos either developing to form an expanded blastocyst or arrested morula in control (n = 30) and aPKC-inhibitor treated (n = 30) embryos. h, Schematic of aPKC inhibitor treatment in cow embryos. i, Quantification of percentage of cow embryos either developing to form an expanded blastocyst or arrested morula in control (n = 10) and aPKC-inhibitor treated (n = 10) embryos. j, Schematic of aPKC inhibitor treatment in human embryos. k, Quantification of percentage of human embryos either developing to form an expanded blastocyst or arrested morula in control (n = 12) and aPKC-inhibitor treated (n = 12) embryos. l, Immunofluorescence analysis of SOX2 (green), β-CATENIN (red), YAP1 (magenta) and DAPI nuclear staining (blue) in control and aPKC inhibitor-treated cow morula stage embryos. m, n, Quantification of SOX2 (m) and YAP1 (n) fluorescence intensity, normalized to DAPI intensity, in outer cells in control and aPKC-inhibitor treated cow morula stage embryos (n = 218 cells from 15 embryos). t-test, ****p < 0.0001, ns = not significant. o, Immunofluorescence analysis of SOX2 (green), F-ACTIN (red), YAP1 (magenta) and DAPI nuclear staining (blue) in control and aPKC inhibitor-treated human morula stage embryos. p, q, Quantification of SOX2 (p) and YAP1 (q) fluorescence intensity, normalized to DAPI intensity, in outer cells in control and aPKC-inhibitor treated cow morula stage embryos (n = 140 cells from 10 embryos). t-test, ****p < 0.0001, ns = not significant. Scale bars, as displayed in figures.
Extended Data Figure 9.
a, Immunofluorescence analysis of TEAD4 (green), E-CADHERIN (red), YAP1 (magenta) and DAPI nuclear staining (blue) in control and aPKC inhibitor-treated mouse morula stage embryos. b, c, Quantification of TEAD4 (b) and YAP1 (c) fluorescence intensity, normalized to DAPI intensity, in outer cells in control and aPKC-inhibitor treated mouse morula stage embryos (n = 101 cells from 10 embryos). t-test, ****p < 0.0001, ns = not significant. d, Immunofluorescence analysis of TEAD4 (green), F-ACTIN (red), YAP1 (magenta) and DAPI nuclear staining (blue) in control and aPKC inhibitor-treated human morula stage embryos. e, f, Quantification of TEAD4 (e) and YAP1 (f) fluorescence intensity, normalized to DAPI intensity, in outer cells in control and aPKC-inhibitor treated human morula stage embryos (n = 89 cells from 6 embryos). t-test, ****p < 0.0001, ns = not significant. g, Schematic of the TRIM-Away approach. h, Schematic representation of the TRIM-Away experiment in mouse. i, Schematic representation of the two different antibodies used in the TRIM-Away experiment. j, Immunofluorescence analysis of anti-mouse secondary antibody to detect the electroporated aPKC antibody (green), YAP1 (red), GATA3 (magenta) and DAPI nuclear staining (blue) at the morula stage in control embryos and in embryos electroporated with mCherry-TRIM21 mRNA and anti-aPKC antibody (n = reported in Supplementary Table 9 for each condition). Scale bars, as displayed in figures.
Extended Data Figure 10.
a, Immunofluorescence analysis of E-CADHERIN (green), mCHERRY (magenta) and DAPI nuclear staining (blue) at the morula stage in control embryos and in embryos electroporated with mCherry-TRIM21 mRNA and mouse anti-aPKC antibody (n = 10). b, Immunofluorescence analysis of anti-mouse secondary antibody to detect the electroporated aPKC antibody (green), E-CADHERIN (red), rabbit anti-aPKC to detect the aPKC protein (magenta) and DAPI nuclear staining (blue) in at the morula stage in embryos either electroporated with mCherry-TRIM21 mRNA only or with mCherry-TRIM21 mRNA and mouse anti-aPKC antibody. c, Quantification of aPKC cortical intensity (based on rabbit anti-aPKC signal) in outer cells at the morula stage in embryos electroporated either with mCherry-TRIM21 mRNA only or with mCherry-TRIM21 mRNA and mouse anti-aPKC antibody (n = 270 cells from 30 embryos). d, Immunofluorescence analysis of SOX2 (green), rabbit anti-aPKC to detect the aPKC protein (red), anti-mouse secondary antibody to detect the electroporated aPKC antibody (magenta) and DAPI nuclear staining (blue) at the morula stage in embryos electroporated either with mCherry-TRIM21 mRNA only or with mCherry-TRIM21 mRNA and mouse anti-aPKC antibody. Yellow arrowheads point to outer cells expressing SOX2 in a mouse morula stage embryo. 2 independent experiments. e, Quantification of SOX2 fluorescence intensity, normalized to DAPI intensity, in outer cells at the morula stage in embryos electroporated either with mCherry-TRIM21 mRNA only or with mCherry-TRIM21 mRNA and mouse anti-aPKC antibody (n = 120 cells 18 embryos). t-test, *p < 0.05. f, Immunofluorescence analysis of TEAD4 (green), anti-mouse secondary antibody to detect the electroporated aPKC antibody (magenta) and DAPI nuclear staining (blue) at the morula stage in embryos electroporated either with mCherry-TRIM21 mRNA only or with mCherry-TRIM21 mRNA and mouse anti-aPKC antibody. 2 independent experiments. g, Quantification of TEAD4 fluorescence intensity, normalized to DAPI intensity, in outer cells at the morula stage in embryos electroporated either with mCherry-TRIM21 mRNA only or with mCherry-TRIM21 mRNA and mouse anti-aPKC antibody (n = 90 cells from 10 embryos). t-test, ns = not significant. Scale bars as displayed in figures.
Extended Data Figure 11.
a, Schematic representation of the TRIM-Away experiment. b, Immunofluorescence analysis of anti-mouse secondary antibody to detect the electroporated aPKC antibody (green), rabbit anti-aPKC to detect the aPKC protein (red), GATA3 (magenta) and DAPI nuclear staining (blue) in at the morula stage in human embryos either electroporated with mCherry-TRIM21 mRNA only or with mCherry-TRIM21 mRNA and mouse anti-aPKC antibody. c, Quantification of aPKC cortical intensity (based on rabbit anti-aPKC signal) in outer cells at the morula stage in human embryos electroporated either with mCherry-TRIM21 mRNA only or with mCherry-TRIM21 mRNA and mouse anti-aPKC antibody (n = 45 cells from 6 embryos). d, Schematic representation of the TRIM-Away experiment. e, Immunofluorescence analysis of anti-mouse secondary antibody to detect the electroporated aPKC antibody (green), mCHERRY (red), and DAPI nuclear staining (blue) in cow morula stage embryos electroporated with mCherry-TRIM21 mRNA and mouse anti-aPKC antibody at a pulse length of either 5 or 7.5 msec (n = reported in Supplementary Table 10 for each condition). f, Immunofluorescence analysis of anti-mouse secondary antibody to detect the electroporated aPKC antibody (green), YAP1 (red), GATA3 (magenta) and DAPI nuclear staining (blue) at the morula stage in control embryos or embryos electroporated with mCherry-TRIM21 mRNA and mouse anti-aPKC antibody. g, h, Quantification of YAP1 (g) and GATA3 (h) fluorescence intensity, normalized to DAPI intensity, in outer cells in cow control embryos or embryos electroporated with mCherry-TRIM21 mRNA and mouse anti-aPKC antibody (n = 154 cells for YAP1 from 16 embryos, and n = 207 cells for GATA3 from 20 embryos). t-test, ns = not significant. Scale bars as displayed in figures. i, Proposed model for human early lineage specification. EPI, epiblast; PrE, primitive endoderm; TE, trophectoderm. E-CAD, E-CADHERIN; β-CAT, β-CATENIN.
Supplementary Material
Acknowledgments
We thank the generous donors whose contributions have enabled this research; we thank Parita Patel and Arasaratnam Srikantharajah at Homerton Fertility Centre, Homerton University Hospital; Michael Summers, Alan Handyside and Kamal Ahuja at London Bridge Fertility Clinic – London Women’s Clinic; and Stuart Lavery, Annabel Rattos and Marta Jansa Perez at Wolfson Fertility Centre, Hammersmith Hospital for the coordination and donation of embryos to our research project; the Niakan Lab, the Turner Lab, the Lovell-Badge Lab, Michele Marass, Teresa Rayon Alonso, Barry Thompson, and Nate Goehring for discussion, advice and feedback on the manuscript; Barry Thompson’s, Nate Goehring’s and James Briscoe’s laboratories for sharing reagents and advice; the Francis Crick Institute’s Advanced Light Microscopy and Biological Research Facilities; Anna Brodie and Katy Bacon for assisting with cow embryo culture. The AMOT antibody (Amot-C #10061-1) used in this paper for mouse embryos was generously provided by Hiroshi Sasaki’s Lab. CRT0276121 was generously provided by Cancer Research Technology. Work in L.D. lab was funded by a donation from MSD to “Fondation de l’Université de Nantes”. Work in H.V.d.V lab has been funded by the Fonds Wetenschappelijk Onderzoek Flanders (FWOAL722) and the Wetenschappelijk Fonds Willy Gepts (WFWG, UZBrussel, G142). Work in A.F-N. lab was supported by Comparative Biomedical Sciences Departmental fund from the Royal Veterinary College. Work in the K.K.N. lab was supported by the Francis Crick Institute, which receives its core funding from Cancer Research UK (FC001120), the UK Medical Research Council (FC001120), and the Wellcome Trust (FC001120) and by the Rosa Beddington Fund.
Footnotes
Author contributions
C.G. and K.K.N. conceived the study; K.K.N. supervised the project; C.G., K.K.N. and A.M. designed the experiments; C.G., K.K.N., A.M. and N.M.E.F. performed experiments; G.A-L. performed the bioinformatic analysis of scRNA-seq and ATAC-seq datasets; C.G., K.K.N., A.M. and G.A-L. analyzed data. S.L. managed human embryos donated to research in Nantes; C.G. and A.D. performed experiments on human embryos in Brussels; A.B. and S.L. performed experiments on human embryos in Nantes; K.E., P.S. and L.C. coordinated donation of embryos to the research project in London; L.D. supervised experiments on human embryos in Nantes; H.V.d.V. supervised experiments on human embryos in Brussels; A.F-N. and D.H. provided cow ovaries; A.F-N. provided techniques for cow embryo generation, helped with conceptualization and design of experiments on cow embryos, and hosted C.G. in his lab; C.G. and K.K.N. wrote the manuscript with help from all the authors.
All authors declare no competing financial interests.
Data Availability
The datasets analyzed during the current study were previously published and are available at the GEO repository GSE36552, at EMBL-EBI ArrayExpress: E-MTAB-3929 and at EMBL-EBI ENA: PRJNA494280.
Code availability
The data processing and analysis pipelines are publicly available at https://github.com/galanisl/TE_differentiation.
References
- 1.Cockburn K, Rossant J. Making the blastocyst: lessons from the mouse. The Journal of Clinical Investigation. 2010;120:995–1003. doi: 10.1172/JCI41229. [DOI] [PMC free article] [PubMed] [Google Scholar]
- 2.Niakan KK, Eggan K. Analysis of human embryos from zygote to blastocyst reveals distinct gene expression patterns relative to the mouse. Developmental Biology. 2013;375:54–64. doi: 10.1016/j.ydbio.2012.12.008. [DOI] [PubMed] [Google Scholar]
- 3.Fogarty NME, et al. Genome editing reveals a role for OCT4 in human embryogenesis. Nature. 2017;550:67. doi: 10.1038/nature24033. https://www.nature.com/articles/nature24033#supplementary-information. [DOI] [PMC free article] [PubMed] [Google Scholar]
- 4.Blakeley P, et al. Defining the three cell lineages of the human blastocyst by single-cell RNA-seq. Development (Cambridge, England) 2015;142:3151–3165. doi: 10.1242/dev.123547. [DOI] [PMC free article] [PubMed] [Google Scholar]
- 5.Petropoulos S, et al. Single-Cell RNA-Seq Reveals Lineage and X Chromosome Dynamics in Human Preimplantation Embryos. Cell. 2016;165:1012–1026. doi: 10.1016/j.cell.2016.03.023. [DOI] [PMC free article] [PubMed] [Google Scholar]
- 6.Berg DK, et al. Trophectoderm Lineage Determination in Cattle. Developmental cell. 2011;20:244–255. doi: 10.1016/j.devcel.2011.01.003. [DOI] [PubMed] [Google Scholar]
- 7.Yan L, et al. Single-cell RNA-Seq profiling of human preimplantation embryos and embryonic stem cells. Nature Structural &Amp; Molecular Biology. 2013;20:1131. doi: 10.1038/nsmb.2660. https://www.nature.com/articles/nsmb.2660#supplementary-information. [DOI] [PubMed] [Google Scholar]
- 8.Liu L, et al. An integrated chromatin accessibility and transcriptome landscape of human pre-implantation embryos. Nature Communications. 2019;10 doi: 10.1038/s41467-018-08244-0. 364. [DOI] [PMC free article] [PubMed] [Google Scholar]
- 9.Hendrickson PG, et al. Conserved roles of mouse DUX and human DUX4 in activating cleavage-stage genes and MERVL/HERVL retrotransposons. Nature Genetics. 2017;49:925–934. doi: 10.1038/ng.3844. [DOI] [PMC free article] [PubMed] [Google Scholar]
- 10.Madissoon E, et al. Characterization and target genes of nine human PRD-like homeobox domain genes expressed exclusively in early embryos. Scientific Reports. 2016;6 doi: 10.1038/srep28995. 28995. [DOI] [PMC free article] [PubMed] [Google Scholar]
- 11.Ralston A, et al. Gata3 regulates trophoblast development downstream of Tead4 and in parallel to Cdx2. Development (Cambridge, England) 2010;137:395–403. doi: 10.1242/dev.038828. [DOI] [PubMed] [Google Scholar]
- 12.Nishioka N, et al. Tead4 is required for specification of trophectoderm in pre-implantation mouse embryos. Mechanisms of Development. 2008;125:270–283. doi: 10.1016/j.mod.2007.11.002. [DOI] [PubMed] [Google Scholar]
- 13.Nishioka N, et al. The Hippo signaling pathway components Lats and Yap pattern Tead4 activity to distinguish mouse trophectoderm from inner cell mass. Developmental cell. 2009;16:398–410. doi: 10.1016/j.devcel.2009.02.003. [DOI] [PubMed] [Google Scholar]
- 14.Hirate Y, Cockburn K, Rossant J, Sasaki H. Tead4 is constitutively nuclear, while nuclear vs. cytoplasmic Yap distribution is regulated in preimplantation mouse embryos. Proceedings of the National Academy of Sciences. 2012;109:E3389–E3390. doi: 10.1073/pnas.1211810109. [DOI] [PMC free article] [PubMed] [Google Scholar]
- 15.Kilens S, et al. Parallel derivation of isogenic human primed and naive induced pluripotent stem cells. Nature Communications. 2018;9:360. doi: 10.1038/s41467-017-02107-w. [DOI] [PMC free article] [PubMed] [Google Scholar]
- 16.Lin KC, Park HW, Guan K-L. Regulation of the Hippo Pathway Transcription Factor TEAD. Trends in Biochemical Sciences. 2017;42:862–872. doi: 10.1016/j.tibs.2017.09.003. [DOI] [PMC free article] [PubMed] [Google Scholar]
- 17.Soncin F, et al. Comparative analysis of mouse and human placentae across gestation reveals species-specific regulators of placental development. Development (Cambridge, England) 2018;145 doi: 10.1242/dev.156273. [DOI] [PMC free article] [PubMed] [Google Scholar]
- 18.Cauffman G, De Rycke M, Sermon K, Liebaers I, Van de Velde H. Markers that define stemness in ESC are unable to identify the totipotent cells in human preimplantation embryos. Human Reproduction. 2008;24:63–70. doi: 10.1093/humrep/den351. [DOI] [PubMed] [Google Scholar]
- 19.Walentin K, et al. A Grhl2-dependent gene network controls trophoblast branching morphogenesis. Development (Cambridge, England) 2015;142:1125–1136. doi: 10.1242/dev.113829. [DOI] [PMC free article] [PubMed] [Google Scholar]
- 20.Fang F, et al. A distinct isoform of ZNF207 controls self-renewal and pluripotency of human embryonic stem cells. Nature Communications. 2018;9 doi: 10.1038/s41467-018-06908-5. 4384. [DOI] [PMC free article] [PubMed] [Google Scholar]
- 21.Guo G, et al. Epigenetic resetting of human pluripotency. Development (Cambridge, England) 2017;144:2748–2763. doi: 10.1242/dev.146811. [DOI] [PMC free article] [PubMed] [Google Scholar]
- 22.Wicklow E, et al. HIPPO Pathway Members Restrict SOX2 to the Inner Cell Mass Where It Promotes ICM Fates in the Mouse Blastocyst. PLOS Genetics. 2014;10:e1004618. doi: 10.1371/journal.pgen.1004618. [DOI] [PMC free article] [PubMed] [Google Scholar]
- 23.Hirate Y, et al. Polarity-dependent distribution of angiomotin localizes Hippo signaling in preimplantation embryos. Current biology: CB. 2013;23:1181–1194. doi: 10.1016/j.cub.2013.05.014. [DOI] [PMC free article] [PubMed] [Google Scholar]
- 24.Vinot S, et al. Asymmetric distribution of PAR proteins in the mouse embryo begins at the 8-cell stage during compaction. Developmental Biology. 2005;282:307–319. doi: 10.1016/j.ydbio.2005.03.001. [DOI] [PubMed] [Google Scholar]
- 25.Hirate Y, et al. Par-aPKC-dependent and -independent mechanisms cooperatively control cell polarity, Hippo signaling, and cell positioning in 16-cell stage mouse embryos. Development, Growth & Differentiation. 2015;57:544–556. doi: 10.1111/dgd.12235. [DOI] [PMC free article] [PubMed] [Google Scholar]
- 26.Kjaer S, et al. Adenosine-binding motif mimicry and cellular effects of a thieno[2,3-d]pyrimidine-based chemical inhibitor of atypical protein kinase C isoenzymes. The Biochemical journal. 2013;451:329–342. doi: 10.1042/bj20121871. [DOI] [PubMed] [Google Scholar]
- 27.Rodriguez J, et al. aPKC Cycles between Functionally Distinct PAR Protein Assemblies to Drive Cell Polarity. Developmental cell. 2017;42:400–415.e409. doi: 10.1016/j.devcel.2017.07.007. [DOI] [PMC free article] [PubMed] [Google Scholar]
- 28.Aguilar-Aragon M, et al. Pak1 Kinase Maintains Apical Membrane Identity in Epithelia. Cell Reports. 2018;22:1639–1646. doi: 10.1016/j.celrep.2018.01.060. [DOI] [PMC free article] [PubMed] [Google Scholar]
- 29.Plusa B, et al. Downregulation of Par3 and aPKC function directs cells towards the ICM in the preimplantation mouse embryo. Journal of Cell Science. 2005;118:505–515. doi: 10.1242/jcs.01666. [DOI] [PubMed] [Google Scholar]
- 30.Korotkevich E, et al. The Apical Domain Is Required and Sufficient for the First Lineage Segregation in the Mouse Embryo. Developmental cell. 2017;40:235–247.e237. doi: 10.1016/j.devcel.2017.01.006. [DOI] [PMC free article] [PubMed] [Google Scholar]
- 31.Frum T, Murphy TM, Ralston A. HIPPO signaling resolves embryonic cell fate conflicts during establishment of pluripotency in vivo. eLife. 2018;7 doi: 10.7554/eLife.42298. [DOI] [PMC free article] [PubMed] [Google Scholar]
- 32.Clift D, et al. A Method for the Acute and Rapid Degradation of Endogenous Proteins. Cell. 2017;171:1692–1706.e1618. doi: 10.1016/j.cell.2017.10.033. [DOI] [PMC free article] [PubMed] [Google Scholar]
- 33.Israel S, Casser E, Drexler HCA, Fuellen G, Boiani M. A framework for TRIM21-mediated protein depletion in early mouse embryos: recapitulation of Tead4 null phenotype over three days. BMC Genomics. 2019;20:755. doi: 10.1186/s12864-019-6106-2. [DOI] [PMC free article] [PubMed] [Google Scholar]
- 34.Chi F, Sharpley MS, Nagaraj R, Roy SS, Banerjee U. Glycolysis-Independent Glucose Metabolism Distinguishes TE from ICM Fate during Mammalian Embryogenesis. Developmental cell. 2020;53:9–26.e24. doi: 10.1016/j.devcel.2020.02.015. [DOI] [PMC free article] [PubMed] [Google Scholar]
- 35.Alarcon VB. Cell polarity regulator PARD6B is essential for trophectoderm formation in the preimplantation mouse embryo. Biol Reprod. 2010;83:347–358. doi: 10.1095/biolreprod.110.084400. [DOI] [PMC free article] [PubMed] [Google Scholar]
- 36.De Paepe C, et al. Human trophectoderm cells are not yet committed. Human reproduction (Oxford, England) 2013;28:740–749. doi: 10.1093/humrep/des432. [DOI] [PubMed] [Google Scholar]
- 37.Kimmelman J, et al. New ISSCR guidelines: clinical translation of stem cell research. The Lancet. 2016;387:1979–1981. doi: 10.1016/S0140-6736(16)30390-7. [DOI] [PubMed] [Google Scholar]
- 38.Meistermann D, et al. Spatio-temporal analysis of human preimplantation development reveals dynamics of epiblast and trophectoderm. bioRxiv. 2019 doi: 10.1101/604751. 604751. [DOI] [Google Scholar]
- 39.De Paepe C, et al. BMP4 plays a role in apoptosis during human preimplantation development. Molecular Reproduction and Development. 2019;86:53–62. doi: 10.1002/mrd.23081. [DOI] [PubMed] [Google Scholar]
- 40.Waddington D, Fouladi Nashta AA, Campbell KHS. Maintenance of Bovine Oocytes in Meiotic Arrest and Subsequent Development In Vitro: A Comparative Evaluation of Antral Follicle Culture with Other Methods1. Biology of Reproduction. 1998;59:255–262. doi: 10.1095/biolreprod59.2.255. [DOI] [PubMed] [Google Scholar]
- 41.Holm P, Booth PJ, Schmidt MH, Greve T, Callesen H. High bovine blastocyst development in a static in vitro production system using SOFaa medium supplemented with sodium citrate and myo-inositol with or without serum-proteins. Theriogenology. 1999;52:683–700. doi: 10.1016/s0093-691x(99)00162-4. [DOI] [PubMed] [Google Scholar]
- 42.Fouladi-Nashta AA, et al. Differential staining combined with TUNEL labelling to detect apoptosis in preimplantation bovine embryos. Reproductive BioMedicine Online. 2005;10:497–502. doi: 10.1016/S1472-6483(10)60827-9. [DOI] [PubMed] [Google Scholar]
- 43.Thouas GA, Korfiatis NA, French AJ, Jones GM, Trounson AO. Simplified technique for differential staining of inner cell mass and trophectoderm cells of mouse and bovine blastocysts. Reproductive BioMedicine Online. 2001;3:25–29. doi: 10.1016/S1472-6483(10)61960-8. [DOI] [PubMed] [Google Scholar]
- 44.Goissis MD, Cibelli JB. Functional characterization of CDX2 during bovine preimplantation development in vitro. Molecular Reproduction and Development. 2014;81:962–970. doi: 10.1002/mrd.22415. [DOI] [PubMed] [Google Scholar]
- 45.Koo D-B, et al. Aberrant Allocations of Inner Cell Mass and Trophectoderm Cells in Bovine Nuclear Transfer Blastocysts1. Biology of Reproduction. 2002;67:487–492. doi: 10.1095/biolreprod67.2.487. [DOI] [PubMed] [Google Scholar]
- 46.Zhu M, Leung CY, Shahbazi MN, Zernicka-Goetz M. Actomyosin polarisation through PLC-PKC triggers symmetry breaking of the mouse embryo. Nature Communications. 2017;8 doi: 10.1038/s41467-017-00977-8. 921. [DOI] [PMC free article] [PubMed] [Google Scholar]
- 47.Maître J-L, Niwayama R, Turlier H, Nédélec F, Hiiragi T. Pulsatile cell-autonomous contractility drives compaction in the mouse embryo. Nature Cell Biology. 2015;17:849–855. doi: 10.1038/ncb3185. [DOI] [PubMed] [Google Scholar]
- 48.Dobin A, et al. STAR: ultrafast universal RNA-seq aligner. Bioinformatics (Oxford, England) 2013;29:15–21. doi: 10.1093/bioinformatics/bts635. [DOI] [PMC free article] [PubMed] [Google Scholar]
- 49.Liao Y, Smyth GK, Shi W. featureCounts: an efficient general purpose program for assigning sequence reads to genomic features. Bioinformatics (Oxford, England) 2014;30:923–930. doi: 10.1093/bioinformatics/btt656. [DOI] [PubMed] [Google Scholar]
- 50.Theunissen TW, et al. Molecular Criteria for Defining the Naive Human Pluripotent State. Cell Stem Cell. 2016;19:502–515. doi: 10.1016/j.stem.2016.06.011. [DOI] [PMC free article] [PubMed] [Google Scholar]
- 51.Gong W, Kwak IY, Pota P, Koyano-Nakagawa N, Garry DJ. DrImpute: imputing dropout events in single cell RNA sequencing data. BMC bioinformatics. 2018;19:220. doi: 10.1186/s12859-018-2226-y. [DOI] [PMC free article] [PubMed] [Google Scholar]
- 52.El Amrani K, Alanis-Lobato G, Mah N, Kurtz A, Andrade-Navarro MA. Detection of condition-specific marker genes from RNA-seq data with MGFR. PeerJ. 2019;7:e6970. doi: 10.7717/peerj.6970. [DOI] [PMC free article] [PubMed] [Google Scholar]
- 53.Chen EY, et al. Enrichr: interactive and collaborative HTML5 gene list enrichment analysis tool. BMC bioinformatics. 2013;14:128. doi: 10.1186/1471-2105-14-128. [DOI] [PMC free article] [PubMed] [Google Scholar]
- 54.Serra D, et al. Self-organization and symmetry breaking in intestinal organoid development. Nature. 2019;569:66–72. doi: 10.1038/s41586-019-1146-y. [DOI] [PMC free article] [PubMed] [Google Scholar]
- 55.Ewels PA, et al. The nf-core framework for community-curated bioinformatics pipelines. Nature biotechnology. 2020;38:276–278. doi: 10.1038/s41587-020-0439-x. [DOI] [PubMed] [Google Scholar]
- 56.Li Z, et al. Identification of transcription factor binding sites using ATAC-seq. Genome biology. 2019;20:45. doi: 10.1186/s13059-019-1642-2. [DOI] [PMC free article] [PubMed] [Google Scholar]
- 57.Fornes O, et al. JASPAR 2020: update of the open-access database of transcription factor binding profiles. Nucleic acids research. 2020;48:D87–d92. doi: 10.1093/nar/gkz1001. [DOI] [PMC free article] [PubMed] [Google Scholar]
- 58.Li H, et al. The Sequence Alignment/Map format and SAMtools. Bioinformatics (Oxford, England) 2009;25:2078–2079. doi: 10.1093/bioinformatics/btp352. [DOI] [PMC free article] [PubMed] [Google Scholar]
- 59.Pongor LS, et al. BAMscale: quantification of next-generation sequencing peaks and generation of scaled coverage tracks. Epigenetics & chromatin. 2020;13:21. doi: 10.1186/s13072-020-00343-x. [DOI] [PMC free article] [PubMed] [Google Scholar]
Associated Data
This section collects any data citations, data availability statements, or supplementary materials included in this article.
Supplementary Materials
Data Availability Statement
The datasets analyzed during the current study were previously published and are available at the GEO repository GSE36552, at EMBL-EBI ArrayExpress: E-MTAB-3929 and at EMBL-EBI ENA: PRJNA494280.
The data processing and analysis pipelines are publicly available at https://github.com/galanisl/TE_differentiation.


