Abstract
The prevalence of diabetes is increasing constantly, resulting in a global epidemic1. Diabetes is a major cause of blindness, kidney failure, heart attacks, stroke or lower limb amputation; in large parts because of marked changes in blood vessels, defined by expansion of the basement membrane and a loss of vascular cells2–4. Diabetes also impairs endothelial cell (EC) function5 and disturbs EC-pericyte communication6. How endothelial/pericyte dysfunction leads to diabetic vasculopathy remains largely elusive. Here we report the development of self-organizing 3D human blood vessel organoids from pluripotent stem cells. These human blood vessel organoids contain endothelial cells and pericytes that self-assemble into capillary networks enveloped by a basement membrane. Human blood vessel organoids transplanted into mice form a stable, perfused vascular tree, including arteries, arterioles and venules. Exposure of blood vessel organoids to hyperglycemia and inflammatory cytokines in vitro induced thickening of the vascular basement membrane. Human blood vessels, exposed in vivo to a diabetic milieu in mice, also mimick the microvascular changes in diabetic patients. Dll4-Notch3 were identified as key drivers of diabetic vasculopathy in human blood vessels. Thus, organoids derived from human stem cells faithfully recapitulate the structure and function of human blood vessels and are amenable to model and identify regulators of diabetic vasculopathy, affecting hundreds of millions of patients.
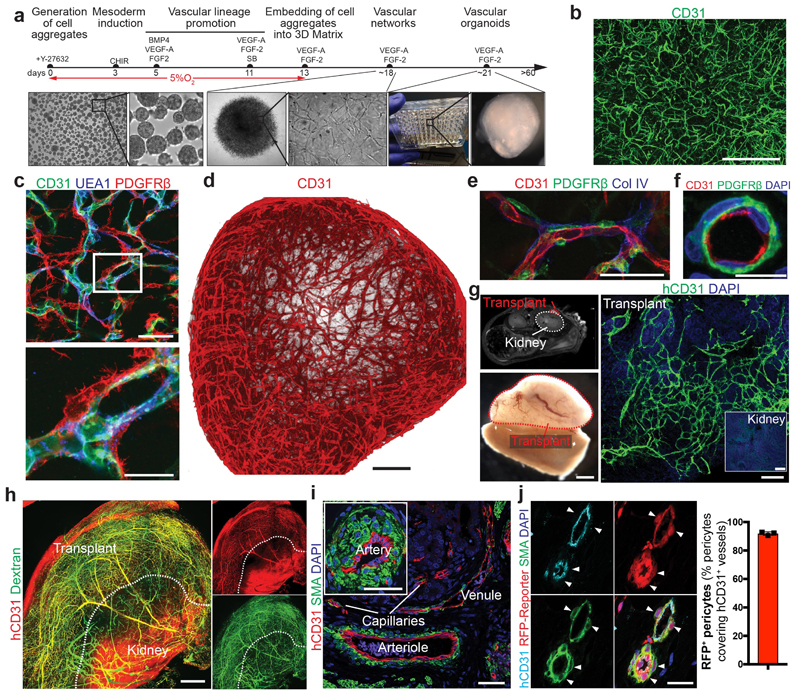
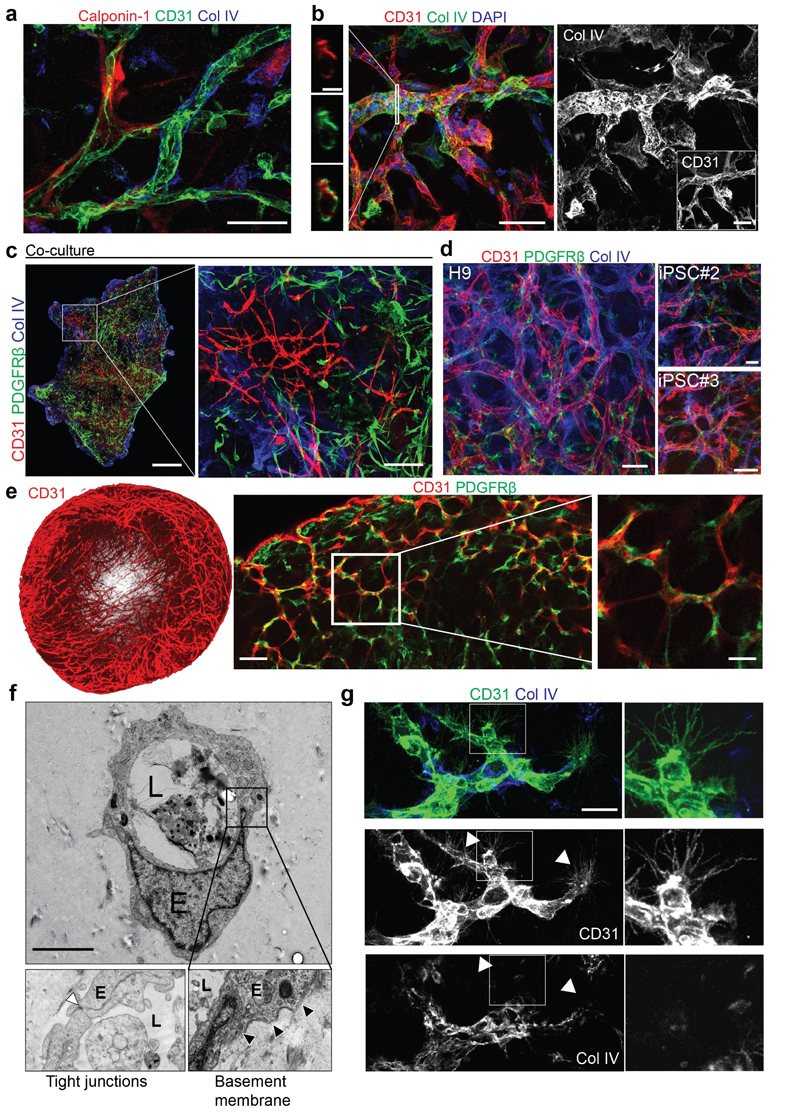
Previous studies used co-culture techniques of iPSC-derived endothelial cells and pericytes7,8 or early vascular cells9,10 to establish vascular networks. With the aim to engineer entire human blood vessels we developed a multistep protocol to modulate mesoderm development and vascular specification (Fig. 1a)8,11–16. Confocal imaging revealed formation of complex, interconnected networks of CD31+ endothelial tubes (Fig. 1b). These self-organizing 3D vascular networks showed proper localization of pericytes as defined by the molecular markers PDGFRβ, Calponin1 (Extended Data Fig.1a, Fig. 1c), and SMA (not shown). These vessel-like structures were enveloped by a basement membrane as determined by immunostaining for Collagen IV (Extended Data Fig. 1a,b). Co-culturing of purified, differentiated endothelial cells and pericytes resulted in tenuous endothelial networks with only few pericyte interactions not covered by Collagen IV (Extended Data Fig.1c). We reproducibly generated vascular networks using the human embryonic stem cell line (hESC) H9 as well as two additional iPSC lines (Extended Data Fig.1d).
Figure 1. Generation and engraftment of human vascular organoids from human stem cells.
a, Schematic of human pluripotent stem cell differentiation into vascular organoids. b, Representative immunofluorescence of CD31 expressing endothelial cells shows establishment of vascular networks (NC8). c, Endothelial networks (CD31, UEA-1) are covered by pericytes (PDGFRβ) (NC8). d, 3D reconstruction of capillary organization (CD31) in a vascular organoid (NC8). e, Endothelial tubes (CD31) in vascular organoids (NC8) covered by pericytes (PDGFRβ) and a basement membrane (Col IV). f, Cross section of a vascular organoid capillary. b-f, Experiments were repeated independently n = 10 times with similar results. g, Transplantation of human vascular organoids (NC8) into NSG mice. Top left panel indicates site of transplantation using MRI. Lower left panel shows an entire transplant after isolation. The organoid derived vasculature is visualized by a human-specific anti-CD31 antibody (hCD31) (Transplant). h, Functional human vasculature (hCD31) in mice revealed by FITC-Dextran perfusion. i, Generation of human arteries, arterioles, capillaries and venules in transplanted human organoids (NC8) shown by staining for hCD31 and SMA. h,i, Experiments were repeated independently on n = 5 biological samples, with similar results. j, Transplanted blood vessel organoids stably expressing RFP (H9). Co-staining with human specific anti-CD31 and anti-SMA shows human origin of endothelial cells and pericytes (triangles). Experiments were repeated independently on n = 3 biological samples, with similar results. Mean ± S.E.M. of RFP positive pericytes (RFP+SMA+) covering human endothelium (hCD31+). n=3 transplants. Scale bars b,h=500μm, c,e,i=50μm, , d=200μm, f=10μm, g(lower left panel)=1mm, g(right panel)=100μm, j=20μm. DAPI is shown to image nuclei.
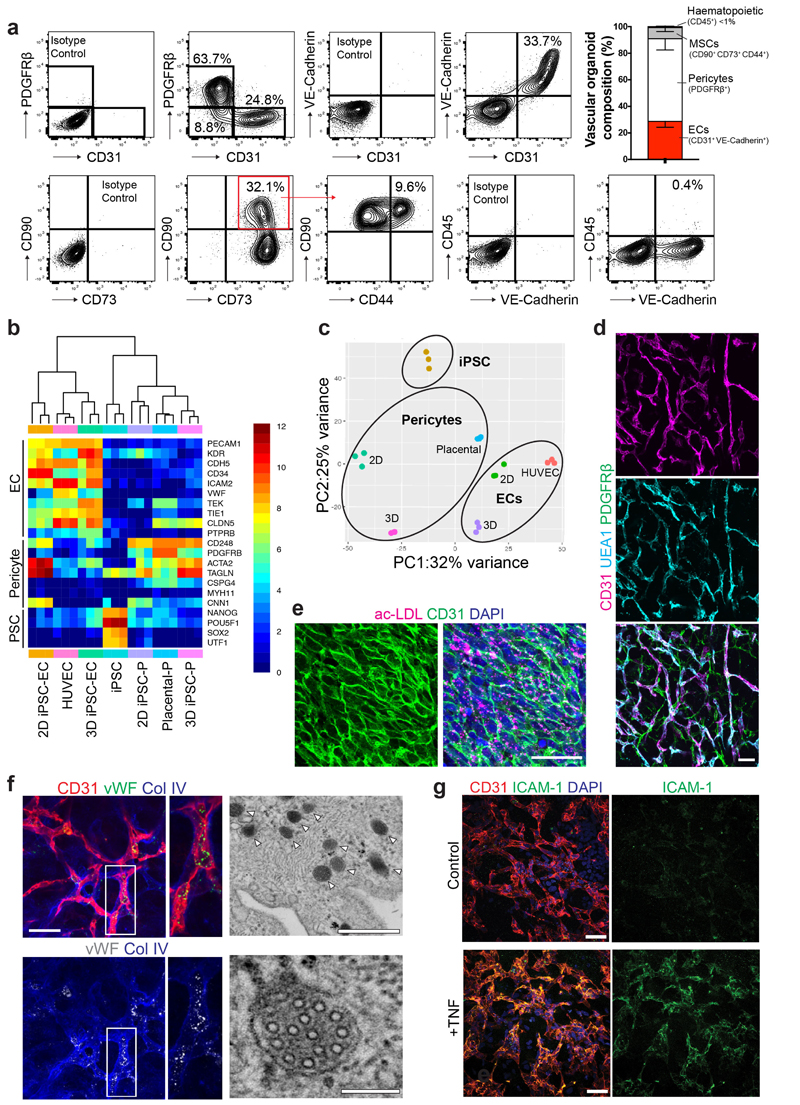
To standardize these microvasculatures, we developed 3D organoids in a 96 microwell format (Fig. 1a). These 1-2 mm vascular organoids formed 3D capillary networks consisting of lumen forming endothelial cells tightly associated with pericytes (Fig. 1d-f, Extended Data Fig. 1e and Supplementary Videos 1,2). Electron microscopy (EM) confirmed the generation of a lumen, a basement membrane and typical tight junctions between endothelial cells (Extended Data Fig. 1f). We identified tip cells by CD31+ filopodia in vascular organoids (Extended Data Fig. 1g), indicative of newly forming vessels17. Vascular organoids were composed of PDGFRβ+ pericytes, CD31+VE-Cadherin+ endothelium, CD90+CD73+CD44+ mesenchymal stem-like cells and CD45+ haematopoietic cells (Extended Data Fig. 2a). Gene expression profiling confirmed that CD31+ endothelial cells show a typical endothelial signature including maturity markers such as von-Willebrand factor (vWF) and VE-PTP (PTPRB), similar to primary human endothelial cells (HUVECS) (Extended Data Fig. 2b). PDGFRβ+ cells displayed typical pericyte markers, such as NG2 (GSPG4), SMA(Acta2) or Calponin1 (CNN1) and clustered to primary human placental pericytes (Extended Data Fig. 2b,c). Endothelial cells in vascular organoids stained positive for the lectin UEA-1, showed uptake of acetylated LDL, expressed von Willebrand factor (vWF), generated Weibel-Pallade bodies and responded to TNFα by inducing ICAM1 expression (Extended Data Fig. 2d-g), all indicative of functional maturity13.
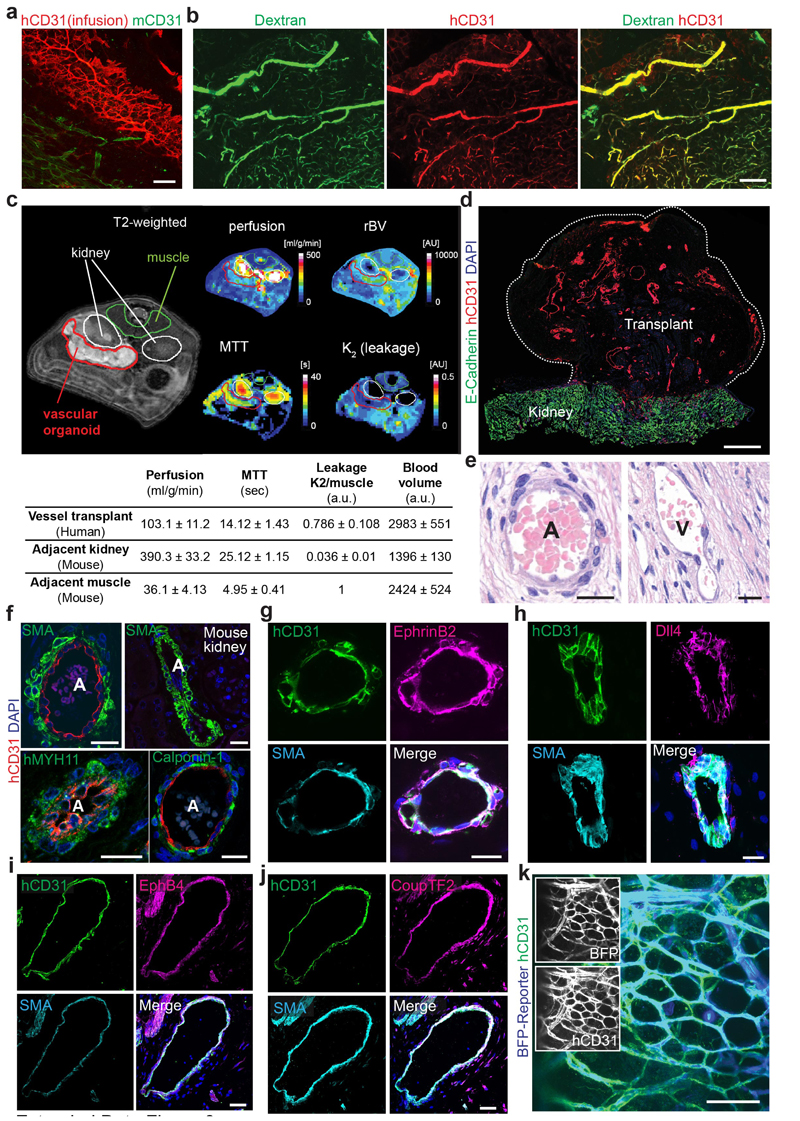
To test whether 3D organoids could form functional blood vessels in vivo 18, we differentiated hiPSCs into vascular organoids in vitro and transplanted them under the kidney capsule of immunodeficient mice. The human organoids reproducibly grew and survived (>95%) in the mouse environment for more than 6 months (Fig. 1g). FITC-Dextran and human-specific anti-CD31 antibody perfusion showed that human blood vessels had functionally connected to the mouse vasculature (Fig. 1h, Extended Data Fig. 3a,b). Quantitative MRI for perfusion rates and blood volumes showed well vascularized and perfused transplants; moreover, the mean transit times (MTT) and low vessel leakage (K2) confirmed normal organization and function of the human blood vessels (Extended Data Fig. 3c,d). Histological sectioning showed in vivo specification into arteries, arterioles, capillaries and venules (Fig. 1i, Extended Data Fig. 3d-j)19. Transplantation of vascular organoids derived from genetically BFP- or RFP-tagged hESCs confirmed the establishment of a vascular tree in the mice, containing human endothelium and >90% human pericytes (Fig. 1j, Extended Data Fig. 3k).
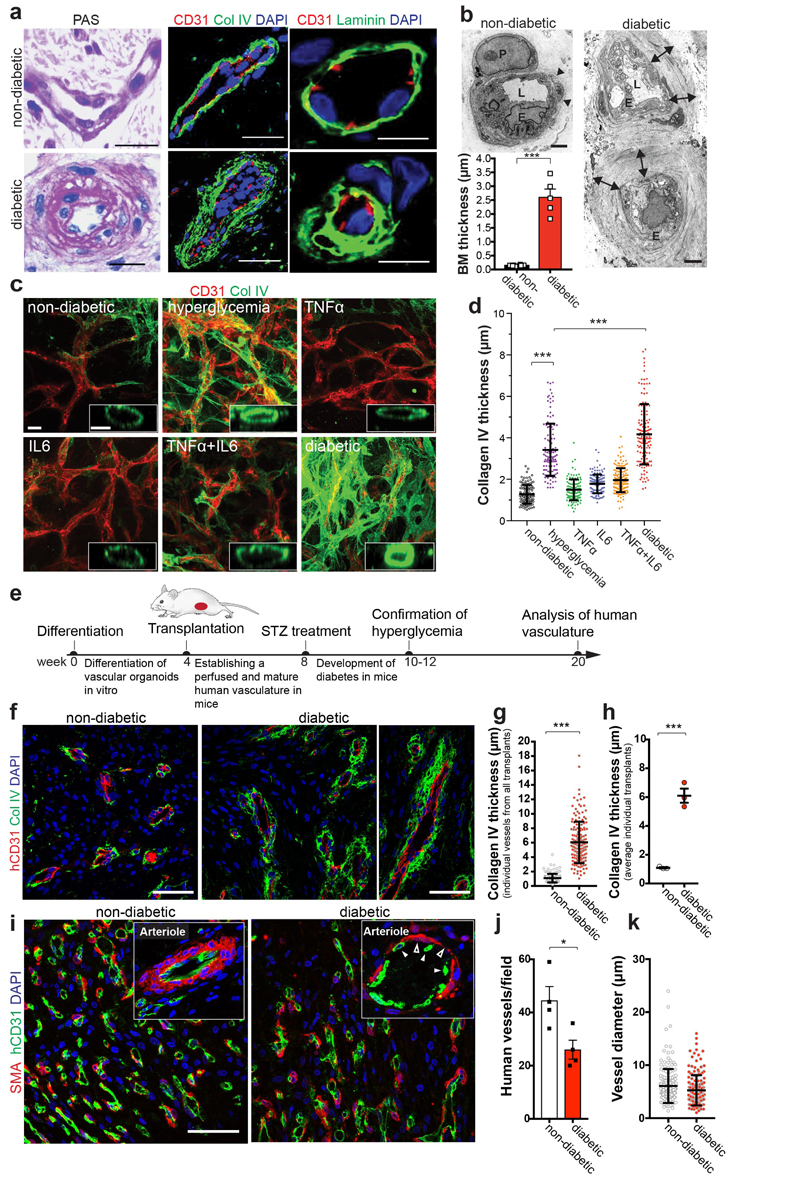
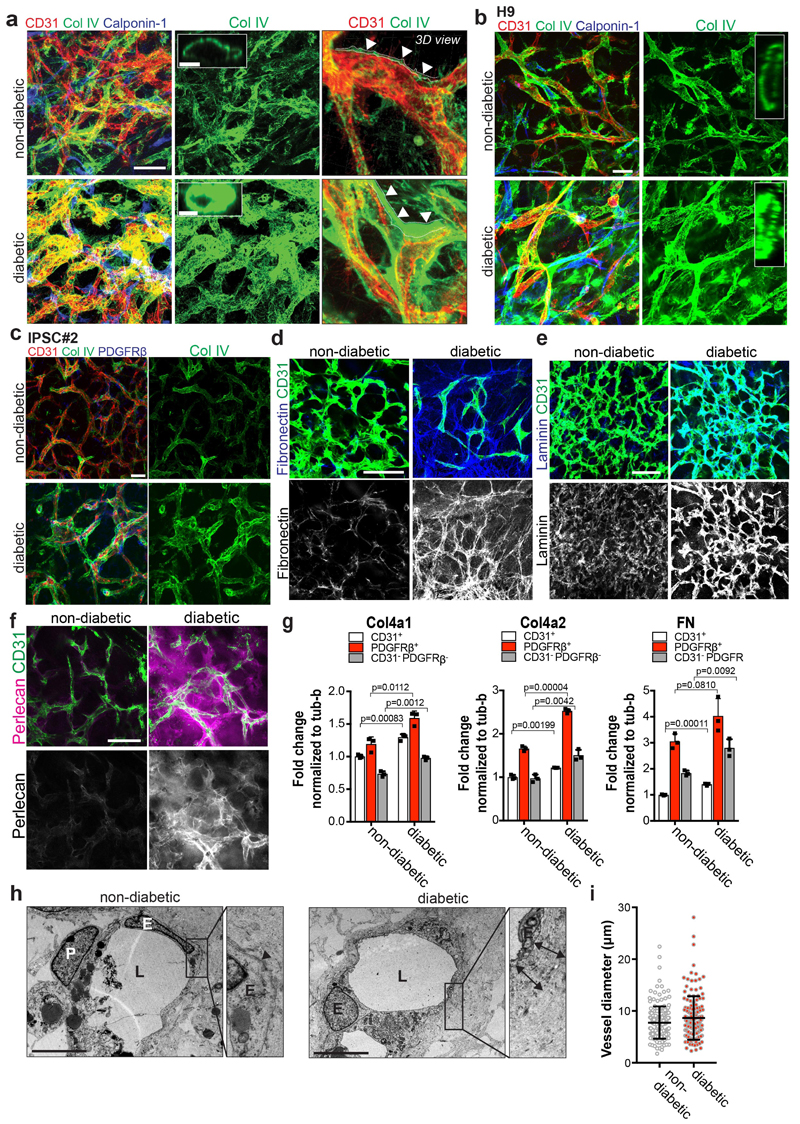
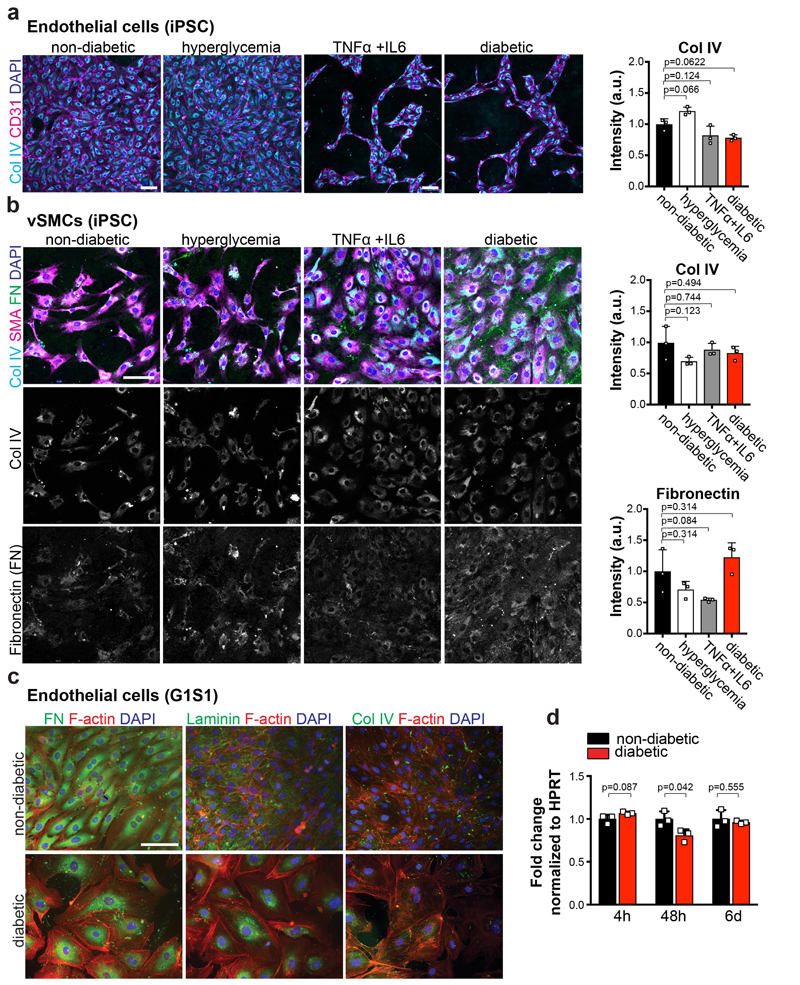
To assess diabetic microvascular changes in humans, we examined dermal skin microvasculature of normo-glycemic individuals and type 2 diabetic (T2D) patients (Supplementary Table 1). The dermal microvasculature of all T2D patients tested revealed massively thickened, onion-skin-like lamination and typical splitting of the basement membrane (Fig. 2a,b). To model diabetic basement membrane thickening, we exposed human blood vessel organoids to elevated glucose; hyperglycemia resulted in a significant increase in collagen IV deposits (Fig. 2c,d). Diabetes is accompanied by an inflammatory state, including elevated levels of the pro-inflammatory cytokines TNFα and IL620,21. Collagen IV was markedly enhanced in organoids exposed to high glucose together with TNFα and IL6 (termed “diabetic”) (Fig. 2c,d; Extended Data Fig. 4a-c). We also observed induction of other vascular basement membrane components: fibronectin, laminin, and perlecan (Extended Data Fig. 4d-f). Mainly pericytes, but also endothelial cells and MSC-like cells, upregulated ECM synthesis (Extended Data Fig. 4g). We also observed a massive thickening and splitting of the basement membrane layer by EM, whereas vessel diameters did not change (Extended Data Fig. 4h,i). Exposure of immortalized human endothelial cells or iPSC-derived endothelial cells and smooth muscle cells (vSMCs) to the diabetic medium did not result in upregulation of Collagen IV (Extended Data Fig. 5a-d).
Figure 2. Modelling diabetic microvasculopathy in human blood vessel organoids.
a, Basement membrane thickening of dermal capillaries in skin biopsies of late-stage type 2 diabetic patients shown by PAS (left), Col IV and laminin stainings. Experiments were repeated independently on n = 5 biological samples, with similar results. b, Representative electron microscopy of dermal capillaries of late-stage type 2 diabetic patients. Note the abnormally thick basement membrane in diabetic patients (two-sided arrows) as compared to non-diabetic controls (arrowheads). L, lumen; E, endothelial cell; P, pericyte. Bar graph shows quantification of basement membrane thickening (mean ± S.E.M.). Non-diabetic n=8 and diabetic n=5 independent patients. *** p=0.0000002 (unpaired, two-tailed t-test). c, Representative images of basement thickening (Col IV staining) (NC8). Experiments were repeated independently n = 3 times with similar results. d, Vessel cross-sections were used to quantify basement membrane thickening (ColIV); non-diabetic, TNFα n=120, high glucose n=120, IL-6 n=139, TNFα+IL6 n=151, diabetic n=134 lumina were analysed from 3 independent biological replicates with equal sample size (NC8). Mean ± SD. ***p<0.0001 (One-way ANOVA). e, Schematic of human vascular organoid transplantion and diabetes induction in NSG mice. f, Increased collagen type IV (Col IV) deposits around human CD31+ blood vessels in STZ treated mice (diabetic). Experiments were repeated independently on n = 6 biological samples, with similar results. g, Col IV thickness of individual human blood vessels (hCD31+) (non-diabetic, n=164, diabetic, n=170). Mean ± SD. *** p=9.64E-66 two-tailed student t-test. h, Graph shows mean Col IV thickness of n=3 mice per condition. Means ± S.E.M. *** p=0.00052 two-tailed student t-test i, Representative sections stained for human endothelial cells (hCD31+) and SMA to visualize mural cell coverage. The round cell shape (open arrowheads) and gaps in diabetic arterioles (filled arrowheads) indicates cell death. Experiments were repeated independently on n = 4 biological samples, with similar results. j, Quantification of human blood vessels/field as shown in i. n=4 mice per treatment and 7-10 fields analysed per mouse; Mean ± S.E.M. *p=0.027 two-tailed student t-test. k, Quantification of transplanted human vessel (hCD31+) (non-diabetic n=176, diabetic n=172 from n=4 animals per condition); Mean ± SD. Scale bars a(left,middle panel),c=20μm, a(right panel),c(insert)=5μm, b=2μm, f,i=50μm
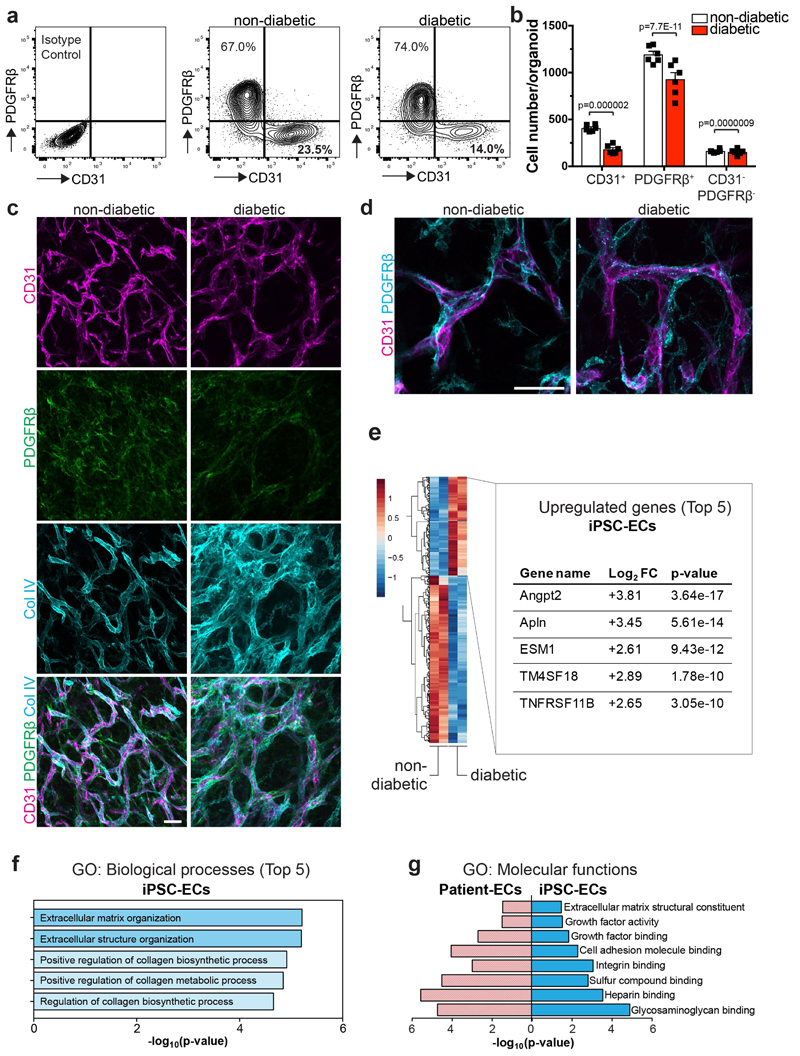
We observed a decreased endothelial cell to pericyte ratio and lower absolute numbers of endothelial cells and pericytes in diabetic vascular organoids, though the localization of pericytes remained unchanged (Extended Data Fig. 6a-d). Genes previously implicated as markers for diabetes in humans, including Angiopoietin226, Apelin25, and TNFRSF11B26, were among the most upregulated genes in diabetic organoids (Extended Data Fig. 6e). The top gene ontology (GO) pathway terms of differentially expressed genes (DEG) between CD31+ endothelium from control and diabetic organoids were associated with collagen biosynthesis and extracellular matrix reorganization; the most significant GO terms were shared between the vascular organoids and human patients (Extended Data Fig. 6f,g).
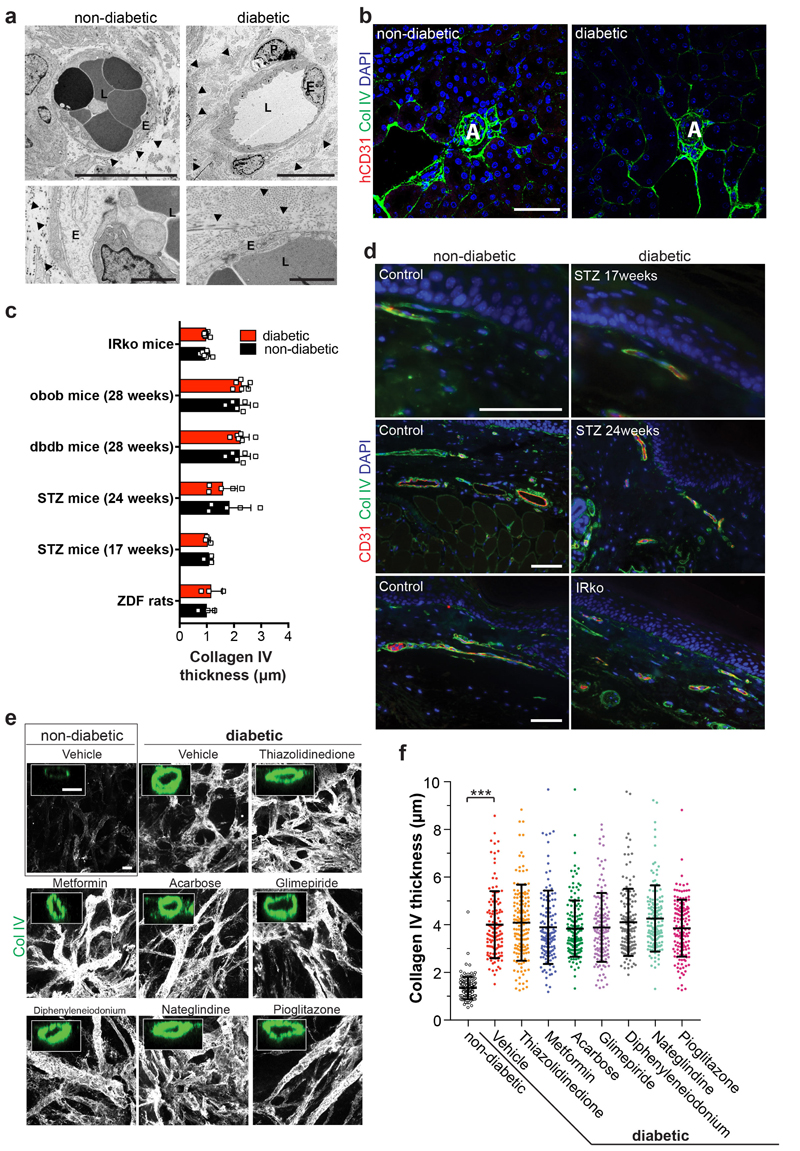
Mice carrying transplanted human vascular trees were then treated with streptozotocin (STZ) to induce diabetes (Fig. 2e). Similar to in vitro treated organoids, we observed marked basement membrane thickening of the transplanted human blood vessels (Fig. 2f-h). Expansion of the vascular basement membrane was confirmed by EM (Extended Data Fig. 7a). We did not detect any overt basement membrane thickening of the endogenous kidney capillaries of the same diabetic mice (Extended Data Fig. 7b). Unlike vascular alterations previously reported in the kidneys and eye of long-term diabetic mice and rats27,28, we failed to detect overt thickening of the basement membranes indicative of dermal vasculopathy in any of the models tested (Extended Data Fig. 7c,d; Supplementary Table 2). Transplanted human blood vessels, grown in STZ-treated mice, also showed other hallmarks of diabetic vasculopathy, i.e. vessel regression and loss of endothelial cells (Fig. 2i,j). Vessel coverage by pericytes (Fig. 2i) and vessel diameters (Fig. 2k) stayed unaffected.
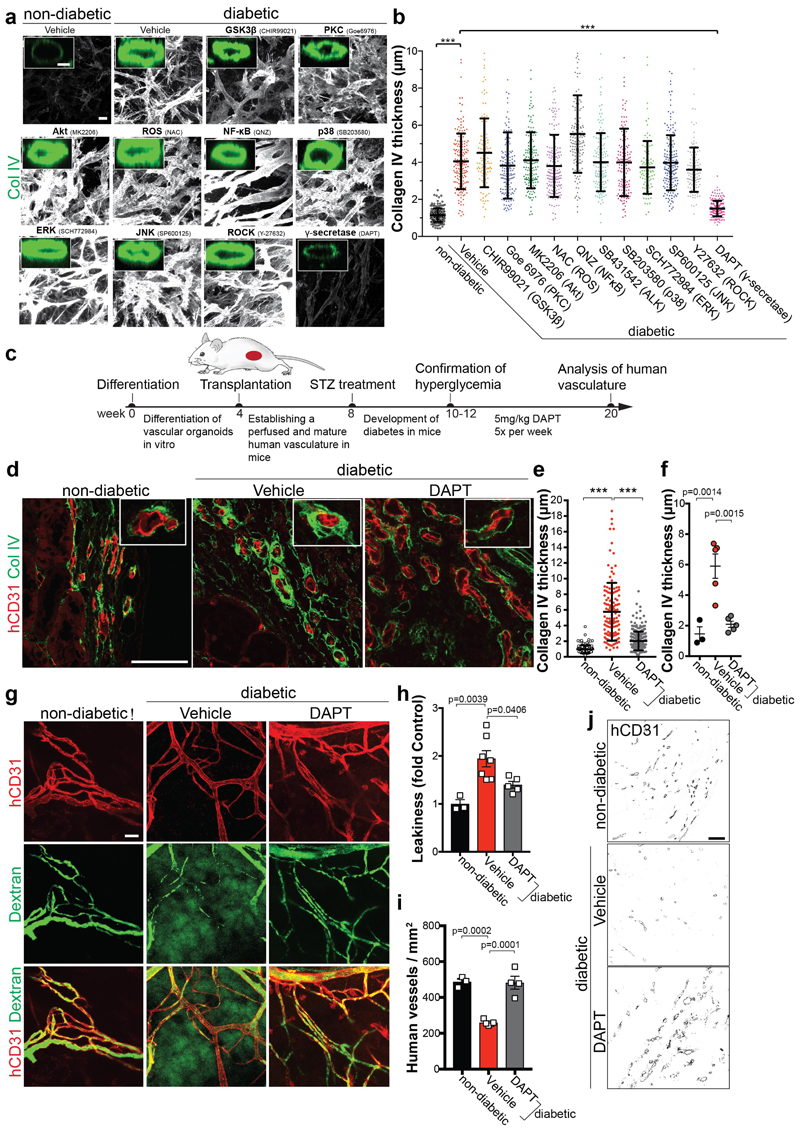
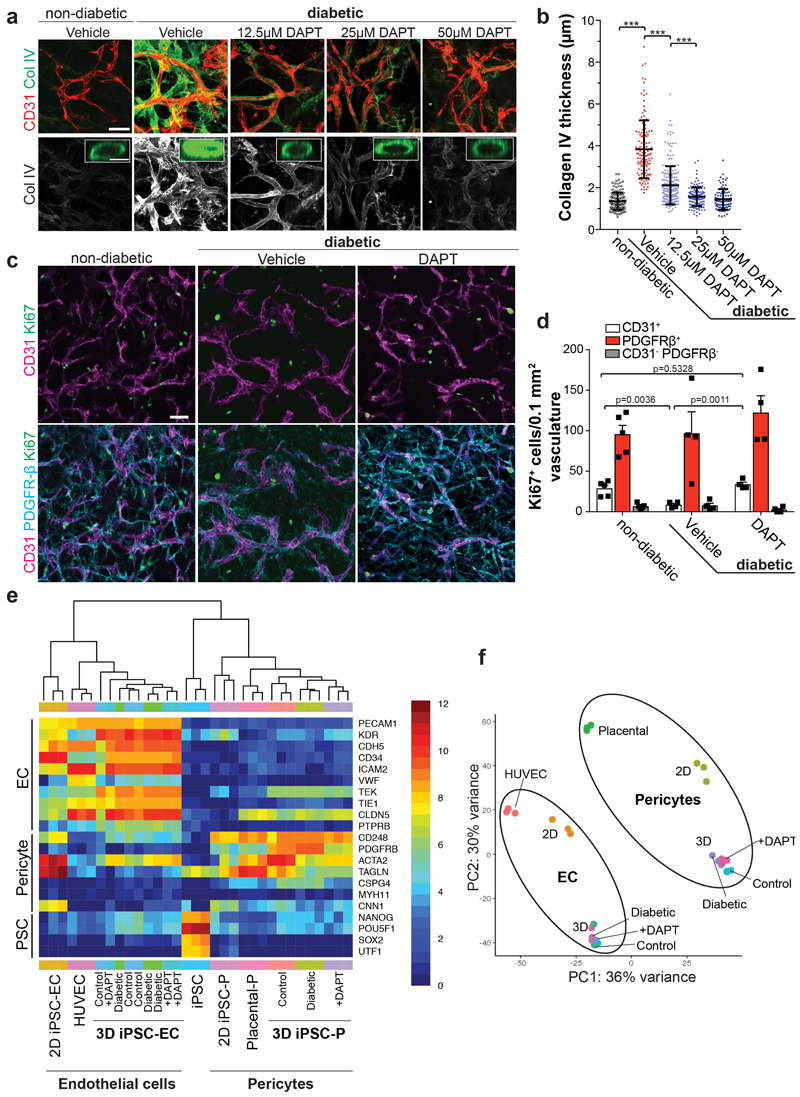
We next tested the effects of multiple anti-diabetic drugs29. None of these drugs had any effect on the diabetic medium-induced basement membrane thickening in blood vessel organoids in vitro (Extended Data Fig. 7e,f). We blocked signaling pathways reported to be involved in diabetic vascular complications5. Only the γ-secretase inhibitor DAPT significantly abrogated expansion of collagen IV; treatment of diabetic vascular organoids with DAPT restored endothelial cell proliferation (Fig. 3a,b; Extended Data Fig. 8a-d). Transcriptional profiling revealed that DAPT treated cells maintained their specific cell identity (Extended Data Fig. 8e,f). In vivo DAPT treatment markedly abrogated vascular basement membrane thickening in diabetic mice (Fig. 3c-g,j, Extended Data Fig. 9a,b). Importantly, human blood vessels became leaky in diabetic mice, providing direct evidence that the morphological changes are also associated with impaired blood vessel functions; excessive blood vessel leakiness was rescued by DAPT treatment (Fig. 3g,h). Moreover, in vivo DAPT treatment rescued the loss of CD31+ human blood vessels in diabetic mice (Fig. 3i,j).
Figure 3. Inhibition of γ-secretase abrogates diabetic microvasculopathy of human blood vessel organoids.
a, Representative images of basement membranes in diabetic blood vessels (NC8) treated with small molecule inhibitors of various signaling pathways. Insets show confocal cross-sections of individual vessels surrounded by collagen type IV (Col IV). Experiments were repeated independently n=3 times with similar results. b, The thickness of the Col IV+ coat of individual vessels was measured in optical cross-sections. Non-diabetic n=171, Vehicle n=172, CHIR99021 n=110, Goe 6976 n=156, MK2206 n=165, NAC n=193, QNZ n=147, SB431542 n=151, SB203580 n=148, SCH772984 n=96, SP600125 n=183, Y27632 n=122, DAPT n=196 individal lumina were analysed from 3 independent biological replicates with equal sample size. Mean ± S.D.*** p<0.0001 (One-way ANOVA). c, Schematic of vascular organoid transplantion (H9) and treatment of mice. d, Basement membrane thickening (Col IV) around human blood vessels (hCD31) is greatly prevented by DAPT treatment. Experiments were repeated independently on n = 3 biological samples, with similar results. e, Col IV thickness of individual human blood vessels (hCD31+) in non-diabetic and STZ-induced diabetic mice ± DAPT treatment. Non-diabetic n=132, Vehicle n=131, DAPT n=271. Mean ± SD. *** p<0.0001 (One-way ANOVA). f, Means ± SD of Col IV thickness of human blood vessels (hCD31+) from individual transplants. Non-diabetic n=3, Vehicle, DAPT n=5. (One-way ANOVA). g, Vascular permeability assessed by i.v. injection of FITC-Dextran and co-staining with hCD31 to visualize the human vasculature. Note the diffuse FITC signal in the diabetic mice (Vehicle) which indicates vessel leakage. Experiments were repeated independently on n = 3 biological samples, with similar results. h, Quantification of vessel leakage determined by FITC-Dextran extravasation. Mean ± S.E.M. n= (non-diabetic=3, diabetic + Vehicle control=7, diabetic + DAPT =5) mice. (One-way ANOVA). i, Quantification of human blood vessel density in transplanted vascular organoids. Mean ± S.E.M. n= (non-diabetic=3, diabetic + Vehicle=5, diabetic + DAPT=4) mice. *** Non-diabetic vs Vehicle p=0.0002, Vehicle vs DAPT p=0.0001 (One-way ANOVA). j, Representative images of human CD31+ blood vessel density. Experiments were repeated independently on n = 3 biological samples, with similar results. Scale bars, a=20μm, a(insert)=5μm, c,f,i=50μm.
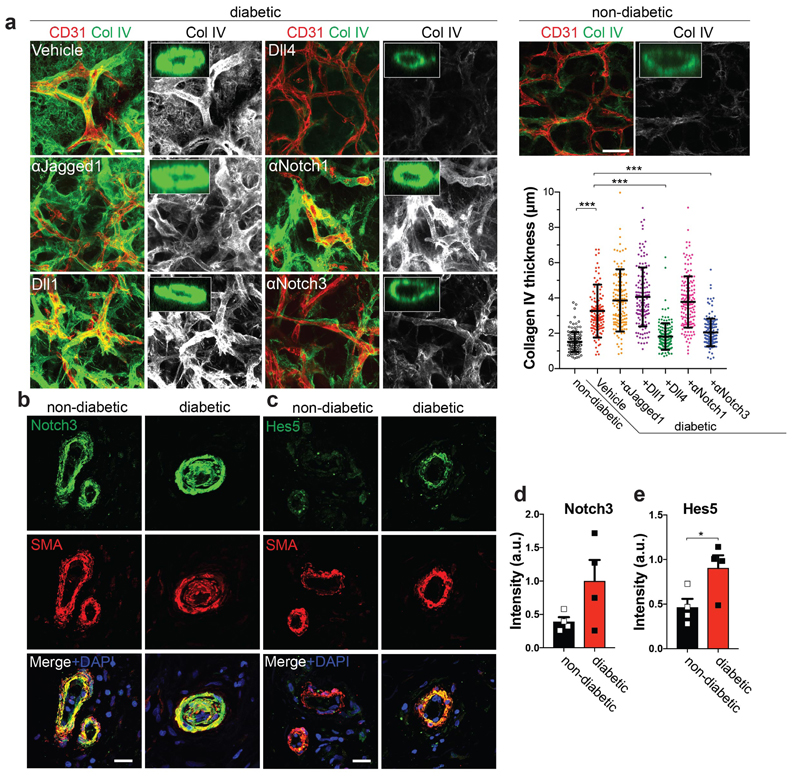
To identify the DAPT target, we blocked the Notch ligands Jagged1, Dll1, and Dll4, as well as Notch1 and Notch3, all of which are prominently expressed in blood vessels. Blockade of Dll4 and Notch3 significantly rescued from vascular basement membrane thickening (Fig. 4a). Importantly, Dll4 and Notch3 mutant blood vessels, generated from CRISPR/Cas9 engineered iPS cells, exhibited markedly reduced expansion of the basement membrane as compared to control organoids (Extended Data Fig. 9c-i). In non-diabetic and diabetic vascular organoids Notch3 expression was mainly detected in pericytes (Extended Data Fig. 10a,b). In transplanted human vasculature, grown in mice, Notch3 and its downstream targets Hes5 and Hey1 also localized to SMA positive pericytes (Extended Data Fig. 10c-h). In diabetic mice, Hes5 expression was increased in pericytes of the transplanted human blood vessels (Extended Data Fig. 10e,f). Similar to our vascular organoid transplantations, in dermal blood vessels from T2D patients and healthy individuals Notch3 and Hes5 also primarily localized to pericytes; Hes5 expression in pericytes was increased in dermal capillaries of T2D patients (Fig. 4b,c). Finally, pilot experiments showed that in vivo Notch3 blockage can alleviate the basement membrane changes of human blood vessels in diabetic mice (Extended Data Fig. 10i).
Figure 4. Identification of Dll4-Notch3 as driver for diabetic vascular basement membrane thickening.
a, Representative images of Col IV in diabetic blood vessel organoids (NC8), treated with antibodies against Jagged-1, Notch1, Notch3, or recombinant Dll1 and Dll4. The thickness of the Col IV+ coat of vessels was measured in optical cross-sections. Non-diabetic n=132, Vehicle n=139, α-Jagged1 n=141, Dll1 n=132, Dll4 n=153, α-Notch1 n=156, α-Notch3 n=156 lumina were analysed from 3 independent biological replicates with equal sample size. Mean ± SD. *** p<0.0001 (One-way ANOVA). b, Dermal blood vessels of T2D patients (diabetic) and healthy controls (non-diabetic) were stained for Notch3 and SMA. c, Hes5 and SMA were co-stained in dermal sections of T2D patients (diabetic) and non-diabetic controls. Note the strong Hes5 signal in pericytes (SMA) of diabetic patients. d,e, Quantification of Notch3 and Hes5 expression data from c and d. Mean ± S.E.M of n = (non-diabetic =4, diabetic=4) independent patients. * p=0.043 two-tailed student t-test. Scale bars a=50μm, b,c=20μm.
Here we report self-organizing 3D human blood vessel organoids from iPSCs and ESCs that exhibit morphological, functional, and molecular features of human microvasculature. In vivo perfused human vascular organoids specify into arterioles, capillaries and venules, a system that can be utilized to model structural and functional hallmarks of diabetic microvasculopathy. The γ-secretase target Notch3 and its ligand Dll4 were identified as key mediators of basement membrane thickening in diabetic organoids and in vivo treatment of diabetic mice carrying human blood vessels with DAPT as well as Notch3 inhibition markedly alleviated microvascular pathologies. Our data also indicate that intricate endothelial/pericyte interactions are required for diabetic vascular basement membrane thickening although we cannot exclude a contribution of MSCs. Importantly, we find induction of the Notch target Hes5 in pericytes of human blood vessels grown in diabetic mice as well as human dermal capillaries from T2D patients.
Blood vessels contribute to the development of essentially all organ systems and have critical roles in multiple diseases ranging from strokes to heart attacks or cancer30. In particular, major diabetic complications are the consequence of blood vessel pathologies such as reduced capillary densities and thickening of the basement membrane, resulting in insufficient tissue oxygenation, impaired cell trafficking, or vessel leakage2–4. Our blood vessel organoids and chimeric human blood vessels in vivo could be used to identify pathways and develop novel drugs that alleviate microvascular changes in diabetes.
Methods
Human stem cells and differentiation into vascular organoids
All experiments presented were done in either the human iPS cell line NC8, in house reprogrammed iPSC cell lines (iPSC#2, iPSC#3) (see Supplementary information for cell line characterization), or the human embryonic stem cell (ESC) line H9 31. For the ubiquitous expression of dTomato, a CAG-dTomato construct modified from CAG-eGFp32 was inserted into the AAVS1 locus of feeder-free H9 hESCs as done previously33. For ubiquitous BFP labeling of H9-cells, a reporter construct was inserted into the safe-harbor AAVS1 locus as done previously with TALEN technology using the AAVS1 SA-2A-Puro donor vector (gift from R. Jaenisch, The Whitehead Institute for Biomedical Research, Cambridge, Massachusetts, USA; Department of Biology, Massachusetts Institute of Technology, Cambridge, Massachusetts, USA) as a template. A modified donor was created that contained a CAG promoter driving the expression of TagBFP-2A-TagBFP instead of the SA-2A-Puro sequence. Heterozygous insertion was verified by PCR.
All stem cells were cultured under chemically defined, feeder-free conditions as previously described34. For differentiation, H9 ESCs or iPS cells were disaggregated using 0.5mM EDTA for 2min and subsequently incubated with 0.1% Stempro Accutase (Life Technologies) for 3min. 2x10⁵ cells were resuspended in differentiation media (DMEM:F12 medium, 20% KOSR, Glutamax, NEAA; all from Gibco) including 50μM Y-27632 (Calbiochem) and plated into one well of an ultra-low attachment surface 6 well plate (Corning) for cell aggregation. Cell aggregates were treated on day 3 with 12μM CHIR99021 (Tocris) and on days 5, 7 and 9 BMP4 (30ng/mL, Stemcell Tech.), VEGF-A (30ng/mL, Peprotech), and FGF-2 (30ng/mL, Miltenyi) were added. On day 11, cells were switched to media containing VEGF-A (30ng/mL), FGF-2 (30ng/mL) and SB43152 (10μM) to increase the endothelial yield and suppress excessive pericyte differentiation15. The resulting cell aggregates were embedded on day 13 in Matrigel:Collagen I (1:1) gels and overlaid with differentiation media containing 100ng/mL VEGF-A and 100ng/ml FGF-2. This differentiation medium was changed every 2nd to 3rd day. Around day 18 vascular networks were established and either directly analysed or networks from individual cell aggregates were extracted from gels and further cultured in 96 well low attachment plates (Sumilon, PrimeSurface 96U). These vascular networks self-assembled into vascular organoids and could be cultured for up to 3 months.
Reprogramming and characterization of human iPSCs
Human dermal fibroblasts (ATCC) and blood samples were reprogrammed as previously described35. To check chromosomal integrity, multiplex-fluorescence in situ hybridization (M-FISH) was performed as described previously35. For Genotyping, sample preparation was performed according to Infinium HTS Protocol Guide as recommended by Illumina Inc. The genotyping was performed using the Illumina Infinium PsychArray-24 BeadChip scanned with the Illumina iScan systems according to manufacturer’s instruction. Genotypes were called using Illumina GenomeStudio (Illumina, San Diego, CA, USA) with Genotyping software (Module 2.0.1), excluding samples with call rate <0.995. For analysis we applied the default settings by Illumina, the InfiniumPsychArray-24v1-1_A1 manifest and Infinium PsychArray-24v1-1_A1_ClusterFile cluster files. The CNV analysis and plotting were performed by using the bcftools cnv.
Immunocytochemistry
Vascular networks in Collagen I:Matrigel gels were fixed for 20min and free floating vascular organoids fixed for 1h with 4% PFA at room temperature (RT) and blocked with 3% FBS, 1% BSA, 0.5% Triton, and 0.5% Tween for 2h at RT on a shaker. Of note, vascular organoids are more stable than the initially formed vascular networks in 3D gels and therefore could be used for standard immunohistochemistry procedures. Primary antibodies were diluted 1:100-1:200 in blocking buffer and incubated over night at 4°C. The following antibodies and reagents were used in these study: anti-human CD31 (hCD31, DAKO, M082329), anti-ICAM-1 (Sigma, HPA002126), anti-PDGFR-β (CST, 3169S; R&D systems AF385), anti-SMA (Sigma, A2547; Abcam, ab5694), anti-Calponin (Abcam, AB46794, DAKO), anti-Collagen Type IV (Merck AB769), anti-Laminin (Merck, 19012), anti-MYH11 (Sigma HPA014539), anti-Fibronectin (Sigma F3648), anti-Perlecan (ThermoFisher 13-4400), anti-von Willebrand factor (DAKO, A008229), anti-Notch3 (Abcam, ab23426), anti-Dll4 (Abcam, ab183532) and Rhodamine labeled Ulex europaeus agglutinin I (UEA-I) (Vector labs, RL-1062). After 3x 10min washes in PBS-T (0.05%Tween) samples were incubated with the corresponding secondary antibodies from Life Technologies: Alexa Fluor 555 donkey-anti-mouse (A31570), Alexa Fluor 647 donkey-anti-rabbit (A31573), Alexa Fluor 488 donkey-anti-goat (A11055), Alexa Fluor 488 donkey-anti-sheep (A11015) at 1:250 in blocking buffer for 2h at room temperature. After 3x 20min washes in TBST, samples were counterstained with DAPI, mounted (DAKO S302380), dried overnight and imaged subsequently with a Zeiss 780 Laser Scanning Microscope. For the ac-LDL uptake assay, vascular organoids were incubated for 6h with 10μg/mL Dil AcLDL (Thermofisher, L3484) and then washed several times in media before imaging.
Vascular organoid transplantation
Vascular organoids were transplanted under the kidney capsule of 12-15 weeks old immunodeficient NSG mice36. All animal experiments were performed under ethical animal license protocols from the Austrian Ministry of Science, Research, and Economics (BMWFW). Mice were imaged using MRI to monitor the transplant over time. To test perfusion/leakage of the human blood vessel implants, mice were injected i.v. with 70.000MW anionic, lysine fixable FITC-Dextran (1.25mg/mouse, Invitrogen D1822). To additionally test perfusion, anti-human CD31-Alexa 647 (2μg/mouse, BD 558094) was i.v. injected. Excised transplants were fixed with 4% PFA for 2h at RT and stained as whole mounts as described for the vascular organoids above or processed for immunohistochemistry following paraffin embedding. To distinguish between the endogenous mouse and transplanted human vasculature, specific anti-human CD31 antibodies (DAKO, M082329 and R&D AF806) were tested on mouse kidney sections and mouse endothelial cells in culture, which we confirmed did not show any detectable cross-reactivity in our staining protocol. Further, we confirmed the origin of human blood vessels in NSG mice using H9-RFP and H9-BFP reporter lines and by visualizing the murine blood vessels with an anti-mouse CD31 antibody (Abcam, AB56299).
Further anti-human VE-Cadherin antibody (Santa Cruz sc-9989), anti-human vWF (DAKO, A0082) anti-human CD34 (Invitrogen, 07-3403) specifically stained human endothelium on histological sections. To stain mural cells, antibodies against SMA (Sigma, A2547; Abcam, ab5694), Calponin-1 (DAKO, M3556), PDGFR-β (R&D systems AF385), SM22 (Abcam, ab14106) and NG2 (Abcam, ab129051) were used. To investigate Notch signaling antibodies against Notch3 (Abcam ab23426), Hes5 (Merck, AB5708) and Hey1 (Invitrogen PA5-40553) were used and fluorescent signals of were measured of SMA+ segmented pericytes using FIJI.For arterious and venous vessel stainnings, frozen sections were stained with anti-EphrinB2 (Merck, MABN482), anti-Dll4 (Abcam, ab 183532) anti-EphB4 (Invitrogen 371800) and anti-CoupTF2 (Abcam, ab41859). Samples were imaged with a Zeiss 780 Laser Scanning Microscope.
MRI imaging
MRI was performed on a 15.2 T Bruker system (Bruker BioSpec, Ettlingen Germany) with a 35mm quadrature birdcage coil. Before imaging, a tail line was inserted for delivery of contrast agent (30-gauge needle with silicon tubing). All animals (N=3) were anaesthetised with isoflurane (4% induction, maintenance with 1.5%). During imaging, respiration was monitored, and isoflurane levels adjusted if breathing was <50 or >80 breaths per minute. Mice were kept warm with water heated to 37°C circulated using a water pump. For anatomical localization and visualization of the implant a multi-slice multi-echo (MSME) spin echo sequence was used (repetition time (TR)/echo time (TE) = 3000/5.8–81.18 ms, 14 echoes, 117 μm2 in-plane resolution, 0.5 mm slice thickness, number of experiments [NEX] = 1). A pre-bolus injection of 0.05 ml of 0.01 mol/l gadolinium-based contrast agent (Magnevist, Berlex) was injected to correct for contrast agent leakage. Dynamic susceptibility contrast (DSC) perfusion MRI was collected using fast imaging with steady-state precession (FISP) with 500.6 ms temporal resolution (1 slice; TR/TE = 500/1.7 ms; flip-angle = 5 degrees; 468X468 μm2 in-plane resolution; 1-mm slice thickness; NEX = 2; 360 repetitions) following tail vein injection of 0.05 mL of 0.25 mol/L Magnevist. DSC data were used to calculate perfusion, relative blood volume (rBV), mean transit time (MTT), and leakage (K2). Processing was done using ImageJ (rsbweb.nih.gov/ij/), and the DSCoMAN plugin (https://dblab.duhs.duke.edu/wysiwyg/downloads/DSCoMAN_1.0.pdf). Analysis consisted of truncating the first 5 time points in the DSC-MRI time series to ensure steady-state magnetization, calculating the pre-bolus signal intensity (S 0) on a pixel-wise basis, converting the truncated DSC-MRI time series to a relaxivity-time curve , S(t) is dynamic signal intensity curve, and correcting for the gadolinium leakage (K2), as described previously37
Modeling diabetic vasculopathy in vitro
Established endothelial networks in vascular organoids were cultured in a non-diabetic control medium (17mM Glucose) or diabetic medium (75mM Glucose, in the presence of absence of human TNFα (1ng/mL, Invitrogen PHC3011) and/or IL-6 (1ng/mL, Peprotech 200-06)) for up to 3 weeks before the basement membrane was investigated by collagen type IV (Col IV) immunostaining and electron microscopy. D-mannitol (Sigma) was added to the non-diabetic medium to a final concentration of 75mM concentration as osmotic control. For basement membrane quantifications, acquired z-stacks of vascular organoids were analyzed using FIJI software38. Z-stacks were re-slized to generate axially sectioned side views and only Collagen IV (Col IV) coats around cross-sectioned luminal structures (as illustrated in Fig 1e) were measured in thickness. For drug treatment, organoids were exposed to diabetic medium (75mM Glucose, 1ng/mL human TNFα, and 1ng/mL IL-6) in the presence or absence of the following drugs: 2,4- Thiazolidinedione (5mM, Abcam ab144811), Metformin (5mM, Abcam ab120847), Acarbose (80μg/mL, Sigma A8980), Nateglindine (100μM, Sigma N3538), Diphenyleneiodonium (10μM), Glimepiride (30nM, Sigma G2295), Pioglitazone (10μM, Sigma E6910). The following small molecule inhibitors were used: N-Acetyl-L-cysteine (500μM, Sigma, A7250), CHIR99021 (10μM, Tocris 4423), Goe6976 (100nM, Merck US1365250), MK2206 (10μM, EubioS1078), QNZ (10μM, Eubio S4902), SB203580 (10μM, Eubio S1076), SCH772984 (500nM, Eubio S7101), SP600125 (10μM, Eubio S1460) Y-27632 (10μM, Calbiochem 688000), DAPT (25μM, Sigma D5942), and SB431542 (10μM, Abcam ab120163). For blocking Notch receptors/ligands anti-Notch1 (Biolegend 352104, 10μg/mL), anti-Notch3 (R&D AF1559, 5μg/mL), anti-Jagged1 (R&D MAB12771, 5μg/mL) blocking antibodies were used. To block Delta-like ligands, the soluble extracellular domain of rhDll1 (R&D 1818 DL, 500ng/mL), or rhDll4 (R&D, 1506 D4, 200ng/mL) were added to the media as previously described39,40. To test extracellular matrix production upon diabetic conditions in mono-cultures, endothelial cells and vascular smooth muscle cells were differentiated according to previous protocols13 and cultured in non-diabetic or diabetic media for 2 weeks and stained for Col IV and Fibronectin. Fluorescence intensity of individual cells was measured using FIJI software38. Immortalized human dermal endothelial cells (G1S1) have been described previously41
FACS analysis of vascular organoids
Non-diabetic and diabetic vascular organoids were mechanically disrupted and disaggregated using 3U/mL Dispase (Gibco), 2U/mL Liberase (Roche) and 100U DNAse (Stemcell Tech) in PBS for 20-min at 37°C while rotating. Subsequently, single cells were stained with the following antibodies: anti-CD31 (BD, 558094), anti-VE-Cadherin (BD, 565672), anti-PDGFR-β (BD, 558821), anti-CD90 (Biolegend, 328117), anti-CD44 (BD, 550989) anti-CD45 (ebioscience, 11-0459-41), and anti-CD73 (BD 742633, BD 561254) . DAPI staining was used to exclude dead cells. A BD FACS Aria III was used for cell sorting and a BD FACS LSR Fortessa II for cell analysis.
Genome editing using CRISPR/Cas9
A mammalian expression vector expressing Cas9 from S. pyogenes with a 2A-Puro cassette42 (Addgene Plasmid: #62988;) was cut with BbSI (Thermo Fisher ER1011) shortly after the U6 promoter. Subsequently the plasmid was re-ligated introducing sgRNAs for either Neurogenic locus notch homolog protein 3 (Notch3) or Delta-like protein 4 (Dll4). The following primers were used for sgRNA annealing: Notch3: forward, caccgGCCACTATGTGAGAACCCCG; reverse, aaacCGGGGTTCTCACATAGTGGCc; Dll4: forward, caccgCAGGAGTTCATCAACGAGCG; reverse, aaacCGCTCGTTGATGAACTCCTGc. sgRNA plasmids were verified by Sanger sequencing and used for electroporation of iPSCs (NC8) with the 4D-Nucleofector System (Lonza). 2µg plasmid DNA were transfected using the P3 Primary Cell 4D-Nucleofector Kit. Transfected NC8 cells were seeded on Matrigel coated 6-well plates in Essential 8 Media (Gibco) containing 50µM Y27632 (Calbiochem) and cultured for 24 hours before Puromycin treatment (0.2µg/ml) for 48 hours. Remaining cells were cultivated until colony formation could be observed and single colonies were further expanded for genotyping with Sanger sequencing. Knock-out cell lines were verified by Western Blot or immunofluorescence staining.
Modeling diabetic vasculopathy in human vascular organoids in vivo
Immunodeficient NSG mice carrying human vascular organoid transplants were daily i.p. injected with 40mg/kg Streptozotocin (STZ) (Merck, 572201) for 5 consecutive days. Every day, STZ was freshly dissolved in citrate buffer (pH4.6) and immediately used. Diabetes was confirmed (blood glucose >300mg/dL) by measuring non-fasting glucose using the OneTouch UltraEasy system (Lifetouch, AW 06637502C). DAPT (Selleckchem S2215) was dissolved in ethanol and injected with 90% cornoil for 5 consecutive days at 5mg/kg with 2 days of no treatment per week. Anti-Notch3 blocking antibodies (R&D AF1559) were injected 3 time/week at 1mg/kg. For quantifying vessel leakage, the FITC-Dextran+ area was measured and normalized to the area of perfused human blood vessels (hCD31+) using the FIJI software. This ratio was then further normalized to control non-diabetic mice. Permeability of long-term DAPT treated vessels were measured after 2 days of treatment stop to avoid measuring acute effects of DAPT on vessel permeability.
Next Generation Sequencing and qRT–PCR analysis
The CD31 or PDGFRβ positive, DAPI negative cells were directly sorted into Trizol LS buffer (Invitrogen and processed further to RNA isolation) or sorted into lysis buffer for subsequent library preparation using SMART-Seq2. For RNA Seq mRNA was enriched by poly-A enrichment (NEB) and sequenced on a Illumnia HiSeq2500. For qRT-PCR analysis, total RNA was extracted from whole vascular organoids using Trizol (Invitrogen) and cDNA was synthesized using the iscript cDNA synthesis kit (Biorad), performed with a SYBR Green master mix (Thermo) on a Biorad CFX real time PCR machine. All data were first normalized to housekeeper genes as indicated in the respective figure legend and then compared to the non-diabetic control samples. The following primers were used:
Col4a1-FWD: TGCTGTTGAAAGGTGAAAGAG
Col4a1-REV: CTTGGTGGCGAAGTCTCC
Col4a2-FWD: ACAGCAAGGCAACAGAGG
Col4a2-REV: GAGTAGGCAGGTAGTCCAG
FN1-FWD: ACACAAGGAAATAAGCAAATG
FN1-REV: TGGTCGGCATCATAGTTC
TUBB-FWD: CCAGATCGGTGCCAAGTTCT
TUBB-REV: GTTACCTGCCCCAGACTGAC
NOTCH3-FWD: TGGCGACCTCACTTACGACT
NOTCH3-REV: CACTGGCAGTTATAGGTGTTGAC
Bioinformatic analysis
RNA-seq reads were aligned to the human genome (GRCh38/hg38) using Tophat v2.0.10 and bowtie2/2.1.0, gene- and transcript-level abundance estimation in TPM, FPKM and expected counts was performed with RSEM v1.2.25, aligned reads were counted with HTSeq v0.6.1p1 and differential expression analysis was carried out using DESeq2 v1.10.1, with an FDR threshold of 0.05. Enrichr43,44 was used to identify GO terms of de-regulated genes.
Skin samples from type II diabetes and normo-glycemic control patients
Surgical samples of human skin were taken from T2D and non-diabetic patients. Non-necrotic, healthy skin was taken from leg amputates. Leg amputations of T2D patients were necessary because of diabetic foot syndrome. Leg amputations of non-diabetic patients were performed as a consequence of accidents, venous ulcerations or other vascular diseases not related to T2D. The collection of skin samples during the study “Molecular Mechanisms of Human Diabetic Microangiopathy” was approved by the ethics committee of the Medical University of Vienna (http://ethikkommission.meduniwien.ac.at/) and was covered by votes number 449/2001 and 81/2008. All included patients gave their informed consent. Of note, we included dermis that was isolated at the maximal possible distance of any ulcers or necrosis of the leg amputates. The details of patient collectives are shown in Supplementary Table 1. For immunohistochemistry, human skin material was either cryo-fixed in Geltol and stored at -80°C, or embedded in paraffin after 4% paraformaldehyde fixation. 2-5µm sections were cut and used for subsequent immunofluorescence or immunohistochemical stainings. Paraffin sections were dewaxed, hydrated, and heat induced antigen retrieval was performed. Antigenicity was retrieved by microwaving (3x5 minutes, 620W) or by heating the sections in an autoclave (60 minutes) in 10 mM citrate buffer (pH 6.0). Cryo-sections were stored at -20°C, thawed and dried at time of use and fixed in ice-cold acetone for 20 minutes. This was followed by incubation with primary antibodies and visualized by a biotin-streptavidin–horseradish peroxidase method, or by using fluorescently labelled secondary antibodies. To investigate Notch signaling staining for Notch3 and Hes5 were performed as described above and fluorescent signals were measured of SMA+ segmented pericytes. The Notch3 and Hes5 signals were then normalized to the SMA signal using FIJI software.
Human patient-derived endothelial cell preparations
Four T2D and six non-diabetic patients were analyzed. For ex vivo preparations of blood endothelial cells (BEC) a mechanical and enzymatic micropreparation protocol was used, including the use of Dispase I (Roche Inc., # 210455) as previously described45. The resulting single cell suspensions were blocked with 1 x PBS-1% FCS and incubated with anti-CD31, anti-CD45 and anti-podoplanin antibodies in a three-step procedure with intervening washing steps. For antibodies see section above. Subsequently, cells were subjected to cell sorting using a FACStar Plus (Becton Dickinson). Total CD31+ podoplanin- endothelial cells were separated, re-analyzed, twice pelleted (200g), lysed in RLT buffer (Qiagen; # 74104) and further processed for RNAseq.
Electron Microscopy
Vessel organoids were fixed using 2.5% glutaraldehyde in 0.1M sodium phosphate buffer, pH 7.2. for 1h at room temperature. For electron microscopy of dermal blood vessels from diabetic and non-diabetic leg amputates were fixed in 4% PFA and 0.1% glutaraldehyde and embedded in Lowicryl-K4M. Samples were then rinsed with the same buffer, post-fixed in 1% osmium tetroxide in ddH2O, dehydrated in a graded series of acetone and embedded in Agar 100 resin. 70-nm sections were cut and post-stained with 2% uranyl acetate and Reynolds lead citrate. Sections were examined with an FEI Morgagni 268D (FEI, Eindhoven, The Netherlands) operated at 80 kV. Images were acquired using an 11 megapixel Morada CCD camera (Olympus-SIS).
Rodent models of diabetes
Rodent models used in this study and according references are listed in Supplementary Table 2. Controls were either age matched WT animals or untreated strains as indicated in the Table. Sections of paraffin embedded skin samples of all rodent models were stained for CD31 and Collagen IV.
Statistics
Statistical analyses were performed using GraphPad Prism. All statistical tests used are described in the figure legends. P < 0.05 was accepted as statistically significant.
Extended Data
Extended Data Figure 1. Phenotypical characterization of vascular organoids.
a, Calponin1 positive pericytes are tightly associated with endothelial networks (CD31). Collagen IV (Col IV) staining is used to visualize the basement membrane. b, Formation of a basement membrane is shown by abluminal Col IV deposition. a,b, Experiments were repeated independently n = 10 times with similar results.c, Co-culture of differentiated (NC8) endothelial cells and pericytes in a Collagen 1 / Matrigel matrix. The formed endothelial networks (CD31+), showed only weak interaction with pericytes (PDGFRβ+) and were not enveloped by a Col IV+ basement membrane. Experiments were repeated independently n = 3 times with similar results. d, Successful generation of vascular networks from embryonic stem cells (H9) and two independent iPS cell lines. Note how PDGFR-β+ pericytes are in close proximity to the endothelial tubes (CD31+) and the formation of a Col IV+ basement membrane. Experiments were repeated independently n = 3 times with similar results. e, Vascular organoid generation from H9 cells. Endothelial networks are shown by CD31 staining and pericytes are shown by PDGFRβ. Experiments were repeated independently n = 10 times with similar results. f, Representative electron microcopy of vascular organoids (NC8). Note the generation of lumenized, continuous capillary-like structures with the appearance of tight junctions (white arrowheads) and a basement membrane (black arrowheads). L, lumen; E, endothelial cell. Experiments were repeated independently n = 3 times with similar results. g, Tip cells (arrowheads) identified by CD31+ filopodia mark newly forming vessels. The Col IV+ basement membrane is absent at the site of active angiogenesis. Experiments were repeated independently n = 10 times with similar results. a-g Scale bars: a,b,d,e(left panel)=50μm, c(left panel)=500μm, c(right panel)=100μm), ,e(right panel)=10μm, f=2μm, g=20μm.
Extended Data Figure 2. Cellular, molecular and functional characterization of vascular organoids.
a, FACS analysis to determine different cell populations present in vascular organoids (NC8). Endothelial cells were defined as CD31+ VE-Cadherin+, pericytes as PDGFRβ+, mesenchymal stem-like cells (MSCs) by CD90+CD73+CD44+ and hematopoietic cells by CD45+. Bar graphs in the right panels indicate the relative populations of endothelial cells (ECs), pericytes, mesenchymal stem-like cells (MSCs) and hematopoietic cells. Graph represents mean ± S.D from n=3 independent experiments. b, Heatmap of prototypic marker genes for pluripotent stem cells (PSC), pericytes and endothelial cells (ECs). Rows represent genes (log2 TPM+1) and columns are samples. FACS sorted CD31+ endothelial cells (EC) and PDGFRβ+ pericytes (P) from vascular organoids (3D iPSC), from 2D differentiated monocultures (2D iPSC) or primary 2D monocultures (HUVEC, placental pericytes (P)) were analyzed by RNAseq and compared to the parental iPSC line (NC8). Hierarchical clustering of samples demonstrates similar marker gene expression of organoid cells (3D) and primary human cells (HUVEC, Placental-P). n=3 biologically independent samples per cell type were analaysed. c, Principal component analysis (PCA) was performed on samples from b and separates parental iPSC (NC8) from differentiated vascular organoid cells (3D). d, Endothelial cells (CD31) in vascular organoids (NC8) stain also positive for the lectin Ulex europaeus agglutinin 1 (UEA-1). Pericytes are visualized by PDGFRβ staining. Experiments were repeated independently n = 10 times with similar results. e, FACS isolated endothelial cells (CD31+) from vascular organoids take up acetylated low-density lipoprotein (ac-LDL). Experiments were repeated independently n = 3 times with similar results. f, von Willebrand Factor (vWF) expression in endothelial cells (CD31+) from vascular organoids (NC8). Col IV staining is also shown to outline the basement membrane. Right panels show electron microscopy, revealing the appearance of Weibel Palade bodies (white arrowheads). Experiments were repeated independently n = 3times with similar results. g, TNFα-mediated activation of vascular organoids (NC8) revealed by the induction of ICAM-1 expression in endothelial cells (CD31). ICAM-1 induction was determined 24 hours after addition of TNFα (100ng/mL). Experiments were repeated independently n = 3 times with similar results. DAPI was used to counterstain nuclei. Scale bars d,e,f(left panel),g=50μm, f(upper right panel)=500nm, f(lower right panel)=100nm
Extended Data Figure 3. Analysis of vascular organoids transplanted into mice.
a, Infusion of the human specific anti-CD31 antibody (i.v.) to label perfused human blood vessels (NC8) transplanted into immunodeficient NSG mice. Murine vessels are visualized by a mouse-specific anti-CD31 antibody (mCD31). b, Functional human vasculature (detected by human-specific anti-CD31 immunostaining, hCD31, red) in mice revealed by FITC-Dextran perfusion (green). a,b, Experiments were repeated independently on n = 3 biological samples, with similar results. c, Representative axial T2-weighted image, blood flow (perfusion), relative blood volume (rBV), mean transit time (MTT) and leakage (K2) measured by MRI. The axial plane was chosen so that both kidneys (outlined in white) and the implant (outlined in red) are visible. The analysed muscle tissue is outlined in green. Quantitative values (mean +/- SD) for perfusion, rBV, MTT and K2 are given in the table. n = 3 mice analysed. d, Representative low magnification image of a transplanted vascular organoid stained for E-Cadherin and human CD31. e, Arteriole (A) and venule (V) phenotypes appearing within the human vascular organoid transplants (NC8). Representative H&E stained histological sections are shown. f, Generation of human arterioles (A) shown by staining for human specific CD31 (endothelial cells), tightly covered with vascular smooth muscle cells (vSMC) detected by SMA, Calponin-1, and human-specific MYH11 immunostaining. As a control, endothelial cells of murine kidney arterioles do not cross react with the human-specific CD31 antibody (right top panel). Samples were also stained with DAPI to determine nuclei. g,h, Arterioles of human origin (hCD31+) express arterial markers EphrinB2 and Dll4. i,j, Human venous structures (hCD31+) show expression of the venous markers EphB4 and CoupTF2. k, BFP-tagged vascular organoids (H9), transplanted into mice, co-stained with human-specific CD31 (hCD31) antibody, revealing human identity. A representative image from n=5 mice is shown. d-k, Experiments were repeated independently on n = 3 biological samples, with similar results. DAPI was used to counterstain nuclei. Scale bars: a=200μm, b,k=100μm, d=500μm e,f,g,h,i,j=20μm, f,g=50μm.
Extended Data Figure 4. Basement membrane changes in diabetic vascular organoids.
a, High glucose/IL6/TNFα (diabetic) treatment leads to a marked expansion of the Col IV-positive basement membrane lining the human capillaries (NC8). Calponin-1 immunostaining marks pericytes. Insets indicate confocal cross-sections of vessel lumina. Right panels show 3D reconstructions of basement membrane thickening directly coating the CD31+ endothelial tubes. b, Vascular organoids derived from H9 cells display basement membrane thickening (Col IV) upon stimulation with diabetic media as compared to cultures in non-diabetic medium. Endothelial cells were visualized using anti-CD31 immunostaining and pericytes by staining with Calponin-1. c, Basement membrane thickening (Col IV) in vascular organoids from a second iPSC line (IPSC#2) upon cultivation in diabetic media. Endothelial cells were visualized using anti-CD31 immunostaining and pericytes were marked with PDGFRβ. a-c, Experiments were repeated independently n = 5 times with similar results. d,e,f, Increased deposition of the basement membrane components d, fibronectin e, laminin and f, perlecan in diabetic versus non-diabetic vascular organoids (NC8). Endothelial cells were visualized using anti-CD31 immunostaining. Experiments were repeated independently n = 3 times with similar results. g, RT-qPCR of FACS isolated endothelial cells (CD31+), pericytes (PDGFRβ+) and the remaining negative cells (CD31-PDGFRβ-) from vascular organoids cultured for two days in diabetic media or non-diabetic media. Values are normalized to the endothelial (CD31+) fraction and are shown as mean ± S.E.M of 3 biological replicates with 50 organoids per experiment. P-values are indicated in the panel (two-tailed student t-test). h, Representative electron microscopy images of vascular organoids (NC8), cultured under diabetic and non-diabetic conditions, confirm the marked basement membrane thickening upon diabetic treatment. Note multiple layers of basement membrane in the diabetic condition (two-sided arrows) which are not observed in the control organoids (arrowheads). L, lumen; E, endothelial cell; P, pericyte. Experiments were repeated independently n = 3 times with similar results. i, Diameter of CD31 positive vessels were measured in non-diabetic and diabetic vascular organoids. Values are presented as mean ± S.D. n (non-diabetic) = 179 vessels, n (diabetic) = 151 vessels measured from 4 independent experiments. Scale bars: a=50μm a(insert),h=5μm b,c=50μm, d,e,f=100μm
Extended Data Figure 5. Mono-cultures of vascular cells in diabetic media.
a, iPSC (NC8) derived endothelial cells cultured in non-diabetic conditions, in 75mM D-glucose (hyperglycemia), 1ng/mL TNFα+ 1ng/mL IL6, or diabetic media (hyperglycemia + TNFα+IL6), were stained for CD31 and Col IV. Right panel shows quantification of Col IV intensity of individual cells endothelial cells. The data is presented as mean ± S.D. from n=3 independent experiments. p values are indicated in the panel (One-way ANOVA) b, iPSC (NC8) derived vascular smooth muscle cells (vSMCs) were cultured in the presence of normal medium, hyperglycemia, TNFα+IL6 or diabetic media (hyperglycemia + TNFα+IL6). Cultures were stained for SMA, Col IV and Fibronectin (FN). Col IV and FN intensity of individual cells was quantified. The graph represents mean ± S.D. from n=3 independent experiments. P-values are indicated in the panel (One-way ANOVA) c, G1S1 endothelial cells were cultured in non-diabetic normal media and diabetic media (hyperglycemia + TNFα+IL6) and stained for Fibronectin (FN), Laminin or Collagen IV (Col IV). Phalloidin was used to visualize the actin cytoskeleton. Experiments were repeated independently n = 3 times with similar results. d, Col4a1expression was measured by RT-qPCR from G1S1 cells cultured in non-diabetic and diabetic media for different time points, as indicated. Expression was normalized to HPRT expression. n=3 independent experiments. P-values are indicated in the panel (Two-tailed t-test) Scale bars a,b,c=100μm.
Extended Data Figure 6. Analysis of diabetic vascular organoids.
a,b FACS analysis of vascular organoids (NC8) cultured in non-diabetic or diabetic media. a, Representative FACS plots of endothelial cells (CD31+) and pericytes (PDGFRβ+) from diabetic and non-diabetic control vascular organoids. Experiments were repeated independently n = 6 times with similar results. b, Quantification of numbers of CD31+ endothelial cells, PDGFRβ+ pericytes and CD31-PDGFRβ- cells in diabetic and non-diabetic organoids. The graph represents mean ± S.E.M. of n=6 independent experiments. P-values are indicated in the panel (two-tailed student t-test). c,d, Pericyte (PDGFRβ) association with endothelial networks (CD31) in vascular organoids is shown for non-diabetic and diabetic condition in representative images. Note again in c the increase in Collagen IV (Col IV) deposition around the endothelium under diabetic conditions. Experiments were repeated independently n = 5 times with similar results. e, Transcriptome analysis of CD31+ endothelial cells (iPSC-ECs), FACS sorted from vascular organoids (NC8) cultured under diabetic (hyperglycemia/IL6/TNFα) and non-diabetic control conditions. Heat maps of differentially expressed genes and the top 5 upregulated genes (ranked by p-value) are shown for two independent organoids cultures for each condition. f, GO:biological processes of upregulated genes are shown for iPSC-ECs, FACS sorted from vascular organoids (NC8) cultured under diabetic and non-diabetic control conditions. g, GO:Molecular function terms comparing upregulated genes from CD31+ IPSC-ECs from diabetic blood vessel organoids and type II patient-derived dermal endothelial CD31+ cells (Patient-ECs) are plotted with their respective p-value. Upregulated genes in patients were derived from sorted CD31+ endothelial cells from type II diabetes patients compared to those from non-diabetic individuals. f,g, n=2 biologically independent iPSC-EC samples per group, n=4 independent patients per group were sequenced. P-values were calculated on DEGs using Enrichr software (Fisher Exact test).
Extended Data Figure 7. Diabetic vascular basement membrane in vivo and treatment of diabetic vascular organoids with common diabetic drugs.
a, Electron microscopy of transplants isolated from control normoglycemic or diabetic mice. Note the increased thickness and density of collagen fibrils (triangles) around the human vessels of the diabetic mice. L, Lumen; E, endothelial cell; P, Pericyte. Triangles indicate the basement membrane. Experiments were repeated independently on n = 4 biological samples, with similar results. b, Col IV stainining of the mouse kidney (adjacent to the human transplant) reveals no basement membrane thickening of endogenous vessels at 10 weeks after STZ induction (diabetic). Note the lack of cross reactivity of the human specific CD31 antibody with the renal mouse endothelium. Experiments were repeated independently on n = 3 biological samples, with similar results. c, Quantification of the basement membrane thickness of dermal blood capillaries in the indicated rat and mouse models of diabetes as compared to their non-diabetic control cohorts. See Supplementary Table 2 for details. Data are shown as mean values ± SD of analyzed blood vessels. ob/ob, db/db mice n=5, IRKO mice n=7, STZ mice (17 weeks) n=3, STZ mice (24 weeks) n=5, ZDF rats n=3. Age matched C57 BL/KsJ and C57 BL/Ks WT mice were used as controls. For the ZDF rat model, heterozygous rats (fa/+) were used as controls. Basement membrane thickening was determined based on morphometric analyses of Collagen IV immunostaining. d, Representative images of skin sections of various diabetic mouse models and respective controls stained for Col IV to visualize the basement membrane and CD31 to visualize endothelial cells. Experiments were repeated independently on n = 5 biological samples, with similar results. e, Human blood vessel organoids (NC8) were cultured in vitro under diabetic condition and treated with commonly prescribed diabetic drugs. The changes in vascular basement membrane deposition were anlaysed by Collagen IV (Col IV) stainings. Insets indicate confocal cross-sections of luminal vessels covered by Col IV. Experiments were repeated independently n = 3 times with similar results. f, Optical cross-sections of Collagen IV (Col IV) stainings were used to quantify basement membrane thickening. Each lumenized vessel is shown as a dot. Means are shown as centre bars ± SD. Non-diabetic n=142, Vehicle n=124, Thiazolidinedione n=156, Metformin n=137, Acarbose n=152, Glimepiride n=136, Diphenyleneiodonium n=141, Nateglindine n=152, Pioglitazone n=142 individual lumens were analyzed for each experimental condition from 3 independent biological replicates. *** p<0.0001 (One-way ANOVA). Drug doses and cultured conditions are described in the methods. Scale bars a(upper panel)=10μm, a(lower panel)=2μm b,d=50μm, e=20μm, e(insert)=10μm
Extended Data Figure 8. DAPT treatment of diabetic vascular organoids.
a, Representative images of vascular organoids cultured in diabetic media in the presence of vehicle or varying doses of the γ-secretase inhibitor DAPT. Endothelial networks are shown by CD31 and the basement membrane is visualized by Collagen IV (Col IV) staining. Experiments were repeated independently n = 3 times with similar results. b, Quantification shows Collagen IV thickness of non-diabetic n=136, Vehicle n=126, 12.5μM DAPT n=208, 25μM DAPT n=142, 50μM DAPT n=96 lumen structures (dots) from 5 organoids (NC8) per condition exposed to vehicle of different doses of DAPT. The graph represents mean ± S.D. *** p<0.0001 (One-way ANOVA). c,d, Proliferation of endothelial cells (CD31) and pericytes (PDGFRβ) in diabetic and DAPT treated vascular organoids. c, Vascular organoids treated with indicated conditions were co-stained for endothelial cells (CD31), pericytes (PDGFRβ) and Ki67 to mark proliferating cells. Experiments were repeated independently n = 3 times with similar results. d, Quantification of Ki67 positive (proliferative) endothelial cells (CD31+), pericytes (PDGFRβ+) and CD31- PDGFRβ- cells in vascular organoids under diabetic and DAPT treated conditions. The graph represents mean ± S.D of n=4 (Vehicle, DAPT), n=5 (non-diabetic) vascular organoids. P-values are indicated in the panel (One-way ANOVA). e, Heatmap of prototypic marker genes for pluripotent stem cells (PSC), pericytes and endothelial cells (ECs). Rows represent genes (log2 TPM+1) and columns are samples. FACS sorted CD31+ endothelial cells (EC) and PDGFRβ+ pericytes (P) from non-diabetic (Control), diabetic (Diabetic) or DAPT treated diabetic (+DAPT) vascular organoids (3D iPSC), from 2D differentiated monocultures (2D iPSC) or primary 2D monocultures (HUVECS, placental pericytes (P)) were analyzed by RNAseq and compared to the parental iPSC line (NC8). Hierarchical clustering of samples shows similar marker gene expression of human primary endothelial cells (HUVEC) and pericytes (Placental-P) and organoid endothelial cells and pericytes cultured under non-diabetic (Control) or diabetic conditions in the absence (Diabetic) or presence (+DAPT) of the γ-secretase inhibitor DAPT. f, Principal component analysis (PCA) was performed on samples from e. The close clustering of untreated (Control) and diabetic endothelial cells and pericytes in the absence (Diabetic) or presence of DAPT (+DAPT) shows that cells within the vascular organoids maintain their differentiated cell fate. e,f, n=3 biologically independent samples per cell type and treatment were analaysed. Scale bars a,c=50μm, a(insert)=5μm
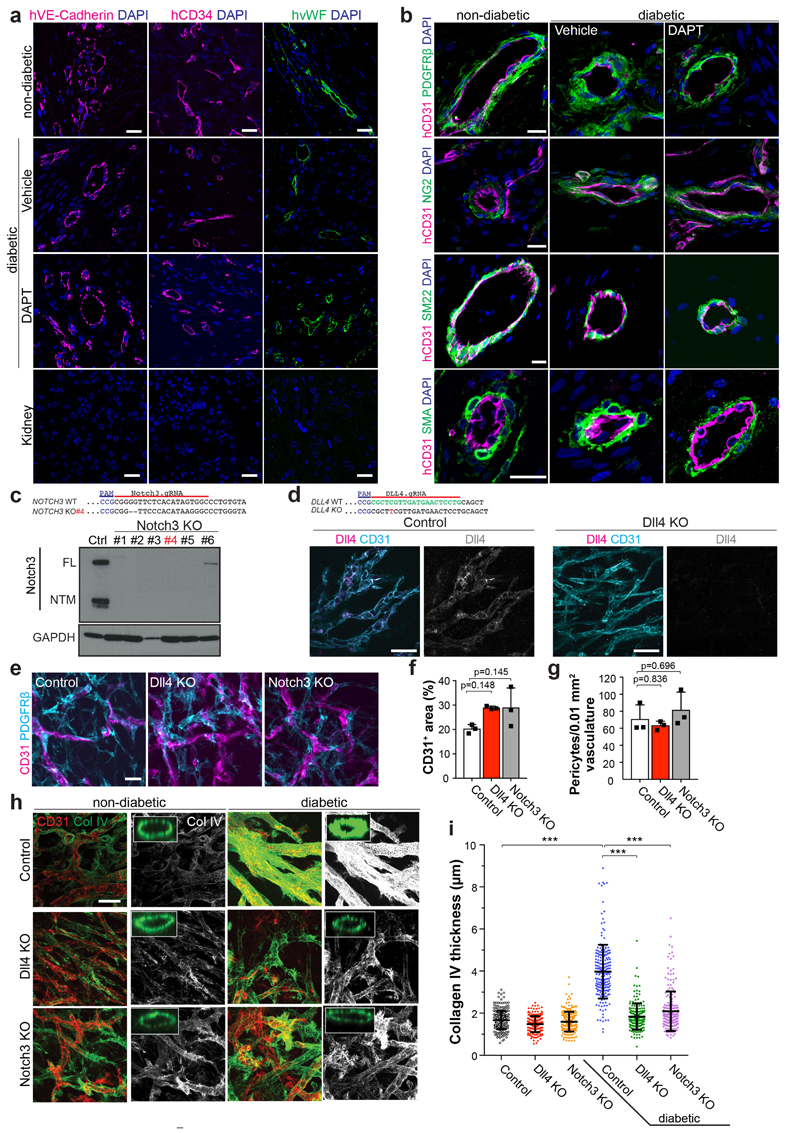
Extended Data Figure 9. DAPT treatment of vascular organoids in vivo and Dll4 and Notch3 knock out vascular organoids.
a,b, Analysis of vascular organoids transplanted into non-diabetic or diabetic STZ mice treated with vehicle or DAPT. a, Transplanted human blood vessels into diabetic STZ mice ± DAPT treatment were stained for human specific endothelial markers VE-Cadherin (hVEC), CD34 (hCD34) and vWF (hvWF). Note the absence of signal in the adjacent mouse kidney. b, Transplanted human blood vessels into diabetic STZ mice ± DAPT treatment were stained for the pericyte specific markers PDGFRβ, NG2, SM22 and SMA. Co-staining with a human specific CD31 (hCD31) antibody was used to identify human blood vessels. a,b, Experiments were repeated independently on n = 3 biological samples, with similar results. c,d, CRISPR/Cas9 genome editing was used to generate DLL4 and NOTCH3 knock out iPSCs (NC8). Single guide RNAs (sgRNAs) are indicated in the NOTCH3/DLL4 sequence as well as generated indels. c, Western blot shows ablation of Notch3 expression in target iPSCs. Clone #4 (red) was used for functional assays. FL, full length Notch3; NTM, transmembrane Notch3 subunit. d, Immunostaining in control vascular organoids shows expression of Dll4 in endothelial cells (CD31+) but not in CRISPR/Cas9 genome edited iPSCs. c,d, Experiments were repeated independently n = 2 times with similar results. e, Vascular organoids differentiated from Dll4 KO and Notch3 KO iPS cells (NC8) were stained for endothelial cells (CD31) and pericytes (PDGFRβ). Experiments were repeated independently n = 3 times with similar results. f, Quantification of endothelial networks (CD31+ area) in Dll4 KO and Notch3 KO vascular organoids. Graph represents mean ± S.D. from n=3 independent experiments. P-values are indicated in the panel (One-way ANOVA). g, Quantification of pericyte number in Dll4 KO and Notch3 KO vascular organoids. Graph represents mean ± S.D. from n=3 independent experiments. P-values are indicated in the panel (One-way ANOVA). h, Representative images of basement membranes stained for Collagen IV (Col IV) from control, Dll4 KO, and Notch3 KO vascular organoids (NC8 iPSCs) exposed to hyperglycemia/IL6/TNFα (diabetic) or maintained under standard culture conditions (non-diabetic). Experiments were repeated independently n = 3 times with similar results. i, Thickness of continuously surrounded lumina by Col IV was measured in optical cross-sections. Each individual measurement from a lumenized vessel is shown as a dot in the right panel. A total of non-diabetic (Control n=265, Dll4 KO n=203, Notch3 KO n=215) and diabetic (Control n=214, Dll4 KO n=187, Notch3 KO n= 206) lumina were analysed for each experimental condition from 3 independent biological replicates with equal sample size. Means are represented as centre bars ± SD. *** p<0.001 (One-way ANOVA). Scale bar a,b,e=20μm, d,h=50μm
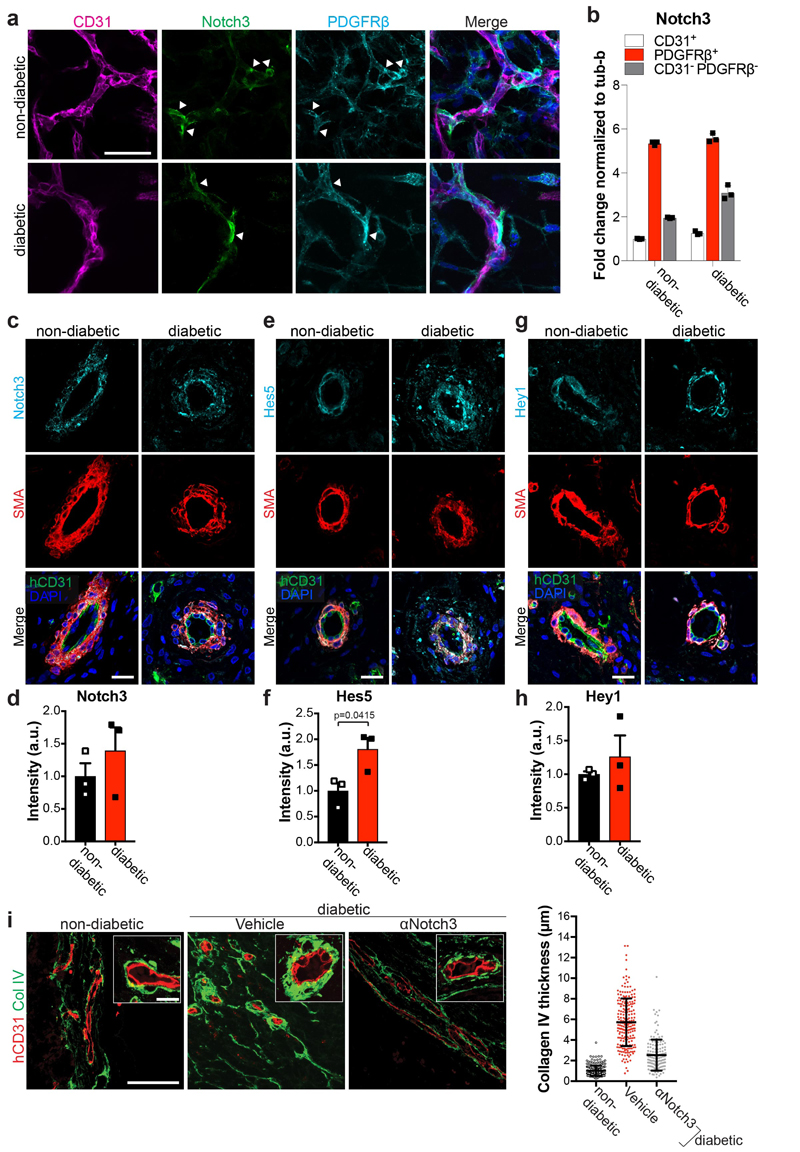
Extended Data Figure 10. Notch3 expression and signaling in vascular organoids.
a, Vascular organoids were cultured under non-diabetic or diabetic conditions and co-stained for Notch3, endothelial cells (CD31) and pericytes (PDGFRβ). Predominant localization of Notch3 in pericytes is indicated by the white arrowheads. Experiments were repeated independently n=3 times with similar results.b, RT-qPCR of endothelial cells (CD31+), pericytes (PDGFRβ+) and the remaining CD31- PDGFRβ- cells shows highest Notch3 in pericytes. Graph represents mean ± S.E.M. from 3 independent experiments. c-h, Human vascular organoids transplanted into non-diabetic control or diabetic STZ mice were analysed for Notch3 expression and the Notch downstream targets Hes5 and Hey1. Histological sections of transplanted human blood vessels were stained for c, Notch3, e, Hes5 or g, Hey1 and co-stained for SMA (pericytes) and hCD31 (human endothelium). Note the localization of Notch3, Hes5 as well as Hey1 to SMA positive pericytes. Experiments were repeated independently on n = 3 biological samples, with similar results. Quantification of d, Notch3, f, Hes5 and h, Hey1 expression. Pericytes were segmented using SMA and the intensity of immunofluorescence signal for each marker was measured. Graph represents mean ± S.E.M from n = 3 mice. P-value is indicated in the panel (two tailed student t-test). i, Diabetic mice transplanted with human vascular organoids (H9 ESCs) were treated with a Notch3 blocking antibody. Basement membrane thickness of individual human blood vessels (hCD31+) of non-diabetic n= 223, non-diabetic+Vehicle =212 and diabetic+αNotch3 n=143 was determined based on Col IV staining from n = (non-diabetic=3, diabetic + Vehicle=3, diabetic + αNotch3=2) mice. Mean is shown as centre bar ± SD. Scale bar a,c,e,g,i=50μm
Supplementary Material
Acknowledgements
We would like to thank all members of our laboratories for constructive critiques and expert advice; Nicole Fellner (VBCF) for EM, Anoop Kavirayani, Mihaela Zeba, Tamara Engelmaier, Julia Klughofer, Agnieszka Piszczek for histology services, Georg Michlits and Maria Hubmann (Ulrich Elling group) for help with single guide RNA (sgRNA) design and for sharing plasmids and Carmen Czepe (VBCF) for help with next generation sequencing experiments. The work is supported by the Intramural Research Program of the NHLBI (G.C., M.B.). We thank Dr. N.A. Calcutt, Department of Pathology, University of California, San Diego, for providing the samples of different rodent models of diabetes, and Dr. R. Coward, Department of Nephrology, University of Bristol for advice for the composition of the diabetogenic media, and Life Science Editors for editorial support. J.M.P. is supported by grants from IMBA, the Austrian Ministry of Sciences, the Austrian Academy of Sciences, an ERC Advanced Grant, and an Era of Hope Innovator award.
Footnotes
Author Contributions. R.A.W. developed the human blood vessel organoids and performed, with A.L., most of the experiments in organoids including the diabetes in vitro studies and mouse transplantation experiments. N.W., M.H., and B.H. under supervision and expert advice of D.K. conceived and performed vascular basement membrane analyses on patients, human endothelial cells and different murine diabetes models and isolated endothelial cells/RNA from patients. M.A. under the supervision of J.Z. helped with in vivo mouse transplantations. M.N performed bioinformatics analysis. F.Y., B.F performed karyotyping experiments, C.A., G.C., and M.B. provided iPS cell lines, C.E., J.A.B., D.L., under the supervision of J.A.K. generated the reporter ES cells and C.A. helped characterizing the stem cells. R.A.W and J.M.P. coordinated the project and wrote the manuscript.
Author information. Reprints and permissions information is available at www.nature.com/reprints. The authors declare competing financial interests. A patent application related to this work has been filed. Readers are welcome to comment on the online version of the paper.
Data availability
RNAseq data and GSEA analysis data have been deposited to NCBI Expression Omnibus and are accessible through the GEO accession numbers GSE89475, GSE92724 and GSE117469.
References
- 1.World Health Organization. Global Report on Diabetes. 2016 ISBN 978. [Google Scholar]
- 2.Bianchi E, et al. Age and diabetes related changes of the retinal capillaries: An ultrastructural and immunohistochemical study. Int J Immunopathol Pharmacol. 2016;29:40–53. doi: 10.1177/0394632015615592. [DOI] [PMC free article] [PubMed] [Google Scholar]
- 3.Roy S, Ha J, Trudeau K, Beglova E. Vascular Basement Membrane Thickening in Diabetic Retinopathy. Curr Eye Res. 2010;35:1045–1056. doi: 10.3109/02713683.2010.514659. [DOI] [PubMed] [Google Scholar]
- 4.Fowler MJ. Microvascular and macrovascular complications of diabetes. Clin Diabetes. 2011;29:116–122. [Google Scholar]
- 5.Eelen G, De Zeeuw P, Simons M, Carmeliet P. Endothelial cell metabolism in normal and diseased vasculature. Circulation Research. 2015;116:1231–1244. doi: 10.1161/CIRCRESAHA.116.302855. [DOI] [PMC free article] [PubMed] [Google Scholar]
- 6.Warmke N, Griffin KJ, Cubbon RM. Pericytes in diabetes-associated vascular disease. Journal of Diabetes and its Complications. 2016;30:1643–1650. doi: 10.1016/j.jdiacomp.2016.08.005. [DOI] [PubMed] [Google Scholar]
- 7.Orlova VV, et al. Functionality of endothelial cells and pericytes from human pluripotent stem cells demonstrated in cultured vascular plexus and zebrafish xenografts. Arterioscler Thromb Vasc Biol. 2014;34:177–186. doi: 10.1161/ATVBAHA.113.302598. [DOI] [PubMed] [Google Scholar]
- 8.Orlova VV, et al. Generation, expansion and functional analysis of endothelial cells and pericytes derived from human pluripotent stem cells. Nat Protoc. 2014;9:1514–31. doi: 10.1038/nprot.2014.102. [DOI] [PubMed] [Google Scholar]
- 9.Kusuma S, et al. Self-organized vascular networks from human pluripotent stem cells in a synthetic matrix. Proc Natl Acad Sci U S A. 2013;110:12601–6. doi: 10.1073/pnas.1306562110. [DOI] [PMC free article] [PubMed] [Google Scholar]
- 10.Chan XY, et al. Three-Dimensional Vascular Network Assembly from Diabetic Patient-Derived Induced Pluripotent Stem Cells. Arterioscler Thromb Vasc Biol. 2015;35:2677–2685. doi: 10.1161/ATVBAHA.115.306362. [DOI] [PMC free article] [PubMed] [Google Scholar]
- 11.Kusuma S, Gerecht S. Derivation of Endothelial Cells and Pericytes from Human Pluripotent Stem Cells. Methods Mol Biol. 2014 doi: 10.1007/7651_2014_149. [DOI] [PubMed] [Google Scholar]
- 12.Cheung C, Bernardo AS, Trotter MWB, Pedersen RA, Sinha S. Generation of human vascular smooth muscle subtypes provides insight into embryological origin-dependent disease susceptibility. Nat Biotechnol. 2012;30:165–73. doi: 10.1038/nbt.2107. [DOI] [PMC free article] [PubMed] [Google Scholar]
- 13.Patsch C, et al. Generation of vascular endothelial and smooth muscle cells from human pluripotent stem cells. Nat Cell Biol. 2015;17:994–1003. doi: 10.1038/ncb3205. [DOI] [PMC free article] [PubMed] [Google Scholar]
- 14.Ren X, et al. Engineering pulmonary vasculature in decellularized rat and human lungs. Nat Biotechnol. 2015;33:1097–102. doi: 10.1038/nbt.3354. [DOI] [PubMed] [Google Scholar]
- 15.James D, et al. Expansion and maintenance of human embryonic stem cell - derived endothelial cells by TGFb inhibition is Id1 dependent. Nat Biotechnol. 2010;28:161–6. doi: 10.1038/nbt.1605. [DOI] [PMC free article] [PubMed] [Google Scholar]
- 16.Samuel R, Duda DG, Fukumura D, Jain RK. Vascular diseases await translation of blood vessels engineered from stem cells. Sci Transl Med. 2015;7:309rv6. doi: 10.1126/scitranslmed.aaa1805. [DOI] [PMC free article] [PubMed] [Google Scholar]
- 17.Potente M, Gerhardt H, Carmeliet P. Basic and therapeutic aspects of angiogenesis. Cell. 2011;146:873–887. doi: 10.1016/j.cell.2011.08.039. [DOI] [PubMed] [Google Scholar]
- 18.Samuel R, et al. Generation of functionally competent and durable engineered blood vessels from human induced pluripotent stem cells. Proc Natl Acad Sci U S A. 2013;110:12774–9. doi: 10.1073/pnas.1310675110. [DOI] [PMC free article] [PubMed] [Google Scholar]
- 19.Swift MR, Weinstein BM. Arterial-venous specification during development. Circulation Research. 2009;104:576–588. doi: 10.1161/CIRCRESAHA.108.188805. [DOI] [PubMed] [Google Scholar]
- 20.Pickup JC, Chusney GD, Thomas SM, Burt D. Plasma interleukin-6, tumour necrosis factor alpha and blood cytokine production in type 2 diabetes. Life Sci. 2000;67:291–300. doi: 10.1016/s0024-3205(00)00622-6. [DOI] [PubMed] [Google Scholar]
- 21.Wellen KE, Hotamisligil GS. Inflammation, stress, and diabetes. Journal of Clinical Investigation. 2005;115:1111–1119. doi: 10.1172/JCI25102. [DOI] [PMC free article] [PubMed] [Google Scholar]
- 22.Li L, Qian L, Yu ZQ. Serum angiopoietin-2 is associated with angiopathy in type 2 diabetes mellitus. J Diabetes Complications. 2015;29:568–571. doi: 10.1016/j.jdiacomp.2015.02.006. [DOI] [PubMed] [Google Scholar]
- 23.Lieb W, et al. Clinical and genetic correlates of circulating angiopoietin-2 and soluble tie-2 in the community. Circ Cardiovasc Genet. 2010;3:300–306. doi: 10.1161/CIRCGENETICS.109.914556. [DOI] [PMC free article] [PubMed] [Google Scholar]
- 24.Lim HS, Lip GYH, Blann AD. Angiopoietin-1 and angiopoietin-2 in diabetes mellitus: Relationship to VEGF, glycaemic control, endothelial damage/dysfunction and atherosclerosis. Atherosclerosis. 2005;180:113–118. doi: 10.1016/j.atherosclerosis.2004.11.004. [DOI] [PubMed] [Google Scholar]
- 25.Soriguer F, et al. Apelin levels are increased in morbidly obese subjects with type 2 diabetes mellitus. Obes Surg. 2009;19:1574–1580. doi: 10.1007/s11695-009-9955-y. [DOI] [PubMed] [Google Scholar]
- 26.Knudsen ST, et al. Increased plasma concentrations of osteoprotegerin in type 2 diabetic patients with microvascular complications. Eur J Endocrinol. 2003;149:39–42. doi: 10.1530/eje.0.1490039. [DOI] [PubMed] [Google Scholar]
- 27.Lai AKW, Lo ACY. Animal models of diabetic retinopathy: Summary and comparison. Journal of Diabetes Research 2013. 2013 doi: 10.1155/2013/106594. [DOI] [PMC free article] [PubMed] [Google Scholar]
- 28.Soler MJ, Riera M, Batlle D. New experimental models of diabetic nephropathy in mice models of type 2 diabetes: Efforts to replicate human nephropathy. Experimental Diabetes Research 2012. 2012 doi: 10.1155/2012/616313. [DOI] [PMC free article] [PubMed] [Google Scholar]
- 29.Qaseem A, Humphrey LL, Sweet DE, Starkey M, Shekelle P. Oral pharmacologic treatment of type 2 diabetes mellitus: A clinical practice guideline from the american college of physicians. Annals of Internal Medicine. 2012;156:218–231. doi: 10.7326/0003-4819-156-3-201202070-00011. [DOI] [PubMed] [Google Scholar]
- 30.Carmeliet P. Angiogenesis in health and disease. Nature Medicine. 2003;9:653–660. doi: 10.1038/nm0603-653. [DOI] [PubMed] [Google Scholar]
- 31.Thomson JA, et al. Embryonic stem cell lines derived from human blastocysts. Science (80-. ) 1998;282:1145–1147. doi: 10.1126/science.282.5391.1145. [DOI] [PubMed] [Google Scholar]
- 32.Bagley JA, Reumann D, Bian S, Lévi-Strauss J, Knoblich JA. Fused cerebral organoids model interactions between brain regions. Nat Methods. 2017;14:743–751. doi: 10.1038/nmeth.4304. [DOI] [PMC free article] [PubMed] [Google Scholar]
- 33.Hockemeyer D, et al. Efficient targeting of expressed and silent genes in human ESCs and iPSCs using zinc-finger nucleases. Nat Biotechnol. 2009;27:851–857. doi: 10.1038/nbt.1562. [DOI] [PMC free article] [PubMed] [Google Scholar]
- 34.Chen G, et al. Chemically defined conditions for human iPSC derivation and culture. Nat Methods. 2011;8:424–9. doi: 10.1038/nmeth.1593. [DOI] [PMC free article] [PubMed] [Google Scholar]
- 35.Agu CA, et al. Successful Generation of Human Induced Pluripotent Stem Cell Lines from Blood Samples Held at Room Temperature for up to 48 hr. Stem cell reports. 2015;5:660–71. doi: 10.1016/j.stemcr.2015.08.012. [DOI] [PMC free article] [PubMed] [Google Scholar]
- 36.Ishikawa F, et al. Development of functional human blood and immune systems in NOD/SCID/IL2 receptor {gamma} chain(null) mice. Blood. 2005;106:1565–73. doi: 10.1182/blood-2005-02-0516. [DOI] [PMC free article] [PubMed] [Google Scholar]
- 37.Boxerman JL, Schmainda KM, Weisskoff RM. Relative cerebral blood volume maps corrected for contrast agent extravasation significantly correlate with glioma tumor grade, whereas uncorrected maps do not. Am J Neuroradiol. 2006;27:859–867. [PMC free article] [PubMed] [Google Scholar]
- 38.Schindelin J, et al. Fiji: An open-source platform for biological-image analysis. Nature Methods. 2012;9:676–682. doi: 10.1038/nmeth.2019. [DOI] [PMC free article] [PubMed] [Google Scholar]
- 39.Varnum-Finney B, et al. Immobilization of Notch ligand, Delta-1, is required for induction of notch signaling. J Cell Sci. 2000;113 Pt 23:4313–4318. doi: 10.1242/jcs.113.23.4313. [DOI] [PubMed] [Google Scholar]
- 40.Noguera-Troise I, et al. Blockade of Dll4 inhibits tumour growth by promoting non-productive angiogenesis. Nature. 2006;444:1032–1037. doi: 10.1038/nature05355. [DOI] [PubMed] [Google Scholar]
- 41.Schoppmann SF, et al. Telomerase-immortalized lymphatic and blood vessel endothelial cells are functionally stable and retain their lineage specificity. Microcirculation. 2004;11:261–269. doi: 10.1080/10739680490425967. [DOI] [PubMed] [Google Scholar]
- 42.Ran FA, et al. Genome engineering using the CRISPR-Cas9 system. Nat Protoc. 2013;8:2281–2308. doi: 10.1038/nprot.2013.143. [DOI] [PMC free article] [PubMed] [Google Scholar]
- 43.Kuleshov MV, et al. Enrichr: a comprehensive gene set enrichment analysis web server 2016 update. Nucleic Acids Res. 2016;44:W90–7. doi: 10.1093/nar/gkw377. [DOI] [PMC free article] [PubMed] [Google Scholar]
- 44.Chen EY, et al. Enrichr: interactive and collaborative HTML5 gene list enrichment analysis tool. BMC Bioinformatics. 2013;14:128. doi: 10.1186/1471-2105-14-128. [DOI] [PMC free article] [PubMed] [Google Scholar]
- 45.Haemmerle M, et al. Enhanced lymph vessel density, remodeling, and inflammation are reflected by gene expression signatures in dermal lymphatic endothelial cells in type 2 diabetes. Diabetes. 2013;62:2509–2529. doi: 10.2337/db12-0844. [DOI] [PMC free article] [PubMed] [Google Scholar]
Associated Data
This section collects any data citations, data availability statements, or supplementary materials included in this article.
Supplementary Materials
Data Availability Statement
RNAseq data and GSEA analysis data have been deposited to NCBI Expression Omnibus and are accessible through the GEO accession numbers GSE89475, GSE92724 and GSE117469.


