Abstract
Lipopolysaccharide (LPS) transport to the outer membrane (OM) is a crucial step in the biogenesis of the microbial surface defences. Although many features of the translocation mechanism have been elucidated, molecular details of LPS insertion via the LPS transport (Lpt) OM protein LptDE remain elusive. Here we integrate native mass spectrometry with hydrogen-deuterium exchange mass spectrometry and molecular dynamics simulations to investigate the influence of substrate and peptide binding on the conformational dynamics of LptDE. Our data reveal that LPS induces opening of the LptD β-taco domain, coupled with conformational changes on β-strands adjacent to the putative lateral exit gate. Conversely, an antimicrobial peptide, thanatin, stabilises the β-taco, thereby preventing LPS transport. Our results illustrate that LPS insertion into the OM relies on concerted opening movements of both β-barrel and β-taco domains of LptD, and suggests a means for developing antimicrobial therapeutics targeting this essential process in Gram-negative ESKAPE pathogens.
Introduction
The outer membrane (OM) of Gram-negative bacteria is an asymmetric lipid bilayer with lipopolysaccharide (LPS) molecules on the outer leaflet and phospholipids in the inner leaflet1. Each LPS molecule is composed of three moieties: lipid A, core oligosaccharide and an O-antigen glycan which itself varies in its composition (Fig. 1a). The O-antigen contains up to 200 sugars, with many bearing phosphate groups which interact with bivalent cations, allowing the formation of a tight network between LPS molecules2. While the lipidic portion of LPS prevents the passage of polar molecules, the oligosaccharides preclude toxic hydrophobic compounds from entering the cell, playing a major role in the resistance of Gram-negative bacteria to antibiotics3.
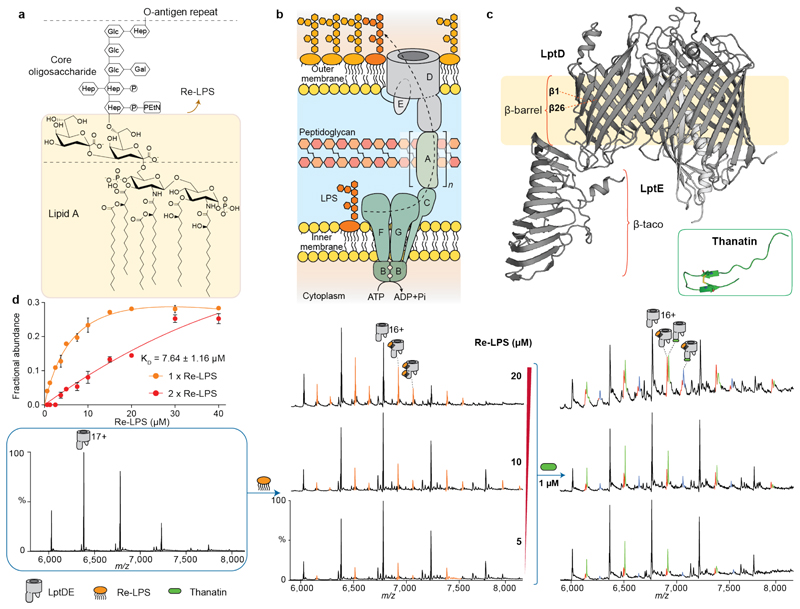
Figure 1. Schematic of the LPS transport system and nMS analysis of LptDE, Re-LPS and thanatin.
(a) Molecular structure of LPS: lipid A portion, core oligosaccharide and the O-antigen repeat, consisting of a high MW polysaccharide with multiple branching. Re-LPS is a substructure of LPS consisting of lipid A bound to two Kdo moieties. (b) Schematic of the Lpt system: LPS is transported from the inner membrane (IM) to the outer membrane (OM) through a multiprotein complex comprising seven proteins. LPS is extracted from the IM via the ABC transporter LptB2FG interacting with the single transmembrane protein LptC. LptA forms a head-to-tail oligomer across the periplasm interacting with LptC on the N-terminus and LptD on the C-terminus. LPS is then inserted in the outer leaflet of the OM by the heterodimer LptDE. (c) X-ray crystal structure of the OM plug-and-barrel complex LptDE (PDB ID: 5IV9). LptD presents a β-barrel transmembrane region and a β-taco soluble region that contributes to the formation of the periplasmic bridge. LptE is a lipoprotein inserted into the larger lobe formed of the LptD β-barrel. Inset: 3D-structure of thanatin (PDB ID: 5XO4). (d) nMS analysis of LptDE ligand binding. LptDE (5μM, left) in 0.5% C8E4 was incubated with increasing concentrations of Re-LPS (centre, orange peaks), allowing for the calculation of an apparent KD for the first binding event, as described in the methods section. Error bars represent s.d. (n = 3). In a further experiment, Re-LPS-bound LptDE was supplemented with 1 μM thanatin (right). New charge state series corresponding to LptDE bound to thanatin (green) and both Re-LPS and thanatin (purple) are observed. Detailed information on theoretical and experimental molecular masses is provided in Supplementary Table 1.
LPS is extracted from the inner membrane (IM) and inserted in the OM by seven essential LPS transport (Lpt) proteins LptA-G (Fig. 1b)2. Three Lpt components, LptB2FG, form a type VI ABC mechanotransducer which extracts LPS from the outer leaflet of the IM4. LptC is a single-pass membrane protein which inserts its helix between the transmembrane domains of LptF and LptG and regulates the transport of LPS from LptB2FG to LptA5–7, a soluble oligomeric protein that mediates the passage of LPS across the periplasm8. Finally, the heterodimer formed by the integral β-barrel OM protein LptD and the OM-anchored lipoprotein LptE is responsible for transporting LPS from the periplasm to the outer leaflet of the OM (Fig. 1c)9,10. LptD possesses a 26-stranded β-barrel with a putative LPS lateral exit gate formed between strands β1 and β26. The N-terminal periplasmic region of LptD consists of a β-taco domain, a fold shared with LptA, LptC, LptF and LptG. Several crystal structures of the LptDE complex show that LptE is inserted within LptD barrel, forming a plug-andbarrel complex (Fig. 1c)11,12. Further structural, genetic and crosslinking studies suggested that the lipid A portion of LPS interacts with the hydrophobic β-taco domain of LptD13–15. However, the molecular details of the insertion process remain elusive, particularly regarding the conformational changes induced by LPS binding, as well as the role of LptE in the translocation process.
Currently, two antibacterial peptides targeting LptD have been described: the peptidomimetic compound murepavadin and the insect-derived thanatin. Both peptides target Gram-negative ESKAPE pathogens, a group of antibiotic-resistant bacteria representing a major threat to human health according to the World Health Organization16. Murepavadin was reported to specifically bind Pseudomonas aeruginosa LptD17,18 showing antimicrobial activity in a mouse septicaemia infection model19. Conversely, thanatin (Fig. 1c, inset) demonstrated broad-spectrum activity against bacteria (including Escherichia coli and Klebsiella pneumoniae)20 and interacts with E. coli LptA and LptDE21. According to previous studies, thanatin putative mechanism of action involves the disruption of the protein-protein interaction networks in the periplasmic portion of the Lpt complex, thereby impairing LPS transportation. Whilst the key interactions between LptA and thanatin have been reported21, little is known about the effects of thanatin binding to LptDE and the mechanistic details of its influence on LPS translocation. Elucidating the molecular details on LptDE-thanatin interaction will therefore provide key information for the development of novel antimicrobial drugs.
Here, we combine native mass spectrometry (nMS) with hydrogen-deuterium exchange mass spectrometry (HDX-MS) and molecular dynamics simulations (MD) to examine the influence of substrate, lipids and inhibitor binding on the conformational dynamics of the LptDE complex. nMS afforded us an initial platform to investigate ligand binding properties22–25 of LptDE with various native lipids as well as with the inhibitor thanatin. The conformational dynamics of these events were explored in detail using HDX-MS26,27, while MD aided the mechanistic interpretation of nMS and HDXMS experiments28–30. Together, the results reveal that the soluble domain of LptDE binds to LPS, opening the lateral exit gate of the barrel in the process. We find that thanatin binds to the LptD at the base of the LptD β-taco, thus preventing the flow of LPS into the OM.
LPS and thanatin do not compete for LptDE binding
We selected LptDE from the pathogenic K. pneumoniae as our model system. Following expression and purification of the protein complex (see methods section) using n-dodecyl-β-D-maltopyranoside (DDM) as detergent, we performed a detergent screen to optimise conditions for nMS analysis31. Tetraethylene glycol monooctyl ether (C8E4) yielded well-resolved mass spectra releasing the intact LptDE heterodimer into the gas phase (Fig. 1d, left and Supplementary Table 1).
We then explored the substrate binding properties of the complex by incubating K. pneumoniae full length LPS mixture with LptDE. Mass spectra showed the existence of a heterogeneous array of adducts with molecular masses in the ~4-5 kDa range indicative of LPS binding (Supplementary Fig. 1). Given the heterogeneity of LPS, further nMS analysis at higher LPS concentrations would have been technically challenging in terms of resolution particularly when adding other ligands. To overcome this problem, we selected Re-LPS, an LPS substructure comprising the lipid A moiety and two ketodeoxyoctonic acids (Kdo) residues belonging to the core oligosaccharide (Fig. 1a). Re-LPS has the same endotoxin activity as LPS32 and has been used to investigate the functionality of the Lpt system in previous studies9,33. When added increasing concentrations of Re-LPS (5 μM, 10 μM and 20 μM) to solutions of LptDE (5 μM) we observed additional adduct peaks (orange) increasing in a concentration-dependent manner, as well as a second Re-LPS binding event at higher concentrations (Fig. 1d, centre). To quantify the binding affinity, we incubated LptDE with up to 40 μM Re-LPS and extracted the peak intensities; the measured apparent dissociation constant (KD) was 7.64 ± 1.16 μM for the first binding event (Fig. 1d).
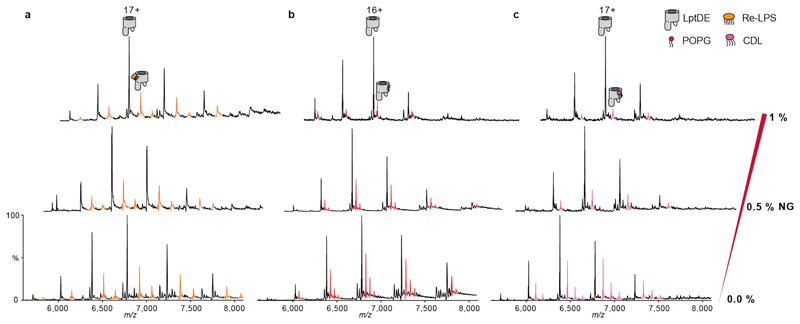
To assess the specificity of LptDE:Re-LPS interactions we used an MS-based method that outcompetes weaker annular lipid-binding with detergents34. First, we analysed LptDE binding to cardiolipin (CDL) and phosphatidylglycerol (POPG) by adding a 2-fold excess of each lipid to LptDE. Using nMS we then compared the extent of binding with that observed with Re-LPS in 0.5% C8E4. We detected up to three lipid binding events for either CDL or POPG. Increasing concentrations of the detergent n-nonyl-β-D-glucopyranoside (NG), however displaced the second and third binding events for POPG and for CDL. By contrast, the second binding event of Re-LPS to LptDE was only slightly reduced in 1 % NG (Extended Data Fig. 1). These results suggest that Re-LPS binds to LptDE in a specific manner, whereas CDL and POPG bind to LptDE in exposed regions that are readily displaced by detergents.
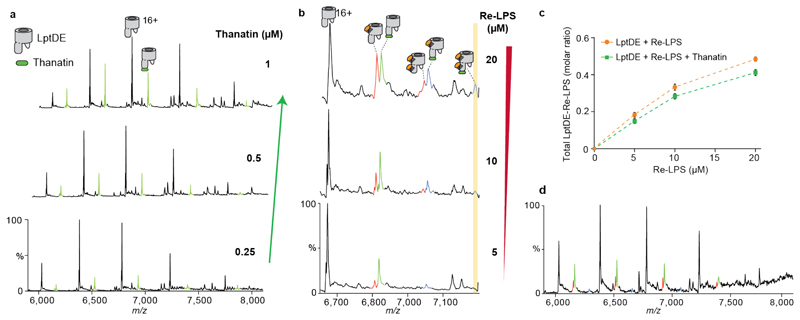
When next examined the interaction between thanatin and LptDE. We observed binding even at submicromolar concentrations (Extended Data Fig. 2a), in line with the reported binding affinity with EcLptD21. To determine whether thanatin competes with Re-LPS we performed competition experiments in the presence of increasing concentrations of Re-LPS (5 to 20 μM) followed by the addition of thanatin (1 μM). Interestingly, additional adduct peaks observed in the mass spectra showed simultaneous binding of Re-LPS and thanatin to LptDE (Fig. 1d and Supplementary Table 1), including a small amount of LptDE bound to Re-LPS/thanatin in a 2:1 ratio (Extended Data Fig. 2b). Moreover, the total amount of Re-LPS bound to LptDE was only slightly reduced in the presence of thanatin (Extended Data Fig. 2c). We also added thanatin first (1 μM), followed by Re-LPS (10 μM). We observed a slight decrease in Re-LPS binding to LptDE, likely because of the allosteric effects played by thanatin. A certain amount of Re-LPS was still bound to the protein and some ternary complex was present because of the lack of directionality of the system (Extended Data Fig. 2d). These results suggest non-competitive binding of the thanatin peptide and Re-LPS substrate to LptDE.
HDX-MS reveals LPS-induced LptDE conformational dynamics
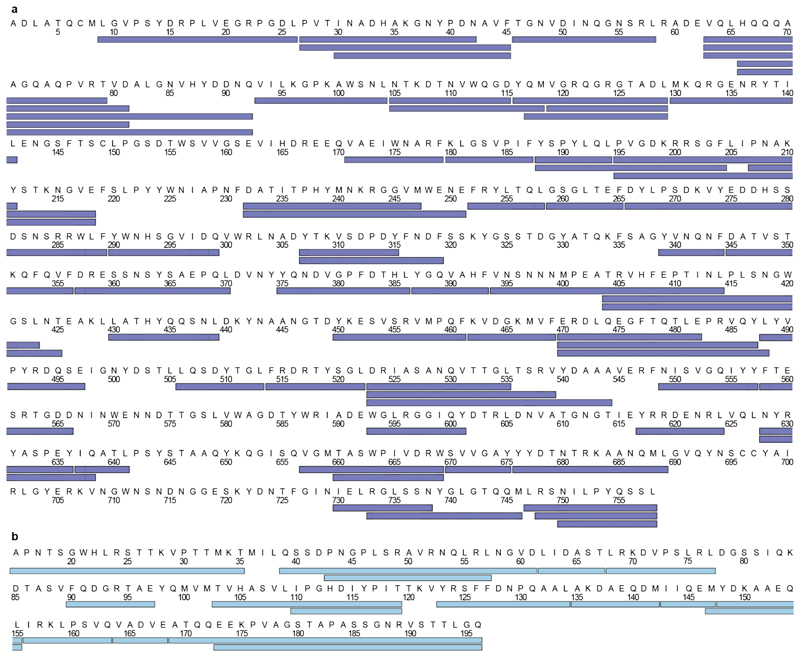
To understand the conformational dynamics of LptDE during LPS translocation, we used HDX-MS to probe structural changes as a function of time upon binding of LPS, Re-LPS, and thanatin. The peptide coverage for LptDE in DDM (68 peptides, 70.5% coverage of the LptD sequence and 17 peptides, 87.4% coverage of LptE, Extended Data Fig. 3), enabled an extensive analysis of the conformational changes of LptDE. We performed HDX-MS experiments at 5 different time points (0.167 min to 420 min) to sample conformational changes happening at different time scales35 (Supplementary Fig. 2). We calculated the DHDX for all peptides at each time point and computed statistical significance (see methods section).
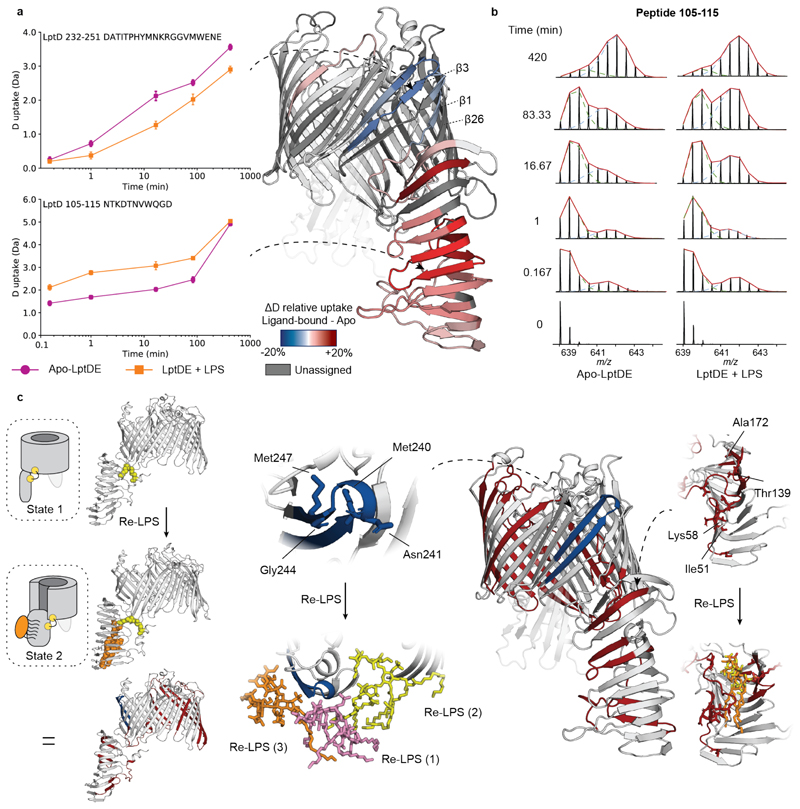
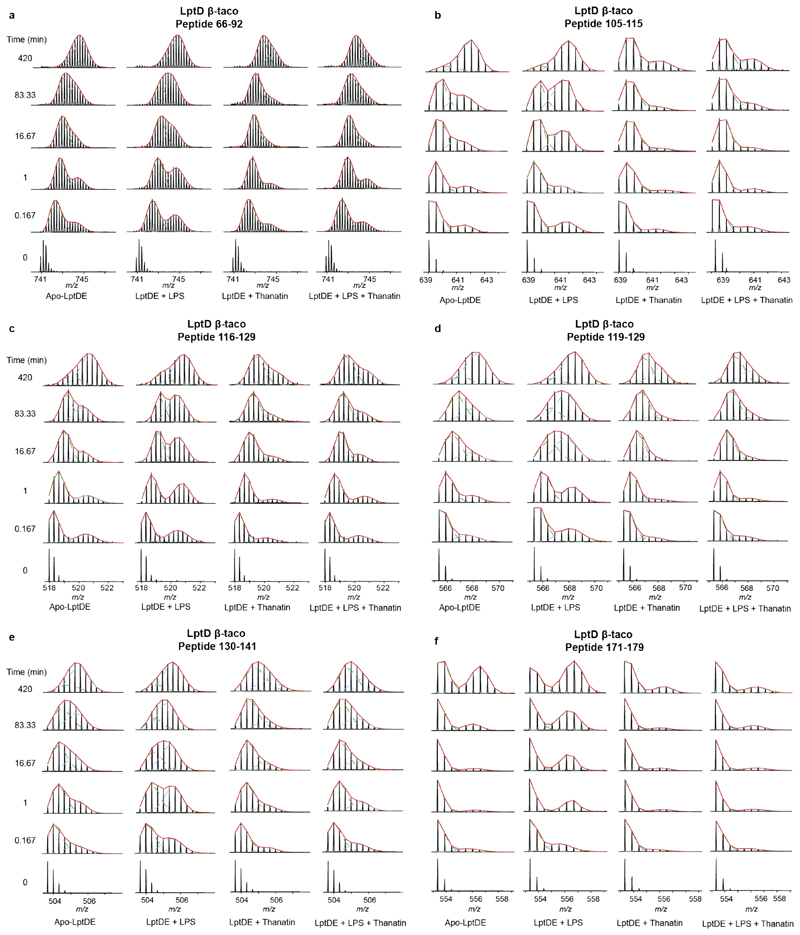
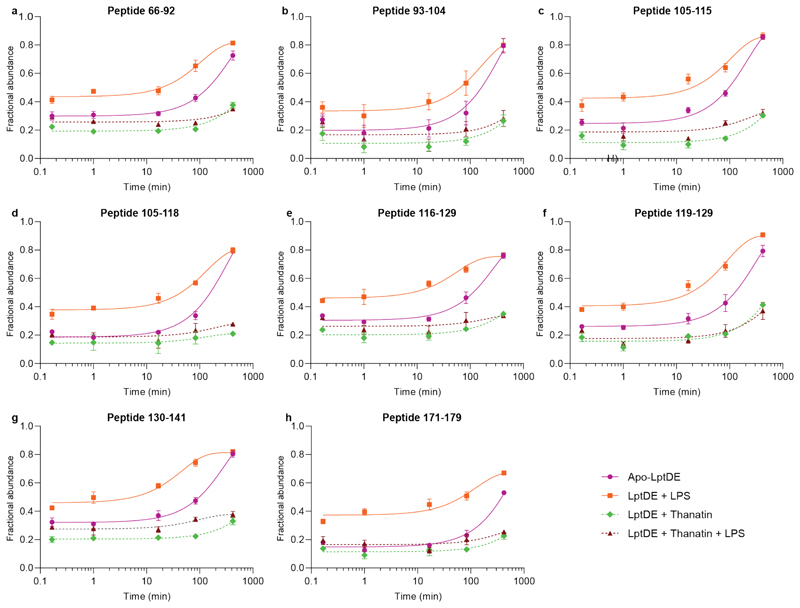
First, we incubated LptDE with a 15-fold excess of LPS to assess the effects of substrate binding. The LPS-bound state of LptD revealed a decrease in HDX for peptides covering β-strands β1-β2 (peptides 195-211, 195-218, 207-218) and β3-β4 (peptides 232-247, 232-251, Fig. 2a and Supplementary Fig. 3a-b). These β-strands are adjacent to the putative LPS lateral exit gate, located at the edge between β1 and β2611–13,36. Conversely, we observed an increase in HDX in the β-taco domain (Fig. 2a), which has been proposed to accommodate LPS during the transport from the periplasmic component of the Lpt system to the OM13–15. Interestingly, we found that peptides covering residues 46-204 displayed bimodal isotopic distributions, characteristic of EX1 or mixed EX1/EX2 (EXX) kinetics (Fig. 2b, Extended Data Fig. 4, and Supplementary Fig. 4). Analytical SEC indicated that LptDE is stable in the buffer used for our experiments over the incubation times used during HDX-MS; indeed, SEC profiles show no significant oligomerisation or aggregation. Hence, the observed EX1 behaviour is not a consequence of structural destabilization leading to protein aggregation, rather it is a specific feature of the protein complex (Supplementary Fig. 5). This suggests that the β-taco peptides undergo concerted opening-closing motions at lower rates compared to the exchange reaction27,37,38. Most of these peptides were amenable to quantitative analysis enabling us to extract kinetic constants, such as the rate of conformational opening (kop) and the half-life of the closed state (t1/2). The fits to the curves indicated that the β-taco kop was increased in the presence of LPS (Extended Data Fig. 5). The kop values for the different peptides in the β-taco were within the same order of magnitude and neighbouring or overlapping peptides presented very similar values (Table 1). These results imply that the conformational events may be concerted; the presence of the substrate and consequent opening of the β-taco domain most likely causes the cooperative breakage of H-bonds between the β-strands leading to the EX1 behaviour. Hence, we hypothesise that β-strand separation is associated with βtaco opening.
Figure 2. Conformational dynamics of LPS-bound LptDE.
(a) Left: the deuterium uptake of representative peptides (105-115, β-taco and 232-247, β-barrel) plotted as a function of labelling time (0.167-420 min) for apo-LptDE (purple spheres) and LPS-bound LptDE (orange squares). Error bars indicate s.d. (nbiological = 2; ntechnical = 3). Right: difference in relative deuterium uptake (scaled for the number of residues of each peptide) at the 16.67 min labelling time mapped on the crystal structure of LptD. Only peptides showing significant differences are coloured. Red and blue indicate increased and decreased deuterium uptake, respectively. Detailed information of HDX-MS data is provided in Supplementary Table 2. (b) Representative mass spectra for peptide 105-115 are shown for apo-LptDE and LPS-bound states. Two binomial isotopic envelopes produced the best fit for the spectra yielding low- (green) and high-mass (light blue) populations. The sums of the two binomial distributions are shown in red. (c) Top: schematic comparing the solvent uptake for the apo-closed and lipid-bound open states and the resultant differential map. Bottom: highlighted portions of the differential solvent uptake map, where significant residues are labelled (red and blue indicate increased and decreased uptake, respectively) and shown as sticks for both the lateral exit gate peptide (232-251) and peptides on the β-taco (46-58, 130-141, 171-179). Re-LPS bound snapshots are illustrated for the β-taco and βbarrel (1-3) respectively.
Table 1.
Kinetic parameters for LptD peptides showing EX1 or EXX kinetics.
| Peptide | State | R2 | kop (min-1) | Closed state t1/2 (min) |
|---|---|---|---|---|
| 66-92 | Apo | 0.98 | 2.6-10-3
[2.6-10-3; 4.7-10-3] |
267 [147; 273] |
| +LPS | 0.96 | 9.6-10-3
[6.2-10-3; 1.4-10-2] |
72.2 [50.0; 111] |
|
| 93-104 | Apo | 0.91 | 2.9-10-3
[2.4-10-3; 4.2-10-3] |
238 [166; 290] |
| +LPS | 0.89 | 6.2-10-3
[2.8-10-3; 1.0-10-2] |
112.4 [68.4; 251] |
|
| 105-115 | Apo | 0.98 | 4.5-10-3
[3.4-10-3; 6.8-10-3] |
153 [103; 202] |
| +LPS | 0.92 | 9.6-10-3
[4.4-10-3; 1.8-10-2] |
72.4 [38.6; 158] |
|
| 105-118 | Apo | 0.98 | 3.1-10-3
[2.8-10-3; 4.0-10-3] |
226 [176; 251] |
| +LPS | 0.97 | 7.4-10-3
[4.4-10-3; 1.1-10-2] |
72.4 [63.7; 158] |
|
| 116-129 | Apo | 0.98 | 3.6-10-3
[2.2-10-3; 5.9-10-3] |
193 [116; 306] |
| +LPS | 0.93 | 1.8-10-2
[1.1-10-2; 3.4-10-2] |
39.6 [19.9; 67.5] |
|
| 119-129 | Apo | 0.98 | 3.3-10-3
[2.6-10-3; 5.8-10-3] |
213 [120; 268] |
| +LPS | 0.96 | 1.1-10-2
[7.5-10-3; 1.7-10-2] |
61.1 [41.0; 92.3] |
|
| 130-141 | Apo | 0.98 | 3.4-10-3
[2.6-10-3; 5.3-10-3] |
205 [130; 263] |
| +LPS | 0.96 | 2.2-10-2
[1.4-10-2; 3.9-10-2] |
31.7 [18.9; 49.2] |
|
| 171-179 | Apo | 0.97 | 1.4-10-3
[1.2-10-3; 3.2-10-3] |
497 [219; 570] |
| +LPS | 0.89 | 8.0-10-3
[3.4-10-3; 1.4-10-2] |
86.8 [48.0; 202] |
To see if this opening of the β-taco and protection of the lateral gate could also be induced by Re-LPS we repeated our experiments using a 15-fold excess of the ligand. We observed analogous changes in dynamics in the β-taco and exit gate (Supplementary Figs. 6 and 7a-c). As a control experiment we measured the HDX for the same peptides but this time in the presence of POPG a lipid shown to bind in our nMS experiments above (Supplementary Fig. 8). However, in this case there was no difference in D uptake, suggesting that the conformational changes observed are unique to substrate binding.
Considering LptE in the presence of LPS or Re-LPS, both the N- and C- terminal peptides were deprotected (Supplementary Figs. 9a-b; 10a,d; 11a,d). From the crystal structure of KpLptDE (PDB ID: 5IV9) we can see that peptide 15-35 forms a loop. The structure lacks the last 26 residues (170-196) which has not been observed in any X-ray crystal structure of LptDE from different species implying that it is a highly dynamic region. Indeed, the HDX of the peptides covering this region exchange rapidly, with more than 50% D uptake at the earliest time point.
MD simulations shed light on LptD-substrate interactions
To lend further structural insights to our HDX-MS results and elucidate the mechanisms by which LPS specifically affects LptDE dynamics, we performed a series of all-atom MD simulations of the LptDE complex in its open and closed states. To this end, we repurposed the alchembed methodology39 to gradually grow the Re-LPS lipid inside the β-taco opening the domain in the process. In order to model LPS insertion in the OM through the β1-β26 lateral exit gate, we templated KpLptDE onto a structure of LptDE from Salmonella typhimurium, which the β-barrel has been previously modelled open12. In doing so, it became apparent that the process of opening may be synchronized between the β-strands of the lateral exit gate and the β-taco. Indeed, our analysis identified that the KpLptDE disulphide bonds, Cys7-Cys696 and Cys149-Cys697, where the latter is almost absolutely conserved, couple the C-terminal half of the β-barrel to the β-taco (Supplementary Movie 1). We hypothesise, therefore, that binding of LPS and derivatives thereof (such as Re-LPS) to the β-taco not only drives the opening of this domain but also primes the opening of the lateral gate of the LptDE β-barrel, upon LPS translocation.
Altogether, five repeats of the apo-closed state and the lipid-bound open state were simulated for 300 ns. In these simulations, global solvent contacts were assessed to be converged after 150 ns (Supplementary Fig. 12a). During the open state simulations, the barrel tended towards closure in 3 replicates, though in 2 replicates we noticed that the gate remained in a stable open state at a distance of ~2.25 nm between four adjacent Cα atoms on β1 and β26 (Supplementary Fig. 13a). Thus, PLUMED40 upper and lower walls were used to sample a consistent open conformation, allowing us to test how wide the lateral exit gate should be to observe significant protection (Supplementary Figs. 12b-13b). Without restraints and a lateral gate distance of <2.25 nm (between β1 and β26), we were not able to observe such protection.
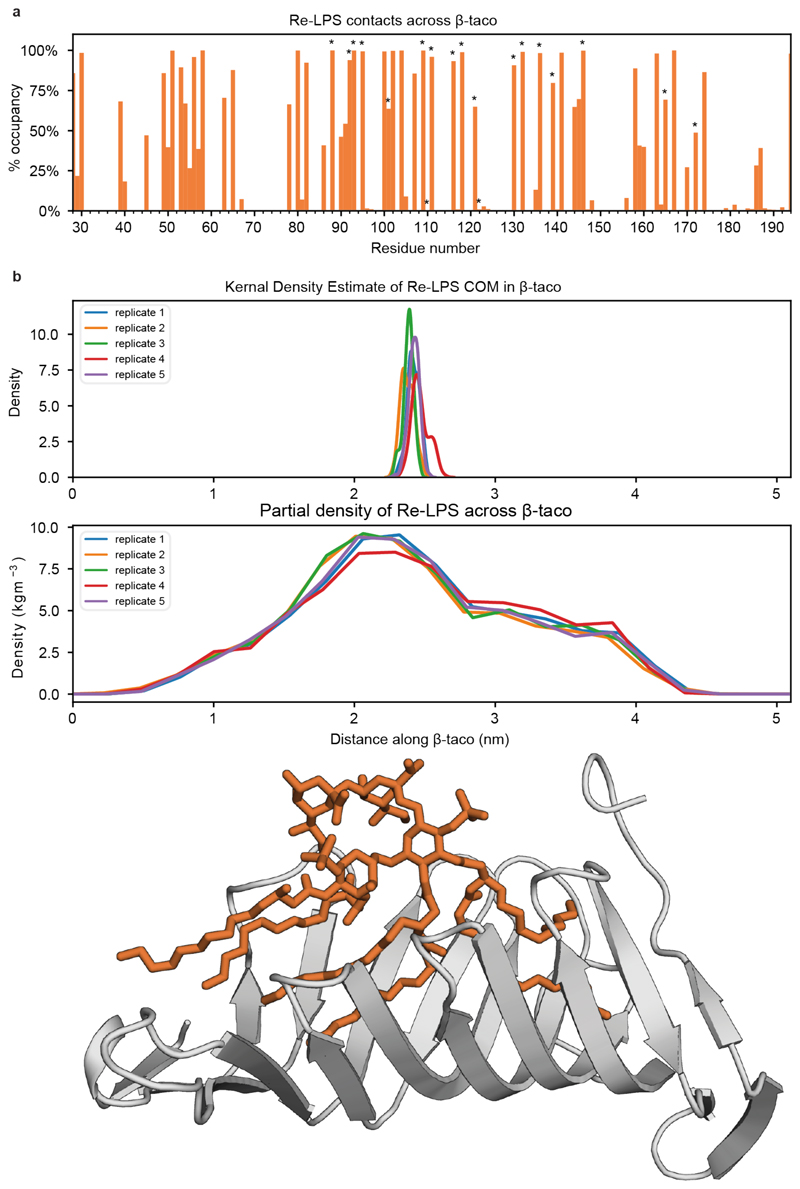
We next established a pipeline to generate simulated HDX data. We computed the backbone amide solvent contacts of each state, calculated the difference between states for each residue and then averaged over the peptide ranges obtained from the experimental sequence coverage (Extended Data Fig. 3). Therefore, by contrasting solvent contacts between states, we can better understand the direct effect of substrate binding and relate these differences to experimental EX2 behaviour (later H-bond studies allow us to comment on the role of EX1 kinetics involving the β-taco). The differential solvent contact plot (Fig. 2c) resembled the experimental data in several regards, including reproducing the observed deprotected peptides in the β-taco (peptides 46-58, 130-141, 171-179) and protected peptides at the lateral exit gate (peptide 232-251). Furthermore, we determined the specific residues responsible for a significant change in solvent contacts (Fig. 2c and Supplementary Fig. 14). We can relate Re-LPS contacts within the β-taco with increased solvent exposure for those residues, however minimal lipid diffusion reduces Re-LPS sampling within the β-taco and affords only certain areas of the domain enough solvent access to be statistically significant (Extended Data Fig. 6 and Supplementary Fig. 15). Our model suggests that on binding to Re-LPS, the β-taco opens up and allows solvent access, particularly for inward facing residues on the sides of the β-taco (Ile51, Lys58, Thr139 and Ala172), as well as also indicating the role of EX2 kinetics within the experimentally observed EXX regime on the β-taco.
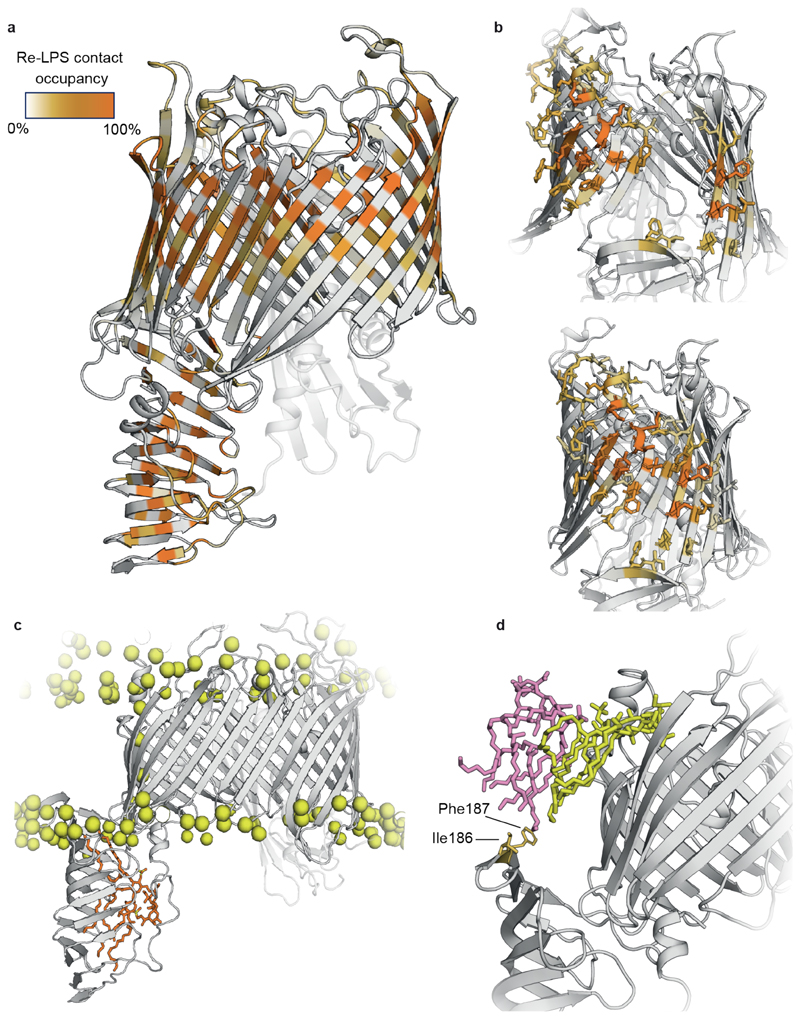
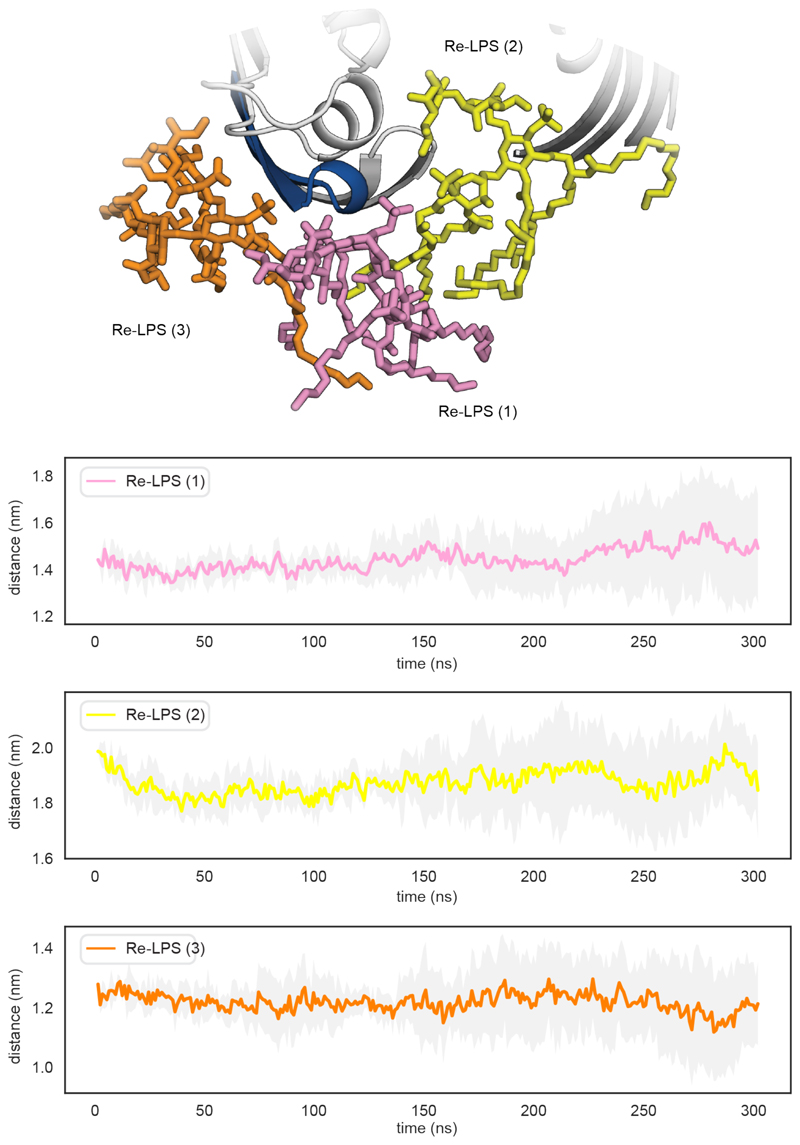
Regarding the lateral exit gate, we found that two residues on the outside of the barrel (Asn241 and Gly245) interact with Re-LPS (Fig. 2c). These lipids (labelled Re-LPS(1-3)) are caught within the open barrel (Fig. 2c) and are laterally pulled towards the inner leaflet of the bilayer which facilitates transient Re-LPS contacts with the C-terminal strand of the β-taco (Extended Data Fig. 7 and Supplementary Fig. 16). Later within the simulation, these lipids slowly diffuse away from the lateral exit gate which correlates with the peptide 232-251 not being shielded from the solvent and therefore not being protected (Extended Data Fig. 8). We also observed that when the β-barrel opens up, the loop connecting β1 and β2 dips down and shields Met240 and Met247 within the barrel (Supplementary Fig. 17). Thus, although local lipid effects contribute to solvent shielding, a subtle internal conformational change further facilitates protection of the amino acids at the lateral exit gate.
Thanatin binding stabilises the LptD β-taco
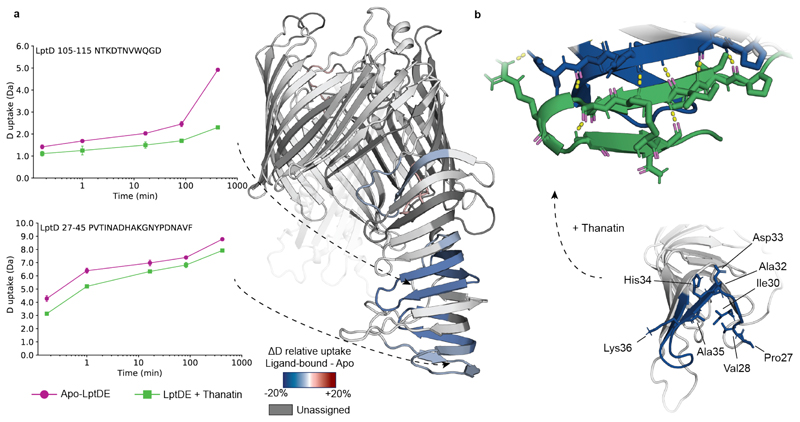
We next investigated the effects of thanatin on the dynamics of the transporter through HDX-MS analysis (Supplementary Figs. 2 and 3c-d). In the presence of thanatin, regions belonging to LptD β-taco presented decreased dynamics compared to the apo state, indicating stabilization upon ligand binding (Fig. 3a). We also observed mild deprotection on the LptE C-terminus (Supplementary Figs. 9a and 10b,d), probably because of the altered dynamics of the neighbouring β-taco.
Figure 3. Conformational dynamics of thanatin-bound LptDE.
(a) Left: the deuterium uptake of representative peptides (27-45, β-taco N-terminus; 105-115, β-taco central region) plotted as a function of labelling time for apo-LptDE (purple spheres) and thanatin-bound LptDE (green squares). Error bars indicate s.d. (nbiological = 2; ntechnical = 3). Right: difference in relative deuterium uptake (scaled for the number of residues of each peptide) at the 16.67 min labelling time mapped on the crystal structure of LptD. Only peptides showing significant difference are coloured. Red and blue indicate increased and decreased deuterium uptake, respectively. Detailed information of HDX-MS data is provided in Supplementary Table 2. (b) Top: final snapshot of thanatin bound to the β-taco in the simulation. The H-bond network is shown as yellow lines between residues represented as sticks on the β-taco and thanatin respectively. Bottom: differential solvent contact plot between the apo-closed state and state in which thanatin is docked to the bottom of the β-taco with significant residues shown as sticks.
Peptides covering the central and terminal region of the β-taco displayed significant protection at all measured time points along with decreased EX1/EXX correlated exchange, suggesting a slower conformational opening of this domain (Fig. 2b, Extended Data Fig. 4, and Supplementary Fig. 4). Additionally, peptides covering the N-terminal region of LptD β-taco (27-42 and 27-45) displayed decreased D uptake in the presence of thanatin. Differently from the peptides covering the rest of the periplasmic domain, these segments follow the EX2 kinetics, leading us to the hypothesis that thanatin directly interacts with this region.
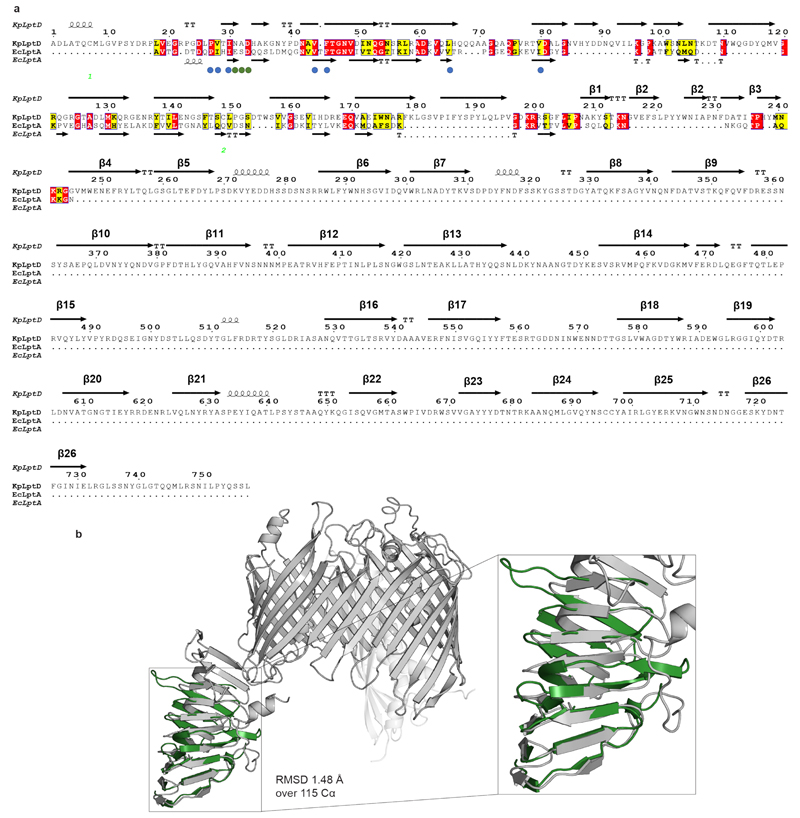
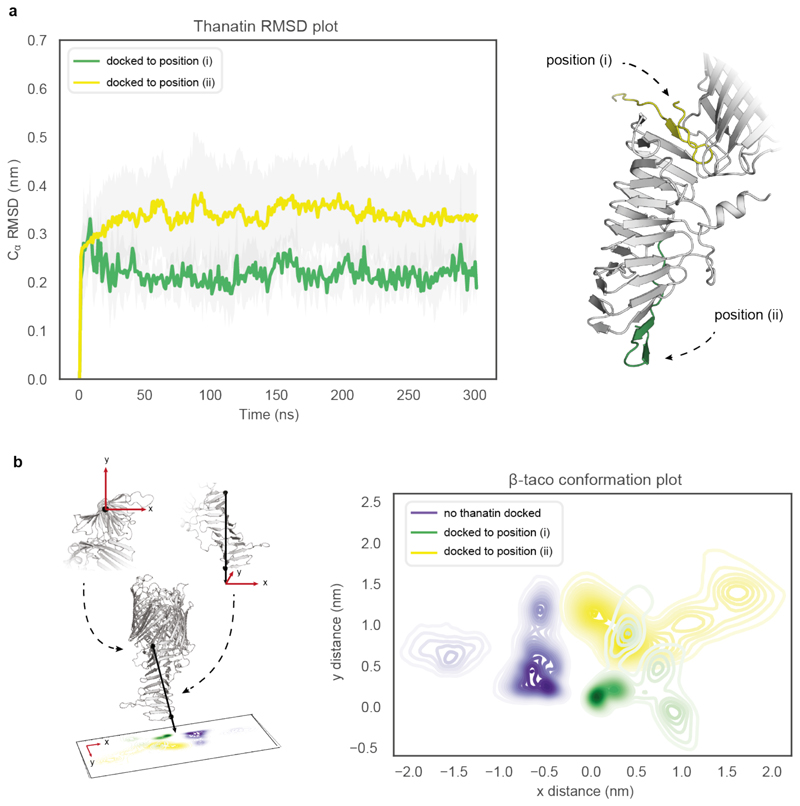
To assess thanatin binding mode, we performed sequence and structural alignments41 between LptD and EcLptA, which has been shown to bind thanatin on the N-terminus21. Key residues for LptA-thanatin interaction are retained at the LptD N-terminus (Extended Data Fig. 9a); moreover, we observed structural homology between the N-terminal regions of the two proteins (Extended Data Fig. 9b). We docked thanatin to either end of the β-taco in the closed state and assessed the stability of each docking pose. We observed that thanatin is less stable when bound to the top (i.e. the membrane-facing end; RMSD = 0.34 ± 0.1 nm) of the β-taco compared to the N-terminus (RMSD = 0.22 ± 0.05 nm). In addition, the N-terminal of β-taco itself deviates more from its original position in the crystal structure (distance = 1.13 ± 0.5 nm) when thanatin is docked at the top, compared to when it is bound to the N-terminus (distance = 0.65 ± 0.2 nm) (Extended Data Fig. 10). This suggests that the β-taco would have to shift extensively its conformation to accommodate thanatin at the top, making it less plausible for it to bind there. Additionally, differential solvent contact plot of thanatin bound to the bottom position in the closed state of the protein (Fig. 3b) revealed that the residues causing the N-terminal peptide to be protected are those that predominantly form H-bonds with thanatin (Val28, Ile30, Ala32, Asp33). Taken together, the HDX and MD results suggest that thanatin directly interacts with the N-terminal end of the β-taco, rather than the C-terminus. Hence, although we cannot exclude a contribution given by conformational changes, peptides covering this segment are likely protected because of the direct binding of thanatin.
Thanatin interferes with LPS-induced β-taco opening
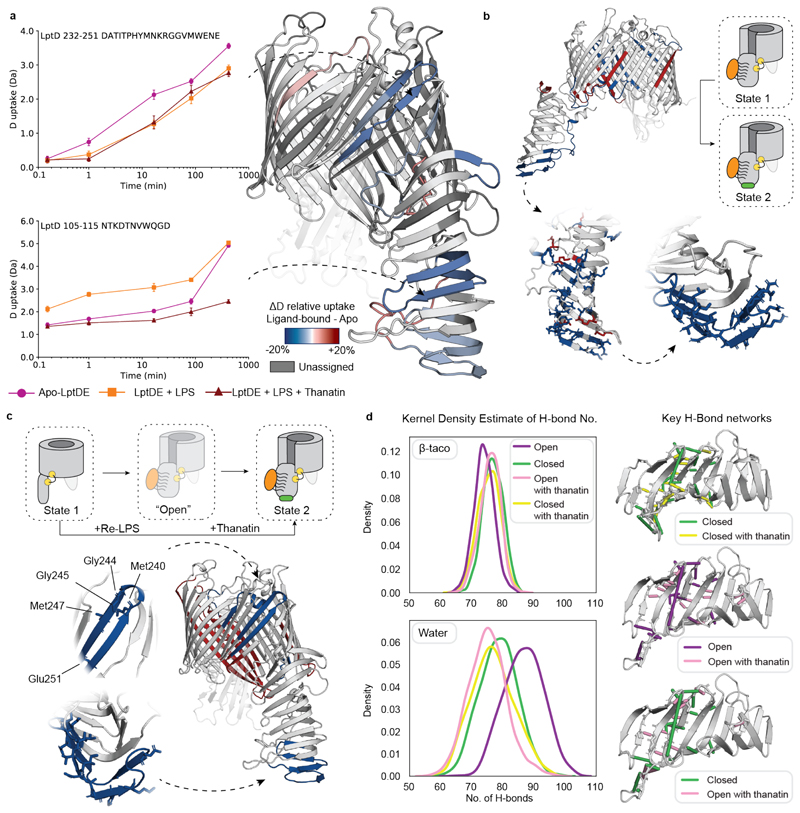
Incubation of LptDE with LPS (or Re-LPS) and subsequent addition of thanatin yielded an HDX profile of the β-taco similar to what we observed in the presence of thanatin only (Fig. 4a, Supplementary Figs. 2, 3e-f, and 7d-f), suggesting that the stabilising effect of thanatin is stronger than the substrate-induced opening. Notably, we also detected protection on β1-β2 and β3-β4 segments, similar to what was observed in the presence of LPS only. The decreased conformational dynamics of the LptD β-barrel suggests that substrate may still bind to LptD despite the presence of thanatin, in line with nMS experiments (Fig. 1d) and previous results suggesting that thanatin interacts with the N-terminus of the β-taco (Fig.3).
Figure 4. Conformational dynamics of LptDE in the presence of both LPS and thanatin.
(a) Left: the deuterium uptake of representative peptides (105-115, β-taco and 232-247, β-barrel) plotted as a function of labelling time for apo-LptDE (purple spheres) and LptDE in the presence of LPS (orange squares) or both LPS and thanatin (maroon triangles). Error bars indicate s.d. (nbiological = 2; ntechnical = 3). Right: difference in relative deuterium uptake (scaled for the number of residues of each peptide) at the 16.67 min labelling time mapped on the crystal structure of LptD. Only peptides showing significant difference are coloured. Red and blue indicate increased and decreased deuterium uptake, respectively. Detailed information of HDX-MS data is provided in Supplementary Table 2. (b) Top: differential solvent contact map between the open Re-LPS bound state with and without thanatin docked to the bottom of the β-taco. Bottom: comparison of the differential solvent map of the β-taco shown residue by residue (left) and averaged over experimentally determined peptides (right) where all significant residues are highlighted in a stick representation. (c) Top: cartoon schematic illustrating the comparison between the apo-closed state (1) and the open Re-LPS bound state (2) with thanatin docked. Bottom: HDX differential plot between states 1 and 2, with protected peptides highlighted on β-taco and β-barrel with significant residues labelled and shown as sticks. (d) Left: Kernel Density Estimate (KDE) distributions of H-bond frequency per frame of simulation for each state of the β-taco, considering the H-bond network on the β-taco itself (upper) and that which it makes with the solvent (lower). Right: H-bonds which are occupied more than 25% in one state compared to the other are shown, as indicated by the legends.
Next, we generated a differential solvent contact plot to establish how thanatin affects solvent uptake in the open Re-LPS bound state (Fig. 4b). The plot showed the N-terminus of the β-taco being protected as when LptDE was in its closed state (Fig. 3b). Moreover, a residue-by-residue analysis revealed that protection is present throughout the length of the β-taco (Fig. 4b). In line with these results, when comparing the Re-LPS + thanatin open state with LptD closed state (Fig. 4c) we noticed decreased solvent contacts in both β-taco (although Re-LPS still binds in this region) and β-barrel lateral gate, in agreement with the experimental data (Fig. 4a).
Assessment of the position and number of the H-bond network pertaining to the β-taco allows us to comment on future conformational changes associated with EX1 kinetics (unobservable by short MD timescales). Analysis of the number of H-bonds in the β-taco (Fig. 4d and Supplementary Fig. 18) indicates that Re-LPS binding causes a decrease in the number of backbone H-bonds while thanatin docking restores these H-bonds (Fig. 4d, left upper plot). Accordingly, the number of H-bonds made between the β-taco and solvent (Fig. 4d, left lower plot) increases from the closed state to the open (Re-LPS bound) state indicating that opening the β-taco weakens the internal H-bond network affording a greater propensity for global β-strand separation. Furthermore, the relative occupancy of the H-bonds within the β-taco changes in the different states where most of the H-bonds are between β-strands in the presence of thanatin (Fig. 4d, right). Hence, thanatin has a stabilizing influence through rearrangement of the H-bond network, propagating along several strands of the β-taco. This helps us to rationalise the global protection of the domain in both the closed (Fig. 3a) and open (Fig. 4a) states of the protein as well as the enhancement of EX1 kinetics observed in the substrate-bound state due to a greater proclivity for β-strand separation.
Discussion
The insertion of LPS in the outer leaflet of the OM is an essential step for Gram-negative bacteria membrane biogenesis. Mechanistic details of insertion process by LptDE and associated conformational dynamics upon substrate binding are largely unknown. Using nMS we showed that Re-LPS specifically binds to LptDE; moreover, the antimicrobial peptide thanatin does not impair the LptDE-LPS interaction and may also form a LptDE:Re-LPS:thanatin ternary complex (Fig. 1d). These results indicate that thanatin does not compete for the same binding site of LPS, but may act with another mechanism, such as allosteric modulation.
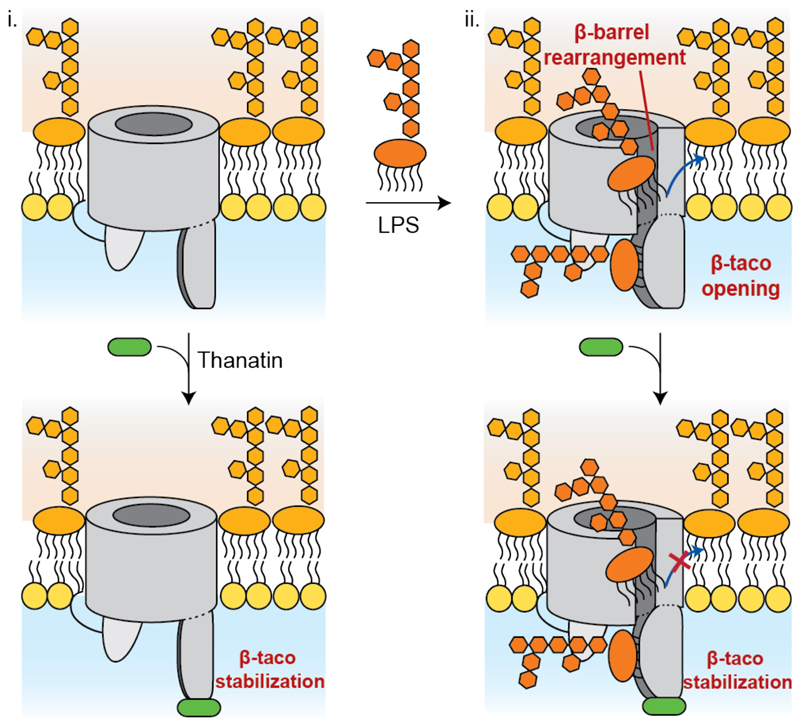
HDX-MS revealed an extended region in the periplasmic domain where peptides undergo correlated exchange denoting a slow concerted weakening of the H-bonds between the β strands defining the β-taco (Fig. 2a-b). The correlated exchange was enhanced by substrate which promotes the opening of the cavity of the β-taco and consequent breaking of the H-bonds between the β strands (Fig. 5, state ii, top). MD showed that Re-LPS binding inside the β-taco yields an open conformation promoting solvent exposure, particularly with residues that are directed towards the lipid (Fig. 2c). Considering these observations, we propose that the specific binding detected by nMS (Fig. 1d) is found in the hydrophobic pocket of the β-taco itself. Such a binding site would be largely unaffected by competing detergents, as confirmed by delipidation experiments on the Re-LPS bound complex (Extended Data Fig. 1).
Figure 5. Schematic of LptDE-mediated LPS insertion in the OM.
Starting from a putative apo form of LptDE (i), the interaction between LPS and LptDE determines β-taco opening to accommodate the substrate and consequent loosening of the β strands between β-26 and β-4. This conformational change creates enough space to accommodate an LPS molecule within the β-barrel (ii), allowing the insertion in the OM through the lateral exit gate. Thanatin may bind LptD at any point of the insertion process, thus obstructing LPS flow through the stabilisation of the β-taco.
Furthermore, the opening of the β-taco whilst maintaining the cysteine disulphide network on the β-barrel would appear to also open the lateral exit gate in the process (Fig. 5, state ii, top). Indeed, both HDX-MS and MD indicate protection on strands β1-β2 and β3-β4, adjacent to the putative LPS exit gate (Fig. 2a). The decreased dynamics is related to both direct interactions with the substrate (Asn241 and Gly245) and conformational fluctuations on the β-barrel, providing evidence that these rearrangements are necessary to accommodate the substrate. Interestingly, an equivalent degree of lateral opening in an OM protein was recently reported for the BAM complex in response to substrate binding42.
According to our data, apart from its protein-protein interaction disruption activity21, thanatin acts as non-competitive inhibitor of LPS transportation, through the binding on β-taco N-terminus and consequent stabilisation of this region (Fig. 5, state i, bottom). In the presence of both LPS and thanatin, the concomitant β-taco stabilisation and β1-β4 protection suggest simultaneous binding of the two ligands. We can therefore infer that the periplasmic domain of LptD is essentially in its closed state while the β-barrel undergoes the conformational changes characteristic of LPS interaction (Fig. 4). These findings support the idea that thanatin acts non-competitively to impair LPS translocation through stabilization of LptD periplasmic domain. Although this binding does not allow substrate sliding through the β-taco, LPS may still interact with LptD (Fig. 5, state ii, bottom).
Our results indicate a situation whereby LptDE binds multiple LPS molecules, in accordance with the proposed PEZ model, which suggests that the Lpt system is filled with LPS at any given time2. In summary, our findings provide a deeper understanding of the LPS insertion process in the OM, highlighting crucial residues and specific conformational fluctuations for domains that are critical for LPS transport and suggesting an additional mode of action for the antimicrobial peptide thanatin. In line with this, a successful strategy for antimicrobial drug discovery may involve the development of peptidomimetics obstructing the LPS flow across the periplasm, not only by acting as protein-protein interaction disruptors, but also by stabilising LptD in its ‘inactive’ state.
Online methods
Protein expression and purification
The plasmids used for over-expression of K. pneumoniae LptD and LptE were a kind gift from Susan Buchanan (NIH Bethesda).
Protein was cloned, expressed and purified adapting previously described protocols13. Amplified plasmids were co-transformed in E. coli BL21(DE3) (New England Biolabs) in order to co-express LptD and LptE. Cells were grown in LB media supplemented with 50 μg/ml kanamycin and 25 μg/ml streptomycin at 21 °C without IPTG induction until the culture reached stationary phase.
Cells were collected by centrifugation at 5,000xg for 10 min at 4 °C and resuspended in buffer containing 200 mM NaCl, 25 mM Tris-HCl (pH 7.5), EDTA-free protease inhibitor cocktail (Roche) and 10 μg/ml DNaseI. The cell suspension was passed several times through an M-110 PS microfluidizer (Microfluidics) at 15,000 psi. Insoluble material was pelleted by centrifugation at 20,000xg for 20 min at 4 °C. The supernatant was incubated with 2% (v/v) Triton X-100 for 30 min at 4°C and then ultracentrifuged at 200,000xg for 1 h to collect membrane fractions.
The protein was solubilized from the membrane fraction with 250 mM NaCl, 25 mM Tris-HCl (pH 7.5), 20% (v/v) glycerol, 5% (w/v) Elugent (Millipore Merck) for 16 h at 4°C. Insoluble material was removed by centrifugation at 20,000xg for 20 min at 4 °C. Supernatant was filtered before loading onto a 5 ml HisTrap-HP column (GE Healthcare, Piscataway, NJ) equilibrated in 200 mM NaCl, 25 mM Tris-HCl (pH 7.5), 10% (v/v) glycerol, 20 mM imidazole and 0.1% (w/v) dodecyl maltoside (DDM) (Anatrace). After the clarified supernatant was loaded, the column was initially washed with 50 ml of 200 mM NaCl, 25 mM Tris-HCl (pH 7.5), 10% (v/v) glycerol, 20 mM imidazole and 0.05% (w/v) DDM, and washed again with 50 ml of 200 mM NaCl, 25 mM Tris-HCl (pH 7.5), 10% (v/v) glycerol, 80 mM imidazole and 0.05% (w/v) DDM. The bound protein was eluted with 200 mM NaCl, 25 mM Tris-HCl (pH 7.5), 10% (v/v) glycerol, 300 mM imidazole and 0.03% (w/v) DDM. The protein was concentrated to 2.5 ml an Amicon Ultra-15 concentrator unit (Millipore) with a molecular cut-off of 100 kDa and buffer exchanged to 200 mM NaCl, 25 mM Tris-HCl (pH 7.5), 10% (v/v) glycerol and 0.03% (w/v) DDM using PD-10 desalting column. The sample was further concentrated and loaded onto the Superdex 200 Increase 10/300 GL size exclusion chromatography (SEC) column (GE Healthcare) pre-equilibrated with 200 mM NaCl, 25 mM Tris-HCl (pH 7.5), 10% (v/v) glycerol and 0.03% (w/v) DDM. Protein concentration was measured using a DS-11 FX Spectrophotometer (DeNovix).
Lipids and peptides preparation
Unless stated otherwise, all lipids [Kdo2-Lipid A (Re-LPS), 1-palmitoyl-2-oleoyl-sn-glycero-3-phospho-1'-rac-glycerol (16:0/18:1 PG, POPG), 1',3'-bis[1,2-dioleoyl-sn-glycero-3-phospho]-glycerol (18:1 cardiolipin, CDL)] used in this study were obtained from Avanti Polar Lipids powders and stock solutions were prepared following a previously established method31. LPS from K. pneumoniae (Sigma-Aldrich) was diluted in H2O to a stock concentration of 5 mg/ml. Thanatin was purchased from Biomatik and diluted in H2O to a stock concentration of 2.5 mM. Lipids and peptides were diluted in 200 mM AmAc supplemented with C8E4 for nMS experiments or 200 mM NaCl, 25 mM Tris-HCl (pH 7.5), 10% (v/v) glycerol and 0.03% (w/v) DDM for HDX-MS experiments.
Native MS experiments
Purified LptDE was buffer exchanged into MS Buffer (2x CMC of detergent of interest and 200 mM ammonium acetate) using a centrifugal buffer exchange device (Micro Bio-Spin 6, Bio-Rad) as previously described31. The best quality mass spectra were obtained using 0.5% (w/v) C8E4 (Anatrace) as detergent. The freshly buffer-exchanged proteins were kept on ice, with protein concentration measured as before.
The protein samples were diluted as desired in 200 mM ammonium acetate buffer with detergent as necessary and loaded into a gold-coated capillary Clark borosilicate capillary (Harvard Apparatus) prepared in the laboratory43. The experiments were performed using a Q-Exactive UHMR Hybrid Quadrupole-Orbitrap mass spectrometer (Thermo Fisher Scientific). Typically, 2 μl of buffer exchanged protein solution was electrosprayed from gold-plated borosilicate capillaries prepared in house. The instrument parameters for MS are: 1.2kV capillary voltage, S-lens RF 100%, quadrupole selection from 1,000 to 20,000 m/z range, collisional activation in the HCD cell 200 V, nitrogen UHV pressure 8.0x10⁻¹⁰ mbar and 100°C capillary temperature. The ion transfer optics in positive mode was set as follows: injection flatapole 5 V, inter-flatapole lens 4 V, bent flatapole 2 V, transfer multipole 0 V. The resolution of the instrument was 17,500 at m/z=200 (transient time of 64 ms). The noise level was set at 3 rather than the default value of 4.64. Calibration of the instruments was performed using 10 mg/ml solution of caesium iodide in water. Where required, baseline subtraction was performed to achieve a better-quality mass spectrum. Data were analysed using the Xcalibur 3.0 (Thermo Scientific) and UniDec (www.unidec.chem.ox.ac.uk)44 software packages. Theoretical and observed molecular masses of all species are described in Supplementary Table 1.
Lipid binding experiments
LPS and Re-LPS binding experiments were performed by diluting the lipids in 200 mM ammonium acetate supplemented with 0.5% (w/v) C8E4. To obtain the binding constant for the interaction between Re-LPS and LptDE, Re-LPS was added in increasing amounts while keeping the protein concentration constant. Peak intensities were extracted and the ratios of the intensity of the Re-LPS bound peak versus the total intensity of all observed species were calculated45. Average and s.d. of these ratios states from three independent experiments were plotted against Re-LPS concentration. The data were fitted globally using GraphPad Prism 8.0 with the equation Y=Bmax*X/(X+KD) where Bmax is the maximum specific binding in the same units as Y. Using our methods, we could not deduce the low-affinity KD for the second Re-LPS binding as higher concentrations of Re-LPS binding to the protein were impractical to measure using our mass spectrometry method due to associated decreases in spectral quality, and the potential for favouring the capturing of non-specific binding events through the electrospray process. Protein delipidation experiments were performed by adding 10 μM of the relevant lipid (Re-LPS, POPG, CDL) to 5 μM protein in 0.5% (w/v) C8E4 and supplementing the mixture with increasing concentrations of n-nonylβ-D-glucopyranoside (NG) (0, 0.5 and 1% (w/v) final NG concentration) as described previously34.
Thanatin binding experiments
Peptide binding experiments were performed by adding increasing concentration of thanatin to 5 μM LptDE. Effects of thanatin binding on Re-LPS binding were monitored by acquiring the mass spectra by adding a fixed amount of thanatin (1 μM) to the LptDERe-LPS complex obtained by adding increasing amount of Re-LPS (5 – 10 – 20 μM). The relative abundance of LptDE:Re-LPS species in the absence and in the presence of thanatin were plotted as a function of Re-LPS concentration. The effect of Re-LPS on thanatin binding was monitored by adding Re-LPS (10 μM) to the pre-formed LptDE-thanatin complex obtained by mixing thanatin (1 μM) with LptDE (5 μM). Average and s.d. from these nMS experiments were calculated from three independent experiments.
Hydrogen–deuterium exchange mass spectrometry (HDX-MS)
Prior to HDX labelling, purified LptDE was purified at a concentration of 20 μM and all ligands were diluted in equilibration buffer (200 mM NaCl, 25 mM Tris-HCl (pH 7.5), 10% (v/v) glycerol and 0.03% (w/v) DDM). In the case of LPS binding experiments it was incubated with LPS in 15-fold excess (considering an average MW of 4.5 kDa). The same molar ratio was used for the experiments in the presence of Re-LPS and POPG. In the case of thanatin, the peptide was added in a 1:1 molar ratio. All ligands were incubated for 1h at 4°C to allow equilibration before HDX labelling. In order to study thanatin effect on substrate binding to LptDE, LPS or Re-LPS were added in 15-fold excess, the protein-substrate mixture was equilibrated for 1h followed by the addition of thanatin (1:1 LptDE:thanatin ratio) and further 1h incubation at 4 °C.
The HDX reaction was initiated by a 12× dilution into deuterated buffer (0.03% (w/v) DDM, 200 mM NaCl, 25 mM Tris adjusted to pD 8 using DCl at 20 °C) resulting in a labelling solution ~92 % D2O. The labelling reaction was incubated for a time course of 10 s (0.1667 min), 60 s (1 min), 1000 s (16.67 min), 5000 s (83.33 min) and 7 hrs (420 min) at 20 °C and quenched with equal volume of ice cold quench buffer (200 mM NaCl, 25 mM Tris-HCl (pH 1.9), 0.03% (w/v) DDM, 15 mM TCEP).
The quenched sample was injected into a nanoACQUITY UPLC System (Waters) and online digested by Enzymate™ BEH Pepsin Column (2.1 x 30 mm, Waters) at 20 °C using an isocratic 0.1 % (v/v) formic acid-H2O solution (200 μL/min).
Peptide products were collected on a BEH C18 trap column (1.7 μm, 2.1 x 5 mm, Waters) at 0 °C for 3 minutes for de-salting. Peptides were then eluted from the trap column on to a BEH C18 analytical column (1.7 μm, 1 x 100 mm, Waters) for separation using a reverse-phase gradient. The mobile phase consisted of a H2O/MeCN +0.1% formic acid (v/v) linear gradient from 3% to 35% MeCN at a flow rate of 40 μL/min. Wash buffer (1.5 M guanidinium chloride pH 2.8, 4 % acetonitrile, 0.8% formic acid) was used to clean the pepsin column. To prevent peptide carry-over a wash and a blank injection runs were performed between each labelling experiment.
Following chromatographic separation, the peptides were injected in a hybrid ESI-Q-TOF mass spectrometer (Synapt G2-Si, Waters) for mass spectrometric analysis. MassLynx 4.1 (Waters) was used for controlling the mass spectrometer for the acquisition of MS and MS/MS data. Mass analysis was performed in in positive ion mode. MS/MS spectra were obtained using data-independent MSE mode. MS conditions were optimised to avoid H/D exchange in the step-wave source region leading to false EX1 kinetics46. MS conditions were as follows: capillary 2.8 kV, sample cone 30 V, source offset 30 V, trap activation 4 V, transfer activation 2 V. The source temperature was set to 80 °C and cone gas flow 80 L/hr, the desolvation temperature was 150 °C and the desolvation gas flow of 250 L/hr. Leucine Enkephalin was used as internal calibrant for mass accuracy correction and NaI was used for MS calibration. A summary for HDX experimental conditions is provided in Supplementary Tables 2-5 according to published guidelines35.
HDX-MS data analysis
Peptides from un-deuterated samples were analysed and identified by Protein Lynx Global Server 3.0 (Waters). Peptide identifications were filtered using DynamX (Waters), according to the following parameters: minimum and maximum peptide sequence length of 5 and 30, respectively, minimum fragmentation products per amino acid of 0.15, minimum MS/MS products of 3, maximum [MH]+ error of 5 ppm. Additionally, the peptides had to be identified in 50% of the acquired MS/MS files. Moreover, all the spectra were visually examined and only those with high signal to noise ratios were used for HDX-MS analysis.
The amount of relative deuterium uptake for each peptide was determined using DynamX 3.0 (Waters) and were not corrected for back exchange since analyses compared different states of the protein and there was no benefit from normalizing the data. Confidence intervals (CI) and Woods plots were generated using Deuteros software47; further statistical filters were applied as described below.
In the comparative HDX analyses on different ligand-binding states, a peptide was considered to have a significant difference in HDX at a certain time point if this difference was greater than the calculated CI for two consecutive time points and statistically significant based on a Student’s t-test (two-sided, unpaired, p < 0.01). As an exemption to this rule, a difference was also considered significant if the last time point (420 min) displayed a difference in HDX at least two times larger than the CI, since this may indicate an increasing difference not completely sampled by the HDX time course. HDX results were mapped onto the LptDE crystal structure (PDB ID: 5IV9) using PyMOL (Schrödinger LLC). Only significant differences were mapped onto the protein structure.
Spectra displaying bimodal distributions following the EX1 kinetics were quantified using HX-Express 2.048,49. In EX1 kinetics, the low-mass envelope represents those residues that have not yet undergone the conformational change required for exchange, while the high-mass population represents multiple backbone hydrogens that have already undergone the H-D exchange following the correlated conformational fluctuations50. Some of these peptides were amenable for quantitative analysis to extract kinetic constants, such as the rate of conformational opening (kop) and the half-life of the closed state (t1/2). The relative abundances of high- and low-mass populations were calculated as described previously48,49 and the high-mass population relative abundance was fitted to an exponential equation:
where y is the fractional abundance of the high-mass population and t is the labelling time. The initial y intercept (y0) accounts for the fact that all peptides showing EX1 or EXX kinetics start with an initial open population; the plateau parameter (P) is set to be 1 at maximum. In the case of thanatin and thanatin + LPS states, we could not extract kinetic values since the exponential function could not fit the data. This may be explained by the fact that the growth in the relative abundance of the high-mass population between early and late time points is incremental.
GraphPad Prism 8 software (GraphPad, San Diego) was used to extract the best-fit values for the kinetic parameters (kop and the t1/2 of the closed state).
Analytical SEC
LptDE samples were incubated at 20 °C in equilibration buffer (200 mM NaCl, 25 mM Tris-HCl (pH 7.5), 10% (v/v) glycerol and 0.03% (w/v) DDM). After 0, 60 or 420 min the samples were subjected to size-exclusion chromatography on a Superdex 200 Increase 10/300 GL column (GE Healthcare) preequilibrated with the equilibration buffer. UNICORN 7.0 (GE Healthcare) was used to process analytical SEC data.
Structure and sequence alignment
Sequence alignment was performed using the NPS@ClustalW51 web service and rendered using the ESPript 3.0 web service41. Structure alignment between LptD (PDB ID: 5IV9) and apo-LptA (PDB ID: 2R1A) was performed using PyMOL and the TopMatch web service52.
Molecular Dynamics
Modelling
The open Re-LPS state of LptDE
As there is not currently a structure that describes the open state for either the β-taco and the β-barrel of LptD we sought to produce an open-state model of KpLptDE based on the current structure of its closed state (PDB ID: 5IV9). The hydrophobic groove of the β-taco domain of KpLptD is too constricted to allow the binding of Re-LPS, however other structures (e.g. PDB ID: 4Q35 from Shigella flexneri) have shown that detergents, N,N-dimethyldodecylamine N-oxide (LDAO) and C8E4 are able to bind to this site. We therefore used the detergents to guide the position of a Re-LPS molecule within the groove, with the six acyl tails binding internally, and the KDO sugars directed towards the solvent. The β-taco was opened by alchemically inserting one Re-LPS lipid within the hydrophobic groove by inverting the alchembed methodology to grow the lipid within the protein, rather than the protein within a lipid membrane39. This permitted the β-taco to gradually open while retaining the overall tertiary and secondary structures, until sufficiently wide (~2.0 nm across) to accommodate Re-LPS without steric clashes.
For the β-barrel domain, we initially considered previous simulations of the open-state of the β-barrel of LptD from Salmonella typhimurium, where the lateral gate was opened by applying a negative pressure of -100 bar within the membrane plane12. This provides a range of states that describe the open lateral exit gate. We used these templates to create a series of KpLptDE models with different distances between the β1 and β26 strands. For our preliminary simulations of the open state, we chose a distance of 2.0 nm that would be sufficient to enable a single Re-LPS molecule to be laterally inserted through the exit gate. This is equivalent to the of β1-β16 strands separation observed for the BAM machinery for OMP insertion42. Through structural alignments of the open state models for both β-taco and β-barrel with the closed state structure, it was noted that the extent of domain opening was similar. This is a consequence of synchronized motions between domains given by the disulfide bonds (Cys7-Cys696 and Cys149-Cys697), in addition to the unzipping of the β1- β26 strands on interaction of the Re-LPS with the luminal gate15.
Docking thanatin to β-taco domain of LptDE
Thanatin was bound to LptD (PDB ID: 5IV9) by structurally aligning the LptA-thanatin complex (PDB ID: 6GD5) using PyMOL with hydrogen-bonds retained between the β-taco and the antibiotic. The coordinates of thanatin were then extracted and included with those of LptD to both the N- and C-terminal of the β-taco.
Atomistic simulations
All simulations not requiring PLUMED were run using GROMACS 2019.153. Initially, all states of the LptDE complex were first converted to a coarse-grain (CG) representation using the Martinize python script54 and individually embedded in a bilayer using INSANE55. The outer leaflet contained pure Re-LPS and the inner leaflet was composed of cardiolipin, POPG and POPE to a 1:2:7 ratio. Elastic bonds were applied between protein beads, between 5 and 10 Å apart, with a force of 1,000 kJ mol-1 nm-2. The systems were solvated in a box with martini water and sodium and chloride ions for charge neutrality at a concentration of 0.15 M. Following this, systems were energy minimised using the steepest descents method to a target force of 1,000 kJ mol-1 nm-1. CG simulations were run with the Martini 2.2 forcefield54 for 100 ns using 20 fs time steps. The final snapshots of the 100 ns equilibration were converted back to atomistic (AT) resolution with the AT protein structure aligned with the CG coordinates within the equilibrated bilayer56. Upon AT conversion, systems were further equilibrated for 1 ns, with position restraints applied to the protein and described by the CHARMM36 forcefield57. Finally, production simulations were run for 300 ns without restraints (with 2 fs time steps) in explicit TIP3P water, using the V-rescale thermostat at 310 K and semi-isotropic Parrinello-Rahman pressure coupling at 1 atm58. For each state of the LptDE complex five replicates with different initial seeds were run.
All simulations using PLUMED40 were run with GROMACS 2018.653. For those states of the protein complex requiring an open β-barrel PLUMED upper and lower walls were applied to the putative lateral gate at a distance of 2.25 nm and 2.75 nm respectively, applied on the post 150 ns equilibrated LptDE open systems. These restraints were added to already equilibrated simulations, requiring only a further 50ns equilibration for convergence (Supplementary Fig. 15b). These constraints were imposed between the centre of mass of grouped Ca atoms from residues Asn208, Ala209, Lys210 and Tyr211 on β1 and Thr725, Phe726, Gly727 and Ile728 on β26. The wall restraint was set to a force constant of 10,000 kJ mol-1 with the default exponent, offset and rescaling factors.
Differential solvent uptake analysis
Solvent contacts based on a cut-off distance of 0.4 nm were calculated between the oxygen of the water and the nitrogen of the protein backbone using a modified MDAnalysis contact script, as a proxy for HDX59. The solvent contact data from apo and ligand-bound states of the LptDE complex were averaged for each residue between replicates for both states, with the averaged ligand-bound state subtracted from the averaged apo state. This produces an average differential solvent contact value for each residue. The confidence intervals are calculated using a two tailed test using a 95% significance level in much the same way as the Deuteros software47. Significant residues are extracted and mapped onto the structure as B-factors, then subsequently visualised in PyMOL. Red and blue indicate increased and decreased water contacts, respectively
Once the average differential solvent contact value for each residue was calculated, these values were averaged over the same peptide coverage map as obtained by the HDX experiments described above. For simplicity, ‘cleavage sites’ are recognised only when there is no overlap and areas which are not resolved by experiment are not considered for the analysis. Calculating confidence intervals and mapping peptides considered to be statistically significant is conducted in the same manner as the above.
Extended Data
Extended Data Figure 1. Detergent competition experiments to assess LptDE lipid binding.
LptDE (5 μM, left) in 0.5% (w/v) C8E4 was mixed with 10 μM Re-LPS (a, orange adducts), POPG (b, red adducts) or CDL (c, magenta adducts). The protein-lipid mixture was then supplemented with increasing concentrations of n-nonyl-β-D-glucopyranoside (NG). Detergent addition decreases POPG and CDL binding, but has no pronounced effect on Re-LPS.
Extended Data Figure 2. Thanatin binding efficiency and effect on Re-LPS binding.
(a) Mass spectra recorded for solutions of LptDE (5 μM) with increasing concentrations of thanatin (green adducts). (b) Mass spectra of Re-LPS-bound LptDE supplemented with 1 μM thanatin (as described in Fig. 1d) with a focus on the 16+ charge state showing the presence of the 2:1 Re-LPS:thanatin complex, particularly at higher Re-LPS concentration. (c) Quantification of the total amount of Re-LPS bound to LptDE in the absence or in the presence of thanatin (related to Figure 1d). Error bars represent s.d. (n = 3). (d) Thanatin-first nMS analysis: LptDE (5 μM) was initially mixed with thanatin and then supplemented with Re-LPS (10 μM).
Extended Data Figure 3. Sequence coverage of LptDE.
68 peptides covering 70.5% of LptD sequence (a) and 17 peptides covering 87.4% of LptE (b) were identified following digestion with immobilized pepsin.
Extended Data Figure 4. Representative mass spectra for peptides showing EX1/EXX kinetics.
Mass spectra are shown for apo-LptDE, LPS, thanatin or LPS + thanatin states. Two binomial isotopic envelopes produced the best fit for the spectra yielding low- (green) and high-mass (light blue) populations. The sums of the two binomial distributions are shown in red. (a) Peptide 66-92. (b) Peptide 105-115. (c) Peptide 116-19. (d) Peptide 119-129. (e) Peptide 130-141. (f) Peptide 171-179.
Extended Data Figure 5. Monoexponential fitting of the high-mass population in peptides showing EX1 kinetics.
Extracted relative abundances of high- mass populations plotted as a function of labelling time and fitted to a single exponential function with a variable intercept and plateau (to account for the lack of saturation seen in most peptides) to obtain the rate of translation from the low-mass population to the high-mass population (kop) and the half-life of the low mass population (t1/2). The apo state is indicated in purple, LPS-bound state in orange, thanatin-bound state in green, and LPS + thanatin state in maroon. Standard deviations are plotted as error bars (nbiological = 2; ntechnical = 3) but are in some instances too small to be visible. In the case of thanatin-bound state and LPS + thanatin state kinetic values could not be extracted because of poor fitting (the increase of high-mass population is incremental given the slow kinetics). In these cases, the dotted line is included only for visual guidance.
Extended Data Figure 6. Re-LPS contacts and position within the β-taco.
(a) Average percentage occupancy of Re-LPS contacts made with the β-taco with a 4 Å cut-off. These contacts have been compared to those made by the detergent in the SfLptD structure (PDB ID: 4Q35; marked by an asterisk) and found that 90% of residues which interact with detergent. (b) Top: Kernel density estimate (KDE) of the centre of mass (COM) position between the five replicates indicate minimal diffusion over the course of the simulation. Middle: Partial density of Re-LPS across the β-taco demonstrating consistent and rigid contact across the domain, this implies that the Re-LPS bound within the β-taco does not have enough simulation time to sample the entire soluble domain in different binding poses, which would account for the discrepancy in deprotected coverage across this domain when compared to HDX-MS (Supplementary Fig. 15). Bottom: reference cartoon structure of β-taco to compare with above plot axes.
Extended Data Figure 7. Re-LPS contact mapped onto LptDE.
(a) Average Re-LPS contacts mapped onto cartoon representations of LptDE. (b) Residues interacting with the three Re-LPS lipids referenced in Figure 2c (Re-LPS(1-3)) are shown in stick representation. (c) C-terminal strand of the βtaco is in contact with the bilayer (Supplementary Fig. 15c). (d) Ile186 and Phe187 are in transient contact with the Re-LPS lipids engaged with the lateral putative exit gate of the β-barrel. The open gate causes Re-LPS lipids (shown in yellow and pink) to be laterally pulled into the β-barrel sinking them into the inner leaflet of the and allowing the tails to interact with the C-terminal strand of the β-taco. This may suggest how Re-LPS gets laterally extruded into the OM during the translocation process.
Extended Data Figure 8. Re-LPS distance plots.
Top: snapshot of the key lipid interactions between Re-LPS and the lateral gate peptide (232-251). Bottom: Plots measuring the distance from the geometric centre of the peptide (232-251) to the geometric centre of the lipids. Data plotted as the average of five repeats throughout the course of the simulation, standard deviation shaded grey.
Extended Data Figure 9. Sequence and structure alignments of Kp LptD and Ec LptA.
(a) Sequence alignment between KpLptD and EcLptA. Red colour indicates conserved residues, yellow indicates highly similar residues. Circles indicate crucial residues for LptA-thanatin interaction. Blue colour represents van-der-Waals interactions while green represents ionic bridges and H-bonds. (b) Structure alignment of LptD (PDB ID: 5IV9) with apo-LptA (PDB ID: 2R1A). The RMSD is equal to 1.48 Å over 115 Cα.
Extended Data Figure 10. Evaluation of LptD-thanatin interaction stability.
(a) RMSD of thanatin docked to the bottom (i) of the β-jellyroll in its closed conformation compared to being docked to the top (ii) where standard deviation is coloured grey. (b) Right: schematic showing the orientation of the β-taco vector drawn through Ca of residues Asp33 and Pro190, where x, y displacement is shown as red arrows. Right: x,y displacement of the β-taco vector mapped relative to the origin 0.0, 0.0 (defined as the original position of β-taco in the crystal structure) comparing the conformation space sampled of the apo-β-taco against when thanatin is docked to the (i) bottom and (ii) top of the β-taco.
Supplementary Material
Acknowledgements
Research in the C.V.R. laboratory is supported by a Medical Research Council program grant (MR/N020413/1), a European Research Council Advanced Grant ENABLE (695511), and a Wellcome Trust Senior Investigator Award (104633/Z/14/Z). Research in P.J.S.’s lab is funded by Wellcome (208361/Z/17/Z), the MRC (MR/S009213/1) and BBSRC (BB/P01948X/1, BB/R002517/1 and BB/S003339/1). This project made use of time on ARCHER and JADE granted via the UK High-End Computing Consortium for Biomolecular Simulation, HECBioSim. P.J.S. acknowledges Athena at HPC Midlands+, funded by the EPSRC on grant EP/P020232/1, and the University of Warwick Scientific Computing Research Technology Platform for computational access. F.F. holds a SABS CDT studentship supported by the EPSRC and MRC (EP/L016044/1). J.B.S. is supported by the Oxford interdisciplinary DTP and the Biotechnology and Biological Sciences Research Council (BBSRC) (BB/M011224/1). We also thank Dr. Sthitadhi Roy (University of Oxford) for his help with HDX-MS data analysis and rendering.
Footnotes
Authors contributions
F.F., J.R.B., P.J.S. and C.V.R. designed the research. F.F. expressed and purified the protein samples and performed all nMS measurements. F.F. and J.R.B. analysed nMS data. F. F. and X.Q. collected HDXMS data. F.F. analysed and interpreted HDX-MS data with the help of X.Q., J.R.B., and S.M. J.B.S. performed the MD simulations with the assistance of P.J.S, who modelled the initial substrate-bound LptDE states with B.M.-W. J.B.S. analysed MD simulations data with the help of R.A.C., C.K.C., and P.J.S. F.F., J.B.S., R.A.C., C.K.C., J.R.B., P.J.S., and C.V.R. wrote the manuscript. All authors discussed the results and commented on the manuscript.
Competing interests
C.V.R. is a co-founder and consultant at OMass Therapeutics.
Data availability
Data supporting the findings of this study are available from the corresponding authors upon reasonable request. HDX-MS raw data and the HDX data tables have been deposited to the ProteomeXchange Consortium via the PRIDE60 partner repository with the dataset identifier PXD021743.
The structural models employed in this study are accessible through the PDB (https://www.rcsb.org/) under accession numbers 5IV9 (KpLptDE), 5XO4 (thanatin), 2R1A (EcLptA), 6GD5 (EcLptA-thanatin complex), 4Q35 (SfLptDE).
References
- 1.Whitfield C, Trent MS. Biosynthesis and export of bacterial lipopolysaccharides. Ann Rev Biochem. 2014;83:99–128. doi: 10.1146/annurev-biochem-060713-035600. [DOI] [PubMed] [Google Scholar]
- 2.Okuda S, Sherman DJ, Silhavy TJ, Ruiz N, Kahne D. Lipopolysaccharide transport and assembly at the outer membrane: the PEZ model. Nat Rev Microbiol. 2016;14:337–345. doi: 10.1038/nrmicro.2016.25. [DOI] [PMC free article] [PubMed] [Google Scholar]
- 3.Ruiz N, Kahne D, Silhavy TJ. Transport of lipopolysaccharide across the cell envelope: the long road of discovery. Nat Rev Microbiol. 2009;7:677–683. doi: 10.1038/nrmicro2184. [DOI] [PMC free article] [PubMed] [Google Scholar]
- 4.Luo Q, et al. Structural basis for lipopolysaccharide extraction by ABC transporter LptB2FG. Nat Struct Mol Biol. 2017;24:469–474. doi: 10.1038/nsmb.3399. [DOI] [PubMed] [Google Scholar]
- 5.Li Y, Orlando BJ, Liao M. Structural basis of lipopolysaccharide extraction by the LptB2FGC complex. Nature. 2019;567:486–490. doi: 10.1038/s41586-019-1025-6. [DOI] [PMC free article] [PubMed] [Google Scholar]
- 6.Tang X, et al. Cryo-EM structures of lipopolysaccharide transporter LptB2FGC in lipopolysaccharide or AMP-PNP-bound states reveal its transport mechanism. Nat Commun. 2019;10:4175. doi: 10.1038/s41467-019-11977-1. [DOI] [PMC free article] [PubMed] [Google Scholar]
- 7.Owens TW, et al. Structural basis of unidirectional export of lipopolysaccharide to the cell surface. Nature. 2019;567:550–553. doi: 10.1038/s41586-019-1039-0. [DOI] [PMC free article] [PubMed] [Google Scholar]
- 8.Villa R, et al. The Escherichia coli Lpt transenvelope protein complex for lipopolysaccharide export is assembled via conserved structurally homologous domains. J Bacteriol. 2013;195:1100–1108. doi: 10.1128/jb.02057-12. [DOI] [PMC free article] [PubMed] [Google Scholar]
- 9.Chng SS, Ruiz N, Chimalakonda G, Silhavy TJ, Kahne D. Characterization of the two-protein complex in Escherichia coli responsible for lipopolysaccharide assembly at the outer membrane. Proc Natl Acad Sci U S A. 2010;107:5363–5368. doi: 10.1073/pnas.0912872107. [DOI] [PMC free article] [PubMed] [Google Scholar]
- 10.Freinkman E, Chng SS, Kahne D. The complex that inserts lipopolysaccharide into the bacterial outer membrane forms a two-protein plug-and-barrel. Proc Natl Acad Sci U S A. 2011;108:2486–2491. doi: 10.1073/pnas.1015617108. [DOI] [PMC free article] [PubMed] [Google Scholar]
- 11.Qiao S, Luo Q, Zhao Y, Zhang XC, Huang Y. Structural basis for lipopolysaccharide insertion in the bacterial outer membrane. Nature. 2014;511:108–111. doi: 10.1038/nature13484. [DOI] [PubMed] [Google Scholar]
- 12.Dong H, et al. Structural basis for outer membrane lipopolysaccharide insertion. Nature. 2014;511:52–56. doi: 10.1038/nature13464. [DOI] [PubMed] [Google Scholar]
- 13.Botos I, et al. Structural and Functional Characterization of the LPS Transporter LptDE from Gram-Negative Pathogens. Structure. 2016;24:965–976. doi: 10.1016/j.str.2016.03.026. [DOI] [PMC free article] [PubMed] [Google Scholar]
- 14.Li X, Gu Y, Dong H, Wang W, Dong C. Trapped lipopolysaccharide and LptD intermediates reveal lipopolysaccharide translocation steps across the Escherichia coli outer membrane. Sci Rep. 2015;5 doi: 10.1038/srep11883. 11883. [DOI] [PMC free article] [PubMed] [Google Scholar]
- 15.Gu Y, et al. Lipopolysaccharide is inserted into the outer membrane through an intramembrane hole, a lumen gate, and the lateral opening of LptD. Structure. 2015;23:496–504. doi: 10.1016/j.str.2015.01.001. [DOI] [PMC free article] [PubMed] [Google Scholar]
- 16.World Health Organization. Global priority list of antibiotic-resistant bacteria to guide research, discovery, and development of new antibiotics. 2017 http://www.who.int/medicines/publications/global-priority-list-antibiotic-resistantbacteria/en/ [Google Scholar]
- 17.Srinivas N, et al. Peptidomimetic Antibiotics Target Outer-Membrane Biogenesis in Pseudomonas aeruginosa. Science. 2010;327:1010–1013. doi: 10.1126/science.1182749. [DOI] [PubMed] [Google Scholar]
- 18.Andolina G, et al. A Peptidomimetic Antibiotic Interacts with the Periplasmic Domain of LptD from Pseudomonas aeruginosa. ACS Chem Biol. 2018;13:666–675. doi: 10.1021/acschembio.7b00822. [DOI] [PubMed] [Google Scholar]
- 19.Werneburg M, et al. Inhibition of lipopolysaccharide transport to the outer membrane in Pseudomonas aeruginosa by peptidomimetic antibiotics. ChemBioChem. 2012;13:1767–1775. doi: 10.1002/cbic.201200276. [DOI] [PubMed] [Google Scholar]
- 20.Fehlbaum P, et al. Structure-activity analysis of thanatin, a 21-residue inducible insect defense peptide with sequence homology to frog skin antimicrobial peptides. Proc Natl Acad Sci U S A. 1996;93:1221–1225. doi: 10.1073/pnas.93.3.1221. [DOI] [PMC free article] [PubMed] [Google Scholar]
- 21.Vetterli SU, et al. Thanatin targets the intermembrane protein complex required for lipopolysaccharide transport in Escherichia coli. Sci Adv. 2018;4 doi: 10.1126/sciadv.aau2634. eaau2634. [DOI] [PMC free article] [PubMed] [Google Scholar]
- 22.Bolla JR, et al. Direct observation of the influence of cardiolipin and antibiotics on lipid II binding to MurJ. Nat Chem. 2018;10:363–371. doi: 10.1038/nchem.2919. [DOI] [PMC free article] [PubMed] [Google Scholar]
- 23.Fiorentino F, Bolla JR, Mehmood S, Robinson CV. The Different Effects of Substrates and Nucleotides on the Complex Formation of ABC Transporters. Structure. 2019;27:651–659. doi: 10.1016/j.str.2019.01.010. [DOI] [PMC free article] [PubMed] [Google Scholar]
- 24.Yen HY, et al. PtdIns(4,5)P2 stabilizes active states of GPCRs and enhances selectivity of G-protein coupling. Nature. 2018;559:423–427. doi: 10.1038/s41586-018-0325-6. [DOI] [PMC free article] [PubMed] [Google Scholar]
- 25.Bolla JR, Howes AC, Fiorentino F, Robinson CV. Assembly and regulation of the chlorhexidine-specific efflux pump AceI. Proc Natl Acad Sci U S A. 2020;117:17011–17018. doi: 10.1073/pnas.2003271117. [DOI] [PMC free article] [PubMed] [Google Scholar]
- 26.Martens C, et al. Direct protein-lipid interactions shape the conformational landscape of secondary transporters. Nat Commun. 2018;9:4151. doi: 10.1038/s41467-018-06704-1. [DOI] [PMC free article] [PubMed] [Google Scholar]
- 27.Nielsen AK, et al. Substrate-induced conformational dynamics of the dopamine transporter. Nat Commun. 2019;10:2714. doi: 10.1038/s41467-019-10449-w. [DOI] [PMC free article] [PubMed] [Google Scholar]
- 28.Landreh M, et al. Integrating mass spectrometry with MD simulations reveals the role of lipids in Na(+)/H(+) antiporters. Nat Commun. 2017;8:13993–13993. doi: 10.1038/ncomms13993. [DOI] [PMC free article] [PubMed] [Google Scholar]
- 29.Skinner JJ, et al. Benchmarking all-atom simulations using hydrogen exchange. Proc Natl Acad Sci U S A. 2014;111:15975–15980. doi: 10.1073/pnas.1404213111. [DOI] [PMC free article] [PubMed] [Google Scholar]
- 30.Persson F, Halle B. How amide hydrogens exchange in native proteins. Proc Natl Acad Sci U S A. 2015;112 doi: 10.1073/pnas.1506079112. 10383. [DOI] [PMC free article] [PubMed] [Google Scholar]
- 31.Laganowsky A, Reading E, Hopper JT, Robinson CV. Mass spectrometry of intact membrane protein complexes. Nat Protoc. 2013;8:639–651. doi: 10.1038/nprot.2013.024. [DOI] [PMC free article] [PubMed] [Google Scholar]
- 32.Raetz C R, et al. Kdo2-Lipid A of Escherichia coli, a defined endotoxin that activates macrophages via TLR-4. J Lipid Res. 2006;47:1097–1111. doi: 10.1194/jlr.M600027-JLR200. [DOI] [PubMed] [Google Scholar]
- 33.Xie R, Taylor RJ, Kahne D. Outer Membrane Translocon Communicates with Inner Membrane ATPase To Stop Lipopolysaccharide Transport. J Am Chem Soc. 2018;140:12691–12694. doi: 10.1021/jacs.8b07656. [DOI] [PMC free article] [PubMed] [Google Scholar]
- 34.Bolla JR, et al. A Mass-Spectrometry-Based Approach to Distinguish Annular and Specific Lipid Binding to Membrane Proteins. Angew Chem Int Ed Engl. 2020;59:3523–3528. doi: 10.1002/anie.201914411. [DOI] [PMC free article] [PubMed] [Google Scholar]
- 35.Masson G R, et al. Recommendations for performing, interpreting and reporting hydrogen deuterium exchange mass spectrometry (HDX-MS) experiments. Nat Methods. 2019;16:595–602. doi: 10.1038/s41592-019-0459-y. [DOI] [PMC free article] [PubMed] [Google Scholar]
- 36.Lundquist KP, Gumbart JC. Presence of substrate aids lateral gate separation in LptD. Biochim Biophys Acta Biomembr. 2020;1862 doi: 10.1016/j.bbamem.2019.07.013. 183025. [DOI] [PMC free article] [PubMed] [Google Scholar]
- 37.Merkle PS, et al. Substrate-modulated unwinding of transmembrane helices in the NSS transporter LeuT. Sci Adv. 2018;4 doi: 10.1126/sciadv.aar6179. eaar6179. [DOI] [PMC free article] [PubMed] [Google Scholar]
- 38.Zhou J, et al. Conformational dynamics of 1-deoxy-d-xylulose 5-phosphate synthase on ligand binding revealed by H/D exchange MS. Proc Natl Acad Sci U S A. 2017;114:9355–9360. doi: 10.1073/pnas.1619981114. [DOI] [PMC free article] [PubMed] [Google Scholar]
- 39.Jefferys E, Sands ZA, Shi J, Sansom MSP, Fowler PW. Alchembed: A Computational Method for Incorporating Multiple Proteins into Complex Lipid Geometries. J Chem Theory Comput. 2015;11:2743–2754. doi: 10.1021/ct501111d. [DOI] [PMC free article] [PubMed] [Google Scholar]
- 40.Bonomi M, et al. PLUMED: A portable plugin for free-energy calculations with molecular dynamics. Comput Phys Commun. 2009;180:1961–1972. doi: 10.1016/j.cpc.2009.05.011. [DOI] [Google Scholar]
- 41.Robert X, Gouet P. Deciphering key features in protein structures with the new ENDscript server. Nucleic Acids Res. 2014;42:W320–324. doi: 10.1093/nar/gku316. [DOI] [PMC free article] [PubMed] [Google Scholar]
- 42.Tomasek D, et al. Structure of a nascent membrane protein as it folds on the BAM complex. Nature. 2020;583:473–478. doi: 10.1038/s41586-020-2370-1. [DOI] [PMC free article] [PubMed] [Google Scholar]
- 43.Hernandez H, Robinson CV. Determining the stoichiometry and interactions of macromolecular assemblies from mass spectrometry. Nat Protoc. 2007;2:715–726. doi: 10.1038/nprot.2007.73. [DOI] [PubMed] [Google Scholar]
- 44.Marty MT, et al. Bayesian deconvolution of mass and ion mobility spectra: from binary interactions to polydisperse ensembles. Anal Chem. 2015;87:4370–4376. doi: 10.1021/acs.analchem.5b00140. [DOI] [PMC free article] [PubMed] [Google Scholar]
- 45.Cubrilovic D, et al. Determination of protein-ligand binding constants of a cooperatively regulated tetrameric enzyme using electrospray mass spectrometry. ACS Chem Biol. 2014;9:218–226. doi: 10.1021/cb4007002. [DOI] [PubMed] [Google Scholar]
- 46.Guttman M, et al. Tuning a High Transmission Ion Guide to Prevent Gas-Phase Proton Exchange During H/D Exchange MS Analysis. J Am Soc Mass Spectrom. 2016;27:662–668. doi: 10.1007/s13361-015-1330-8. [DOI] [PMC free article] [PubMed] [Google Scholar]
- 47.Lau AMC, Ahdash Z, Martens C, Politis A. Deuteros: software for rapid analysis and visualization of data from differential hydrogen deuterium exchange-mass spectrometry. Bioinformatics. 2019;35:3171–3173. doi: 10.1093/bioinformatics/btz022. [DOI] [PMC free article] [PubMed] [Google Scholar]
- 48.Weis DD, Engen JR, Kass IJ. Semi-automated data processing of hydrogen exchange mass spectra using HX-Express. J Am Soc Mass Spectrom. 2006;17:1700–1703. doi: 10.1016/j.jasms.2006.07.025. [DOI] [PubMed] [Google Scholar]
- 49.Guttman M, Weis DD, Engen JR, Lee KK. Analysis of overlapped and noisy hydrogen/deuterium exchange mass spectra. J Am Soc Mass Spectrom. 2013;24:1906–1912. doi: 10.1007/s13361-013-0727-5. [DOI] [PMC free article] [PubMed] [Google Scholar]
- 50.Konermann L, Pan J, Liu YH. Hydrogen exchange mass spectrometry for studying protein structure and dynamics. Chem Soc Rev. 2011;40:1224–1234. doi: 10.1039/c0cs00113a. [DOI] [PubMed] [Google Scholar]
- 51.Thompson JD, Higgins DG, Gibson TJ, CLUSTAL W. improving the sensitivity of progressive multiple sequence alignment through sequence weighting, position-specific gap penalties and weight matrix choice. Nucleic Acids Res. 1994;22:4673–4680. doi: 10.1093/nar/22.22.4673. [DOI] [PMC free article] [PubMed] [Google Scholar]
- 52.Wiederstein M, Sippl MJ. TopMatch-web: pairwise matching of large assemblies of protein and nucleic acid chains in 3D. Nucleic Acids Res. 2020;48:W31–W35. doi: 10.1093/nar/gkaa366. [DOI] [PMC free article] [PubMed] [Google Scholar]
- 53.Abraham MJ, et al. GROMACS: High performance molecular simulations through multi-level parallelism from laptops to supercomputers. SoftwareX. 2015;1-2:19–25. doi: 10.1016/j.softx.2015.06.001. [DOI] [Google Scholar]
- 54.Monticelli L, et al. The MARTINI Coarse-Grained Force Field: Extension to Proteins. J Chem Theory Comput. 2008;4:819–834. doi: 10.1021/ct700324x. [DOI] [PubMed] [Google Scholar]
- 55.Wassenaar TA, Ingólfsson HI, Böckmann RA, Tieleman DP, Marrink SJ. Computational Lipidomics with insane: A Versatile Tool for Generating Custom Membranes for Molecular Simulations. J Chem Theory Comput. 2015;11:2144–2155. doi: 10.1021/acs.jctc.5b00209. [DOI] [PubMed] [Google Scholar]
- 56.Stansfeld PJ, Sansom MSP. From Coarse Grained to Atomistic: A Serial Multiscale Approach to Membrane Protein Simulations. J Chem Theory Comput. 2011;7:1157–1166. doi: 10.1021/ct100569y. [DOI] [PubMed] [Google Scholar]
- 57.Best RB, et al. Optimization of the additive CHARMM all-atom protein force field targeting improved sampling of the backbone φ, ψ and side-chain χ(1) and χ(2) dihedral angles. J Chem Theory Comput. 2012;8:3257–3273. doi: 10.1021/ct300400x. [DOI] [PMC free article] [PubMed] [Google Scholar]
- 58.Bussi G, Donadio D, Parrinello M. Canonical sampling through velocity rescaling. The J Chem Phys. 2007;126 doi: 10.1063/1.2408420. 014101. [DOI] [PubMed] [Google Scholar]
- 59.Michaud-Agrawal N, Denning EJ, Woolf TB, Beckstein O. MDAnalysis: A toolkit for the analysis of molecular dynamics simulations. J Comput Chem. 2011;32:2319–2327. doi: 10.1002/jcc.21787. [DOI] [PMC free article] [PubMed] [Google Scholar]
- 60.Perez-Riverol Y, et al. The PRIDE database and related tools and resources in 2019: improving support for quantification data. Nucleic Acids Res. 2020;47:D442–D450. doi: 10.1093/nar/gky. [DOI] [PMC free article] [PubMed] [Google Scholar]
Associated Data
This section collects any data citations, data availability statements, or supplementary materials included in this article.
Supplementary Materials
Data Availability Statement
Data supporting the findings of this study are available from the corresponding authors upon reasonable request. HDX-MS raw data and the HDX data tables have been deposited to the ProteomeXchange Consortium via the PRIDE60 partner repository with the dataset identifier PXD021743.
The structural models employed in this study are accessible through the PDB (https://www.rcsb.org/) under accession numbers 5IV9 (KpLptDE), 5XO4 (thanatin), 2R1A (EcLptA), 6GD5 (EcLptA-thanatin complex), 4Q35 (SfLptDE).


