Abstract
Epigenetic marks are reprogrammed in the gametes to reset genomic potential in the next generation. In mammals, paternal chromatin is extensively reprogrammed through the global erasure of DNA methylation and the exchange of histones with protamines1,2. Precisely how the paternal epigenome is reprogrammed in flowering plants has remained unclear since DNA is not demethylated and histones are retained in sperm3,4. Here, we describe a multi-layered mechanism by which H3K27me3 is globally lost from histone-based sperm chromatin in Arabidopsis. This mechanism involves silencing of H3K27me3 ‘writers’, the activity of H3K27me3 ‘erasers’ and deposition of a sperm-specific histone, H3.105, which we show is immune to lysine 27 methylation. The loss of H3K27me3 facilitates transcription of genes essential for spermatogenesis and pre-configures sperm with a chromatin state that forecasts gene expression in the next generation. Thus, plants have evolved a specific mechanism to simultaneously differentiate male gametes and reprogram the paternal epigenome.
Stable inheritance of epigenetic marks during cellular proliferation is essential for maintaining cell identity and involves DNA replication-coupled mechanisms6. At the DNA replication fork, old histones from the mother cell are recycled and deposited onto nascent strands of daughter cell chromatin7,8. This mode of inheritance ensures faithful propagation of the repressive epigenetic mark H3K27me3 across cell divisions in animals8–10. In plants, transmission of H3K27me3-silenced states additionally involves the replication-dependent histone variant H3.111. Histone H3.1 differs from H3.3 by four amino acid residues, with variation at residue 31 responsible for conferring selective mono-methylation at lysine 27 (K27) on H3.1 over H3.312. This plant-specific feature of H3.1 facilitates Polycomb Repressive Complex 2 (PRC2) function, ensuring efficient maintenance of H3K27me3 domains that maintain silencing of developmental genes11.
In plants, H3K27me3 is also required for developmental phase transitions13. For example, flowering in Arabidopsis thaliana is initiated by establishment of H3K27me3 at the floral repressor FLOWERING LOCUS C (FLC)13, which is facilitated by H3.1 deposition during DNA replication11. H3K27me3-mediated silencing at FLC is eventually reset in the next generation to ensure transcriptional re-activation in the early embryo14,15. This suggests that H3K27me3 is reprogrammed prior to or during early plant embryogenesis, although the mechanism and timing of H3K27me3 resetting is not known. In animals, epigenetic reprogramming initiates in the germline and culminates with histone-to-protamine exchange in the sperm of most species, globally erasing histone marks1. Flowering plants never undergo protamine exchange and instead retain histone-based chromatin in sperm (Fig. 1a)4. Moreover, in contrast to mammals2, DNA methylation is not globally erased from flowering plant sperm3, so whether the paternal epigenome undergoes reprogramming has remained unclear. There is some evidence that H3K27me3 is reduced in male reproductive tissues16–18, but whether H3K27me3 is reprogrammed globally or together with other histone marks is not known, nor is it clear when and how this occurs.
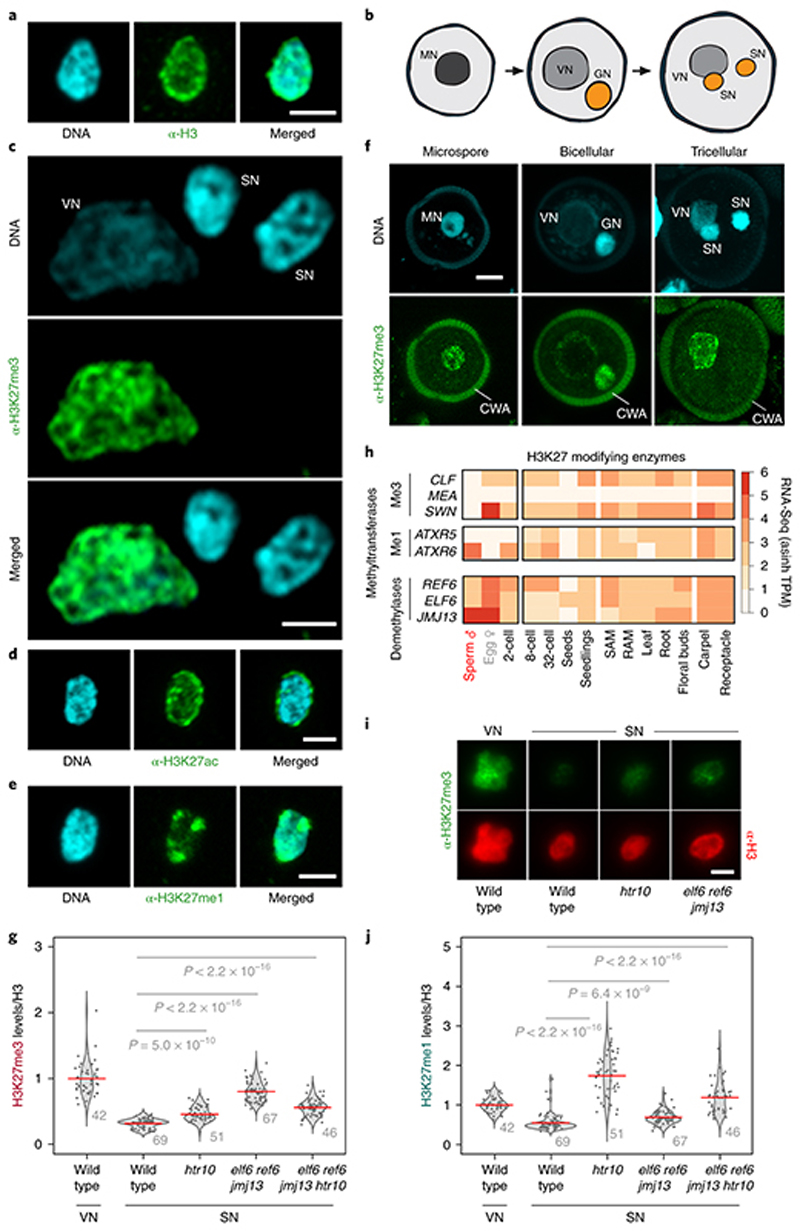
Fig. 1. H3K27me3 marks are globally lost from Arabidopsis sperm chromatin.
a, H3 antibody (α-H3) and 4′,6-diamidino-2-phenylindole (DAPI) staining of Arabidopsis sperm nuclei. Scale, 2 μm. b, Schematic of Arabidopsis pollen development. Microspore nuclei (MN) divide asymmetrically to produce a vegetative nucleus (VN) and germ cell nucleus (GN). The latter divides once again to produce two sperm nuclei (SN). c, α-H3K27me3 and DAPI staining of Arabidopsis vegetative cell nuclei (VN) and sperm nuclei (SN). Scale, 2 μm. The immunostain was repeated three times. d-e,α-H3K27ac (d) and α-H3K27me1 (e) immunostaining of Arabidopsis sperm nuclei alongside DAPI staining. Scale, 2 μm. f, Whole-mount α-H3K27me3 and DAPI staining of Arabidopsis pollen grains at different stages of development. Cell wall autofluorescence is indicated (cwa). Scale, 5 μm. The immunostaining in a and d-f was repeated twice. g, Quantification of α-H3K27me3 levels in VN and SN from WT, htr10, elf6;ref6;jmj13 and elf6;ref6;jmj13;htr10 pollennormalized to total H3 content. The violin curve represents the density of differing H3K27me3 levels. h, Expression of Arabidopsis histone H3 lysine 27 mono- (me1) and tri- (me3) methyltransferases (top two panels) and demethylases (third panel). Expression represents the inverse hyperbolic sine (asinh) transform of the mean RNA-seq TPM value sobtained from previously published datasets detailed in Supplementary Table 6. Sperm and egg were profiled with three and four RNA-seq biological replicates, respectively. i, α-H3K27me3 and α-H3 staining of VN and SN from wild type (WT), elf6;ref6;jmj13 and htr10 pollen. Scale, 2 μm. j, Quantification of α-H3K27me1 levels in VN and SN from WT, htr10,elf6;ref6;jmj13 and elf6;ref6;jmj13;htr10 pollen normalized to total H3 content. In g and j, red bar represents the mean of each genotype; quantification and statistical analysis were based on samples from one representative experiment; sample size (n = total number of nuclei) of each genotype is denoted alongside each violin plot. Statistical analysis was performed using a two-sided Mann-Whitney U-test. The experiment was repeated twice. Statistical source data are provided in Source Data fig. 1.
To investigate this, we first examined the status of H3K27me3 in tricellular pollen of Arabidopsis thaliana, where two sperm are encased within a companion vegetative cell (Fig. 1b)4. H3K27me3 was barely detectable in sperm chromatin but enriched in the companion cell nucleus (Fig. 1c). H3K27ac and H3K27me1 marks were appreciable in sperm (Fig. 1d,e), confirming that the absence of H3K27me3 was not a technical artefact. During pollen development, the sperm lineage arises from a progenitor microspore and becomes separated from its sister companion cell by two rounds of replication (Fig. 1b). H3K27me3 was present in the microspore (Fig. 1f) and likely inherited through meiosis18. H3K27me3 was also present in daughter nuclei following microspore division but was barely detected in sperm (Fig. 1f). These observations pointed to a mechanism that specifically removes H3K27me3 during sperm differentiation.
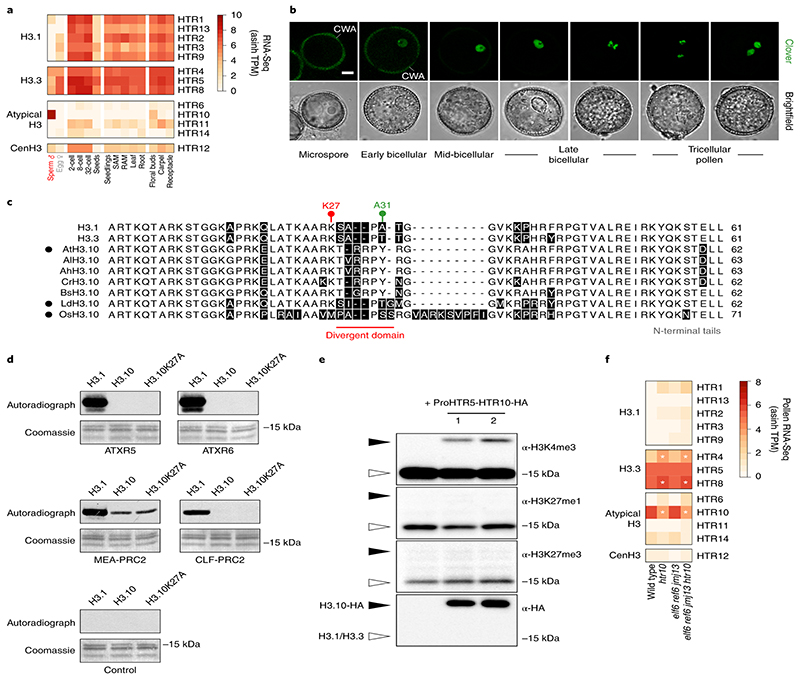
In contrast with proliferating somatic cells, sperm chromatin was devoid of the replicative histone variant H3.1 (Fig. 2a and Extended Data Fig. 1a-d)5. In addition to the non-replicative histone variant H3.3 (Extended Data Fig. 1e-f)5, which can carry K27 trimethylation19, sperm chromatin incorporates the sperm-specific histone variant H3.10 (Fig. 2a,b)4,5,20. H3.10 deposition initiated in the nascent sperm precursor and continued as sperm differentiated and matured (Fig. 2b). H3.10 is highly divergent around K27 (Fig. 2c) although this did not impact recognition by antibodies directed against mono- or tri-methylated H3.10K27 peptides (Extended Data Fig. 2a-c). Divergence in H3.10 includes residues 28 and 29 (Fig. 2c), which are predicted to engage in an essential interaction with the catalytic motif of PRC221. In addition, H3.10 lacks the alanine 31 residue (A31) (Fig. 2c) that distinguishes replicative H3.1 from H3.3 and that is required to prime H3K27me3 propagation, presumably through initial K27 mono-methylation by the plant-specific SET-domain proteins ARABIDOPSIS TRITHORAX-RELATED PROTEIN 5 and 6 (ATXR5/6)11,12. We thus hypothesized that H3.10 might be immune to K27 methylation and that its deposition would prevent inheritance of H3K27me3 during sperm development.
Fig. 2. Sperm-specific histone H3.10 is immune to K27 methylation.
a, Expression of Arabidopsis histone H3 variants. Expression represents the inverse hyperbolic sine (asinh) transform of the mean RNA-seq TPM values obtained from previously published datasets detailed in Supplementary Table 6. Sperm and egg were profiled with three and four biological replicates, respectively.. b, Expression of H3.10-Clover during pollen development. Cell wall autofluorescence is indicated (cwa). The experiment was repeated twice. Scale, 5 μm. c, N-terminal tail alignment of histone H3.1, H3.3 and H3.10-like variants from Arabidopsis thaliana (AtH3.10), Arabidopsis lyrata (AlH3.10), Arabidopsis halleri (AhH3.10), Capsella rubella (CrH3.10), Boechera stricta (BsH3.10), Lilium davidii (LdH3.10) and Oryza sativa (OsH3.10). Variants verified as sperm-specific in the literature are marked with a black dot. Black shading shows residue differences. The divergent domain and K27 are highlighted in red. Alanine 31 is highlighted in green. d, In vitro histone methyltransferase assays using recombinant H3.1 and H3.10 nucleosomes and Arabidopsis mono- (ATXR5/6) and tri- (MEA-PRC2 and CLF-PRC2) K27 methyltransferases. HMT assays with H3.10K27A nucleosomes confirm that residual MEA-PRC2 activity is non-specific to K27. The assay was performed once for ATXR5/6 and twice for PRC2. e, Western blot analysis of leaf histones isolated from two independent ProHTR5:HTR10-HA transgenic lines. No form of K27 methylation is detected on HA-tagged H3.10. This was not due to poor antibody affinity (Extended Data Fig. 2a-c) nor failure of the tagged variant to be modified in vivo, as indicated by the detection of H3K4me3. The experiment was repeated twice. f, Expression of Arabidopsis histone H3 variants in WT, htr10, elf6;ref6;jmj13 and elf6;ref6;jmj13;htr10 pollen. Expression represents the asinh transform of the mean RNA-seq TPM values of three biological replicates; four in the case of htr10. * indicates significantly different expression relative to WT pollen (p < 0.001) using DESeq differential expression analysis and Benjamin-Hochberg correction to control for multiple comparisons. See source data for precise p -values. Statistical source data and raw blots are provided in Source Data fig. 2.
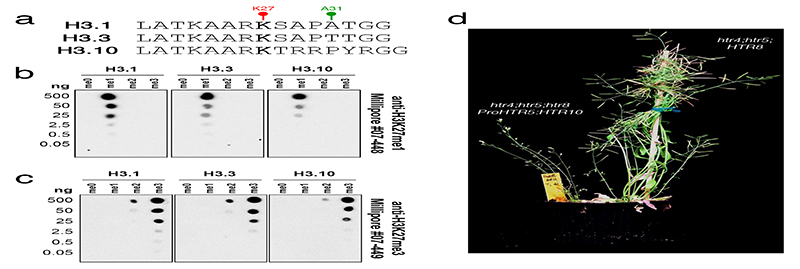
We performed in vitro histone lysine methyltransferase assays and found that ATXR5/6 and PRC2 were unable to methylate K27 on recombinant H3.10 nucleosomes, in contrast to H3.1 (Fig. 2d). Consistently, HA-tagged H3.10 ectopically expressed in planta was not methylated by endogenous H3K27 methyltransferase activity (Fig. 2e). H3.10 was also unable to complement the lethal phenotype of a null H3.3 knock-out22 (Extended Data Fig. 2d), further highlighting its distinct properties. Hence, H3.10 is unable to carry K27 methylation, suggesting that its incorporation in sperm would cause loss of H3K27me3. Consistently, we observed moderate but significantly increased H3K27me3 levels in htr10 sperm compared with WT (Fig. 1g). Orthologous sperm-specific histone H3 variants that harbor mutations at or around K27 are present in Arabidopsis relatives and distantly related monocots (Fig. 2c), suggesting that flowering plants evolved this unique class of sperm-specific H3 variants to selectively reprogram H3K27me3.
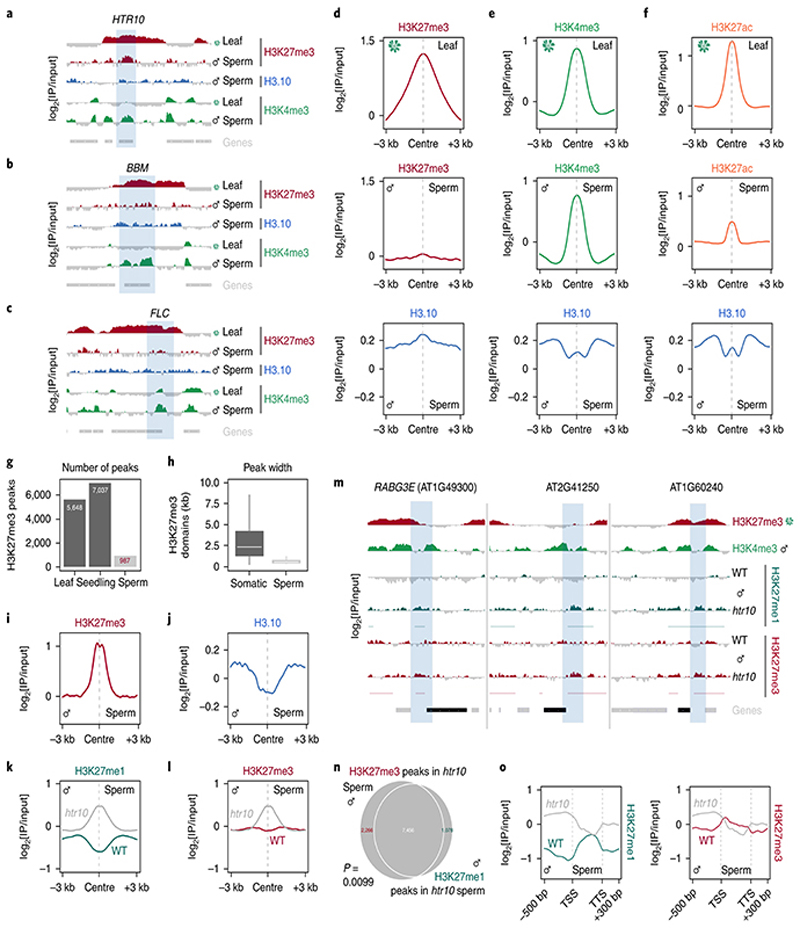
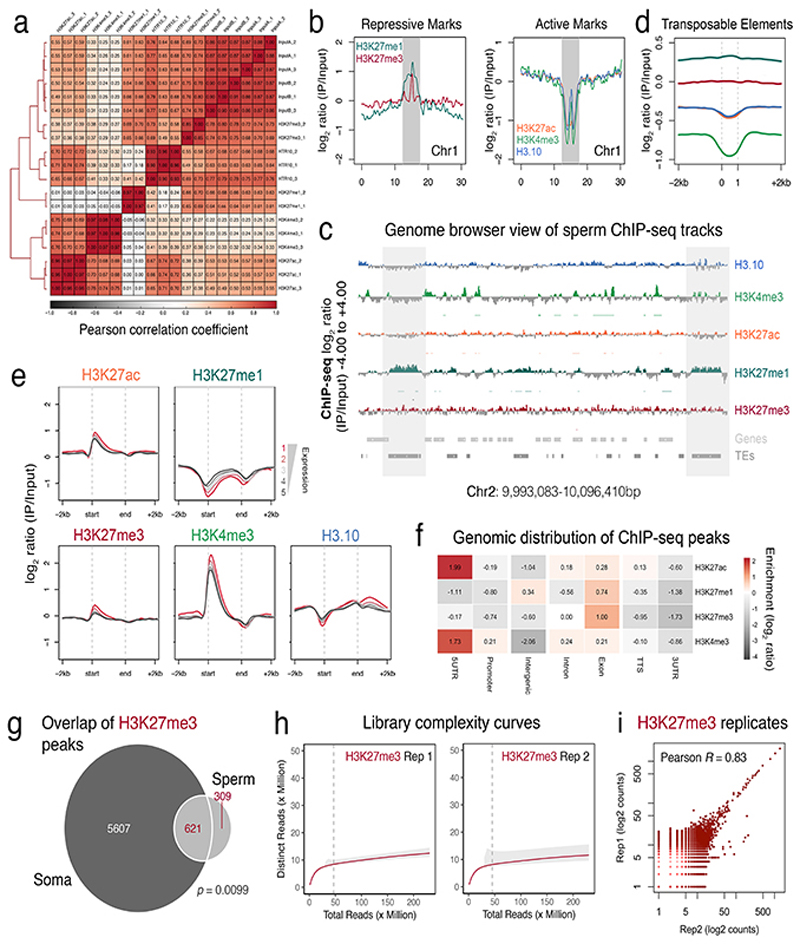
To assess genomic H3.10 distribution in sperm, we developed and validated a low-input ChIP-seq protocol to profile sperm chromatin in Arabidopsis (Extended Data Fig. 3a-f). H3.10 deposition was uniform across the genome but relatively depleted from pericentromeric regions enriched with H3K27me1 (Extended Data Fig. 3b, c). This likely reflects delayed replication of heterochromatin since sperm remain suspended in mid-S-phase until the onset of pollination23. The broad H3K27me3 domains that coat developmentally regulated genes in somatic tissues were no longer evident in sperm but were instead relatively enriched with H3.10 (Fig. 3a-d). Regions enriched with H3K4me3 and H3K27ac in somatic tissues were also enriched for H3.10 (Fig. 3e,f), emphasizing how H3.10 deposition occurs genome-wide and not only at somatic H3K27me3 domains. A small fraction of H3K27me3 peaks were retained in sperm (Fig. 3g and Extended Data Fig. 3g-i), which were much shorter than H3K27me3 domains in somatic tissues (Fig. 3h). Notably, H3.10 was depleted over these H3K27me3 peaks in sperm (Fig. 3i,j). Together, these genomic data support the notion that H3.10 deposition and parental histone replacement contribute to global reprogramming of H3K27me3 in sperm.
Fig. 3. H3.10 deposition in sperm correlates with the loss of H3K27me3.
a-c, ChIP-seq tracks of the region surrounding HTR10 (a) BBM (b) and FLC (c). All three genes (blue shading) are embedded within broad somatic H3K27me3 domains. Coverage is represented as the log2 ratio of IP DNA relative to input. Coloured and grey shading indicate an enriched or depleted signal, respectively. d, ChIP-seq profiles of leaf H3K27me3 (top), sperm H3K27me3 (middle) and sperm H3.10 (bottom) over somatic H3K27me3 domains. In sperm, H3K27me3 is lost over these regions, which instead become enriched for H3.10. e-f, Similar profiles as shown in (d) but centered on regions enriched with H3K4me3 (e) and H3K27ac (f) in leaf. In sperm, these regions remain enriched with each mark together with H3.10. g, Number of H3K27me3 peaks called in leaf, seedling and sperm. Somatic datasets were subsampled to read depth in sperm prior to peak calling. h, Box plot of the size distribution (in kb) of somatic and sperm H3K27me3 domains indicating the minimum and maximum values as well as the 25th, 50th and 75th quartiles. The number of peaks considered were n=6,235 (soma) and 478 (sperm). i-j, ChIP-seq profiles showing how H3.10 is depleted over retained H3K27me3 peaks in sperm. k-l, ChIP-seq profiles over de novo peaks of H3K27me1 (k) and H3K27me3 (l) in WT and htr10 sperm. m, ChIP-seq tracks of the region surrounding three representative genes down-regulated in htr10 pollen relative to WT. Coloured and grey shading indicate an enriched or depleted signal, respectively. H3K27me1 and H3K27me3 signal is increased in the flanking promoter region (blue shading). n, Overlap of de novo H3K27me1 and H3K27me3 peaks that accumulate in htr10. Statistical p-value of the peak overlap is based on a one-sided permutation test (n = 100 permutations) compared with random TAIR10 genomic regions. o, H3K27me1 and H3K27me3 signal in WT and htr10 sperm over genes down-regulated in elf6;ref6;jmj13;htr10 pollen relative to WT. ChIP-seq was performed with two and three biological replicates for WT and htr10 sperm, respectively.
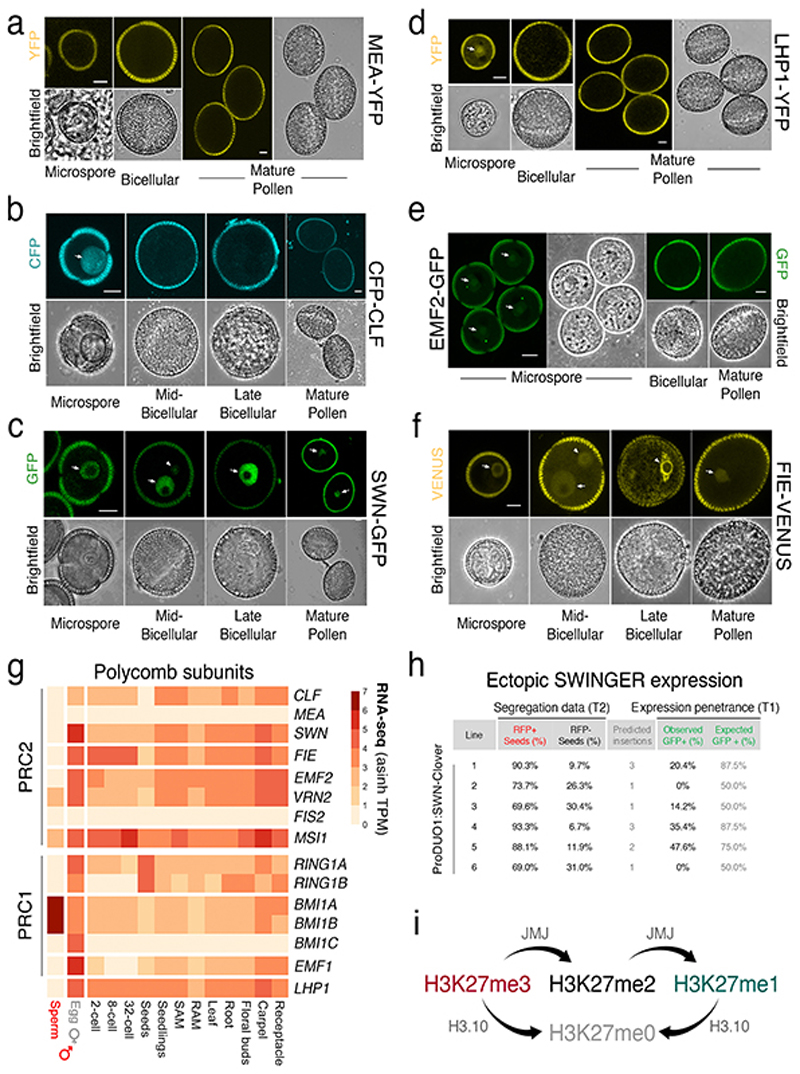
Because htr10 mutant plants do not show morphological or fertility defects in sperm20, we speculated that genetically redundant mechanisms also operate to remove H3K27me3 during sperm development. Aside from histone replacement, loss of an epigenetic mark can result from a lack of specific ‘writers’ or enhanced activity of ‘erasers’. We thusinvestigated the expression of methyltransferase subunits of PRC2. In Arabidopsis, these writers are encoded by three paralogs - CURLY LEAF (CLF), MEDEA (MEA) and SWINGER (SWN) 13 - all of which were undetectable during sperm development (Fig. 1h and Extended Data Fig. 4a-c). A similar lack of expression was observed for other components of PRC2 (Extended Data Fig. 4d-g)as well as most PRC1 subunits (Extended Data Fig. 4g). The failure of SWN to accumulate after ectopic expression in sperm suggested active PRC2 turnover (Extended Data Fig. 4h). By contrast, expression of the Polycomb machinery was unaltered in egg cells (Fig. 1h and Extended Data Fig. 4g). These observations suggest that Polycomb activity is specifically compromised during spermatogenesis.
We next asked whether the loss of H3K27me3 might also involve active demethylation, as implicated in the epigenetic resetting of FLC 14. Three closely related Jumonji-C family (JMJ) H3K27 demethylases - EARLY FLOWERING 6 (ELF6), RELATIVE OF ELF6 (REF6) and JUMONJI 13 (JMJ13) 24 - were all expressed in sperm, with JMJ13 being particularly enriched (Fig. 1h). In somatic tissues, H3K27 demethylases occupy the border of H3K27me3 domains in a pattern mutually exclusive with PRC225. Given the absence of PRC2 in sperm (Extended Data Fig. 4a-g), H3K27me3 demethylation by JMJ proteins is expected to occur globally in sperm. Consistently, elf6;ref6;jmj13 mutant sperm showed increased levels of H3K27me3 compared with WT (Fig. 1g,i), confirming that active demethylation by JMJ proteins also contributes to paternal H3K27me3 resetting.
JMJ proteins in plants and animals are known to demethylate di-and trimethyl H3K27 but not H3K27me1 (Extended Data Fig. 4i)26–28. If H3.10 were to replace a large fraction of H3K27me3 in sperm, the H3K27me3 retained upon H3.10 depletion should be converted to H3K27me1 by JMJ demethylase activity. Consistently, htr10 sperm showed high levels of H3K27me1 as well as de novo accumulation of co-localizing H3K27me1 and H3K27me3 peaks (Fig. 3k-n). H3K27me1 accumulation is unlikely to originate from mono-methylation by ATXR5/6 because its only substrate, H3.112, is not expressed in WT nor in htr10 sperm (Fig. 2f and Extended Data Fig. 1a-d). The increased H3K27me1 levels in htr10 sperm are thus expected to reflect the activity of JMJ demethylases, which remain expressed in htr10 sperm (Extended Data Fig. 5a-c). Consistently, we observed a reduction in H3K27me1 levels but an increase in H3K27me3 in quadruple elf6;ref6;jmj13;htr10 mutant sperm (Fig. 1g,j). These observations suggest that H3.10 deposition replaces a significant fraction of H3K27me3-marked nucleosomes as well as H3K27me1-marked nucleosomes produced by the action of JMJ demethylases. We conclude that H3K27me3 is removed during sperm development by the concerted action of three mechanisms; (1) the loss of multiple Polycomb subunits and capacity to write H3K27me3, (2) the activity of H3K27 demethylases and (3) the sperm-specific deposition of H3.10. The mutual compensation and interplay between these mechanisms thus ensures robust paternal resetting of H3K27me3.
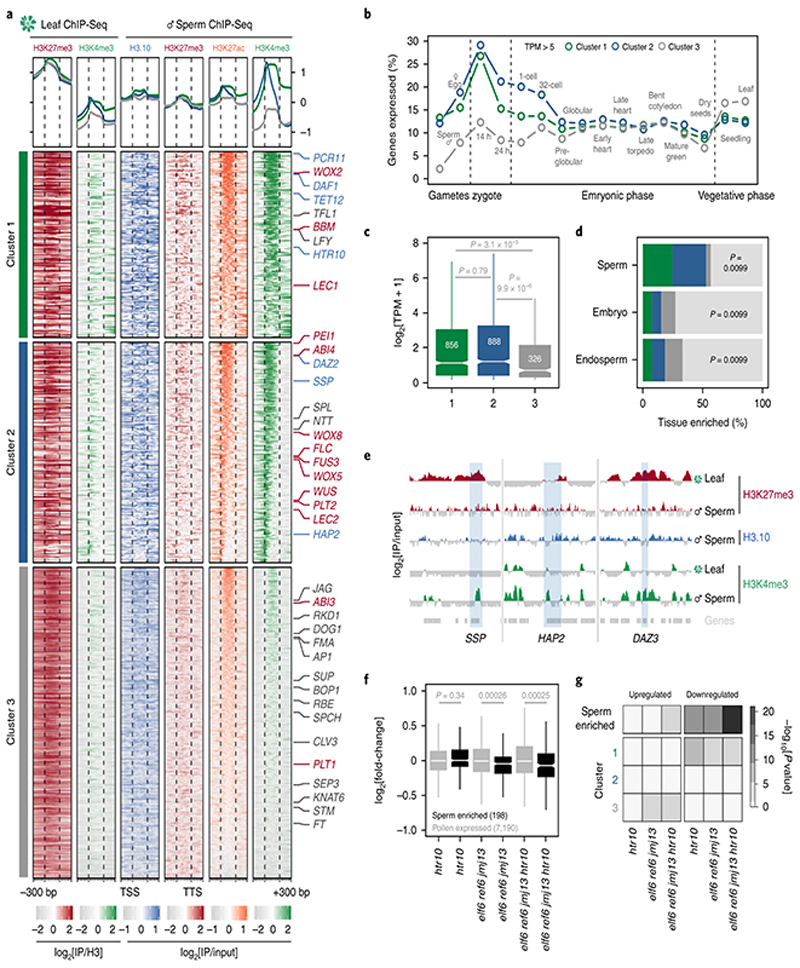
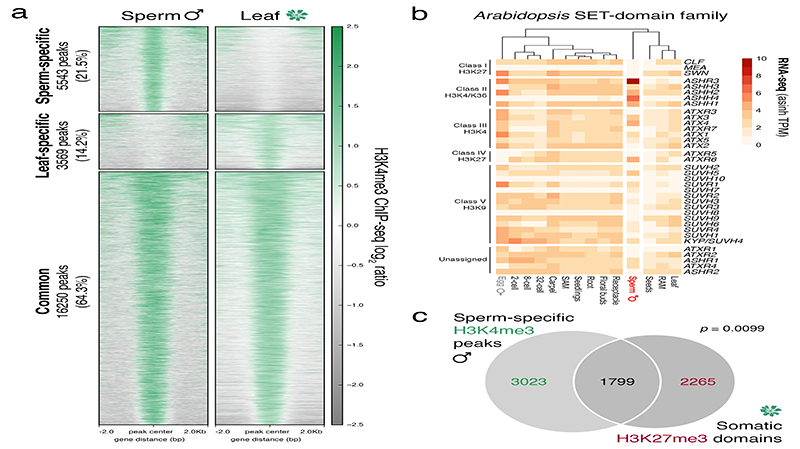
Unlike in mammals and Drosophila, zebrafish sperm chromatin is not reprogrammed with protamines and is characterized by retained histone marks that reflect gene expression during spermatogenesis and embryogenesis29. We thus considered what impact chromatin reprogramming has on transcription in Arabidopsis sperm. In addition to H3K27me3 removal, we noted abundant de novo deposition of active H3K4me3 marks at sites distinct from those in somatic tissues (Extended Data Fig. 6a), consistent with high transcription of H3K4 methyltransferases in sperm (Extended Data Fig. 6b). A third of H3K4me3 marks were located within somatic Polycomb domains (Extended Data Fig. 6c). Heatmaps centered on Polycomb target genes illustrated the selective accumulation of H3K4me3 and H3K27ac in sperm, which occurred along gene bodies (Fig. 4a, cluster 1 and Supplementary Table 1) or around the TSS and flanking promoter (Fig. 4a, cluster 2 and Supplementary Table 1). Around 15% of the genes that accumulated H3K4me3 were highly expressed in sperm (Fig. 4b,c and Extended Data Fig. 7a,b) and accounted for half of sperm-enriched genes (Fig. 4d and Supplementary Table 2). These included the HTR10 locus encoding H3.10 (Fig. 3a) and several others required for sperm differentiation (Fig. 4a,e, blue labels, and Supplementary Table 2)30. Consistently, expression of sperm-enriched genes was significantly reduced in pollen compromised of H3K27 demethylase activity, which was synergistic in elf6;ref6;jmj13;htr10 pollen (Fig. 4f,g, Extended Data Fig. 5d-f and Supplementary Table 3). Moreover, the promoter of down-regulated genes accumulated higher levels of H3K27me1 and H3K27me3 in htr10 sperm compared to WT (Fig. 3m,o). We conclude that epigenetic reprogramming of H3K27me3 facilitates transcription of genes associated with sperm differentiation in Arabidopsis.
Fig. 4. Paternal resetting of H3K27me3 facilitates sperm specification.
a, Chromatin state of Polycomb-silenced genes in leaf and sperm clustered based on sperm H3K4me3. Number of genes is n=1,866 (cluster 1), 2,220 (cluster 2) and 3,105 (cluster 3). Sperm differentiation genes (blue), embryonic factors (red) and post-embryonic regulators (grey) are marked. b, Percentage of cluster 1, 2 and 3 genes expressed in gametes, embryos and vegetative tissues (TPM > 5). TPM represents the mean obtained from previously published datasets detailed in Supplementary Table 6. Sperm and egg were profiled with three and four biological replicates, respectively. c, Sperm transcript levels (log2 RNA-seq TPM)for genes expressed from each cluster. Sample size (n= genes with TPM > 0.1)is denoted on each boxplot, which indicates minimum and maximum values as well as 25th, 50th and 75th quartiles. Statistical analysis was performedusing a two-sided Mann-Whitney U-test. d, Percentage Polycomb targets among genes with enriched expression in sperm (n =463 genes), early embryos (n=279 genes) and early endosperm (n =463 genes)with colours corresponding to the clusters defined in panel a. Statistics is based on a one-sided permutation test (n = 100 permutations) compared with random TAIR10 regions. e, ChIP-seq tracks of three sperm differentiation genes - SHORT SUSPENSOR (SSP), HAPLESS 2 (HAP2) and DUO1-ACTIVATED ZINC FINGER 3 (DAZ3). Coverage represents log2 ratio of IP relative to input. Coloured and grey shading indicate enriched or depleted signal, respectively. In panels a and e, ChIP-seq was performed with three biological replicates; two for sperm H3K27me3. f, Differential expression between htr10, elf6;ref6;jmj13 and elf6;ref6;jmj13;htr10 pollen relative to WT, with minimum and maximum values as well as 25th, 50th and 75th quartiles indicated. Sample size (n) of pollen-expressed (grey) and sperm-enriched genes (black) is shown. Statistical analysis was performed using two-sided Mann-Whitney U-tests. g, Overlap of differentially-expressed genes in htr10, elf6;ref6;jmj13 and elf6;ref6;jmj13;htr10 with sperm-enriched and cluster 1, 2, 3 genes. Statistical enrichment was determined using pairwise two-sided Fisher’s exact tests. Statistical source data including sample sizes (n) and precise p-values are provided in Source Data fig. 4.
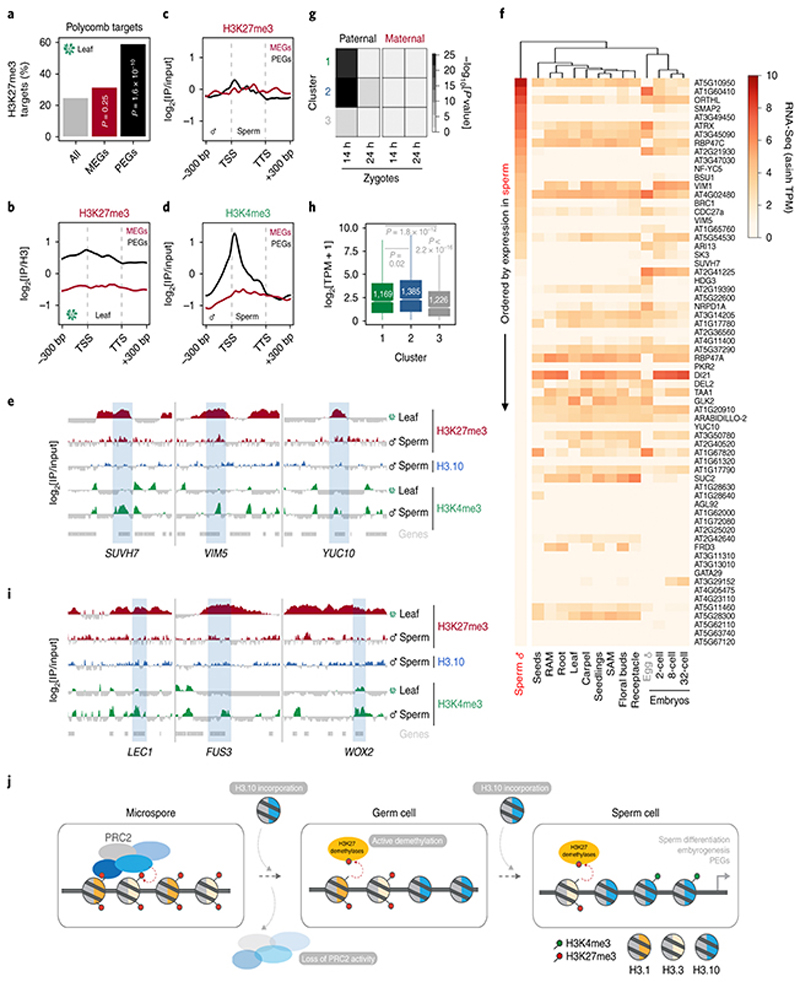
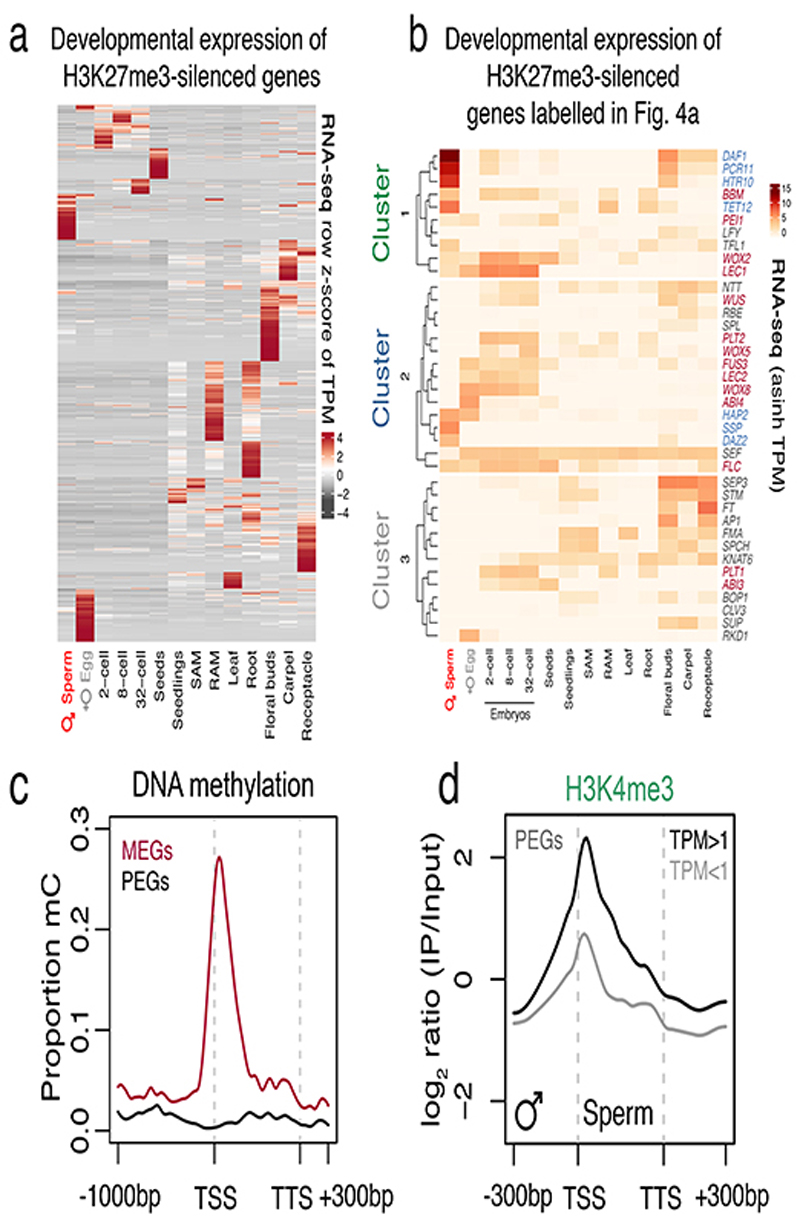
Somatic Polycomb-silenced genes also showed enriched expression in the endosperm (Fig. 4d), which arises from a second fertilization event of the central cell in flowering plants31. Genomic imprinting is a hallmark of the endosperm, resulting in genes with distinct epigenetic signatures and biased expression depending on their parent-of-origin31,32. Unlike maternally expressed imprinted genes (MEGs), paternally expressed imprinted genes (PEGs) were preferentially silenced by Polycomb in somatic tissues (Fig. 5a,b and Supplementary Table 4). This is consistent with previous reports of H3K27me3 marking PEGs in somatic tissues33, which in sperm is mirrored by specific enrichment of DNA methylation on MEGs (Extended Data Fig. 7c). In sperm, loss of H3K27me3 was accompanied by a gain of H3K4me3 around the TSS of PEGs but not MEGs, despite most PEGs remaining un-transcribed (Fig. 5c-f and Extended Data Fig. 7d). Our data suggests that the paternal allele of PEGs is inherited in a transcriptionally primed state free of H3K27me3 and enriched in H3K4me3, forecasting paternally biased expression in the endosperm. By contrast, no major loss of H3K27me3 is expected on maternal alleles since PRC2 is active in the central cell13. This mechanism mirrors H3K27me3-dependent genomic imprinting in mice embryos where paternal allele-specific expression is caused by paternal loss and maternal persistence of H3K27me3 in the sperm and egg, respectively34.
Fig. 5. Sperm chromatin state forecasts gene expression in the next generation.
a, Percentage of MEGs (n = 57 genes) and PEGs (n = 66 genes) overlapping with somatic H3K27me3 domains. Significance was determined by chi-square analysis compared to proportion in Arabidopsis (n = 28,775 genes). b-c, H3K27me3 signal over MEGs and PEGs in leaves (b) and sperm (c). d, H3K4me3 signal over MEGs and PEGs in sperm. Plotted in c,d is the ChIP-seq log2 enrichment relative to input; b relative to H3. e, ChIP-seq tracks of three PEGs - SU(VAR)3-9 HOMOLOG 7 (SUVH7), VARIANT IN METHYLATION 5 (VIM5) and YUCCA 10 (YUC10). f, Heatmap of PEG expression representing the asinh transform of the mean RNA-seq TPM values obtained from previously published datasets detailed in Supplementary Table 6. Sperm and egg were profiled with three and four biological replicates, respectively. g, Overlap enrichment of paternal or maternal biased genes in early zygotes with cluster 1, 2, 3 genes. Statistical enrichment was determined using pairwise two-sided Fisher’s exact tests. See source data for sample sizes (n) and precise p-values. h, 14h zygote transcript levels (log2 RNA-seq TPM) for genes expressed from cluster 1, 2, 3. Sample size (n = genes with TPM > 0.1) is denoted on each boxplot, which indicates minimum and maximum values as well as 25th, 50th and 75th quartiles. Statistical analysis was performed using two-sided Mann-Whitney U-tests. i, ChIP-seq tracks of three embryonic regulators - LEAFY COTYLEDON 1 (LEC1), FUSCA3 (FUS3) and WUSCHEL-RELATED HOMEBOX 2 (WOX2). In panels e and i, coverage represents log2 enrichment relative to input while coloured and grey shading indicate enriched or depleted signal, respectively. ChIP-seq data in b,c,d,e,i was performed using three biological replicates; two for sperm H3K27me3. j, Model for the H3K27me3 resetting mechanism in Arabidopsis sperm. This involves silencing of multiple PRC2 subunits, H3K27me3 demethylase activity and sperm-specific deposition of histone H3.10, which is immune to K27 methylation. The conjunction of these pathways leads to chromatin and transcriptional reprogramming of genes expressed during sperm differentiation and in the next generation. Statistical source data are provided in Source Data fig. 5.
Similarly, genes with paternally-biased expression in early zygotes35 were significantly enriched among the reprogrammed loci in sperm, unlike genes with a maternal bias (Fig. 5g). Among the H3K4me3-primed genes were BABY BOOM (BBM) (Fig. 3b) and SHORT SUSPENSOR (SSP) (Fig. 4e), which encode paternally-derived factors that trigger and pattern plant embryogenesis, respectively36,37. By contrast, un-primed genes that did not accumulate H3K4me3 (Fig. 4a, cluster 3 and Supplementary Table 1) were less likely to be transcribed throughout early embryogenesis (Fig. 4b), had lower levels of expression overall (Fig. 5h) and were enriched for tissue-specific regulators of post-embryonic development (Fig. 4a, grey labels and Supplementary Table 5). Priming with H3K4me3 in sperm extended to several other Polycomb targets expressed in the early embryo. These included BBM targets LEAFY COTYLEDON 1 (LEC1), LEC2 and FUSCA 3 (FUS3) 38, and the LEC1 target FLOWERING LOCUS C (FLC) 15 (Fig. 3c,Fig. 4a, red labels, Fig. 5i and Extended Data Fig. 7b). Several other key regulators of embryo patterning were also primed including WUSCHEL (WUS), WUSCHEL-RELATED HOMEBOX 2 (WOX2), WOX5, WOX8 and WOX9 (Fig. 4a, red labels, Fig. 5i, Extended Data Fig. 7b and Supplementary Table 1)39. Thus, the pattern of H3K27me3 replacement with H3K4me3 in sperm is predictive of gene expression during early plant development.
In conclusion, flowering plants employ a multi-layered mechanism to globally and specifically remove H3K27me3 from histone-based sperm chromatin (Fig. 5j). Epigenetic resetting of H3K27me3 facilitates sperm differentiation and has the potential to influence transcription of genes required in the next generation, including key regulators of embryogenesis, endosperm development and flowering, as well as yet-uncharacterized loci transcribed post-fertilization. Pre-configured chromatin poised with H3K4me3, which is associated with transcription40, would assist the rapid zygotic genome activation typical of flowering plants41,42. Whether the bivalent marks detected on residual histones in mouse and human sperm directly impact transcription during early embryogenesis has been debated43–46. This is likely more plausible in species with histone-based sperm chromatin like zebrafish47 and Caenorhabditis elegans 48, with the latter requiring paternally-derived H3K27me3 for normal offspring development49. Our findings suggest that paternal resetting of H3K27me3 and inheritance of H3K4me3-primed genes has the potential to impact transcription after double fertilization in flowering plants, either directly or indirectly. Our findings also imply that germline transmission of H3K27me3 occurs maternally in flowering plants, as shown in most animals46,50.
The mechanistic insights we describe represent a mode of reprogramming whereby cell type-specific deposition of an atypical histone variant, together with active H3K27 demethylation and lack of PRC2 activity, reprograms a single epigenetic mark(Fig. 5j). Restricted divergence around K27 ensures replication-dependent deposition of H3.10 while simultaneously preventing H3K27me3 inheritance without affecting other histone H3 modifications. Global reprogramming of a single epigenetic mark in plant sperm contrasts with the near complete exchange of histones with protamine in animal sperm46 or with H3K27me3 retention in animal species with histone-based sperm29. Several as-yet-uncharacterized histone variants exist across eukaryotes that have tissue-specific expression and that are predicted to be poor substrates for chromatin modifiers4,51, suggesting that aspects of the mechanism operating during Arabidopsis spermatogenesis extends to other species and developmental contexts.
Extended Data
Extended Data Fig. 1.
Dynamics of histone H3.1 and H3.3 during pollen development.
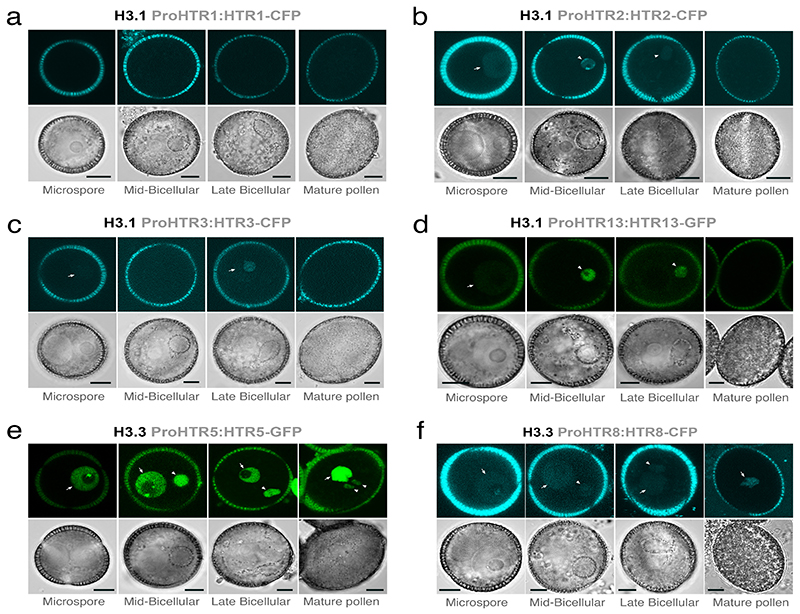
Expression of H3.1 (a-d) and H3.3 (e-f) isoforms during pollen development. Histone H3.1 is encoded by five isoforms: HTR1 (a), HTR2 (b), HTR3 (c), HTR9 and HTR13 (d). Histone H3.3 is encoded by three isoforms: HTR4, HTR5 (e) and HTR8 (f). Two pairs of genes (HTR4-HTR5 and HTR9-HTR13) are found in tandem at the same locus so a single reporter for each pair was used to monitor expression. Histone H3.1 (HTR2, HTR3 and HTR13) were detectable in the microspore and sperm precursor but this signal disappeared rapidly before sperm mitosis. No pollen expression was detected for HTR1. Histone H3.3 (HTR5 and HTR8) were detected throughout pollen development but had a much reduced (HTR5) or absent (HTR8) signal in sperm. Arrows indicate expression in the microspore or VN while arrowheads distinguish expression in the sperm lineage. The marker line analysis was repeated twice with independent inflorescences. Scale, 5 μm.
Extended Data Fig. 2.
Specificity of anti-H3K27 methylation antibodies used in this study.
a, Peptide sequences of H3.1, H3.3 and H3.10 surrounding K27 used for testing antibody specificity. Different forms with no methylation (me0), mono-methylation (me1), di-methylation (me2), and tri-methylation (me3) at K27 were used in all dot blots. b-c, Dot blots with serial dilutions of the different forms of histone H3 peptides described in a. The resulting membranes were probed with (b) α-H3K27me1 from Millipore #07-448 and (c) α-H3K27me3 from Millipore #07-449. Importantly, both α-H3K27 methylation antibodies cross react with the correct methylated form of H3.10 peptides, confirming that a lack of H3K27me3 detection in sperm chromatin (Fig. 1a) or on ectopically expressed H3.10-3xHA (Fig. 2e) is not due to poor antibody affinity. The experiment was repeated twice on two independent blots. e, Representative image of T1 htr4;htr5;htr8 plants expressing either untagged H3.10 under control of an H3.3 promoter (left) or endogenous H3.3 (right). Plants devoid of endogenous H3.3 and expressing only H3.10 and H3.1 (left) were developmentally stunted and completely sterile. This was evident in two independent experiments with individual htr4;htr5;htr8 T1 lines. Raw blots are provided in Source Data Extended data fig. 2.
Extended Data Fig. 3.
Epigenomic profiling of Arabidopsis sperm chromatin.
a, Pearson correlation matrix of the ChIP-seq datasets generated in this study. Each ChIP-seq replicate is indicated in the matrix, which was performed with three biological replicates; two for H3K27me1 and H3K27me3. b, Distribution of repressive (top panel) and active marks (bottom panel) over Arabidopsis chromosome one. Plotted is the ChIP-seq log2 enrichment of IP DNA relative input calculated in 10kb bins. Pericentromeric heterochromatin is indicated with grey shading. c, Genome browser view of the sperm ChIP-seq datasets. Coverage is represented as the log2 ratio of IP DNA relative to input. Coloured and grey shading indicate an enriched or depleted signal, respectively. Genes (light grey) and transposable elements (dark grey) are shown below. d, Distribution of sperm histone marks over transposable elements. Plotted is the ChIP-seq log2 enrichment relative to input. e, Distribution of sperm histone marks over genes sorted by expression level in sperm. f, Genomic distribution of histone mark peaks in sperm. As expected, H3K27ac and H3K4me3 peaks were mostly enriched over the 5’UTR of genes. H3K27me1 and retained H3K27me3 peaks were mostly enriched over exons, while H3K27me1 peaks were also enriched in intergenic regions. g, Overlap of the retained sperm H3K27me3 peaks with somatic H3K27me3 domains. Statistical analysis is based on a one-sided permutation overlap test (n = 100 permutations) compared with random TAIR10 regions. h, Estimated library complexity curves confirmed a sufficient sequencing depth for two independent biological replicates of sperm H3K27me3. The red curve represents the interpolated and extrapolated increase in complexity (i.e. distinct reads) with increased sequencing depth. The grey shading represents the upper and lower 95% confidence interval of the extrapolation. The dashed grey line represents the final sequencing depth of each sample. i, Plot of the pairwise correlation between sperm H3K27me3 biological replicates, which showed high reproducibility. Pearson’s correlation coefficient is shown.
Extended Data Fig. 4.
Dynamics of the Polycomb machinery during sperm development.
a-f, Expression of MEA-YFP (a), CFP-CLF (b), SWN-GFP (c), LHP1-YFP (d), EMF2-GFP (e) and FIE-VENUS (f) during pollen development. All markers were absent from sperm at mature pollen stage. FIE had an appreciable signal in the sperm precursor but was excluded from the nucleus. Arrows indicate expression in the microspore or VN while arrowheads distinguish expression in the sperm lineage. Marker line analysis was repeated twice with independent inflorescences. Scale, 5 μm. g, Expression of Arabidopsis PRC2 (top panel) and PRC1 (bottom panel) subunits. Expression represents the inverse hyperbolic sine (asinh) transform of the mean RNA-seq TPM values obtained from previously published datasets detailed in Supplementary Table 6. Sperm and egg were profiled with three and four biological replicates, respectively. h, Ectopic expression of SWN-Clover under control of the sperm lineage-specific DUO1 promoter. Predicted insertions were estimated from T2 segregation of RFP fluorescent seeds arising from the pAlligatorR43 selection marker. Expression of SWN-GFP in T1 lines was barely detectable in pollen and well below that predicted from the T2 segregation data. i, Schematic of the action of JMJ proteins, which can demethylate H3K27 di-and tri-methylation but not mono-methylation. Statistical source data are provided in Source Data Extended data fig. 4.
Extended Data Fig. 5.
Transcriptional profiling of htr10, elf6;ref6;jmj13 and elf6;ref6;jmj13;htr10 pollen.
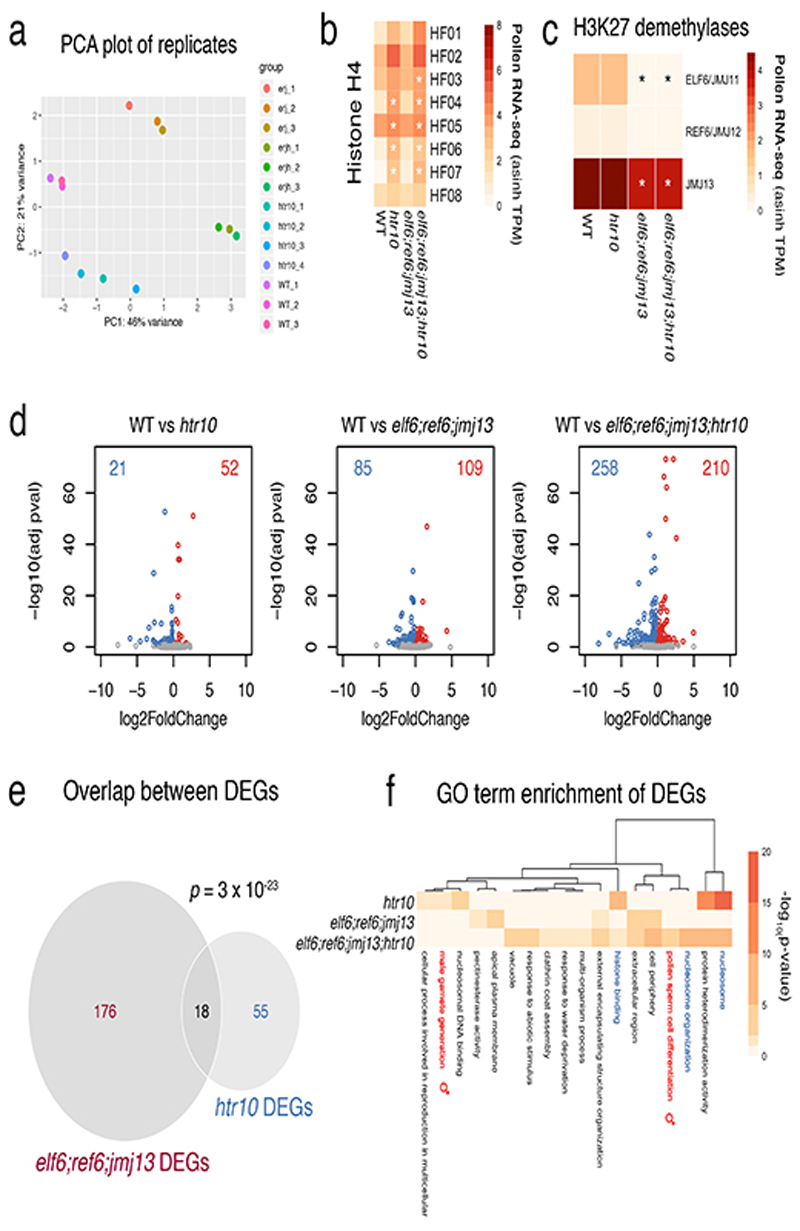
a, Principal component analysis illustrating the high reproducibility of replicates and variation among the RNA-seq datasets generated from WT (n = 3 replicates), htr10(n = 4 replicates), elf6;ref6;jmj13 (n = 3 replicates) and elf6;ref6;jmj13;htr10(n = 3 replicates) pollen. All the biological replicates indicated (n) were used in the analysis that follows in panels b,c,d of this figure. b,c, Expression of (a) Arabidopsis histone H4 variants and (b) H3K27 demethylases in WT, elf6;ref6;jmj13, htr10 and elf6;ref6;jmj13;htr10 pollen. Expression represents the inverse hyperbolic sine (asinh) transform of the mean RNA-seq TPM values. The mean value of the biological replicates in a is shown, while the asterisks (*) indicate significantly different expression relative to WT pollen (p <0.001) using DESeq differential expression analysis and Benjamin-Hochberg correction to control for multiple comparisons. See source data for p-values. d, Volcano plots summarising significantly (adjusted p-value < 0.1) up-regulated (log2 FC > 0, red) and down-regulated (log2 FC < 0, blue) genes in htr10, elf6;ref6;jmj13 and elf6;ref6;jmj13;htr10 pollen relative to WT. DESeq analysis was used to determine differentially expressed genes from the biological replicates detailed in a and multiple comparisons controlled for using Benjamin-Hochberg correction. See Supplementary Table 3. e, Differentially-expressed genes (DEGs) in htr10(n = 73) and elf6;ref6;jmj13(n = 194) significantly overlap each other. Significance of the enriched overlap (p-value) was determined using a two-sided Fisher’s exact test. f, Clustered heatmap displaying enriched gene ontology (GO) terms associated with the DEGs in htr10(n = 73), elf6;ref6;jmj13(n = 194) and elf6;ref6;jmj13;htr10(n = 468) pollen relative to WT. Significant enrichment was assessed using g:Profiler and controlled for the multiple testing problem using the in-built g:SCS (sets counts and sizes) correction.
Extended Data Fig. 6.
Sperm-specific accumulation of H3K4me3 is enriched at somatic H3K27me3 domains.
a, Heatmaps centred on H3K4me3 peaks in sperm and leaf. Regions are split based on peaks being sperm-specific, leaf-specific or common to both sperm and leaf. The number of peaks and relative percentage are indicated in the labels to the left. Plotted is the ChIP-seq log2 ratio relative to input or H3 for sperm and leaf, respectively. ChIP-seq was performed with three biological replicates for sperm; four for leaf. b, Expression of the Arabidopsis SET-domain family of proteins. Expression represents the inverse hyperbolic sine (asinh) transform of the mean RNA-seq TPM values obtained from previously published datasets detailed in Supplementary Table 6. Sperm and egg were profiled with three and four biological replicates, respectively. c, Overlap of somatic H3K27me3 domains with sperm-specific H3K4me3 peaks. Statistical analysis is based on a one-sided permutation overlap test (n = 100 permutations) compared with random TAIR10 genomic regions.
Extended Data Fig. 7.
Reprogramming of Polycomb-silenced genes in sperm.
a, Heatmap illustrating the developmentally regulated expression of somatic H3K27me3-marked genes. Expression represents z-score normalised RNA-seq TPM values. b, Heatmap of the expression of the genes marked in Figure 4a. Expression represents the inverse hyperbolic sine (asinh) transform of RNA-seq TPM values. c, Averaged DNA methylation signal over MEGs and PEGs in sperm. Plotted is the proportion of methylated cystosines in all contexts (i.e. CG, CHG and CHH). d, Averaged H3K4me3 signal over PEGs with detectable expression (TPM>1, black line) or no expression (TPM<1, grey line) in sperm. Plotted is the ChIP-seq log2 enrichment relative to input. PEGs accumulate H3K4me3 regardless of expression in sperm, although the level of H3K4me3 enrichment was expectedly higher at sperm-expressed PEGs. Statistical source data are provided in Source Data Extended data fig. 7.
Supplementary Material
Acknowledgements
We thank P. Andersen and J. M. Watson for critical reading of the manuscript; Z. Lorkovic and S. Akimcheva for guidance and technical support; T. Suzuki for sequencing the egg cell transcriptome; Life Science Editors for editing services. We also thank the Vienna BioCenter Core Facilities for Next Generation Sequencing, Plant Science, HistoPathology, the IMP/IMBA BioOptics Facility and the MENDEL HPC team. This work was supported through core funding from the Gregor Mendel Institute, external grants from the FWF (P26887-B21, I 4258) and ERA-CAPS (EVO-REPRO I2163-B16). M.B. was supported through an FWF Lise Meitner fellowship (M1818-B21). Y.J., C.L. and R.M. were supported by the Howard Hughes Medical Institute and NIH funding (R01 GM067014). D.S. and T.H. were supported by the Japan Society for the Promotion of Science (Nos. 18J01963 to D.S. and 16H06464, 16H06465, 16K21727 to T.H.). P.V. was supported by the Wellcome Trust ([104175/Z/14/Z], Sir Henry Dale Fellowship), ERC EU Horizon 2020 research and innovation program (ERC-STG grant agreement No. 639253) and core funding from the Wellcome Trust [203149].
Footnotes
Author contributions
M.B. and F.B. conceived the project. M.B. performed the main experimental work. Y.J., C.L. and P.V. performed the HMT assays under supervision of R.M. D.B. helped with immunostaining. T.K., E.A., L.B. and J.B. generated sperm cell RNA-seq data. D.S. generated the egg cell transcriptome under supervision of T.H. M.B. performed the bioinformatic analysis. M.B. and F.B. interpreted the data and wrote the manuscript.
Competing interests
The authors declare no competing interests.
References
- 1.Braun RE. Packaging paternal chromosomes with protamine. Nat Genet. 2001;28:10–12. doi: 10.1038/ng0501-10. [DOI] [PubMed] [Google Scholar]
- 2.Reik W, Dean W, Walter J. Epigenetic reprogramming in mammalian development. Science (80-) 2001;293:1089–1093. doi: 10.1126/science.1063443. [DOI] [PubMed] [Google Scholar]
- 3.Calarco JP, et al. Reprogramming of DNA methylation in pollen guides epigenetic inheritance via small RNA. Cell. 2012;151:194–205. doi: 10.1016/j.cell.2012.09.001. [DOI] [PMC free article] [PubMed] [Google Scholar]
- 4.Borg M, Berger F. Chromatin remodelling during male gametophyte development. Plant J. 2015;83:177–188. doi: 10.1111/tpj.12856. [DOI] [PubMed] [Google Scholar]
- 5.Ingouff M, et al. Zygotic resetting of the HISTONE 3 variant repertoire participates in epigenetic reprogramming in Arabidopsis. Curr Biol. 2010;20:2137–43. doi: 10.1016/j.cub.2010.11.012. [DOI] [PubMed] [Google Scholar]
- 6.Reinberg D, Vales LD. Chromatin domains rich in inheritance. Science (80-) 2018;361:33–34. doi: 10.1126/science.aat7871. [DOI] [PubMed] [Google Scholar]
- 7.Xu M, et al. Partitioning of histone H3-H4 tetramers during DNA replicationdependent chromatin assembly. Science (80-) 2010;328:94–98. doi: 10.1126/science.1178994. [DOI] [PubMed] [Google Scholar]
- 8.Reverón-Gómez N, et al. Accurate Recycling of Parental Histones Reproduces the Histone Modification Landscape during DNA Replication. Mol Cell. 2018;72:239–249 e5. doi: 10.1016/j.molcel.2018.08.010. [DOI] [PMC free article] [PubMed] [Google Scholar]
- 9.Laprell F, Finkl K, Müller J. Propagation of Polycomb-repressed chromatin requires sequence-specific recruitment to DNA. Science. 2017;356:85–88. doi: 10.1126/science.aai8266. [DOI] [PubMed] [Google Scholar]
- 10.Coleman RT, Struhl G. Causal role for inheritance of H3K27me3 in maintaining the off state of a Drosophila HOX gene. Science (80-) 2017;356:41. doi: 10.1126/science.aai8236. [DOI] [PMC free article] [PubMed] [Google Scholar]
- 11.Jiang D, Berger F. DNA replication-coupled histone modification maintains Polycomb gene silencing in plants. Science. 2017;357:1146–1149. doi: 10.1126/science.aan4965. [DOI] [PubMed] [Google Scholar]
- 12.Jacob Y, et al. Selective methylation of histone H3 variant H3.1 regulates heterochromatin replication. Science (80-) 2014;343:1249–1253. doi: 10.1126/science.1248357. [DOI] [PMC free article] [PubMed] [Google Scholar]
- 13.Grossniklaus U, Paro R. Transcriptional silencing by polycomb-group proteins. Cold Spring Harb Perspect Biol. 2014;6 doi: 10.1101/cshperspect.a019331. a019331. [DOI] [PMC free article] [PubMed] [Google Scholar]
- 14.Crevillén P, et al. Epigenetic reprogramming that prevents transgenerational inheritance of the vernalized state. Nature. 2014;515:587–90. doi: 10.1038/nature13722. [DOI] [PMC free article] [PubMed] [Google Scholar]
- 15.Tao Z, et al. Embryonic epigenetic reprogramming by a pioneer transcription factor in plants. Nature. 2017;551:124–128. doi: 10.1038/nature24300. [DOI] [PubMed] [Google Scholar]
- 16.Sano Y, Tanaka I. Distinct localization of histone H3 methylation in the vegetative nucleus of lily pollen. Cell Biol Int. 2010;34:253–9. doi: 10.1042/CBI20090124. [DOI] [PubMed] [Google Scholar]
- 17.Houben A, Kumke K, Nagaki K, Hause G. CENH3 distribution and differential chromatin modifications during pollen development in rye (Secale cereale L.) Chromosome Res. 2011;19:471–80. doi: 10.1007/s10577-011-9207-6. [DOI] [PubMed] [Google Scholar]
- 18.She W, Baroux C. Chromatin dynamics in pollen mother cells underpin a common scenario at the somatic-to-reproductive fate transition of both the male and female lineages in Arabidopsis. Front Plant Sci. 2015;6:294. doi: 10.3389/fpls.2015.00294. [DOI] [PMC free article] [PubMed] [Google Scholar]
- 19.Zhang K, Sridhar VV, Zhu J, Kapoor A, Zhu J-K. Distinctive Core Histone Post-Translational Modification Patterns in Arabidopsis thaliana. PLoS One. 2007;2:e1210. doi: 10.1371/journal.pone.0001210. [DOI] [PMC free article] [PubMed] [Google Scholar]
- 20.Okada T, Endo M, Singh MB, Bhalla PL. Analysis of the histone H3 gene family in Arabidopsis and identification of the male-gamete-specific variant AtMGH3. Plant J. 2005;44:557–568. doi: 10.1111/j.1365-313X.2005.02554.x. [DOI] [PubMed] [Google Scholar]
- 21.Moritz LE, Trievel RC. Structure, mechanism, and regulation of polycomb-repressive complex 2. J Biol Chem. 2018;293:13805–13814. doi: 10.1074/jbc.R117.800367. [DOI] [PMC free article] [PubMed] [Google Scholar]
- 22.Wollmann H, et al. The histone H3 variant H3.3 regulates gene body DNA methylation in Arabidopsis thaliana. Genome Biol. 2017;18:94. doi: 10.1186/s13059-017-1221-3. [DOI] [PMC free article] [PubMed] [Google Scholar]
- 23.Friedman WE. Expression of the cell cycle in sperm of Arabidopsis: implications for understanding patterns of gametogenesis and fertilization in plants and other eukaryotes. Development. 1999;126:1065–1075. doi: 10.1242/dev.126.5.1065. [DOI] [PubMed] [Google Scholar]
- 24.Lu F, et al. Comparative Analysis of JmjC Domain-containing Proteins Reveals the Potential Histone Demethylases in Arabidopsis and Rice. J Integr Plant Biol. 2008;50:886–896. doi: 10.1111/j.1744-7909.2008.00692.x. [DOI] [PubMed] [Google Scholar]
- 25.Yan W, et al. Dynamic and spatial restriction of Polycomb activity by plant histone demethylases. Nature Plants vol. 2018;4:681–689. doi: 10.1038/s41477-018-0219-5. [DOI] [PubMed] [Google Scholar]
- 26.Min GL, et al. Demethylation of H3K27 regulates polycomb recruitment and H2A ubiquitination. Science (80-) 2007;318:447–450. doi: 10.1126/science.1149042. [DOI] [PubMed] [Google Scholar]
- 27.Lu F, Cui X, Zhang S, Jenuwein T, Cao X. Arabidopsis REF6 is a histone H3 lysine 27 demethylase. Nat Genet. 2011;43:715–9. doi: 10.1038/ng.854. [DOI] [PubMed] [Google Scholar]
- 28.Zheng S, et al. The Arabidopsis H3K27me3 demethylase JUMONJI 13 is a temperature and photoperiod dependent flowering repressor. Nat Commun. 2019;10 doi: 10.1038/s41467-019-09310-x. [DOI] [PMC free article] [PubMed] [Google Scholar]
- 29.Wu S-F, Zhang H, Cairns BR. Genes for embryo development are packaged in blocks of multivalent chromatin in zebrafish sperm. Genome Res. 2011;21:578–89. doi: 10.1101/gr.113167.110. [DOI] [PMC free article] [PubMed] [Google Scholar]
- 30.Borg M, et al. The R2R3 MYB Transcription Factor DUO1 Activates a Male Germline-Specific Regulon Essential for Sperm Cell Differentiation in Arabidopsis. Plant Cell. 2011;23:534–549. doi: 10.1105/tpc.110.081059. [DOI] [PMC free article] [PubMed] [Google Scholar]
- 31.Gehring M, Satyaki PR. Endosperm and Imprinting, Inextricably Linked. Plant Physiol. 2017;173:143–154. doi: 10.1104/pp.16.01353. [DOI] [PMC free article] [PubMed] [Google Scholar]
- 32.Moreno-Romero J, Del Toro-De León G, Yadav VK, Santos-González J, Köhler C. Epigenetic signatures associated with imprinted paternally expressed genes in the Arabidopsis endosperm. Genome Biol. 2019;20:41. doi: 10.1186/s13059-019-1652-0. [DOI] [PMC free article] [PubMed] [Google Scholar]
- 33.Makarevitch I, et al. Genomic distribution of maize facultative heterochromatin marked by trimethylation of H3K27. Plant Cell. 2013;25:780–793. doi: 10.1105/tpc.112.106427. [DOI] [PMC free article] [PubMed] [Google Scholar]
- 34.Inoue A, Jiang L, Lu F, Suzuki T, Zhang Y. Maternal H3K27me3 controls DNA methylation-independent imprinting. Nature. 2017;547:419–424. doi: 10.1038/nature23262. [DOI] [PMC free article] [PubMed] [Google Scholar]
- 35.Zhao P, et al. Two-Step Maternal-to-Zygotic Transition with Two-Phase Parental Genome Contributions. Dev Cell. 2019;49:882–893 e5. doi: 10.1016/j.devcel.2019.04.016. [DOI] [PubMed] [Google Scholar]
- 36.Bayer M, et al. Paternal control of embryonic patterning in Arabidopsis thaliana. Science (80-) 2009;323:1485–1488. doi: 10.1126/science.1167784. [DOI] [PubMed] [Google Scholar]
- 37.Khanday I, Skinner D, Yang B, Mercier R, Sundaresan V. A male-expressed rice embryogenic trigger redirected for asexual propagation through seeds. Nature. 2019;565:91–95. doi: 10.1038/s41586-018-0785-8. [DOI] [PubMed] [Google Scholar]
- 38.Horstman A, et al. The BABY BOOM Transcription Factor Activates the LEC1-ABI3-FUS3-LEC2 Network to Induce Somatic Embryogenesis. Plant Physiol. 2017;175:848–857. doi: 10.1104/pp.17.00232. [DOI] [PMC free article] [PubMed] [Google Scholar]
- 39.Boscá S, Knauer S, Laux T. Embryonic development in Arabidopsis thaliana: from the zygote division to the shoot meristem. Front Plant Sci. 2011;2:93. doi: 10.3389/fpls.2011.00093. [DOI] [PMC free article] [PubMed] [Google Scholar]
- 40.Vermeulen M, et al. Selective Anchoring of TFIID to Nucleosomes by Trimethylation of Histone H3 Lysine 4. Cell. 2007;131:58–69. doi: 10.1016/j.cell.2007.08.016. [DOI] [PubMed] [Google Scholar]
- 41.Zhao P, Begcy K, Dresselhaus T, Sun M-X. Does Early Embryogenesis in Eudicots and Monocots Involve the Same Mechanism and Molecular Players? Plant Physiol. 2017;173:130–142. doi: 10.1104/pp.16.01406. [DOI] [PMC free article] [PubMed] [Google Scholar]
- 42.Chen J, et al. Zygotic Genome Activation Occurs Shortly after Fertilization in Maize. Plant Cell. 2017;29:2106–2125. doi: 10.1105/tpc.17.00099. [DOI] [PMC free article] [PubMed] [Google Scholar]
- 43.Hammoud SS, et al. Distinctive chromatin in human sperm packages genes for embryo development. Nature. 2009;460:473–8. doi: 10.1038/nature08162. [DOI] [PMC free article] [PubMed] [Google Scholar]
- 44.Brykczynska U, et al. Repressive and active histone methylation mark distinct promoters in human and mouse spermatozoa. Nat Struct Mol Biol. 2010;17:679–87. doi: 10.1038/nsmb.1821. [DOI] [PubMed] [Google Scholar]
- 45.Sachs M, et al. Bivalent Chromatin Marks Developmental Regulatory Genes in the Mouse Embryonic Germline InVivo. Cell Rep. 2013;3:1777–1784. doi: 10.1016/j.celrep.2013.04.032. [DOI] [PMC free article] [PubMed] [Google Scholar]
- 46.Zheng H, et al. Resetting Epigenetic Memory by Reprogramming of Histone Modifications in Mammals. Mol Cell. 2016;63:1066–1079. doi: 10.1016/j.molcel.2016.08.032. [DOI] [PubMed] [Google Scholar]
- 47.Murphy PJ, Wu SF, James CR, Wike CL, Cairns BR. Placeholder Nucleosomes Underlie Germline-to-Embryo DNA Methylation Reprogramming. Cell. 2018;172:e13. doi: 10.1016/j.cell.2018.01.022. [DOI] [PubMed] [Google Scholar]
- 48.Tabuchi TM, et al. Caenorhabditis elegans sperm carry a histone-based epigenetic memory of both spermatogenesis and oogenesis. Nat Commun. 2018;9 doi: 10.1038/s41467-018-06236-8. 4310. [DOI] [PMC free article] [PubMed] [Google Scholar]
- 49.Kaneshiro KR, Rechtsteiner A, Strome S. Sperm-inherited H3K27me3 impacts offspring transcription and development in C. elegans Nat Commun. 2019;10:1271. doi: 10.1038/s41467-019-09141-w. [DOI] [PMC free article] [PubMed] [Google Scholar]
- 50.Zenk F, et al. Germ line-inherited H3K27me3 restricts enhancer function during maternal-to-zygotic transition. Science. 2017;357:212–216. doi: 10.1126/science.aam5339. [DOI] [PubMed] [Google Scholar]
- 51.Maehara K, et al. Tissue-specific expression of histone H3 variants diversified after species separation. Epigenetics Chromatin. 2015;8:35. doi: 10.1186/s13072-015-0027-3. [DOI] [PMC free article] [PubMed] [Google Scholar]
Associated Data
This section collects any data citations, data availability statements, or supplementary materials included in this article.


