Abstract
During aging progenitor cells acquire mutations, which may generate clones that colonize the surrounding tissue. By middle age, normal human tissues including the esophageal epithelium (EE) become a patchwork of mutant clones. Despite their relevance for understanding aging and cancer, the processes that underpin mutational selection in normal tissues remain poorly understood. Here we investigated this issue in the esophageal epithelium of mutagen-treated mice. Deep sequencing identified numerous mutant clones with multiple genes under positive selection including Notch1, Notch2 and Trp53, which are also selected in human esophageal epithelium. Transgenic lineage tracing revealed strong clonal competition that evolved over time. Clone dynamics were consistent with a simple model in which the proliferative advantage conferred by positively selected mutations depends on the nature of the neighboring cells. When clones with similar competitive fitness collide, mutant cell fate reverts towards homeostasis, a constraint that explains how selection operates in normal appearing epithelium.
Introduction
Normal adult human tissues are a patchwork of clones carrying somatic mutations that progressively accumulate with age and are linked to neoplasia and other diseases 1–3. This process is exemplified by human esophageal epithelium (EE), in which mutant clones colonize the majority of normal epithelium by middle age 4,5. The commonest mutated genes are under strong positive genetic selection, meaning that there is an excess of protein-altering over silent mutations within each gene. This argues that selected mutant genes confer a competitive advantage over wild-type cells in normal esophageal epithelium 6–8.
The cellular mechanisms that underpin the selection of mutant genes are not well understood. Possiblities include cell autonomous effects such as increased cell division or decreased differentiation rates and extrinsic effects due to competition between mutant and neighboring wild-type cells. Cell competition involves “winner” cells out-competing their “loser” neighbors, and operates in development, aging, and cancer 9–14.
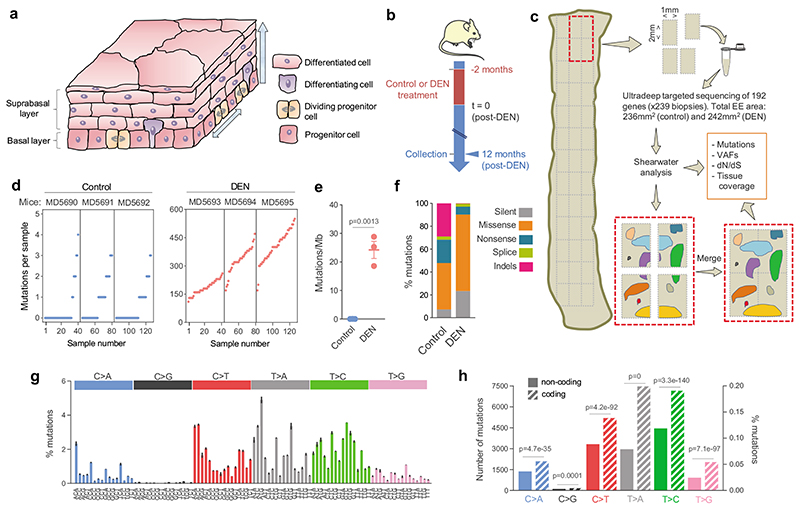
The simple structure and dynamics of the murine esophageal epithelium make it an ideal model to investigate this issue. It consists of layers of keratinocytes, with progenitor (proliferating) cells residing in the lowest basal cell layer. When progenitors commit to differentiation they withdraw from the cell cycle and move into the suprabasal layers, migrating towards the epithelial surface until they are finally shed (Fig. 1a) 15.
Figure 1. The mutational landscape of normal EE in control and DEN-treated mice.
a, Mouse esophageal epithelium (EE). Progenitor cells are confined to the basal layer. Differentiating cells exit the cell cycle, migrate out of the basal layer, through the suprabasal layers and are finally shed into the esophageal lumen. b, Protocol: wild-type mice were treated for 2 months with diethylnitrosamine (DEN) or vehicle and the esophagus collected 12 months later. c, Sequencing protocol: EEs from 3 control and 3 DEN-treated mice were cut into a contiguous grid of 2mm2 pieces, DNA extracted from each sample and ultradeep targeted sequencing performed. Mutations were called with the Shearwater algorithm. Mutant clones spanning adjacent samples were merged for analysis. d, Number of mutations per sample (each dot represents a sample). e, Estimated mutation burden in the 3 control and 3 DEN-treated EEs, bars indicate mean ± SEM (p value is with unpaired two-sided Student’s t-test). f, Percentage of mutation types identified in control and DEN-treated mouse EE. g, Mutational spectrum of DEN-treated samples. The bar plot illustrates the percentage of mutations in each of the 96 possible trinucleotides (mean ± SEM, n=3 mice). h, Strand asymmetry. Total substitutions in the coding (untranscribed, striped-bars) and non-coding (transcribed, solid-bars) strands for each mutation type in DEN-treated EE. Number of mutations in non-coding/coding strands: C>A = 1372/2098, C>G = 112/179, C>T = 3327/5200, T>A = 2963/7475, T>C = 4450/7154, T>G = 918/2041. Two-sided Poisson test. Sequencing data is detailed in Supplementary Table 2. VAF, variant allele frequency.
Upon division, cells generate either two progenitor daughters that remain in the basal layer, two differentiated daughters that exit the basal layer, or one cell of each type 15,16. The outcome of an individual progenitor division is unpredictable, but, on average across the tissue, the probabilities are balanced, generating equal proportions of progenitor and differentiated cells, maintaining cellular homeostasis (Extended Data 1a).
Importantly, mouse esophageal epithelium progenitors lie in a continuous sheet with no barriers to limit the lateral expansion of mutant clones, which may eventually collide and compete with each other as well as with wild-type cells 4,6,8,17.
Here we investigate the competitive selection of diverse somatic mutant clones in vivo. We used oral administration of diethylnitrosamine (DEN), a well characterized mutagen found in tobacco smoke, to generate a patchwork of mutant clones in the mouse esophageal epithelium resembling that of older humans 18,19. By combining ultradeep sequencing and lineage tracing we resolved clone dynamics in this evolving mutational landscape. Clone dynamics depend on the mutation(s) they carry and the nature of the neighboring cells. Once an expanding mutant clone collides with cells of similar ‘fitness’, its proliferative advantage decreases, reverting towards the balanced proliferation and differentiation that characterizes tissue homeostasis.
Results
Mutational landscape of DEN exposed esophageal epithelium
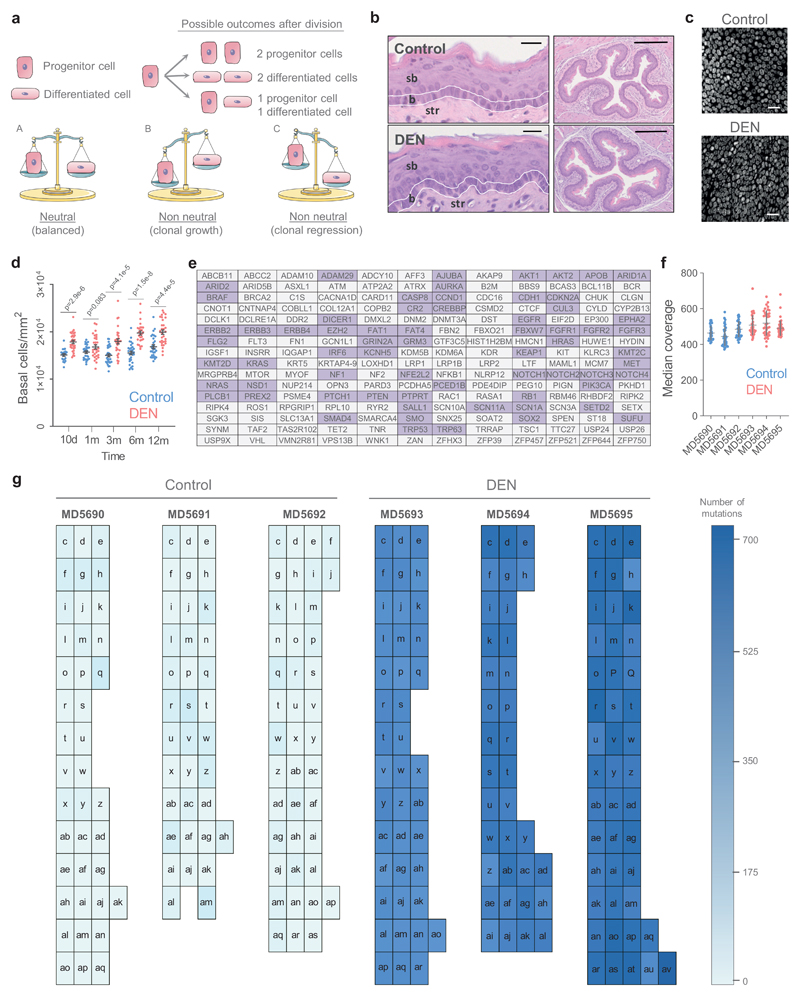
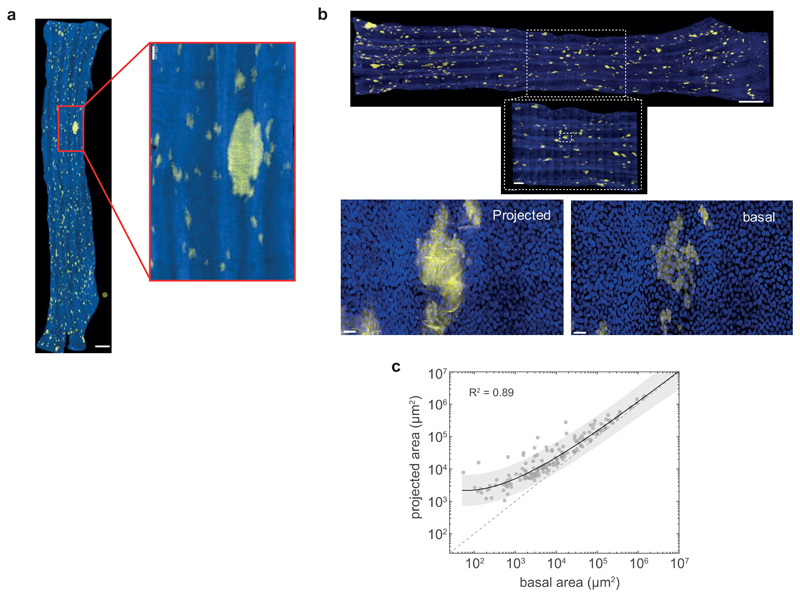
We began by characterizing the mouse esophageal epithelium mutational landscape that evolved over a year following administration of the mutagen DEN, a protocol that generates only one benign hyperplastic lesion per esophagus on average (Fig. 1b) 19. Confocal imaging of the entire epithelium showed over 98% of the tissue area was histologically normal, apart from slight crowding of cells in the basal layer (Extended Data 1b-d, Supplementary Table 1).
To detect mutant clones we used a sequencing approach adapted from human esophageal epithelium 4. The entire esophageal epithelium of control and DEN-treated mice was separated from the underlying stroma and cut into a contiguous array of 2 mm2 samples (239 samples in total) (Fig. 1c). Ultradeep targeted exome sequencing (TES) of 192 genes, including those recurrently mutated in mouse and/or human squamous cancers, was performed on each sample to a median on-target coverage of 485× (Extended Data 1e, f).
Mutations were called using the ShearwaterML algorithm, which detected mutant clones as small as 0.018 mm2, containing about 400 basal cells 4,20. After merging mutations shared by adjacent samples we identified 29,491 independent somatic single nucleotide variants (SNVs) in DEN-treated mice and 66 in controls (equivalent to 122 and 0.28 events per mm2, respectively) (Fig. 1d; Extended Data 1g, Supplementary Table 2). The mutational burden was ~24 mutations per megabase compared to ~0.03 in control mice, 0.2-0.8 in normal human esophagus and 2-10 in human esophageal cancers (Fig. 1e) 4. Functionally, most mutations were protein-altering, with missense SNVs being the commonest in both DEN-treated and control samples (Fig. 1f).
The mutational spectrum after DEN treatment was dominated by T>A/A>T, T>C/A>G and C>T/G>A alterations (~82% of total substitutions), with few C>G/G>C SNVs (~0.8%), typical of the DEN signature (Fig. 1g) 21,22. There were significantly more mutations in coding (untranscribed) than non-coding (transcribed) strands, consistent with mutations generated from transcription-coupled DNA repair (Fig. 1h).
Thus, DEN administration generates a dense patchwork of mutant clones in mouse esophageal epithelium, which appears to function normally despite a remarkably high mutation burden.
Mutational selection in DEN-treated esophageal epithelium
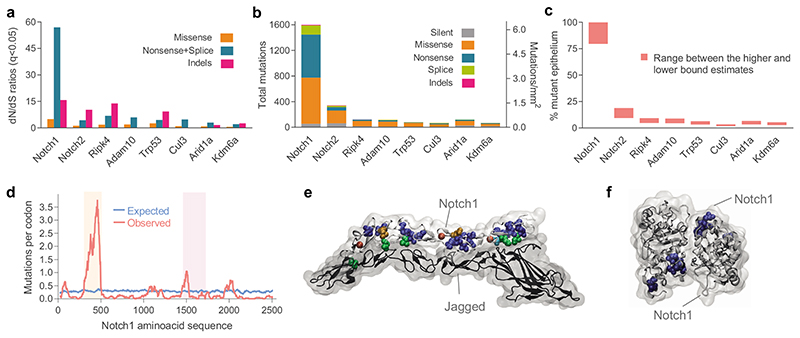
To investigate whether the persistent mutant clones in DEN-treated mouse esophageal epithelium emerged from a competitive selection, as seen in aging human esophageal epithelium, we calculated the ratio of non-synonymous (dN) to synonymous (dS) mutations (dN/dS) across each sequenced gene using dNdScv 4,23,24. This approach controls for trinucleotide mutational signatures, sequence composition and variable mutation rates across genes. In our experiment, the dN/dS ratio indicates the likelihood of a clone carrying a non-synonymous mutation to reach a detectable size, compared with a synonymous mutation in the same gene. Protein-altering mutations that have no effect on cell behavior will have the same chance as being detected as silent mutations in the same gene, yielding dN/dS ratios of 1. Values of dN/dS<1 would indicate negative selection, resulting in clonal loss. Conversely, values of dN/dS>1 indicate the mutated gene confers a competitive advantage. We found 8 mutant genes with dN/dS ratios significantly higher than 1 (Fig. 2a; Supplementary Table 3).
Figure 2. Positive selection of somatic mutations in DEN-treated EE.
a, dN/dS ratios for missense and truncating (nonsense + essential splice site) substitutions and insertions or deletions (indels) indicating genes under significant positive selection in normal EE from DEN-treated mice (29,491 mutations; q<0.05, R package dndscv 24). Data and statistics are available in Supplementary Table 3. b, Number and type of mutations in the significantly positively selected genes. c, Estimated percentage of DEN-treated EE carrying non-synonymous mutations for each gene. d, Number of missense mutations/codon within Notch1. Blue line is the expected distribution calculated from the mutational spectrum of DEN and the Notch1 coding sequence; red line is the observed distribution. Mutations were clustered in the extracellular EGF8-EGF12 repeats that form the Notch 1 ligand binding domain (light orange shadow) and in the negative regulatory region (NRR) of Notch1 (light purple shadow). e-f, 3D structures of the highly mutated regions. e, Ligand binding domain showing NOTCH1 bound to JAGGED1 (Protein Data Bank code: 5UK5); see also Supplementary video 1. f, NRR domain and cleavage site for NOTCH1 after ligand binding (Protein Data Bank code: 3ETO), see also Supplementary video 2. Recurrently mutated codons were: cysteine residues in disulfide bonds (blue), leucine to proline in β-sheets (orange), mutations affecting D469 (cyan), mutations of calcium binding residues (red) and mutations on the ligand binding interface (green), all predicted to disrupt the protein structure or the binding to the ligand.
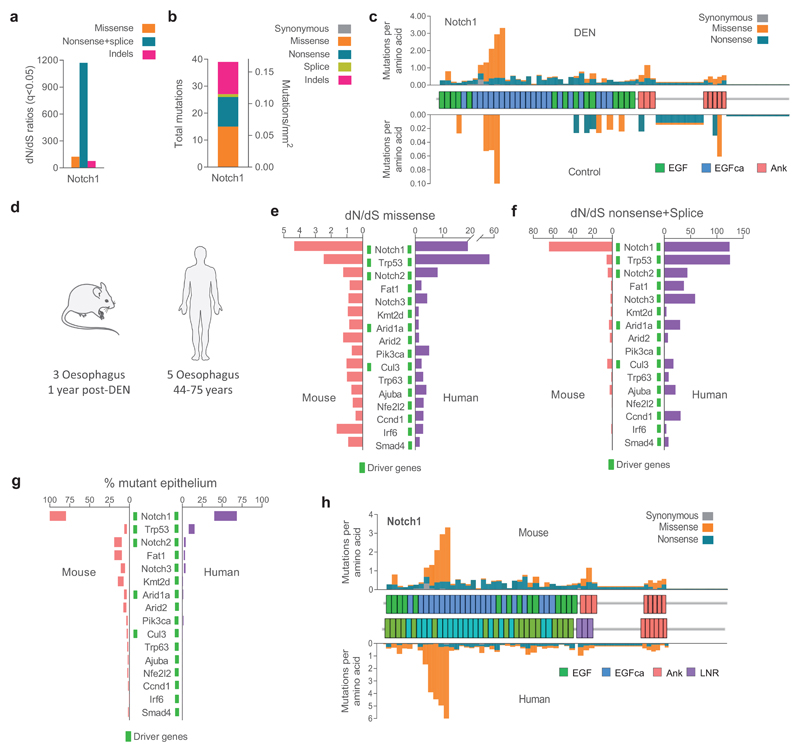
Of the selected genes, Notch1, Notch2, Trp53, Cul3 and Arid1a are implicated in keratinocyte progenitor cell differentiation 4,6,8,25–27. Arid1a and Kdm6a encode chromatin modifiers and are recurrently mutated in human esophageal cancer 28–30. The Adam10 protein product cleaves Notch receptors following ligand binding, and Ripk4 encodes a tumor suppressor in mouse epidermis 31,32, 33–35. The known functions of the positively selected mutant genes are thus consistent with them driving clonal expansion.
The most prevalent selected mutant gene was Notch1, with a total of 1,601 coding-altering mutations (Fig. 2b). We estimated clones carrying Notch1 mutations colonized over 80% of the DEN-treated esophageal epithelium, whereas the remaining selected genes each covered between 1.7%-19% (Fig. 2c). The large number of Notch1 missense mutations allowed us to perform an additional test for selection by comparing the predicted and observed distributions of codon-altering mutations (Fig. 2d). Predicted codon changes were evenly distributed, but those observed were clustered in the 5 EGF repeats that form the Notch1 ligand binding domain, disrupting EGF repeat structure and/or the contact surface between Notch1 and its ligands (Figs. 2d,e; Supplementary video 1). A second cluster of mutations was seen in the Notch negative regulatory region, which is cleaved by Adam10 following ligand binding (Figs. 2d,f; Supplementary video 2) 36,37. The distribution of codon alterations thus provides further evidence of selection.
There were few spontaneously generated coding mutations in control mice, predominantly concentrated in the Notch1 gene (39/66 mutations, all non synonymous) (Extended Data 2a, b). Notch1 mutations were similarly distributed to those in DEN-treated mice (Extended Data 2c). However, mutations in the 8 positively selected genes occupied only 1.6-3.2% of the control esophageal epithelium, suggesting the tissue predominantly behaves neutrally, in agreement with published lineage tracing experiments 15,16.
Comparing our results with sequencing of aging normal human esophagus showed that Notch1, Trp53, Notch2, Cul3 and Arid1a were positively selected in both species (Extended Data 1e, 2d; Supplementary Tables 4,5) 4. The similarities of the most strongly selected genes, together with the predominance and clustering of Notch 1 mutations, indicate that genetic selection in normal esophageal epithelium is convergent in mutagen-treated mouse and aging humans, despite the large differences in time scale and mutational spectrum (Extended Data 2e-h).
Lineage tracing identifies clonal competition
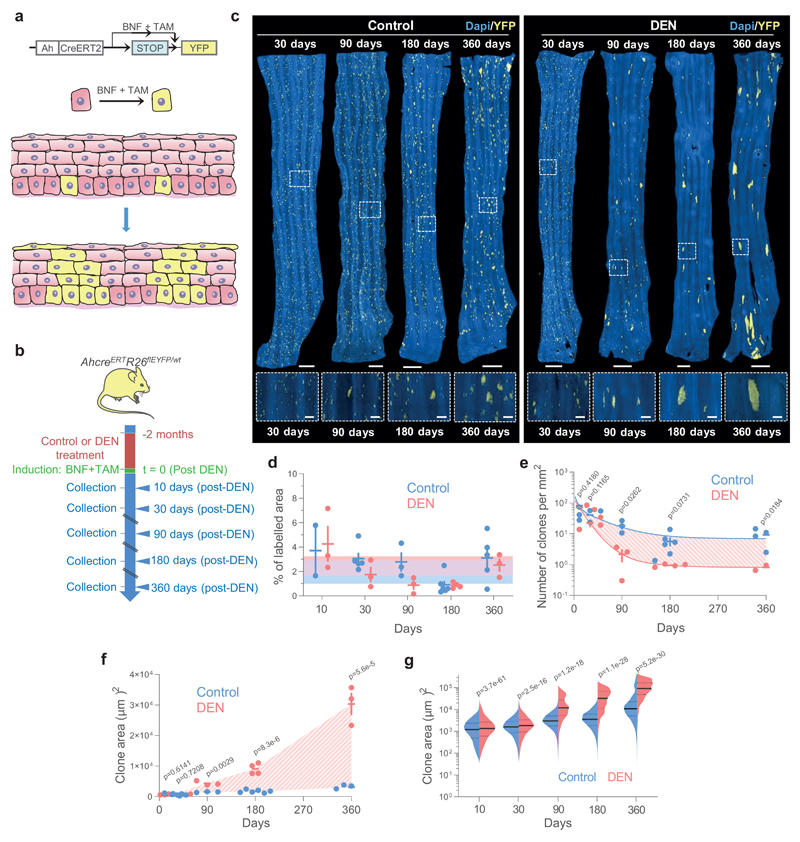
Genetic selection of mutations might be expected to alter clonal behavior. To test this, we performed genetic lineage tracing and tracked cohorts of YFP-labelled clones in control and DEN-treated AhcreERTRosa26flEYFP/wt (YFP-Cre) transgenic mice (Figs. 3a,b). Following mutagen exposure, YFP-clones were generated by inducing heritable YFP expression in scattered single progenitor cells. Clonal density and size were analysed from 3D-confocal images of entire esophageal epithelia collected at different time points up to a year (Figs. 3b, c; Methods). A total of 37,528 and 21,782 clones were quantified in control and mutagen-treated mice, respectively (Supplementary Table 6). The total area of labelled epithelium remained ~2% in both groups, consistent with the labelled cells being a representative subset of the entire progenitor population (Fig. 3d; Supplementary Note).
Figure 3. Lineage tracing reveals hallmarks of strong clonal competition in DEN-treated EE.
a, In vivo genetic lineage tracing using AhcreERTRosa26flEYFP/wt reporter mice.Cre-mediated excision of the stop codon by tamoxifen (TAM) and ß-napthoflavone (BNF) injection results in the heritable expression of yellow fluorescent protein (YFP), generating YFP-labelled clones. b, Protocol: AhcreERTRosa26flEYFP/wt mice were treated with DEN or vehicle control for 2 months, followed by clonal labelling. EE was collected at the indicated time points. c, Representative 3D-projected confocal images of control and DEN-treated EE collected at the indicated time points. Nuclear (DAPI) staining is blue and YFP-labelled clones are yellow. Insets are enlarged views of dashed areas. Scale-bars: main panels 1mm, insets 200μm. d, Percentage of EE area labelled. Shaded areas indicate mean and 95% confidence bounds across all time points. Each dot represents a mouse, error-bars correspond to mean ± SEM (see n numbers below). e-f, Number of clones per mm2 of EE (e) and average area of clones (f) in control and DEN-treated mice collected at the indicated time points. Shading indicates the difference between the fitted curves. Each dot represents a mouse. Error-bars: mean ± SEM (p values from two-sided Student’s t-test; see n numbers below). g, Violin plots depicting the distributions of individual clone areas in control and DEN-treated mice. Lines show median and quartiles. p values are from two-sided two-sample Kolmogorov-Smirnov test. Number of mice (clones) for d-g (control/DEN): 10d = 2/3 (11552/15092), 1m = 5/3 (15865/5682), 3m = 3/3 (4152/539), 6m = 6/4 (2474/281), 12m = 5/3 (3485/188). See Supplementary Table 6.
In control esophageal epithelia, the number of labelled clones decreased over time, whereas the average clone area and inferred mean number of basal cells per clone grew approximately linearly with time (Figs. 3c, e-g; Supplementary Note). These features are hallmarks of neutral clonal competition between functionally equivalent progenitors, with the loss of some clones by differentiation compensated by the expansion of adjacent ones 6,15,16,19,38 (Supplementary Note). Of note, we observed a small proportion of unexpectedly large clones that may result from spontaneous mutations conferring a competitive advantage i.e. Notch1 mutants (Extended Data Fig. 3a).
Compared to controls, the rate of clonal loss in mutagen-exposed esophageal epithelium was significantly increased, while the surviving clones expanded more rapidly (Figs. 3c, e-g). This indicates that the mutational landscape that evolves after DEN treatment develops from strong clonal competition causing the increased growth of “winner” mutant clones, thence eliminating more clones than in control esophageal epithelium (Supplementary Note).
Mechanisms of clonal competition
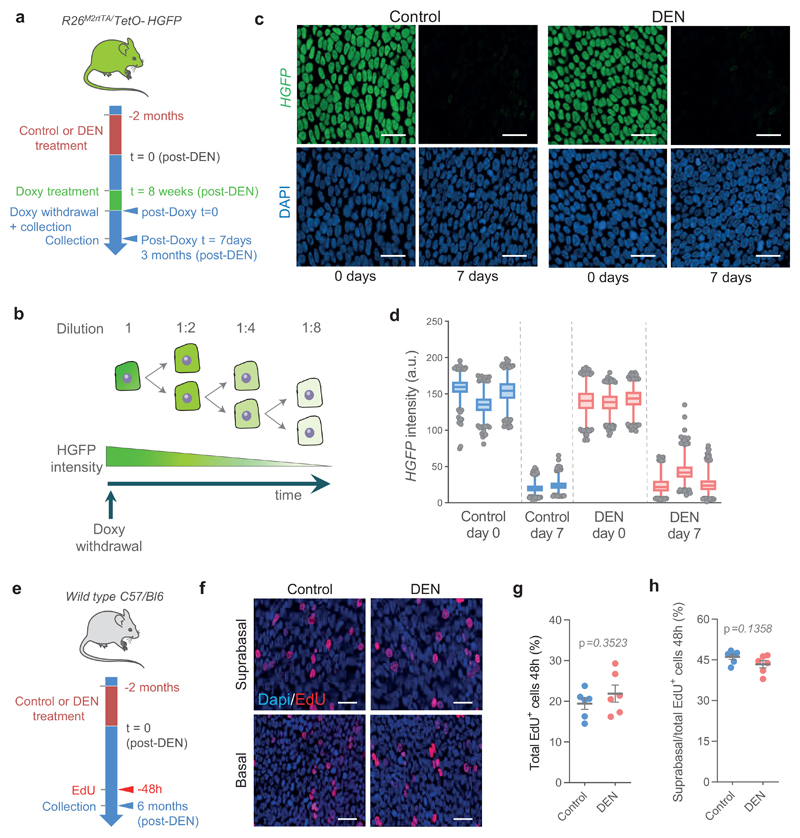
Next, we investigated the mechanism(s) of mutant clonal competition in the DEN-treated esophageal epithelium. As most of the mutagenized esophageal epithelium was eventually colonized by positively selected mutant clones, we expected that the behavior of most progenitor cells would diverge from normal. However, label-retaining and EdU-short term lineage tracing experiments indicated rates of cell division and stratification were not significantly different from controls (Extended Data 4; Supplementary note; Supplementary Tables 7, 8). A further potential route of cell and clone loss is apoptosis, but this was found to be negligible in DEN-treated esophageal epithelium (0.04% of basal cells were positive for activated Caspase 3; Methods) 19.
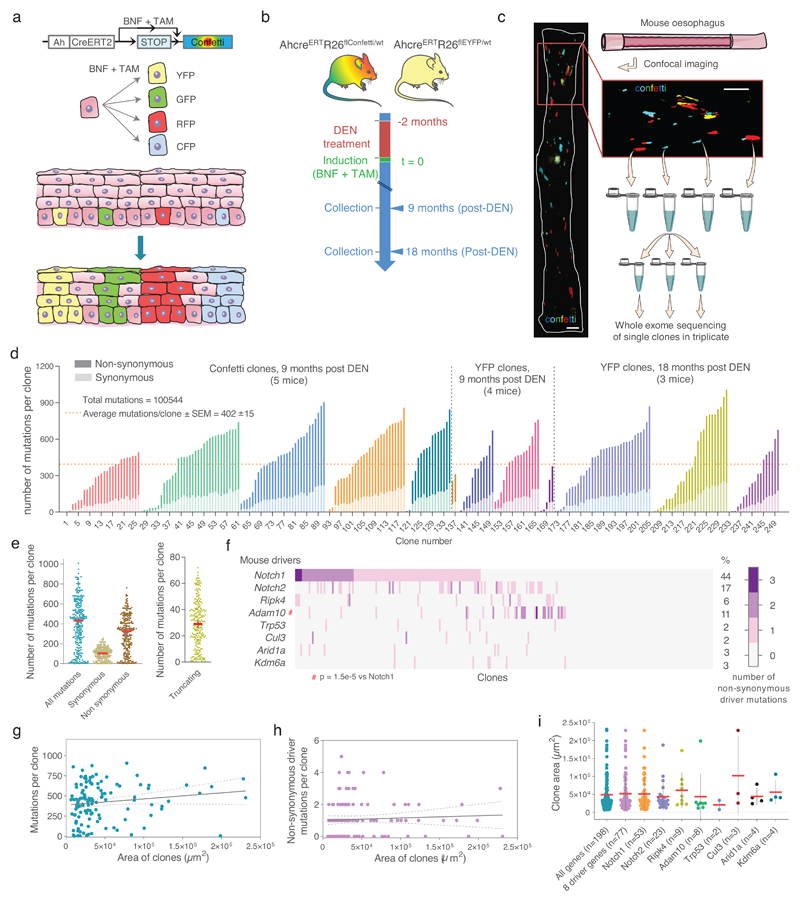
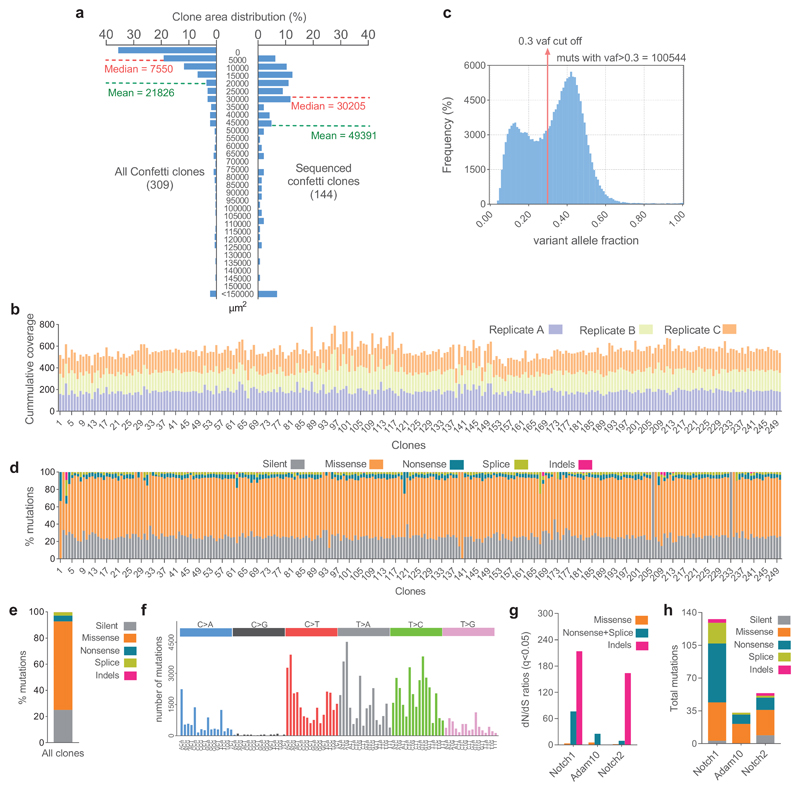
We went on to explore whether the survival and expansion of “winner” clones was determined by the mutation(s) they carry. The sequencing strategy used above cannot resolve which mutations reside in the same clone. We therefore performed whole exome sequencing (WES) of individual clones identified by genetic lineage tracing in mutagen-treated normal esophageal epithelium. Scattered single cells were genetically labelled immediately after DEN-treatment in single color YFP-Cre or multicolor AhcreERTRosa26flConfetti/wt (Confetti-Cre) mice, and esophageal epithelia collected 9 or 18 months later and imaged (Figs. 3a, 4a-c). 250 of the surviving larger clones (>0.005 mm 2), representative of the upper 50% of the clone size distribution, were isolated under a fluorescent dissecting microscope (Figs. 4c; Extended Data 5a; Supplementary Table 9). Genomic DNA was extracted from each clone and split into three pools, each of which underwent independent whole genome amplification (WGA) and WES to an average coverage per replicate of 186× (Figs. 4c, Extended Data 5b). To exclude artefactual SNVs generated during WGA, only mutations shared by all three amplified triplicates with a variant allele frequency (VAF)>0.3, indicating they were clonal or near clonal, were included in the analysis (Extended Data 5c; Supplementary Table 10).
Figure 4. Whole exome sequencing of single clones isolated from DEN-treated mice EE.
a, In vivo genetic lineage tracing using AhcreERTRosa26flConfetti/wt mice. TAM and BNF injections activate Cre-mediated inversion and excision recombination events in scattered single cells, conferring heritable expression of one of the four fluorescent proteins (YFP, GFP, RFP and CFP), resulting in labelled clones. b, Protocol: Single color AhcreERTRosa26flEYFP/wt (Fig. 3a) or multicolor AhcreERTRosa26flConfetti/wt mice received DEN for 2 months, followed by clonal labelling and tissue collection at the indicated time-points. c, Individual labelled clones were whole exome sequenced in triplicate. Scale bars =1mm. d, Number of synonymous (light colored) and non-synonymous (dark colored) mutations per clone (each mouse is shown in different colors), ranked by mutation burden (n=250 clones from 12 mice). e, Number of total, synonymous, non-synonymous and truncating (nonsense + essential splice site) mutations per clone (each dot represents a clone, n=250 clones), red line indicates median with 95% CI. f, Combinations of non-synonymous mutations in the 8 positively selected genes (see Fig. 2a) within individual clones. The percentage of clones mutant for each gene is indicated. g-h, Correlation between the area of individual clones and the number of mutations (g) or the number of non-synonymous mutations in the 8 selected genes (h). Fitted lines indicate linear regression (Pearson r; (g): r2=0.02, p = 0.1; (h): r2=0.003, p = 0.5; n=121 clones). i, Area of clones carrying mutations (non-exclusively) in the indicated genes (mean ± SD, sample size indicated in brackets). See Supplementary Table 11.
After applying these conservative criteria, we identified a total of 100,544 SNVs (Supplementary Table 11). The spectrum and functional impact of mutations were consistent with targeted exome sequencing (Extended Data 5d-f). The median number of SNVs/exome for isolated clones was 433 (Figs. 4d,e), 5-10 fold higher than in aging normal human esophageal epithelium 5. Most mutations were protein-altering, with up to 72 protein-truncating mutations across the exome per clone (Fig. 4e).
65% of the clones carried mutations in one or more of the 8 selected genes identified by TES (Fig. 4f). Despite the small number of clones sequenced, dN/dS analysis showed Notch1, Notch2 and Adam10 were positively selected (Extended Data 5g, h; Supplementary Table 12). No other selected genes were detected. Most clones (53.6%) carried 1-2 positively selected mutations, ranging from 0 to 5. Adam10 mutations were significantly more likely to occur in Notch1 wild-type clones (p= 1.5 × 10⁻⁵, Fisher’s exact test with multiple test correction), consistent with Adam10 mutations being an alternative route to decreasing Notch signaling (Fig. 4f).
We expected that the largest clones would carry the most strongly selected driver mutations. However, there was no correlation between the size of the sequenced clones and the total number of mutations per clone, the number of non-synonymous driver mutants per clone or the presence of individual driver mutations (Figs. 4g-i). This may reflect the late time points analyzed, and we may speculate that at an early stage, strongly selected mutant clones would be expanding in a background of cells of lower competitive fitness and that clone size may indeed reflect the fitness conferred by the mutation(s) it carries 6.
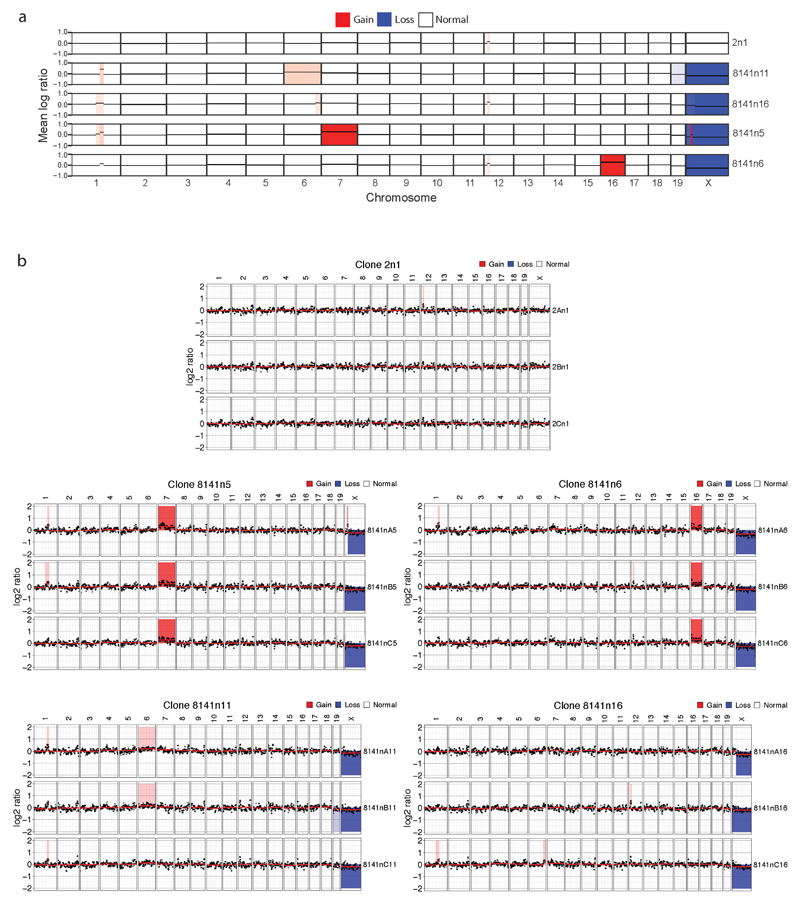
We also looked for clonal copy number alterations (CNAs), which are rare in normal human esophageal epithelium but common in esophageal cancers 4,5. Only 4 out of the 250 clones showed evidence of limited CNAs, indicating that clonal expansion in the mutagen-treated mouse esophageal epithelium is not driven by chromosomal alterations (Extended Data 6).
Collectively, these findings confirm that clones carrying positively selected mutations spread widely in the esophageal epithelium. However, the mutations carried by a clone do not appear to be the sole factor determining clone size. In addition, the average rates of basal cell division and stratification remained almost unchanged following mutagen treatment, despite genetic and lineage tracing evidence of strong selection (Figs. 2, 3). We next set out to investigate how these observations may be reconciled.
Mutant cell fate depends on fitness of neighboring cells
To further explore cellular mechanisms of competition we drew on previous insights into normal and mutant progenitor cell behavior in murine esophageal epithelium. In homeostasis, dividing progenitor cells have an equal chance of generating progenitor or differentiating daughters (Extended Data 1a) 15. A common feature of transgenic Notch and p53 mutant keratinocytes in a background of wild-type cells is an imbalance in division outcome, so the average mutant cell division produces more progenitor than differentiating daughters, thus increasing the mutant population 6,8. This gives mutant clones an advantage even if the rate of cell division is unchanged (Extended Data 1a). We hypothesized that such a mechanism may operate in mutagen-treated esophageal epithelium (Supplementary Note).
A second key observation from Notch and p53 mutant progenitors is that, in the long term, their fate reverts towards the balance of normal homeostasis. This allows clones to persist in a normal-appearing epithelium in which the only abnormality is a modest increase in basal cell density, like that observed following DEN treatment 6,8. Competition in a normal epithelium is thus a zero-sum game in which clonal expansion is limited by the tissue finite size (Supplementary Note).
We speculated that the fate of DEN-mutated progenitors may depend on the genotype of neighboring cells (Fig. 5a; Supplementary Note). Initially, a driver mutant progenitor is surrounded by wild-type cells and shows a fate bias towards proliferation, leading to clonal expansion as wild-type cells are outcompeted at the clone edge. After this, mutant clones will begin to collide with each other, competing for space, so that eventually they become surrounded by similarly competitive mutants, at which point their cell fate reverts towards balance.
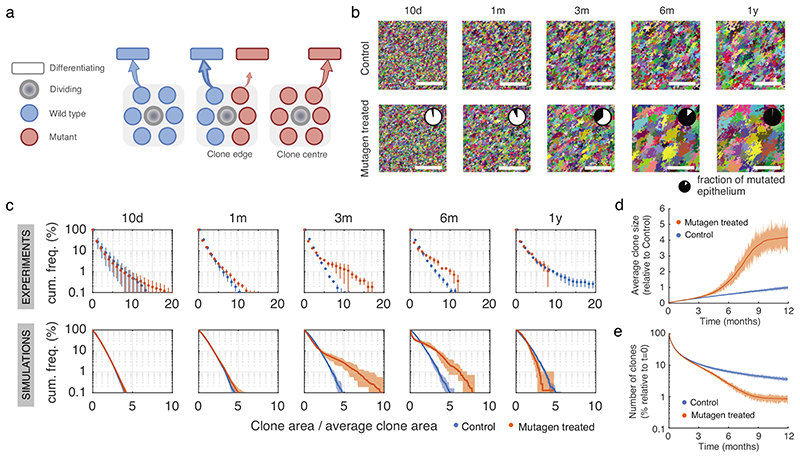
Figure 5. The “neighbour-constrained fitness” (NCF) model.
a, In the NCF model, progenitor cell division (bold outline) is linked to a neighboring cell differentiating and exiting from the basal layer. Mutations in neighboring cells may determine their likelihood of differentiating. When all neighbor cells are equivalent, either wild-type (left) or mutant (right), they all have equal probability of differentiation. When neighboring cells differ in their probability of differentiating (e.g. at mutant clone edges), cells with higher probability of differentiation are “losers” whereas those with a lower likelihood of differentiation will, on average, ‘win’ and persist (Supplementary Note). b, Simulations of wildtype (top) or mutant (bottom, mimicking an in vivo DEN treatment scenario) clones growing over time. Each colour represents a labelled clone. A simple setting was considered, with all mutant cells assigned the same fitness value (δ^M). Pie charts indicate the total fraction of mutated epithelium. See Supplementary Note. c, Cumulative distributions of clone sizes normalized by the average clone area at each time point, in control and mutagen-treated conditions. Experimental data (top panels) is shown as mean frequency ± SEM. Number of clones (control/DEN): 10d=11552/15092, 1m=15865/5682, 3m=4152/539, 6m=2474/281, 12m=3485/188. Results from the theoretical model simulations are displayed below (shaded areas correspond to 95% plausible interval frequencies from n=90.000 competing clones). d-e, NCF model predictions for the average clone size (d) and clone density (e) over time (shaded areas are 95% plausible intervals, n=90.000 clones). A simple setting was considered, with all mutant cells assigned the same δ^M. See supplementary Note.
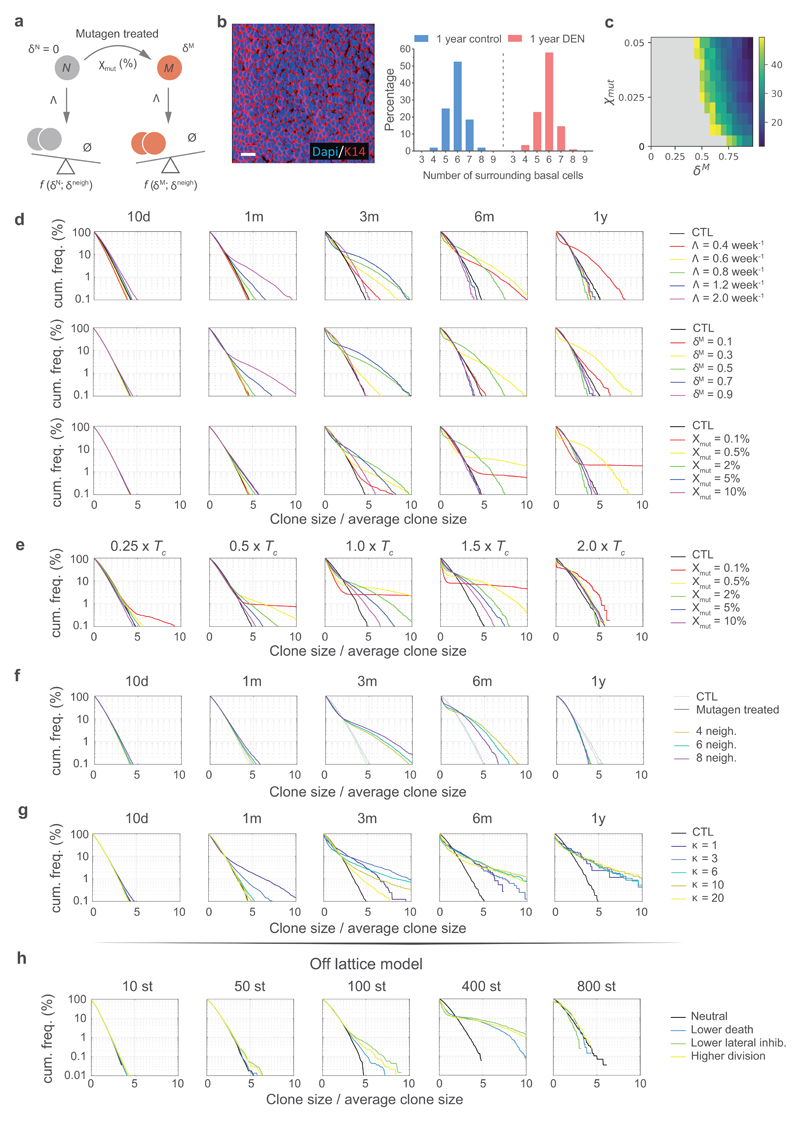
To explore this neighbor-contrained fitness (NCF) hypothesis quantitatively, we developed a two-dimensional lattice-based model, where cell division occurs at random and leads to replacement of an adjacent cell. Fitness differences manifest in different likelihoods of adjacent wild-type and mutant cells to be lost by differentiation (Fig. 5a; Extended Data 7; Supplementary Note). Simulations of the dynamics of clones carrying a neutral mutation in a pure wild-type environment reproduced the features of neutral clonal competition observed in control animals (Figs. 3e,f; 5b-e; Supplementary video 3). We next simulated a single highly competitive mutation expressed in scattered single cells within a wild-type epithelium (Figs. 6a top panels, 6b; Supplementary video 4).
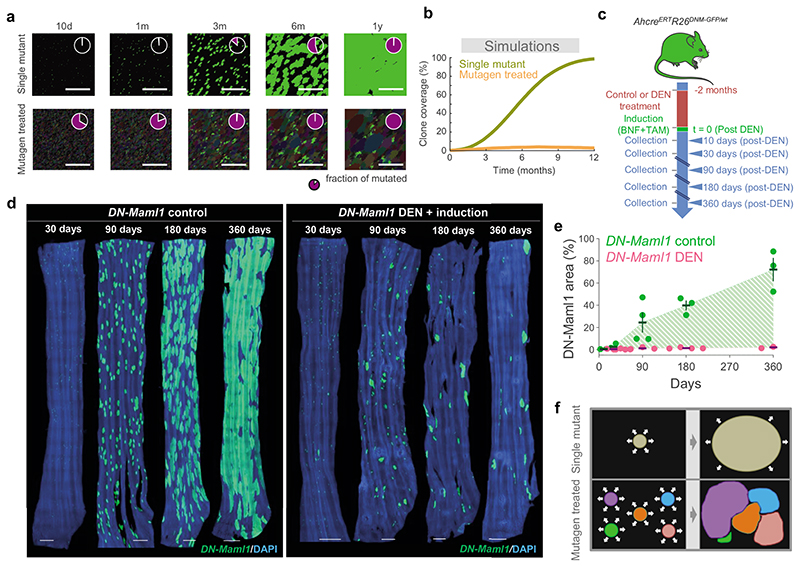
Figure 6. Clonal growth is conditional to their fitness relative to surrounding clones.
a, Simulations of the expansion of high-competitive single mutant clones (green) induced within a wildtype environment (top) or within a highly mutated landscape (bottom), equivalent to that in DEN-treated mice (pale colors indicate mutant clones). In the later, every initial mutant cell is given a different competitive fitness, with δ^M randomly drawn from a distribution F=(1-Gamma(κ,1/κ)), with shape determined by parameter κ. Pie charts indicate the fraction of mutated epithelium. b, Simulated clonal expansion for highly competitive single mutant clones generated within a wildtype or a mutated environment, as in a. c, Protocol: AhcreERTRosa26wt/DNM-GFP (MAML-Cre) mice (Extended Data 8a) received DEN or vehicle control for 2 months followed by clonal labelling. Tissues were harvested at the indicated time points. d, Confocal images of control and DEN-treated MAML-Cre EEs collected at the indicated time points post-induction (blue = DAPI, green = DN-Maml1). Scale-bars: 1mm. e, Percentage of EE covered by DN-Maml1 clones in control and DEN-treated MAML-Cre mice, collected at the indicated time points (shadow indicates differences between averages). Each dot represents a mouse (mean ± SEM). Number of mice (control/DEN): 10d=3/3, 1m=3/5, 3m=4/3, 6m=3/4, 12m=3/3. See Supplementary Table 13. f, Schematic of the behaviour of mutant clones in the presence of wild type (top; black area represent wild-type clones) or other mutant clones (bottom; coloured areas represent clones carrying different mutations). Expansion of a particular clone is subject to the presence of other mutant clones around it.
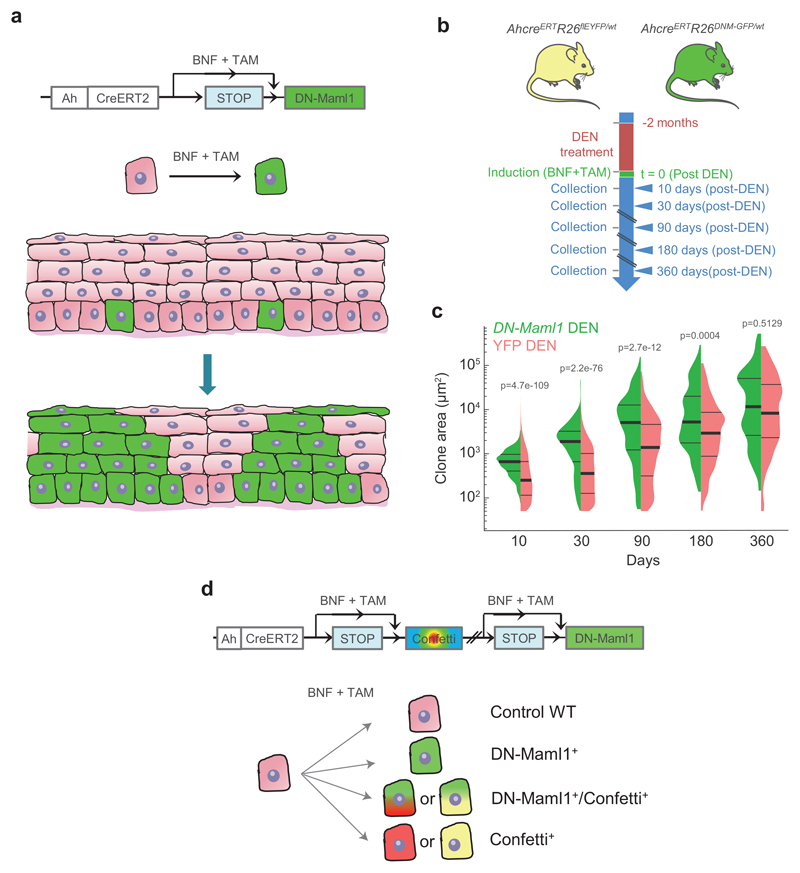
We compared the results of this simulation with a transgenic mouse experiment in which the highly competitive dominant negative mutant allele of Maml-1 fused to GFP (DN-Maml1), that inhibits Notch signaling, was induced in single progenitors (Figs. 6c, Extended Data 8a) 6. DN-Maml1 expressing cells outcompeted wild-type cells, generating rapidly expanding clones (Figs. 6d left panel, 6e). Despite its simplicity, the NCF model recapitulates the main features of both the short- and long-term dynamics of clones carrying a single neutral or a highly competitive mutant growing in a wild-type background.
Having validated the NCF hypothesis in these simple scenarios, we explored clonal competition in mutagen-treated esophageal epithelium (Supplementary Note). A simple setting, in which mutant cells were assigned the same fitness value, produced results consistent with the behavior of YFP-labelled clones in DEN-treated esophageal epithelium, both in terms of clone size and the proportion of clones that persisted over time (Figs. 3e, f; 5b-e; Supplementary Note). From a theoretical perspective, clone size distributions adopt a characteristic exponential form under neutral drift, seen in both control experimental and simulated results (Fig. 5c; Supplementary Note). Notably, experimental YFP-labelled clones showed a broader distribution of sizes following mutagen treatment, which curved and became enriched in larger clones at intermediate time points before collapsing back towards an exponential-like form at the one-year time point. Simulations under different parameter values indicated this change in the form of the distribution of clone sizes occurs concomitantly with the onset of confluence of highly competitive driver clones in the tissue (Figs. 5b; Supplementary video 3; Supplementary Note). This behavior suggests that dynamics in the mutated epithelium revert towards neutrality due to clonal interactions following a transient period of strong competition and selection. This is consistent with the lack of a correlation between the presence of strongly selected mutants and clone size (Figs. 4g-i). Taken together, simulated and experimental data argue that the dynamics of mutant clones in the mutagen treated esophageal epithelium are driven by neighbor-constrained fitness.
Validation of the neighbor-constrained fitness model
A strength of the NCF hypothesis is that it makes testable predictions. One prediction is that the expansion of mutant clones will vary according to the surrounding mutational patchwork, as their growth is conditional on their fitness relative to adjacent clones (Figs. 6a,b,f; Supplementary video 4). To test this, we performed lineage tracing in conditional DN-Maml1 mice, tracking the expansion of the highly competitive DN-Maml1 mutant clones in animals previously treated with DEN (Fig. 6c). DN-Mamll clone growth was constrained in the DEN-treated epithelium compared with untreated mice (Figs. 6d,e; Supplementary Table 13). This was presumably due to DN-Maml1 mutant clones colliding with other clones carrying DEN-induced mutations of similar competitive fitness, such as those carrying Notch1 mutations (Fig. 2), at which point they would revert towards neutral competition (Fig. 5a). Comparison of clone size distributions in DEN-treated YFP versus DN-Maml1 mice demonstrated that the initial growth advantage of DN-Maml1 over neutral YFP-labelled clones within a highly mutated environment decreases over time, arguing that expanding clones do indeed revert towards neutrality when they encounter similarly competitive clones (Extended Data 8b,c; Supplementary Table 14). Together, the simulations and experimental results indicate that mutant clone growth is influenced by the genotype of the surrounding clones.
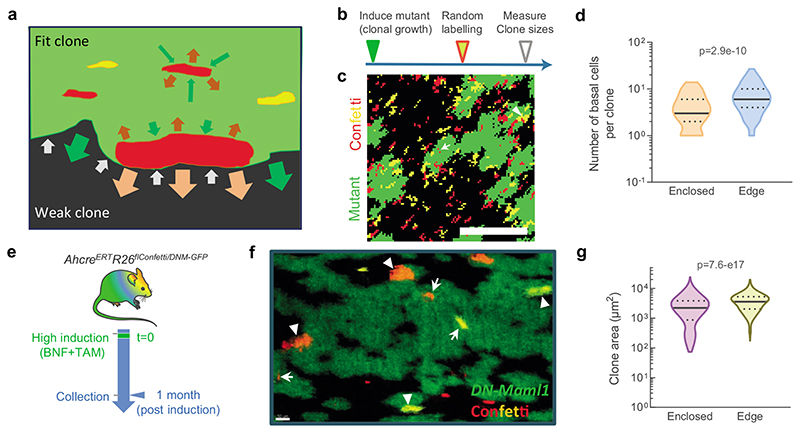
A further prediction is that clone growth would be expected to occur predominantly at the edges of mutant clones, where progenitors may encounter less fit neighbours (Fig. 7a). In the center of the clone all cells are genetically identical and have no fitness advantage over their neighbours. This prediction was tested in silico by simulating the expansion of highly competitive single mutant clones and the subsequent random labelling of single cells within them (Fig. 7b). The results indicated that the labelled subclones indeed grew faster when they were located at the borders rather than in the center of the mutant clones (Figs. 7c,d; Supplementary Video 5). To validate the simulations, we generated a new mutant mouse strain: AhcreERTRosa26flConfetti/DNMaml-GFP (Confetti-DN-Maml1). These animals carry a conditional reporter that labels cells with one of 4 colors after induction, as well as the DN-Maml1 allele (Extended Data 8d). Confetti labelling occurs at a much lower frequency than DN-Maml1 recombination, allowing visualization of labelled clones in both wild-type and DN-Maml1 expressing areas. We induced Confetti-DN-Maml1 animals and collected the esophagus 1 month later (Fig. 7e). Confetti clones lying within DN-Maml1 expressing areas were significantly smaller than those in contact with wild-type cells at DN-Maml1 boundaries (Figs. 7f,g; Supplementary Table 15).
Figure 7. A competitive advantage at clone borders drives clonal dynamics in the DEN-treated EE.
a, The neighbor-constrained fitness model implies that competitive mutant cells have an advantage over wild-type or less fit mutants that is neutralised when cells are surrounded by equally fit cells, so that expansion of highly competitive (“fit”) clones takes place at boundaries with “weak” clones. b, Simulation protocol to analyse the expanding behaviour of clones enclosed within or at the edges of mutant clones. c, Representative image of the simulations from (b) showing subclones (in red or yellow) growing within the mutant (green) clone (arrow) or at the edge of the clone, in contact with other wildtype clones depicted as black areas (arrowhead). d, Quantification of the simulations from (b) showing the size of subclones growing enclosed within (n=188) or at the edges (n=200) of mutant clones (from a 30,000-cells lattice simulation). Lines show median and quartiles. Two-sided Mann-Whitney test. See Supplementary video 5. e, Protocol: AhcreERTRosa26flConfetti/DNM-GFP mice (Extended Data 8d) were induced and the esophagus collected 1 month later. f, Representative image of EE tissues from (e) depicting the size of confetti labelled clones (red and yellow) in the edge of (arrowheads) or enclosed by (arrows) DN-Maml1 mutant areas (green). Scale bars: 50μm. g, Violin plots showing the area distribution of confetti clones quantified at the edge (n=493) or enclosed (n=434) within DN-Maml1 areas (from 6 mice/group). See Supplementary Table 15. Lines show median and quartiles. Two-sided Mann-Whitney test.
Taken together, the results above show that the NCF model defines and predicts the global dynamics and behaviour of clones in mutated epithelium, arguing that the competitive ‘fitness’ of mutant cells depends on the properties of their neighbors.
Discussion
Resolving the processes that underpin the competitive selection and generate the mutational patchwork of aging normal human epithelium has proved challenging. The interpretation of ultra-deep targeted sequencing data from human epithelia has generated controversy, and a recent analysis suggests that determining the presence of selection by using allele frequencies is problematic due to uncertainties in estimating clone sizes and the effects of clonal competition 17,39–41. The mouse model described here enables us to investigate these issues. Mutagen treated esophageal epithelium has several features in common with aging human tissues, despite the differences in mutational processes and timescale of clonal competition between the two species. Other than a small increase in basal cell density, the mutagen-treated mouse esophageal epithelium remains histologically intact and functions normally like in humans, with no global change in cell proliferation or stratification rates. This is despite the esophageal epithelium being extensively colonized by cells carrying mutations that promote clone expansion as evidenced by strongly positive dN/dS ratios. The mutations under selection in mice include the commonest drivers in human esophageal epithelium. Notably, Notch1 mutants replace the majority of esophageal epithelium in both mice and older humans, and the distribution of missense mutants across the protein is almost identical. These similarities lead us to speculate that the same processes may underpin clonal competition in mouse and human esophageal epithelium. It seems likely similar principles also operate in other tissues where clones collide within the proliferating cell compartment such as the epidermis, liver and endometrium 3,4,8,42.
The selection of mutations cannot be explained by the cell autonomous effects alone 8,27,40,41. The NCF hypothesis highlights the key role of cell competition at clonal boundaries in shaping the mutational patchwork of mutagenized esophageal epithelium, although it is agnostic to the detailed competitive mechanism(s). These may include mutant cells driving the differentiation of neighbors, a type of ‘super competition’ observed with Notch inhibiting mutant clones in esophageal epithelium 6,7,43. An alternative mode of competition is the killing of neighboring cells, but we found no evidence supporting this mechanism 6,8,10,19,27. The molecular basis of cells responding to the genotype and ‘fitness’ of their neighbors may involve cell-cell signals (such as Notch) and/or cytoskeletal and metabolic pathways 6,44,45. The mechanisms that lead to the reversion of a biased mutant cell fate towards a balanced one are not known but may be mechanical. Indeed, cell density is a highly conserved regulator of cellular homeostasis in diverse epithelia 46–48. Crowding of keratinocytes promotes their differentiation and is associated with reversion of mutant cell fate towards balance in esophageal epithelium 6,49,50.
What is the significance of the neighbor regulated fitness for cancer prevention? If, as seems likely, the risk of transformation varies with the size of the population of cells carrying mutations that promote malignancy, reducing the burden of oncogenic mutants may have long term benefit in cutting cancer risk. Reducing competitive fitness of one such mutant, p53, in a wild-type background results in loss of p53 mutant clones as they are displaced by adjacent wild-type cells with a relative proliferative advantage 27. Other colonizing mutations such as Notch1 may protect against malignant transformation 4,5. Interventions aimed at reducing cancer risk will need to preserve the competitiveness of beneficial mutants. Understanding that a complex mutational patchwork is generated by a simple cell competition framework will guide such preventative strategies.
Extended Data
Extended Data 1.
Extended Data 2.
Extended Data 3.
Extended Data 4.
Extended Data 5.
Extended Data 6.
Extended Data 7.
Extended Data 8.
Supplementary Material
Acknowledgements
This work was supported by grants from the Wellcome Trust to the Wellcome Sanger Institute (098051 and 296194) and Cancer Research UK Programme Grants to P.H.J. (C609/A17257 and C609/A27326). G.P. is supported by a Talento program fellowship from Comunidad de Madrid. B.A.H. and M.W.J.H. are supported by the Medical Research Council (Grant-in-Aid to the MRC Cancer unit grant number MC_UU_12022/9 and NIRG to B.A.H. grant number MR/S000216/1). M.W.J.H. acknowledges support from the Harrison Watson Fund at Clare College, Cambridge. B.A.H. acknowledges support from the Royal Society (grant no. UF130039). I.M. is funded by Cancer Research UK (C57387/A21777). S.D. benefited from the award of an ESPOD fellowship, 2018-21, from the Wellcome Sanger Institute and the European Bioinformatics Institute EMBL-EBI. We thank Esther Choolun and staff at the MRC ARES and Sanger RSF facilities for excellent technical support.
Footnotes
Competing Interests
The authors declare no competing interests.
Author Contributions
B.C., M.P.A., A.W. and J.C.F. designed experiments. B.C., M.P.A., A.W., A.H. and J.C.F. performed experiments. I.M. adapted Shearwater for mice. B.C., R.K.S., S.H.O., S.D., C.K. and M.W.J.H. analysed sequence data. G.P., M.W.J.H. and B.A.H. performed clone simulations. B.C., M.W.J.H., G.P., B.A.H. and P.H.J. wrote the paper. B.A.H., M.G. and P.H.J. supervised the research.
References
- 1.Fuster JJ, et al. Clonal hematopoiesis associated with TET2 deficiency accelerates atherosclerosis development in mice. Science (New York, N.Y.) 2017;355:842–847. doi: 10.1126/science.aag1381. [DOI] [PMC free article] [PubMed] [Google Scholar]
- 2.Lee-Six H, et al. Population dynamics of normal human blood inferred from somatic mutations. Nature. 2018;561:473–478. doi: 10.1038/s41586-018-0497-0. [DOI] [PMC free article] [PubMed] [Google Scholar]
- 3.Suda K, et al. Clonal Expansion and Diversification of Cancer-Associated Mutations in Endometriosis and Normal Endometrium. Cell reports. 2018;24:1777–1789. doi: 10.1016/j.celrep.2018.07.037. [DOI] [PubMed] [Google Scholar]
- 4.Martincorena I, et al. Somatic mutant clones colonize the human esophagus with age. Science (New York, N.Y.) 2018;362:911–917. doi: 10.1126/science.aau3879. [DOI] [PMC free article] [PubMed] [Google Scholar]
- 5.Yokoyama A, et al. Age-related remodelling of oesophageal epithelia by mutated cancer drivers. Nature. 2019;565:312–317. doi: 10.1038/s41586-018-0811-x. [DOI] [PubMed] [Google Scholar]
- 6.Alcolea MP, et al. Differentiation imbalance in single oesophageal progenitor cells causes clonal immortalization and field change. Nature cell biology. 2014;16:615–622. doi: 10.1038/ncb2963. [DOI] [PMC free article] [PubMed] [Google Scholar]
- 7.Alcolea MP, Jones PH. Cell competition: Winning out by losing notch. Cell Cycle. 2015;14:9–17. doi: 10.4161/15384101.2014.988027. [DOI] [PMC free article] [PubMed] [Google Scholar]
- 8.Murai K, et al. Epidermal Tissue Adapts to Restrain Progenitors Carrying Clonal p53 Mutations. Cell stem cell. 2018;23:687–699.e688. doi: 10.1016/j.stem.2018.08.017. [DOI] [PMC free article] [PubMed] [Google Scholar]
- 9.Brown S, et al. Correction of aberrant growth preserves tissue homeostasis. Nature. 2017;548:334–337. doi: 10.1038/nature23304. [DOI] [PMC free article] [PubMed] [Google Scholar]
- 10.Ellis SJ, et al. Distinct modes of cell competition shape mammalian tissue morphogenesis. Nature. 2019;569:497–502. doi: 10.1038/s41586-019-1199-y. [DOI] [PMC free article] [PubMed] [Google Scholar]
- 11.Madan E, et al. Flower isoforms promote competitive growth in cancer. Nature. 2019 doi: 10.1038/s41586-019-1429-3. [DOI] [PubMed] [Google Scholar]
- 12.Kon S, et al. Cell competition with normal epithelial cells promotes apical extrusion of transformed cells through metabolic changes. Nature cell biology. 2017;19:530. doi: 10.1038/ncb3509. https://www.nature.com/articles/ncb3509tfsupplementary-information. [DOI] [PubMed] [Google Scholar]
- 13.Bowling S, Lawlor K, Rodriguez TA. Cell competition: the winners and losers of fitness selection. Development (Cambridge, England) 2019;146 doi: 10.1242/dev.167486. [DOI] [PubMed] [Google Scholar]
- 14.Morata G, Ripoll P. Minutes: mutants of drosophila autonomously affecting cell division rate. Dev Biol. 1975;42:211–221. doi: 10.1016/0012-1606(75)90330-9. 0012-1606(75)90330-9[pii] [DOI] [PubMed] [Google Scholar]
- 15.Doupe DP, et al. A single progenitor population switches behavior to maintain and repair esophageal epithelium. Science (New York, N.Y.) 2012;337:1091–1093. doi: 10.1126/science.1218835. [DOI] [PMC free article] [PubMed] [Google Scholar]
- 16.Piedrafita G, et al. A single-progenitor model as the unifying paradigm of epidermal and esophageal epithelial maintenance in mice. Nat Commun. 2020;11 doi: 10.1038/s41467-020-15258-0. 1429. [DOI] [PMC free article] [PubMed] [Google Scholar]
- 17.Hall MWJ, Jones PH, Hall BA. Relating evolutionary selection and mutant clonal dynamics in normal epithelia. Journal of the Royal Society Interface. 2019;16 doi: 10.1101/480756. 20190230. [DOI] [PMC free article] [PubMed] [Google Scholar]
- 18.Rubio CA, Liu FS, Chejfec G, Sveander M. The induction of esophageal tumors in mice: dose and time dependency. In Vivo. 1987;1:35–38. [PubMed] [Google Scholar]
- 19.Frede J, Greulich P, Nagy T, Simons BD, Jones PH. A single dividing cell population with imbalanced fate drives oesophageal tumour growth. Nature cell biology. 2016;18:967–978. doi: 10.1038/ncb3400. [DOI] [PMC free article] [PubMed] [Google Scholar]
- 20.Gerstung M, Papaemmanuil E, Campbell PJ. Subclonal variant calling with multiple samples and prior knowledge. Bioinformatics. 2014;30:1198–1204. doi: 10.1093/bioinformatics/btt750. [DOI] [PMC free article] [PubMed] [Google Scholar]
- 21.Dow M, et al. Integrative genomic analysis of mouse and human hepatocellular carcinoma. Proceedings of the National Academy of Sciences. 2018;115:E9879–E9888. doi: 10.1073/pnas.1811029115. [DOI] [PMC free article] [PubMed] [Google Scholar]
- 22.Connor F, et al. Mutational landscape of a chemically-induced mouse model of liver cancer. Journal of hepatology. 2018;69:840–850. doi: 10.1016/j.jhep.2018.06.009. [DOI] [PMC free article] [PubMed] [Google Scholar]
- 23.Martincorena I, et al. Tumor evolution High burden and pervasive positive selection of somatic mutations in normal human skin. Science (New York, N.Y.) 2015;348:880–886. doi: 10.1126/science.aaa6806. [DOI] [PMC free article] [PubMed] [Google Scholar]
- 24.Martincorena I, et al. Universal Patterns of Selection in Cancer and Somatic Tissues. Cell. 2017;171:1029–1041.e1021. doi: 10.1016/j.cell.2017.09.042. [DOI] [PMC free article] [PubMed] [Google Scholar]
- 25.Jiang M, et al. BMP-driven NRF2 activation in esophageal basal cell differentiation and eosinophilic esophagitis. The Journal of clinical investigation. 2015;125:1557–1568. doi: 10.1172/jci78850. [DOI] [PMC free article] [PubMed] [Google Scholar]
- 26.Lefort K, et al. Notch1 is a p53 target gene involved in human keratinocyte tumor suppression through negative regulation of ROCK1/2 and MRCKalpha kinases. Genes & development. 2007;21:562–577. doi: 10.1101/gad.1484707. [DOI] [PMC free article] [PubMed] [Google Scholar]
- 27.Fernandez-Antoran D, et al. Outcompeting p53-Mutant Cells in the Normal Esophagus by Redox Manipulation. Cell stem cell. 2019;25:329–341. doi: 10.1016/j.stem.2019.06.011. [DOI] [PMC free article] [PubMed] [Google Scholar]
- 28.Gao YB, et al. Genetic landscape of esophageal squamous cell carcinoma. Nature genetics. 2014;46:1097–1102. doi: 10.1038/ng.3076. [DOI] [PubMed] [Google Scholar]
- 29.Wu S, et al. ARID1A spatially partitions interphase chromosomes. Science advances. 2019;5 doi: 10.1126/sciadv.aaw5294. eaaw5294. [DOI] [PMC free article] [PubMed] [Google Scholar]
- 30.Mansour AA, et al. The H3K27 demethylase Utx regulates somatic and germ cell epigenetic reprogramming. Nature. 2012;488:409–413. doi: 10.1038/nature11272. [DOI] [PubMed] [Google Scholar]
- 31.Seegar TCM, et al. Structural Basis for Regulated Proteolysis by the alpha-Secretase ADAM10. Cell. 2017;171:1638–1648.e1637. doi: 10.1016/j.cell.2017.11.014. [DOI] [PMC free article] [PubMed] [Google Scholar]
- 32.Bray SJ. Notch signalling in context. Nature reviews Molecular cell biology. 2016;17:722–735. doi: 10.1038/nrm.2016.94. [DOI] [PubMed] [Google Scholar]
- 33.Lee P, et al. Phosphorylation of Pkp1 by RIPK4 regulates epidermal differentiation and skin tumorigenesis. The EMBO journal. 2017;36:1963–1980. doi: 10.15252/embj.201695679. [DOI] [PMC free article] [PubMed] [Google Scholar]
- 34.Huang CS, et al. Crystal Structure of Ripk4 Reveals Dimerization-Dependent Kinase Activity. Structure (London, England : 1993) 2018;26:767–777.e765. doi: 10.1016/j.str.2018.04.002. [DOI] [PubMed] [Google Scholar]
- 35.Oberbeck N, et al. The RIPK4—IRF6 signalling axis safeguards epidermal differentiation and barrier function. Nature. 2019 doi: 10.1038/s41586-019-1615-3. [DOI] [PubMed] [Google Scholar]
- 36.Stephenson NL, Avis JM. Direct observation of proteolytic cleavage at the S2 site upon forced unfolding of the Notch negative regulatory region. Proc Natl Acad Sci U S A. 2012;109:E2757–E2765. doi: 10.1073/pnas.1205788109. [DOI] [PMC free article] [PubMed] [Google Scholar]
- 37.Weber S, et al. The disintegrin/metalloproteinase Adam10 is essential for epidermal integrity and Notch-mediated signaling. Development (Cambridge, England) 2011;138:495–505. doi: 10.1242/dev.055210. [DOI] [PMC free article] [PubMed] [Google Scholar]
- 38.Klein AM, Doupe DP, Jones PH, Simons BD. Kinetics of cell division in epidermal maintenance. Phys Rev E Stat Nonlin Soft Matter Phys. 2007;76 doi: 10.1103/PhysRevE.76.021910. 021910. [DOI] [PubMed] [Google Scholar]
- 39.Martincorena I, Jones PH, Campbell PJ. Constrained positive selection on cancer mutations in normal skin. Proceedings of the National Academy of Sciences. 2016;113:E1128–E1129. doi: 10.1073/pnas.1600910113. [DOI] [PMC free article] [PubMed] [Google Scholar]
- 40.Simons BD. Deep sequencing as a probe of normal stem cell fate and preneoplasia in human epidermis. Proceedings of the National Academy of Sciences. 2016;113:128–133. doi: 10.1073/pnas.1516123113. [DOI] [PMC free article] [PubMed] [Google Scholar]
- 41.Lynch MD, et al. Spatial constraints govern competition of mutant clones in human epidermis. Nat Commun. 2017;8 doi: 10.1038/s41467-017-00993-8. 1119. http://europepmc.org/abstract/MED/29066762 http://europepmc.org/articles/PMC5654977?pdf=render http://europepmc.org/articles/PMC5654977. [DOI] [PMC free article] [PubMed] [Google Scholar]
- 42.Zhu M, et al. Somatic Mutations Increase Hepatic Clonal Fitness and Regeneration in Chronic Liver Disease. Cell. 2019;177:608–621.e612. doi: 10.1016/j.cell.2019.03.026. [DOI] [PMC free article] [PubMed] [Google Scholar]
- 43.Moreno E, Basler K. dMyc transforms cells into super-competitors. Cell. 2004;117:117–129. doi: 10.1016/s0092-8674(04)00262-4. S0092867404002624 [pii] [DOI] [PubMed] [Google Scholar]
- 44.Tanimura N, Fujita Y. Epithelial defense against cancer (EDAC) Seminars in Cancer Biology. 2019 doi: 10.1016/j.semcancer.2019.05.011. [DOI] [PubMed] [Google Scholar]
- 45.Lowell S, Jones P, Le Roux I, Dunne J, Watt FM. Stimulation of human epidermal differentiation by delta-notch signalling at the boundaries of stem-cell clusters. Curr Biol. 2000;10:491–500. doi: 10.1016/s0960-9822(00)00451-6. [DOI] [PubMed] [Google Scholar]
- 46.Bras-Pereira C, Moreno E. Mechanical cell competition. Current opinion in cell biology. 2018;51:15–21. doi: 10.1016/j.ceb.2017.10.003. [DOI] [PubMed] [Google Scholar]
- 47.Franco JJ, Atieh Y, Bryan CD, Kwan KM, Eisenhoffer GT. Cellular crowding influences extrusion and proliferation to facilitate epithelial tissue repair. Molecular biology of the cell. 2019;30:1890–1899. doi: 10.1091/mbc.E18-05-0295. [DOI] [PMC free article] [PubMed] [Google Scholar]
- 48.Eisenhoffer GT, et al. Crowding induces live cell extrusion to maintain homeostatic cell numbers in epithelia. Nature. 2012;484:546–549. doi: 10.1038/nature10999. [DOI] [PMC free article] [PubMed] [Google Scholar]
- 49.Roshan A, et al. Human keratinocytes have two interconvertible modes of proliferation. Nature cell biology. 2016;18:145–156. doi: 10.1038/ncb3282. [DOI] [PMC free article] [PubMed] [Google Scholar]
- 50.Watt FM, Jordan PW, O’Neill CH. Cell shape controls terminal differentiation of human epidermal keratinocytes. Proc Natl Acad Sci U S A. 1988;85:5576–5580. doi: 10.1073/pnas.85.15.5576. [DOI] [PMC free article] [PubMed] [Google Scholar]
Associated Data
This section collects any data citations, data availability statements, or supplementary materials included in this article.


