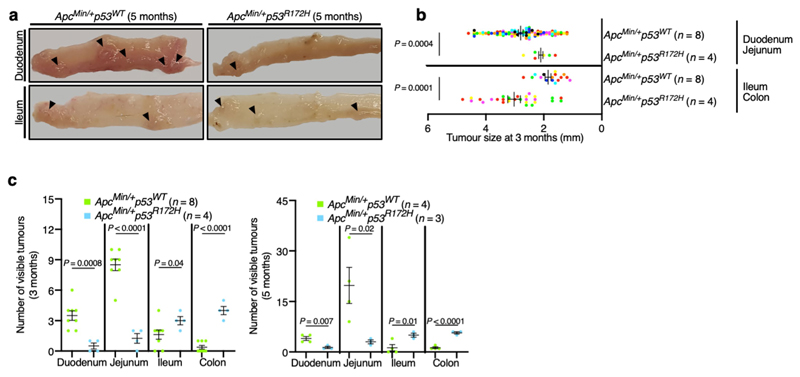
Extended Data Fig. 3. Mutant p53 counteracts tumorigenesis in the proximal mouse gut.
a, Representative images of different mouse bowel segments. Arrowheads indicate visible tumours. b, Tumour size (each mouse is colour-coded). Overall average of the mean values for each mouse ± s.e.m (n, number of mice), one-sided Student’s t-test. c, Quantification of visible tumours per mouse. Mean ± s.e.m. (n, number of mice), one-sided Student’s t-test. Representative data from three independent experiments (a).

