Abstract
The selectivity of neuronal responses arises from the architecture of excitatory and inhibitory connections. In primary visual cortex, the selectivity of layer 2/3 neurons for stimulus orientation and direction is thought to arise from similarly-selective intracortical inputs1–7. A neuron’s excitatory inputs, however, can have diverse stimulus preferences1–4,6–8, and inhibitory inputs can be promiscuous9 and unselective10. Here we show that excitatory and inhibitory intracortical connections to a layer 2/3 neuron accord with its selectivity by obeying precise spatial patterns. We used rabies tracing1,11 to label and functionally image the excitatory and inhibitory inputs to individual pyramidal neurons of mouse visual cortical layer 2/3. Presynaptic excitatory neurons spanned layers 2/3 and 4 and were distributed coaxial to the postsynaptic neuron’s preferred orientation, favouring the region opposite to its preferred direction. By contrast, presynaptic inhibitory neurons resided within layer 2/3 and favoured locations near the postsynaptic neuron and ahead of its preferred direction. The direction selectivity of a postsynaptic neuron was unrelated to the selectivity of presynaptic neurons but correlated with the spatial displacement between excitatory and inhibitory presynaptic ensembles. Similar asymmetric connectivity establishes direction selectivity in the retina12–16, suggesting that this circuit motif might be canonical in sensory processing.
The selectivity of layer 2/3 (L2/3) neurons of primary visual cortex (V1) for orientation and direction has unclear circuit origins. Selectivity is thought to emerge from pooling of co-tuned L4 excitatory neurons17, amplified by excitatory connections between co-tuned L2/3 neurons1–6,8,18. However, it remains unclear whether the inputs from L4 are tuned to the appropriate orientation1, and whether they dominate or complement inputs from L2/3. Orientation tuning might be sharpened by inhibition19–21, but the role of inhibition is controversial7,20–27, and inhibitory connections can be promiscuous9 and unspecific10.
Moreover, none of these mechanisms could explain direction selectivity, because the direction preference of L2/3 neurons often differs from their intracortical inputs1. Direction selectivity might arise from tuned inhibition7 or from spatial offset of excitation and inhibition28 but these circuits have not been demonstrated. Spatial offsets between excitatory and inhibitory connectivity occur in retina12–16 but have not been demonstrated in cortex, where measurements in vitro are harder to relate to function20,29–31.
Tracing inputs to a cortical neuron
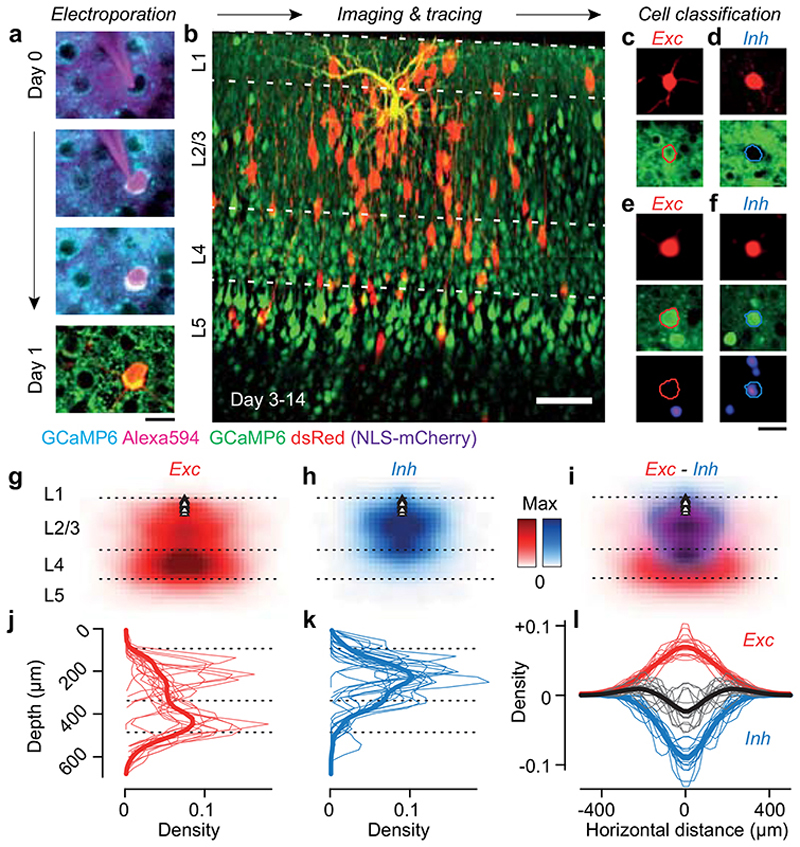
To understand the circuits that determine the selectivity of individual L2/3 neurons, we established their intracortical presynaptic ensemble1 (Figure 1a–b). We used two lines of transgenic mice: Camk2a-GCaMP6 expressing the green calcium indicator GCaMP6 in cortical excitatory neurons; Gad2-NLS-mCherry expressing the nuclear far-red marker NLS-mCherry in inhibitory neurons, with GCaMP6 expressed virally in all neurons. In both lines, we electroporated 3-5 L2/3 pyramidal neurons with genes for modified-rabies receptor TVA, rabies glycoprotein oG and near-red marker dsRed (Figure 1a, Extended Data Figure 1). We then recorded visual responses in electroporated neurons (Figure 1a), selected one neuron with robust responses, and photoablated any additional ones (Extended Data Figure 2). We then injected a modified rabies virus11 that could only infect the TVA-positive target neuron, and propagated to its presynaptic neurons to express dsRed (Figure 1b). Lastly, we used two-photon imaging to record from the postsynaptic neuron, its presynaptic ensemble, and the surrounding population (10,000-14,000 neurons across layers, Figure 1b). For each postsynaptic neuron (N=17), we identified 125±23 (mean ± s.e.) local presynaptic partners. We imaged daily and confirmed that presynaptic neurons gave healthy responses for >12 days after injection (Extended Data Figure 3).
Figure 1. Tracing the excitatory and inhibitory presynaptic inputs to an L2/3 pyramidal neuron.
(a) Time-lapse of electroporation (Day 0) and dsRed expression (Day 1) of the postsynaptic neuron. Scale bar: 20 μm. (b) Montage of Z-stack sagittal projections (taken 3 and 14 days after rabies injection) showing the postsynaptic neuron (yellow), its presynaptic ensemble (marked by dsRed, red) and the excitatory population (expressing GCaMP6, green). Lines indicate cortical layers. Scale bar: 100 μm. (c,d) Examples of an excitatory (Exc, n = 584) and an inhibitory (Inh, n = 426) presynaptic neuron in a CaMK2a-GCaMP6 mouse (N = 13): expression of dsRed (top) provides a somatic outline matching the expression of GCaMP6 (bottom) for the excitatory neuron but not for the inhibitory neuron. (e,f) Examples of an excitatory (Exc, n = 373) and inhibitory (Inh, n = 117) presynaptic neurons (top) in a GAD-NLS-mCherry mouse (N=4) injected with AAV-Syn-GCaMP6 (middle), where nuclear mCherry (bottom) distinguishes inhibitory from excitatory neurons. Scale bar 25 μm (g) Max-normalised density of presynaptic excitation pooled across experiments (N=17 postsynaptic neurons, 1,500 presynaptic neurons). All postsynaptic neurons resided in upper L2/3 (black triangles). (h) Same as g, for inhibition. (i) Overlay of the maps of excitation and inhibition. Hue indicates relative proportion of excitatory (red) vs inhibitory (blue) inputs, and saturation indicates max-normalised neuronal density. (j,k) Depth distributions for excitatory and inhibitory presynaptic neurons, for individual experiments (thin curves), and pooled data (thick curve). Vertical scale as in g-i. (l) Same as j,k, for the radial distributions of excitatory (red) and inhibitory (blue) presynaptic neurons, and their difference (black). Horizontal scale as in g-i.
Anatomy of presynaptic ensembles
We then classified the presynaptic neurons as excitatory or inhibitory (Figure 1c–f). In Camk2a-GCaMP6 mice, we used somatic GCaMP6 fluorescence to classify presynaptic neurons as excitatory (Figure 1c) vs. inhibitory (Figure 1d; Extended Data Figure 4; Extended Data Figure 5). In Gad2-NLS-mCherry mice, we used nuclear mCherry fluorescence to classify presynaptic neurons as inhibitory (Figure 1f) vs. excitatory (Figure 1e): because the emission spectra of dsRed and mCherry overlap, we separated their signals with multispectral imaging and spectral unmixing (Extended Data Figure 6). On average, 63±13 % (s.d., N = 17) of presynaptic neurons were excitatory and this fraction converged towards 70% in experiments with highest yield (Extended Data Figure 4).
The excitatory and inhibitory ensembles providing input to an L2/3 pyramidal cell followed markedly different laminar and horizontal distributions (Figure 1g–l). Excitatory inputs were densest in L4 and spanned a large vertical and horizontal range (Figure 1g,j). Inhibitory inputs, instead, dominated in L2/3 and clustered near the postsynaptic neuron (Figure 1h,k). These differences in distribution were consistent across postsynaptic neurons (Figure 1j–l, Extended Data Figure 7). The broader horizontal distribution of excitatory relative to inhibitory inputs thus generated an “inverse Mexican hat” profile, with inhibition dominating proximal regions and excitation distal ones (Figure 1i,l). These profiles of connectivity obtained in the intact brain were not apparent in earlier measurements obtained in vitro 29–31.
Co-tuning for orientation, not direction
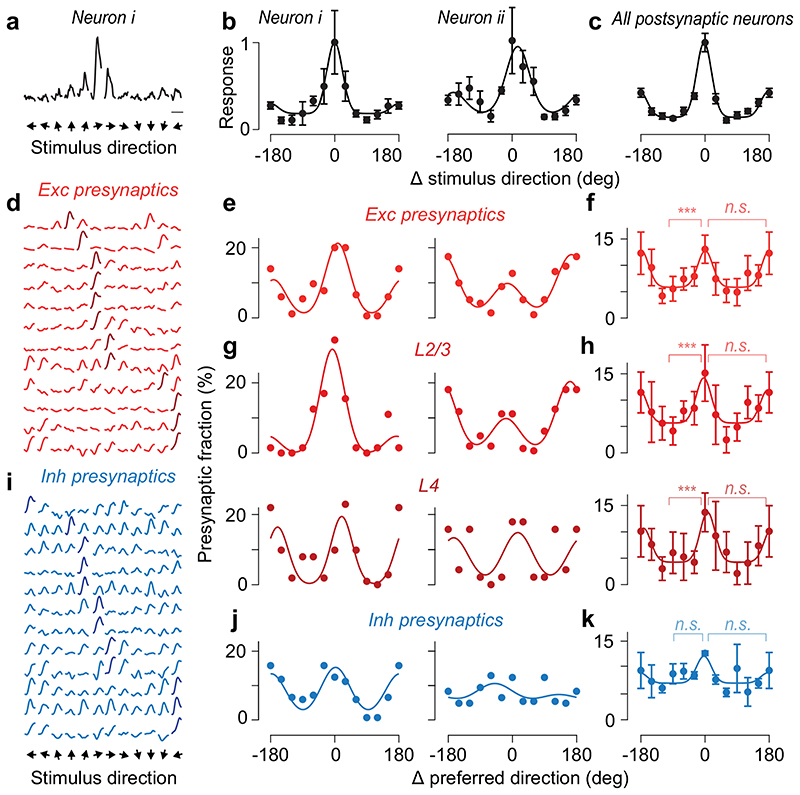
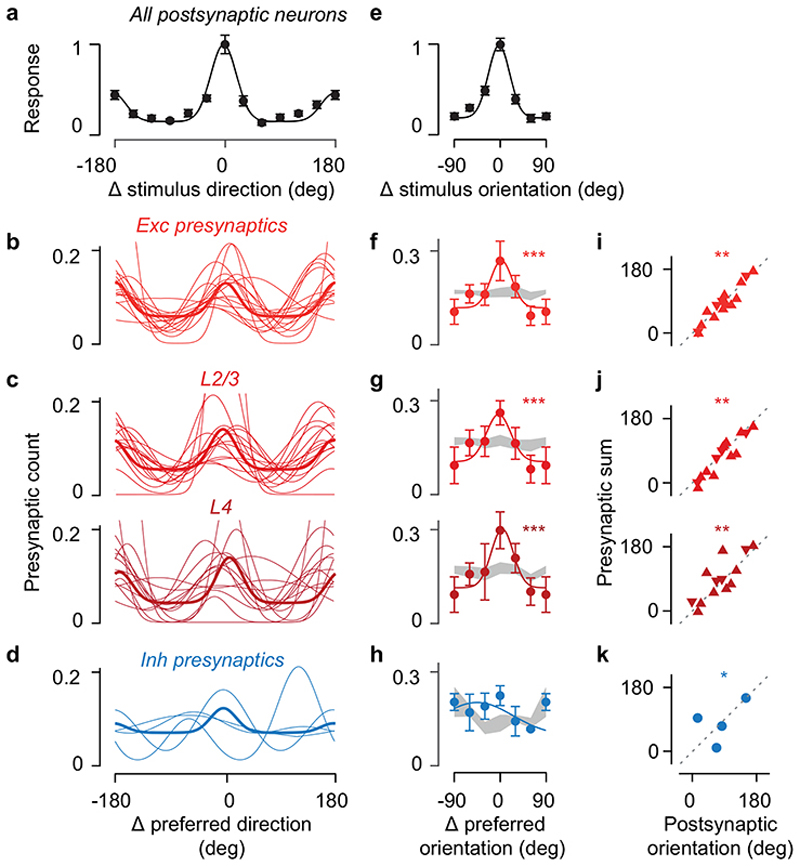
Consistent with some2–4,18 but not other1,8 observations, the orientation preference of the postsynaptic neuron strongly agreed with its excitatory presynaptic ensemble, regardless of layer (Figure 2). In most experiments (16/17) the postsynaptic neuron responded to gratings (Figure 2a–c). Many of its presynaptic neurons also responded to gratings (59±18%, s.d., N=15 datasets where we recorded presynaptic responses, Figure 2d), so we could compare their preferences. Different presynaptic ensembles differed in preferred orientation and direction (pkw = 10-7, one-way Kruskal-Wallis test). They were prevalently tuned to the orientation preferred by the postsynaptic neuron (Figure 2e,f; r = 0.75, pr = 4*10-3, circular correlation, pv = 10-7 circular V-test, Extended Data Figure 8). On average, over twice as many presynaptic neurons preferred the postsynaptic preferred orientation over the orthogonal orientation. This co-tuning for orientation was prevalent not only in L2/3 (Ref. 2,4), but also in L4 (pkw = 10-7 and pkw = 10-4, Figure 2g,h, Extended Data Figure 8).
Figure 2. Excitatory and inhibitory presynaptic ensembles are co-tuned for orientation but not direction.
(a) Peak-normalised responses to drifting gratings of an example postsynaptic neuron. Scale bar: 5 s. (b) Tuning curves of the postsynaptic neuron in a (neuron i) and of a second postsynaptic neuron (neuron ii), after alignment of their preferred direction to 0 deg (mean ± s.e., N = 10 trials). Preferred directions for the two neurons were-30 deg and 180 deg. (c) Average tuning across the postsynaptic neurons responding to drifting gratings (mean ± s.e., N=16). (d) Normalised responses of 12 example excitatory presynaptic neurons traced from the first postsynaptic neuron in a. (e) Distribution of preferred direction from the excitatory presynaptic ensembles connected to the postsynaptic neurons in a, relative to the postsynaptic preferred direction. (f) Average distribution of preferred direction for excitatory presynaptic neurons pooled across all layers (N=15, median ± m.a.d.). *** pkw=10-8, one-way Kruskal-Wallis test across orientations; n.s: pw=0.39, Willcoxon signed rank test between preferred and opposite direction. (g) Same as e, for presynaptic ensembles within L2/3 (top) and within L4 (bottom). (h) Same as f, for presynaptic ensembles within L2/3 (top, N = 15, pkw = 10-7, pw = 0.49) and within L4 (bottom, N=13, pkw= 2*10-5, pw= 0.59). (i) Same as d, for 12 example inhibitory presynaptic neurons. (j) Same as e, for the inhibitory presynaptic ensembles (pkw = 0.38, pw = 0.25). (k) Same as f, for the average distribution of preferred direction of presynaptic inhibitory neurons (N = 4).
Co-tuning for orientation did not result from local biases in preference32,33: the presynaptic ensemble was significantly more co-tuned than the surrounding population (circular variance 0.71±0.15 vs. 0.85±0.06, median ± m.a.d., Wilcoxon signed rank test, pw= 2*10-3, N=15). Moreover, its alignment to the postsynaptic orientation could not be expected by chance (pr_rand < 10-4, circular correlation; pv_rand < 10-4; circular V-test; Extended Data Figure 8).
The presynaptic inhibitory ensemble, by contrast, was only weakly biased to the orientation preference of the postsynaptic neuron (Figure 2i–k). Inhibitory neurons were more broadly tuned than excitatory ones (median orientation selectivity index 0.21 vs. 0.43, p= 0.015, two-sample Kolmogorov-Smirnov test, Figure 2i). The inhibitory presynaptic ensemble was perhaps biased toward the postsynaptic preferred orientation (pv = 0.05 circular V-test, N= 4, Figure 2j,k, Extended Data Figure 8), but its distribution of preferred orientations was broader than for pyramidal cells (Figure 2j,k, circular variance 0.76±0.16 vs. 0.59±0.21, median ± m.a.d., pw=0.065 Wilcoxon signed-rank test, N = 4), and not significantly different from random samples of nearby neurons (0.76±0.16 vs. 0.80±0.10, median ± m.a.d., pw=0.88, N=4). Therefore, an L2/3 neuron integrates excitation from an ensemble strongly co-tuned for orientation, and inhibition from an ensemble with varied, weaker tuning.
In contrast, presynaptic ensembles showed no consistent co-tuning for stimulus direction (Figure 2e–h, Extended Data Figure 8). Some excitatory presynaptic ensembles comprised more neurons selective for the same direction as the postsynaptic neuron1 (Figure 2e,g, neuron i), but other ensembles favoured the opposite direction (Figure 2e,g, neuron ii). On average, the number of presynaptic excitatory neurons preferring the same direction as the postsynaptic neuron was not higher than the number preferring the opposite direction (pw = 0.39, Wilcoxon singed rank test, Figure 2f). Similar results were seen within L2/3 or L4 (pw = 0.49 and pw = 0.59, Figure 2h). Furthermore, the postsynaptic direction selectivity index was unrelated (p= 0.24, Pearson correlation) to the selectivity of its excitatory presynaptic ensemble (the relative number of presynaptic neurons preferring the postsynaptic direction vs. its opposite). Direction selectivity in L2/3 neurons, therefore, might not depend on co-tuning of their synaptic inputs.
Directional spatial connectivity
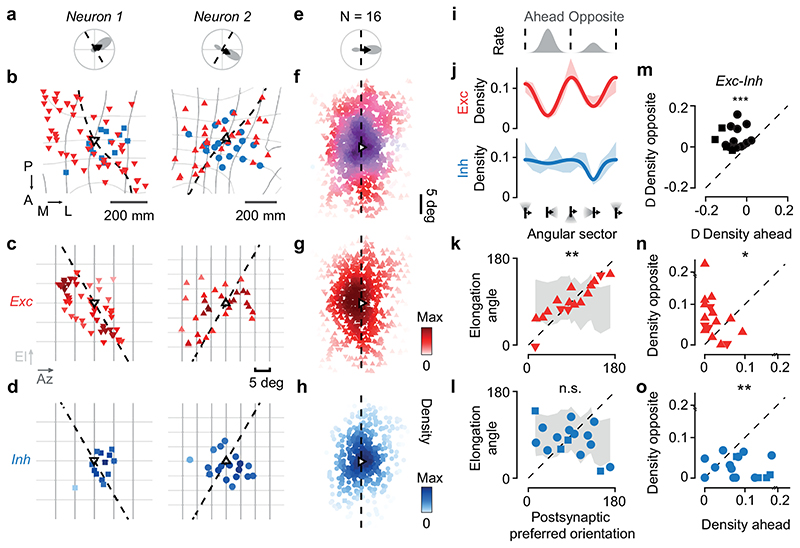
We next compared the selectivity of the postsynaptic cells to the spatial patterns of their excitatory and inhibitory presynaptic ensembles (Figure 3a,b). To characterize these patterns, we estimated retinotopy for every point in cortex34,35 (Extended Data Figure 9), obtaining maps that exhibited typical curvatures and anisotropies36 (Figure 3b).
Figure 3. Elongated excitation and spatially offset inhibition accord with direction selectivity.
(a) Polar tuning curve of two postsynaptic neurons, showing preferred orientation (dashed) and direction (arrow). (b) Excitatory (red) and inhibitory (blue) presynaptic ensembles of postsynaptic neuron (open triangle, pointing in the preferred direction). The postsynaptic preferred orientation maps to a curve in cortex (dashed). Retinotopy is marked in 5 deg steps of azimuth (dark grey) and elevation (light grey). Coordinates: posterior (P), anterior (A), medial (M), lateral (L). (c) Excitatory presynaptic neurons in b replotted in visual space. Saturation indicates density. (d) Same as c, for inhibitory presynaptic neurons. (e) Average polar tuning curve across postsynaptic neurons, aligned to preferred direction (N= 16). (f) Excitatory and inhibitory presynaptic ensembles in visual space, pooled after alignment to the postsynaptic preferred direction (N=16). Hue indicates the relative proportion of excitation (red) vs. inhibition (blue); saturation indicates the average max-normalised density. (g) Same as f, for excitatory presynaptic neurons. (h) Same as f, for inhibitory presynaptic neurons. (i) Average postsynaptic tuning curve from e. (j) Angular density (shaded, mean ± s.e., N= 16) of excitatory (red) and inhibitory (blue) presynaptic neurons relative to the postsynaptic preferred direction. A sinusoid (capturing orientation selectivity) summed with a Gaussian (capturing direction selectivity) fit the data. (k) The angle of elongation of excitatory presynaptic ensemble correlates with the postsynaptic preferred orientation (r=0.72, pr = 7*10-3, circular correlation; pv = 10-4, circular V-test, N=16) significantly more than expected by chance (shaded area, median ± m.a.d., pr_rand = 10-3; pv_rand < 10-4). (l) Not so for the inhibitory presynaptic ensemble (r = -0.07, pr = 0.77; pv= 0.12). (m-o) Comparison of density in sectors opposite vs. ahead of the postsynaptic preferred direction for excitation (n, pw = 4*10-2, N= 16, two-sided Wilcoxon signed-rank test), inhibition (o, pw = 3*10-3) and difference between excitation and inhibition (m, pw = 4*10-4). In b-o, upward triangles and circles indicate CaMK2-GCaMP6 datasets; downward triangles and squares indicate GAD2-NLS-mCherry datasets.
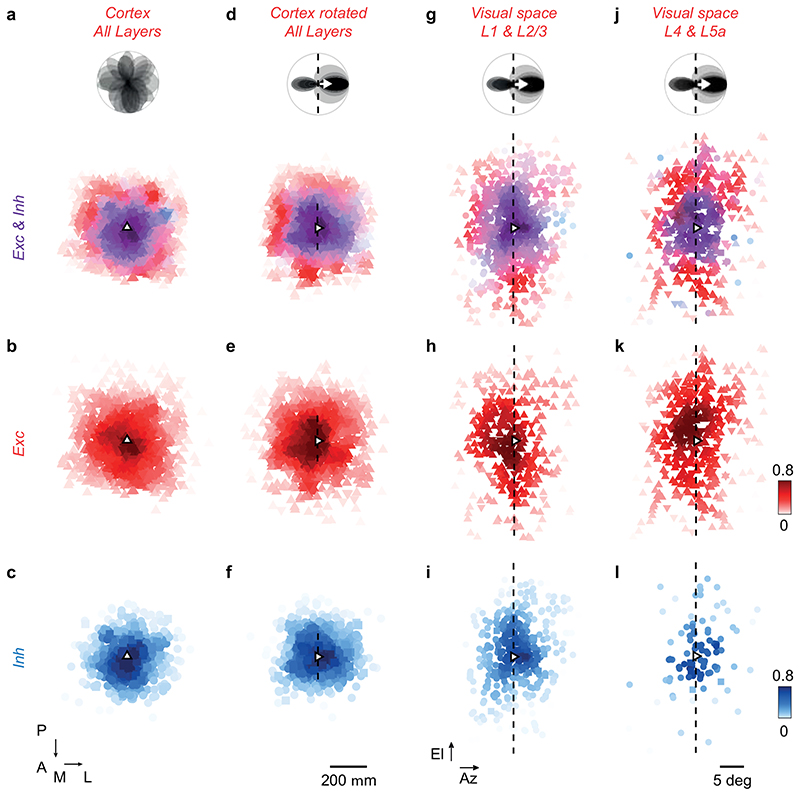
The excitatory and inhibitory presynaptic ensembles exhibited spatial patterns and offsets that matched the tuning of the postsynaptic neuron (Figure 3c–h). Excitatory presynaptic neurons were densest in locations that extended along the postsynaptic neuron’s preferred orientation3, and favoured the side opposite to its preferred direction (Figure 3b,c). Inhibitory presynaptic neurons, by contrast, were arranged more proximally and favoured the other side, ahead of the postsynaptic neuron’s preferred direction (Figure 3b,d). To pool results across postsynaptic neurons, we rotated the presynaptic densities so that the resulting postsynaptic preferred direction pointed rightwards (Figure 3e,f). The combined excitatory presynaptic ensemble was elongated along the postsynaptic neuron’s preferred orientation (i.e. vertically), and displaced opposite to the neuron’s preferred direction (i.e. to the left, Figure 3g). By contrast, the combined inhibitory presynaptic ensemble was local, concentric, and displaced ahead of the postsynaptic neuron’s preferred direction (i.e. to the right, Figure 3h). These spatial patterns were present both in inputs from L2/3 and in inputs from L4 (Extended Data Figure 10g–l). They manifested only in precise relation to each postsynaptic neuron’s visual preferences and local retinotopy; ignoring these factors when averaging across ensembles would yield an apparent concentric arrangement of inhibition and excitation (Extended Data Figure 10a–f).
To quantify these differences between excitatory and inhibitory ensembles, we calculated the angular density in visual space of excitatory and inhibitory presynaptic neurons relative to the postsynaptic neuron (Figure 3i,j). The excitatory ensemble, being elongated and eccentric, favoured visual sectors orthogonal to the preferred direction, i.e. parallel to the preferred orientation, with a deeper trough ahead of the preferred direction (Figure 3j, red). The inhibitory ensemble, instead, was more equally distributed around the postsynaptic neuron, with a trough opposite to its preferred direction (Figure 3j, blue).
The preferred orientation of postsynaptic neurons accorded with the spatial elongation of excitatory but not inhibitory presynaptic ensembles (Figure 3k–l). The angle of elongation of the presynaptic excitatory ensemble correlated significantly with the postsynaptic neuron’s preferred orientation (r= 0.72, pr= 6*10-3, circular correlation; pv = 10-4 circular V-test; Figure 3k). This correlation did not result from anisotropies of the retinotopic map: the correlation was significantly higher than in surrogate ensembles crafted to be isotropic in cortex with similar distances from the postsynaptic neurons, which favoured horizontal elongation (pr_rand = 10-3, circular correlation; pv_rand < 10-4; Figure 3k). Inhibitory presynaptic ensembles, instead, did not significantly align with the postsynaptic neuron’s preferred orientation (Figure 3l; r= -0.07, pr= 0.77; pv= 0.12). This contrast between elongated excitation and concentric inhibition would enhance responses to the preferred orientation.
Presynaptic connectivity also matched the postsynaptic neuron’s preferred direction with a consistent spatial offset between excitation and inhibition (Figure 3m–n). Excitatory presynaptic neurons were significantly more abundant opposite to the postsynaptic preferred direction than ahead of it (pw= 0.035, Wilcoxon signed-rank test, N=16, Figure 3n). Inhibitory presynaptic neurons showed the reverse effect (pw= 3*10-3, Figure 3o). Hence, the balance between excitatory and inhibitory inputs invariably favoured visual sectors opposite to the postsynaptic preferred direction (pw= 4*10-4, Figure 3m).
Intracortical origin of direction tuning
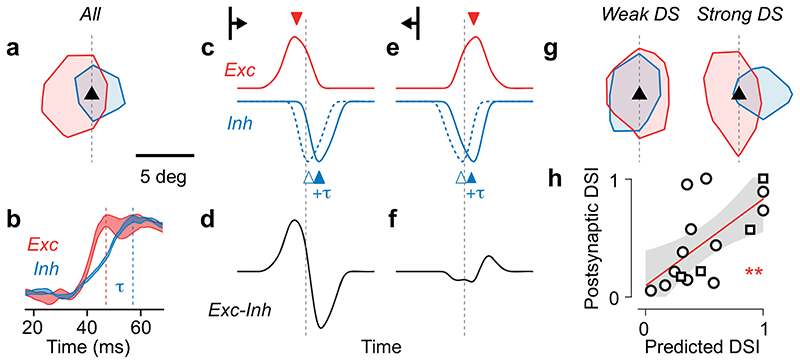
The spatial offset that we discovered between excitation and inhibition provides a candidate circuit for direction selectivity (Figure 4a–f). Intracellular recordings from L2/3 V1 neurons37,38 demonstrated that visual stimulation triggers excitatory and inhibitory conductances staggered by 10 ms (Figure 4b). Excitation and inhibition thus are offset not only in space but also in time. This arrangement can provide direction selectivity12,16,28,39: a stimulus approaching the postsynaptic neuron in the preferred direction would recruit first excitation then inhibition (Figure 4c), evoking a large response (Figure 4d). Conversely, movement in the opposite direction would first recruit inhibition, whose delay would suppress the subsequent excitation (Figure 4e,f).
Figure 4. Spatially offset, delayed excitation and inhibition predict postsynaptic direction selectivity.
(a) Average excitatory and inhibitory presynaptic densities across experiments, showing contour at 10% of peak value. (b) In response to a visual stimulus, inhibitory currents (blue) rise in L2/3 pyramidal neurons later than excitatory currents (red). Traces indicate max-normalised changes in synaptic conductance measured in awake V1. Adapted from Ref. 37. (c) Simulated excitatory (red) and inhibitory (blue) presynaptic activity triggered by a bar sweeping in the postsynaptic preferred direction, as a function of time. The dotted line indicates the crossing of the bar with the position of the postsynaptic neuron (dashed line in a). Inhibitory activity is shown with the delay provided solely by spatial offset (dashed blue) and with the additional inhibitory lag (+τ, solid blue). (d) Net synaptic input (excitatory – inhibitory) to the postsynaptic neuron. (e-f) Same as c-d for a bar sweeping in the anti-preferred direction. (g) Same as a, for densities averaged across the three postsynaptic neurons with weakest direction selectivity (left) and for the three postsynaptic neurons with strongest direction selectivity (right). (h) The spatial offset between excitatory and inhibitory presynaptic ensembles (N=16) predicts the direction selectivity index measured from the postsynaptic neuron responses. Linear fit (red) with 95% confidence interval (grey), ** r =0.65, pr =7*10-3, F-test. Circles represent experiments from CaMK2-GCaMP6 mice; squares indicate experiments from GAD2-NLS-mCherry mice.
This model makes a testable prediction: neurons whose excitatory and inhibitory inputs are more spatially offset should show stronger direction selectivity (Figure 4g,h). Supporting this prediction, the three neurons with the weakest direction selectivity had excitatory and inhibitory presynaptic ensembles that largely overlapped (Figure 4i). Conversely, in the three neurons with the strongest direction selectivity, the excitatory and inhibitory presynaptic ensembles were strongly offset (Figure 4i). To verify the model’s prediction, we estimated the net input (excitation minus inhibition) received by each postsynaptic neuron in sectors opposite or ahead of its preferred direction (Figure 3m). We then computed a predicted direction selectivity index by subtracting the normalized net input in the two sectors. This direction selectivity index was predicted purely from the spatial pattern of presynaptic ensembles, and yet it strongly correlated with the direction selectivity index of the postsynaptic neurons, measured from visual responses (Figure 4h, r = 0.65, p = 7*10-3). Therefore, the spatial offset of excitatory and inhibitory presynaptic ensembles predicts not only a neuron’s preferred direction (Figure 3m), but also the strength of its direction selectivity (Figure 4h).
Discussion
We revealed a precise spatial patterning of excitatory and inhibitory connections to L2/3 neurons, which can strengthen orientation tuning and establish direction selectivity without connections from co-tuned neurons. The standard model for selectivity in L2/3 relies on excitatory co-tuning2,3,5,6,18,40,41. We have shown, however, that the direction preference of a L2/3 neuron does not correlate with that of its presynaptic excitatory cells. Instead, it strongly correlates with the spatial pattern and offset of excitatory and inhibitory inputs. Given the delay between excitation and inhibition37,38, this offset may explain direction selectivity12,16,28,39 in L2/3.
Our results open several questions. Does spatial connectivity arise during development, and is it shaped by visual experience? Is it different across inhibitory neuron types? Does it rely on similar mechanisms across species? Rabies tracing may help address these questions, especially if it were confirmed to travel only across synapses and to sample evenly among synaptic inputs11. It would also be ideal to measure synaptic weights, which may play an important role in selectivity4,6,22.
Direction selectivity is computed at multiple stages along the visual pathway. It emerges in retina through asymmetric excitation and inhibition12–16, and is relayed to cortical L1 via a dedicated thalamic pathway39,42. It is then computed anew43 in cortical L4, through integration of spatiotemporally displaced thalamic inputs39,42. Our findings suggest that in mice it is computed yet again in L2/3. In primates, moreover, it may be computed yet again44 in visual area MT.
Why would direction selectivity be computed at multiple stages? Perhaps at each stage it is useful to detect spatiotemporal gradients in the activity of the previous stage. Some mechanisms to compute these spatiotemporal gradients, indeed, appear to be conserved: the spatially offset arrangement of excitation and inhibition in L2/3 resembles the circuit for direction selective ganglion cells seen in the retina12–16. The cortex thus replicates circuit motifs seen in the retina. The reappearance of these motifs suggests they might be canonical across brain regions.
Methods
All experimental procedures were conducted in accordance with the UK Animals Scientific Procedures Act (1986). Experiments were performed at University College London under personal and project licenses released by the Home Office following appropriate ethics review.
Transgenic mice breeding
Experiments were performed on twenty 7-12 weeks old mice of both sexes, maintained on a 12 hours light/dark cycle, at 20-24°C and 45-65% humidity, in individually ventilated cages. Fourteen experiments involved animals expressing GCaMP6 through different transgenic strategies. Six mice were Camk2a-tTA; EMX1-Cre; TIGRE-Ins-TRE-LSL-GCaMP6f (Ai93D) triple transgenic mice, expressing the calcium indicator GCaMP6f in all cortical excitatory neurons. Seven mice were Camk2a-tTA; EMX1-Cre; TIGRE-Ins-TRE-LSL-GCaMP6s (Ai94D) triple transgenic mice, expressing the calcium indicator GcaMP6fs in all cortical excitatory neurons. Four mice were Camk2a-tTA; tetO-Gcamp6s double transgenic mice, expressing GcaMP6s in all cortical excitatory neurons. Transgenic mice were bred from the following parental lines: Emx1-IRES-Cre (Stock #005628, The Jackson Laboratory, Ref. 45); CamK2a-tTA (Stock #007004, Ref. 45); Ai93 (Stock #024103, Ref. 45); Ai94 (Stock #024104, Ref. 46); TRE-Gcamp6f (Stock #024742, Ref. 47). Differences in the GcaMP6 variants used did not affect the results of the study, because data in each experiment were compared against internal controls. A subset of four experiments involved instead Gad2-T2a-NLS-mCherry animals, expressing the far-red fluorescent protein mCherry localised to the nucleus of inhibitory neurons (Stock #023140, Ref. 48).
Surgical procedures
Animals were anaesthetised with isoflurane (1-2% in Oxygen), their body temperature monitored and kept at 37-38°C using a closed-loop heating pad, and the eyes protected with ophthalmic gel (Viscotears Liquid Gel, Alcon Inc.). An analgesic (Rimadyl, 5 mg/kg) was administered subcutaneously before the procedure, and orally on subsequent days. Whenever the procedure exposed the brain, Dexamethasone (0.5 mg/kg, IM) was administered intramuscularly 30 min prior to the procedure to prevent brain oedema. The exposed brain was constantly perfused with artificial cerebrospinal fluid (150 mM NaCl, 2.5 mM KCl, 10 mM HEPES, 2 mM CaCl2, 1 mM MgCl2; pH 7.3 adjusted with NaOH, 300 mOsm).
The first surgery involved the implant of a head-plate over the right hemisphere of the cranium. The head was shaved and disinfected; the cranium was exposed and covered with biocompatible cyanoacrylate glue (Vetbond, 3M). A stainless-steel head plate with a 10 mm circular opening was secured over the skull using dental cement (Super-Bond C&B, 10 Sun Medical Co. Ltd., Japan). The exposed bone inside the chamber was covered by a thin layer of dental cement and sealed off with silicone elastomer (Kwik-Cast, WPI).
The second surgery was necessary for targeted neuron electroporation. A 1.5-2 mm wide square craniotomy was opened over V1 (centred at -3.3 mm AP, 2.8 ML from bregma). Following the electroporation, the craniotomy was sealed with a glass cranial window, assembled from a circular cover glass (3 mm diameter, 100 μm thickness) glued to a smaller custom-made glass square insert (1.5-2 mm wide, 300 μm thickness) with index-matched UV curing adhesive (Norland #61).
We performed a third surgery to inject a rabies virus (RV) for single neuron initiated monosynaptic tracing49–52. The cranial window and the dura mater were removed53; 100-200 nL of EnvA-dG-dsRedExpress-RV (108-109 pfu/mL) were injected through a 30-50 μm borosilicate capillary connected to a pneumatic injector (Nanoject, Drummond Scientific Company). The injection was targeted ~100-200 μm from the electroporated neuron. Afterwards, a permanent glass window was implanted.
In experiments involving Gad2-T2a-NLS-mCherry mice (Extended Data Figure 6), GcaMP6s was delivered panneuronally with an adenoviral vector at ~P28. The scalp was shaved and incised to expose the skull over V1. Three ~250 μm wide craniotomies, spaced as a ~1 mm equilateral triangle, were targeted to the central part of V1. 200 nL of AAV2.1-Syn-GcaMP6s (~1011 GC/mL) were injected through each craniotomy, distributing the volume between L5 and L2/3. Finally, the craniotomies were covered with mineral oil and the skin sutured over the exposed scalp.
In two control experiments (Extended Data Figure 4g), the red fluorescent protein tdTomato was sparsely expressed by injecting diluted AAV2.1-CaMK2a-Cre (~107 GC/mL) and concentrated AAV2.1-flex-SyntdTomato (~1012 GC/mL).
Histology
Two weeks after the rabies virus injection, mice were anaesthetised with isoflurane, injected with sodium pentobarbital (0.01 mL/g) and perfused trans-cardially with ice-cold phosphate buffered saline (PBS), followed by 4% ice-cold PFA in PBS. The brain was extracted, postfixed for 24h in 4% PFA PBS at 4°C, and finally transferred to a 30% sucrose PBS at 4°C. 50 μm thick coronal sections were serially cut on a vibratome to span the whole V1, washed in PBS, blocked with a 0.3% triton-X100, 1% BSA solution in PBS and processed with the following antibodies: mouse anti-GAD67 primary antibody (1:1500, Millipore MAB5406), donkey anti-mouse IgG Alexa 647 conjugate secondary antibody (1:800, Merk Millipore AP192SA6). Sections were mounted on SuperFrost slides (Molecular Probes), air dried, and cover-slipped with Fluoromount (Sigma-Aldrich). Z-stacks tile scans of each slide were imaged with a Nikon Eclipse Ti2-E inverted epifluorescence microscope and manually aligned to the corresponding sections from in vivo z-stacks. Images were high-pass filtered for display (Extended Data Figure 5).
Targeted single cell electroporation with survival control
Targeted, single-cell electroporation54,55 was performed under a Sutter-MOM two-photon microscope, equipped with a low magnification (16X) high NA (0.8) water immersion objective lens (Nikon), an epifluorescence imaging module and a femtosecond pulsed laser (Chameleon Ultra II, Coherent) tuned at 820 nm. The microscope was controlled using ScanImage v3.8 (Ref. 56).
Borosilicate patch pipettes (resistance 10-14 MΩ) were crafted with a vertical puller (Narishige) and filled with intracellular solution (133 mM KmeSO4, 7 mM KCl, 10 mM HEPES, 2 mM Mg-ATP, 2 mM Na2-ATP, 0.5 mM Na2-GTP, 0.05 mM EGTA; pH 7.2, adjusted with KOH, 280–290 mOsm; filtered using a 0.45 mm syringe filter). The intracellular solution also contained 50 μM of the red fluorescent dye AlexaFluo 594 and 3 plasmids with the following concentrations51: 100 μg/μL pCAG-dsRed2 (Addgene #15777), 200 μg/μL pCMV-oG (Addgene 74288, Ref. 57; or pCMV-G in a subset of experiments, Addgene 15785) and 100 μg/μL pCAGTVA800 (Addgene 15788).
The pipette was manoeuvred with a micromanipulator (Junior 4 axis, Luigs&Neumann) and pushed through the dura, while applying positive pressure (~150 mBar) and monitoring the pipette resistance with an electroporator for in vivo transfections (Axoporator 800A, Molecular Devices). The pressure was then reduced to 30-50 mBar: the diffusion of the red dye in the extracellular space counterstained neuronal somas, while GcaMP6 allowed targeting of excitatory cells (Figure 1b). The pipette tip was pushed onto a neuronal soma, and, upon a ~30% increase in resistance, neurons were electroporated with a single pulse train at -11 V, 100 Hz, 0.5 ms pulse width, 1 s duration, and the pipette swiftly retracted.
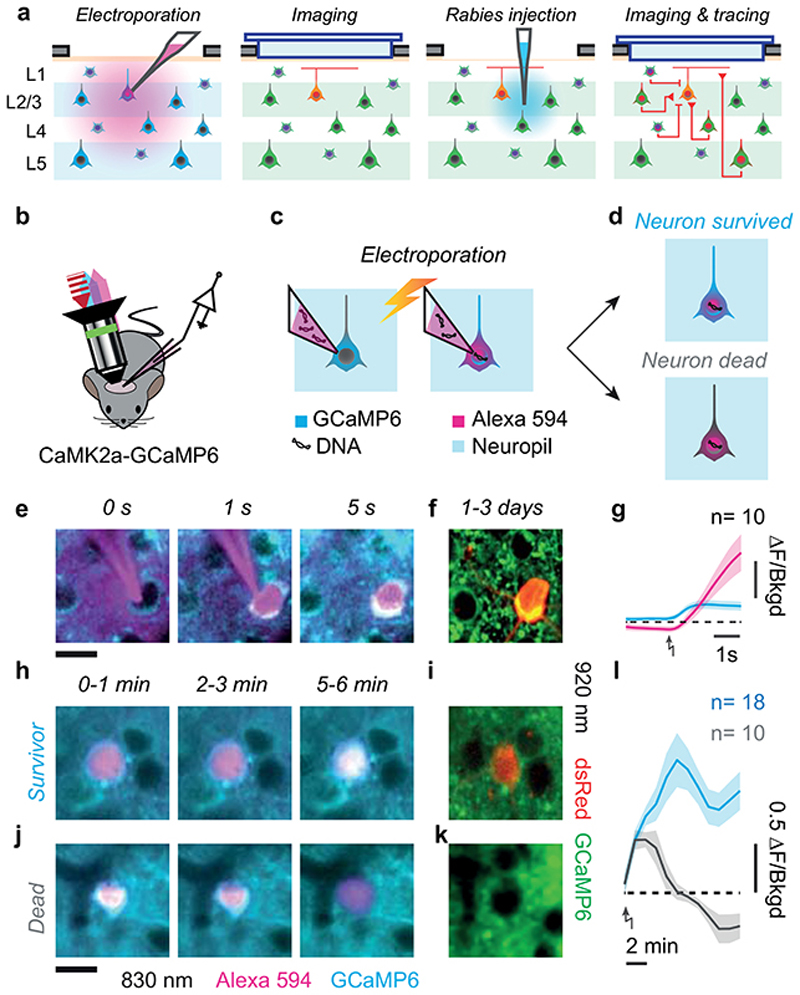
Three criteria were used as signature of successful electroporation and recovery of a neuron from the electroporation shock (Extended Data Figure 1). First: immediate filling of the soma with AlexaFluo594 (Extended Data Figure 1e,g). Second: retraction of the pipette without pulling of the neuronal membrane (Extended Data Figure 1e). Third: sustained somatic GcaMP6 fluorescence at 820 nm relative to the surrounding neuropil (Extended Data Figure 1h–l). Electroporated neurons were monitored for the 3-10 min post-electroporation. With these criteria, we could predict which electroporation attempts were successful with an 80% success rate.
We performed up to five electroporation attempts per mouse, at sites spaced >500 μm apart. Transgene expression of electroporated cells was assessed 1-3 days after electroporation (Extended Data Figure 1f,i, k).
Targeted photoablation of supernumerary electroporated neurons
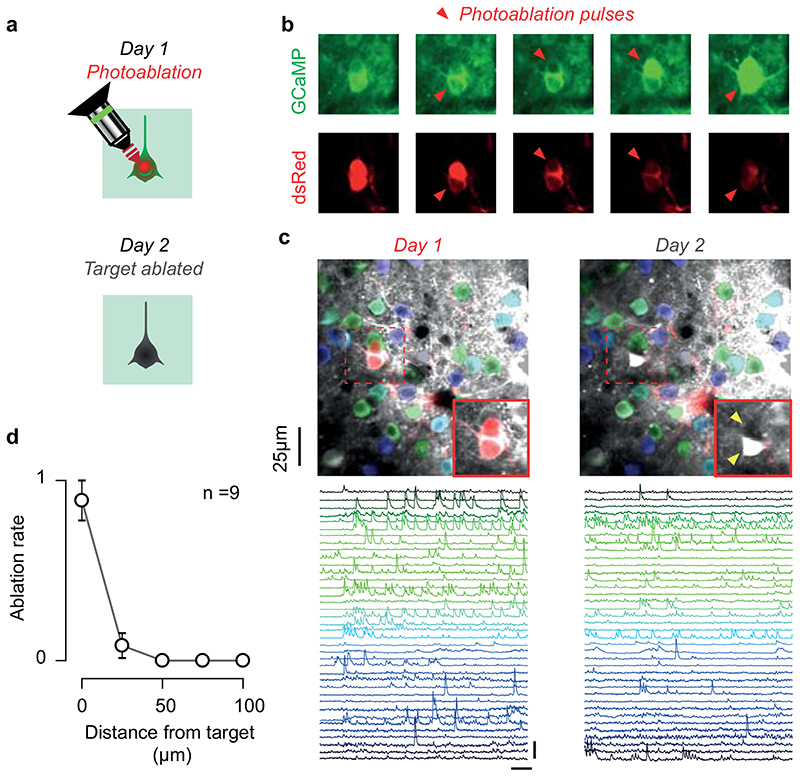
We selected a single target for monosynaptic tracing by photoablating any supernumerary electroporated neurons (Extended Data Figure 2). The galvanometric mirrors where centred on the target neuron’s soma, and pulses of high intensity 820nm two-photon illumination (>150 mW) were delivered for 10-20 s. Neurons were imaged during and between the pulses to titrate the extent of the photodamage and avoid damage to the surrounding neurons. The outcome of the photoablation was ascertained the following day via functional imaging.
Two-photon imaging of neuronal responses
Recordings of neuronal activity were performed with a standard resonant-scanning two-photon microscope (B-Scope, Thorlabs), equipped with a Nikon 16x, 0.8 NA objective mounted on a piezoelectric z-drive (PIFOC P-725.4CA, Physik Instrumente, range 400 μm) for volumetric multi-plane imaging. The microscope was controlled using ScanImage v4.2 (Ref. 56). Excitation light was provided by a femtosecond laser (Chameleon Ultra II, Coherent), tuned between 780-1020 nm. Laser power was depth-adjusted between 30-300 mW, and synchronized with piezo position using an electro-optical modulator (M350-80LA, Conoptics Inc.). Sample fluorescence was collected in a green (525/50 nm) and a red channel (605/70 nm) channel.
Fields of view (FOV), centred on the postsynaptic neuron position, were imaged with a resolution of 512×512 pixels at 30 Hz. FOVs typically spanned 150-200 μm for the initial imaging of the postsynaptic neuron, and between 500-850 μm for the imaging of presynaptic ensembles. For volumetric imaging of GcaMP6s, the objective was scanned across 10 planes, separated by 15-20 μm in depth, resulting in an effective sampling rate of 3 Hz. For volumetric imaging of GcaMP6f, only 5 planes were used instead, with an effective sampling rate of 6 Hz. A full cortical column was tiled by serially repeating volumetric acquisitions from the cortical surface to L5. To acquire structural z-stacks, the piezoelectric z-drive moved the objective in steps of 1 μm.
Imaging sessions lasted 2-4h and included 2-3 hours of effective imaging time. During the imaging sessions, mice were head fixed on an airflow-suspended spherical treadmill. Recordings started on the day following electroporation and lasted up to two weeks post rabies virus injection (Extended Data Figure 3d).
Spectral unmixing
We devised a method to spectrally separate dsRed and mCherry fluorescence (Extended Data Figure 6), whose overlapping emission spectra58 (www.fpbase.org) could not be differentiated using the acquisition channels of our 2P-microscope (Extended Data Figure 6a). For each FOV, we acquired images at four excitation wavelengths λ: 780, 890, 970, and 1020 nm. The two shortest wavelengths were chosen to obtain strong signals from either mCherry or dsRed while maximising the ratio between their action cross-sections58,59(Extended Data Figure 6b,c). The 1020 nm wavelength was used to compensate for the degrading efficacy of 780 nm imaging with cortical depth. Finally, the 970 nm wavelength was used for functional imaging. The objective position was adjusted to compensate for focal changes at each excitation wavelength. The G channel (G λ) provided a direct readout of the GcaMP6 signal, with negligible bleed-through from the sparse dsRed and mCherry fluorescence (Extended Data Figure 6d). The R channel (Rλ), instead, reflected a linear mixture of GcaMP6s, dsRed and mCherry fluorescence (Extended Data Figure 6e). Because the GcaMP6 labelling was dense, while both mCherry and dsRed labelling were sparse, contributing to a minority of pixels, we could compute the GcaMP6 signal contributing to Rλ by piecewise robust linear regression of Rλ against Gλ (Extended Data Figure 6f). We binned the pixels from Gλ in 50 intervals i, and took the median of each interval to represent the component of Rλ explained by GcaMP6 fluorescence. We then computed the image Mλ corresponding to the linear mixture of mCherry and dsRed signals as (Extended Data Figure 6g):
where the parameters αλi and βλi are the result of the robust linear regression. Finally, we decomposed Mλ in the Rmcherry and Rdsred source images (Extended Data Figure 6h–j). The linear problem was formulated as:
where δλ, kλ are the linear mixture coefficients of the two fluorophores. These coefficients should theoretically correspond to the product between the action cross section at wavelength λ and the integral of the emission spectrum captured by the red channel of the microscope. However, neither could we provide constant excitation intensity at each wavelength, nor could we control for the contribution of scattering and autofluorescence at different imaging depths. To compensate these issues, we learned both the source images and new mixing coefficients with an iterative custom linear unmixing algorithm, constructed to return maximally uncorrelated source images while minimising the quadratic reconstruction error over the data. Starting from the theoretical mixing coefficients, we iterated between estimating the source images while keeping the mixing coefficient fixed and optimising the mixing coefficients while keeping the source images fixed, until convergence.
Visual stimulation
Visual stimuli were generated in Matlab (MathWorks) using the Psychophysics Toolbox60 (psychtoolbox.org) and displayed on 3 gamma-corrected LCD monitors (Iiyama ProLite E1980SD, refresh rate 60 Hz, connected through a Matrox TripleHead2Go Digital Edition multi-display adapter) surrounding the mouse at 90 degrees to each other. The LCD screens were covered with Fresnel lenses to correct for viewing angle inhomogeneity of the LCD luminance61. The mouse was positioned at the centre of the U-shaped monitor arrangement at 20 cm from all three monitors, so that the monitors spanned ±135 degrees of horizontal and ±35 degrees of the vertical visual field.
Sparse, spatial white noise stimuli were used to map the retinotopy of the imaged area and estimate the receptive field (RF) of neurons. Patterns of sparse black and white squares (4.5-6 degrees of visual field) on a grey background were presented at 5 Hz, typically in 10 min sequences repeated 3 times for each FOV. At any point in time, each square had a 2-5% probability of being non-grey, independent of the other squares.
To measure direction and orientation tuning we presented gratings drifting in twelve different directions, centred on the RF of the postsynaptic neuron. Gratings were presented in a circular window of 30-80 deg, depending on the size of the imaged FOV, at 100% contrast on a grey uniform background, with a spatial frequency of 0.05 cycles/deg, and a temporal frequency of 2 Hz. In some experiments, to stimulate more neurons, we also varied the spatial and temporal frequency of the gratings between 0.05-0.5 cycles/deg and 0.5-5 Hz. Six to ten repeats of each stimulus were presented for each FOV. Stimuli lasted 1-2 s, separated by 3-4 s of grey background.
Processing of two-photon data
Two-photon data were pre-processed using Suite2p (Ref. 62). The pipeline included image registration, segmentation of active region of interest (ROIs), and estimation of the neuropil signal contaminating each ROI. The final selection of ROIs was curated manually to include only neuronal somas and discard spurious or noisy ROIs. Active presynaptic neurons expressing dsRed were identified by inspecting the average dsRed image for each acquisition. Simultaneously recorded neuronal responses from each imaged volume were aligned to a common time reference by interpolation.
The neuropil signal was weighted by a correction factor α, determined separately for each ROI (Ref. 63), before being subtracted. The correction factor was estimated from the linear relationship between the lowest somatic fluorescence compatible with any value of fluorescence in the neuropil. For each neuron i the neuropil signal Ni(t) was binned into 20 intervals; for each interval, the 5th percentile of the matching time-points of raw somatic fluorescence Fi(t) was measured as an estimate of baseline fluorescence. αi was then computed by linear regression between the median of each neuropil interval and estimates of baseline fluorescence, to accurately fit the lower envelope of the scatterplot of neuropil versus somatic fluorescence. The corrected fluorescence was computed as Fi (t) – αiNi (t). Finally, fluorescence time-courses were z-scored for further analysis.
Volumetric imaging often resulted in the same neurons being imaged multiple times in different imaging planes: duplicates of the same neuron were identified as ROIs whose centre of mass was closer than 5 μm in lateral distance and closer than 20 μm in depth and had a signal higher than 0.5.
For longitudinal imaging experiments of presynaptic neurons before and after rabies tracing (Extended Data Figure 3e–h), ROIs corresponding to putative presynaptic neurons were manually identified by comparing the outputs of Suite2P before and after tracing. Subsequently, templates corresponding to the same neuron across recordings were matched based on image correlation and relative 3D position. Matches were where further curated manually to eliminate false positives.
Quantification of the rabies tracing and associated neuronal mortality
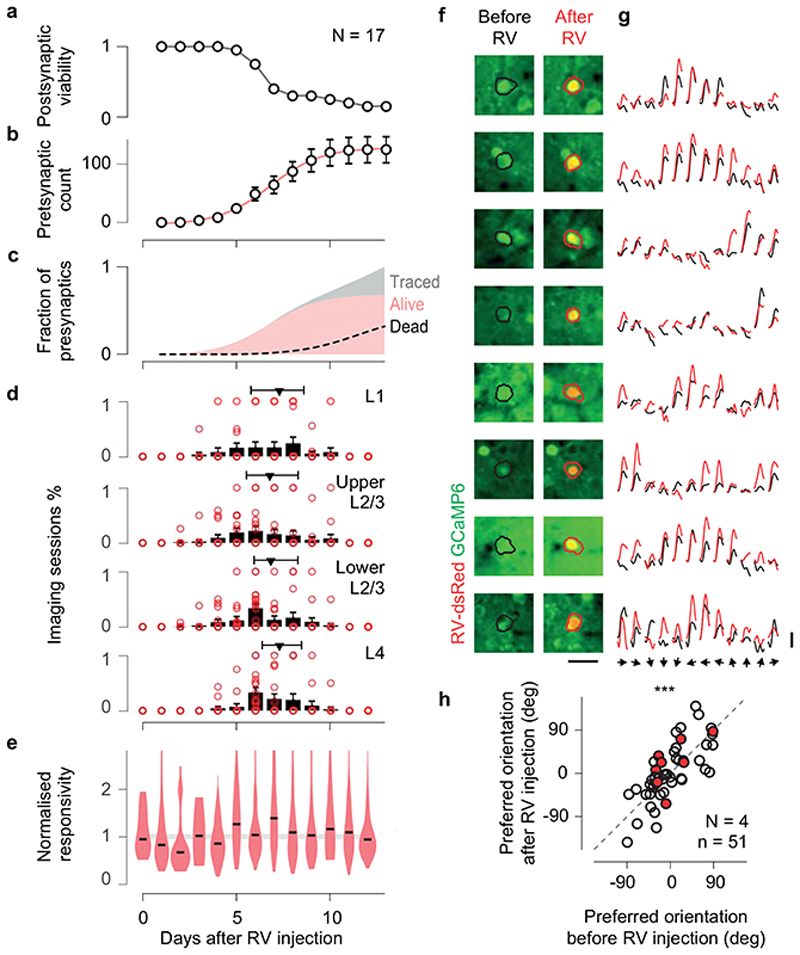
The progression of rabies tracing over days was monitored using structural and functional z-stacks. The viability of the postsynaptic neuron (Pd) was evaluated based on progressive signs of apoptosis: elevated intracellular calcium, lack of functional responses and dendritic blebbing (Extended Data Figure 3a). The number of presynaptic neurons observed each day (Od) was manually counted from each z-stack (Extended Data Figure 3b). Missing observations were interpolated assuming a sigmoidal progression of the tracing. Because of the cytotoxicity of the rabies virus, Od may not correspond to the total number of presynaptic neurons traced Td: some presynaptic neurons could progressively become sick and disappear with the passing of days (Extended Data Figure 3c). Let Nd be the number of new presynaptic neurons traced by the rabies virus on day d; the total number of traced neurons can be calculated as
and the population mortality Md curve of presynaptic neurons as:
While, we could not directly measure Nd, we could estimate it from Od by assuming the viability of each presynaptic neuron, once infected by the rabies virus, would degrade at the same rate Pd measured for the postsynaptic neurons (Extended Data Figure 3c). This assumption yields a worst-case scenario population mortality estimate for presynaptic neurons, which, being transduced by fewer virions than the postsynaptic neuron, should in fact survive longer. At the beginning of the experiment, N 1 = O 1 = 0, as the tracing has not begun yet. We then iteratively estimated the number of neurons appearing each new day of tracing as:
that is the number of neurons observed at day d minus the number of neurons that survived from previous days (Extended Data Figure 3c).
Classification of excitatory and inhibitory neurons
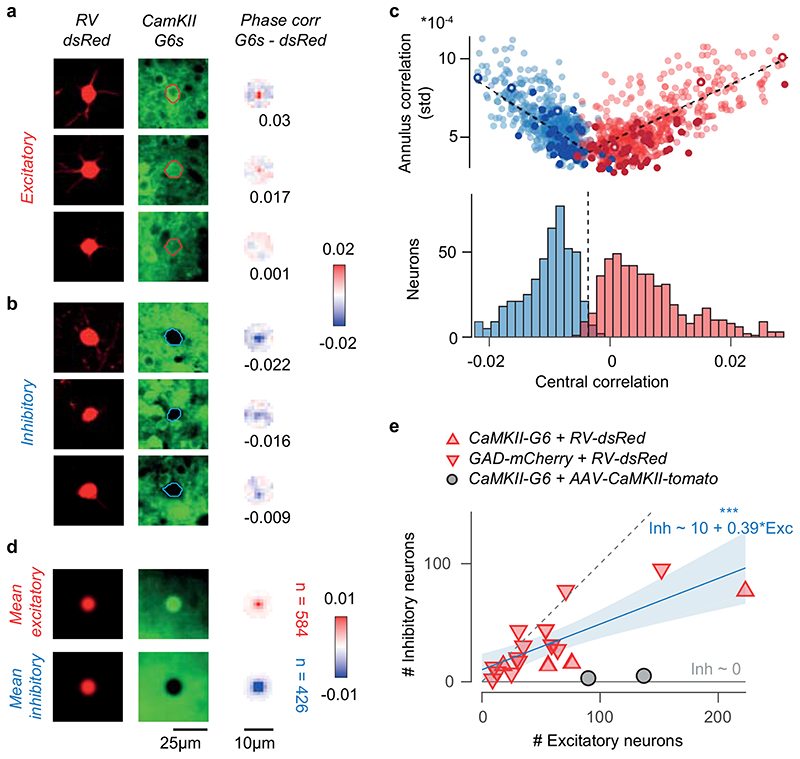
For experiments in CaMK2a-GCaMP6 transgenics, a custom algorithm was used to identify and classify presynaptic neurons either as excitatory or inhibitory (Extended Data Figure 4). Serial volumetric imaging time-series were averaged to obtain high signal to noise ratio z-stacks, with a green GCaMP6 channel, highlighting GCaMP6 expressing neurons, and a red dsRed channel, highlighting presynaptic neurons. An iterative thresholding algorithm was used to segment somatic masks of presynaptic neurons from the red channel; somatic masks were inspected and curated manually, and spurious or out-of-focus neurons discarded (Extended Data Figure 4a, b). Then, the phase correlation (i.e. whitened cross-correlation) between the somatic mask of each neuron and its GCaMP6 fluorescence image was used to classify neurons as GCaMP6 positive or GCaMP6 negative cells (Extended Data Figure 4a–d). The amplitude of the central correlation peak and the standard deviation of the correlation values inside a 5 μm annulus around the peak were used to fit a bilinear classification boundary separating putative excitatory GCaMP6 expressing neurons from putative inhibitory GCaMP6 negative neurons (Extended Data Figure 4c). This classification was computed independently for each experiment. The sensitivity and specificity of the algorithm (~90-95%) were tested in control experiments were a red protein was sparsely expressed only in excitatory neurons (Extended Data Figure 4e) and by immunohistochemistry (Extended Data Figure 5).
For experiments in Gad2-T2a-NLS-mCherry transgenics, putative excitatory and putative inhibitory neurons were sorted based on the expression of nuclear mCherry.
The cortical position of presynaptic neurons was used to estimate their radial and layer densities around the postsynaptic neuron. Cortical probability densities were calculated in 625 μm2 bins and smoothed with a 25 μm wide Gaussian kernel. Probability densities P(x) were calculated independently for excitatory and inhibitory presynaptic ensembles, by dividing the number of neurons in each spatial bin (N x) by the total number of traced neurons.
Analysis of neuronal responses
All neurons identified by Suite2P were considered responsive and included for further analysis. Stimulus triggered responses were computed as the difference between the zscored fluorescent trace and the 20th percentile of the baseline activity 1 s prior to stimulus presentation. Stimulus triggered average responses and standard errors were obtained across responses to the same type of stimuli.
Responses to drifting gratings were quantified as the integral of the fluorescent response in a 3 s window following the onset of stimulation. The preferred orientation and direction of motion were defined according to the grating eliciting the maximal response. For postsynaptic neurons only, the response window was optimised, and the preferred direction and orientation were computed by fitting a double-Gaussian tuning curve to the data. The direction selectivity index of postsynaptic neurons was computed as:
where Rpref is the response to the preferred direction, and Ranti is the response to the anti-preferred direction. Neuronal responsivity was quantified as the average response to the preferred stimulus, z-scored with respect to the blank trials’ standard deviation. To compare across sessions, responsivity was normalised to the median responsivity across all simultaneously recorded neurons.
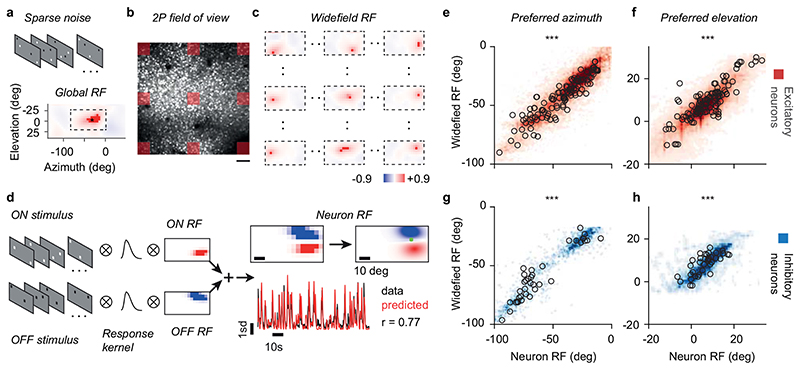
Widefield RF centres were estimated from population retinotopic maps (Extended Data Figure 9a–c). For this analysis, imaging time series were de-noised and compressed by SVD. Recordings from different planes were z-scored and concatenated to produce a single movie for each imaging volume. Widefield RF were calculated by reverse correlation between fluorescence signals and the absolute changes in luminance of the stimulus. First, a global RF was fit to the whole imaged volume (Extended Data Figure 9a). Second, the imaged volume was binned in quadrants using a 10 by 10 grid, and a new RF centre fit to individual quadrants; these fits were constrained to be within 60 deg in azimuth and 35 deg in elevation from the global preferred retinotopic location. RF centres from each quadrant were combined into a coarse retinotopic map, which was finally interpolated to the full pixel size of the FOV and smoothed with a 50μm Gaussian. The retinotopic map was used to assign widefield RF centres to each neuron based on their position in the FOV. Retinotopic maps were also used to confirm the targeting of the experiment to V1, and discard cortical territories in higher visual areas from further analysis.
Linear neuronal RFs were estimated by reverse correlating the neuronal responses and the stimuli (Extended Data Figure 9d). The regression problem was solved by a cross validated, regularised pseudoinverse algorithm, which imposed the Laplacian of the RF (L = ∇2 F) be close to zero at each point:
The regularisation parameter λ sets the balance between the two-dimensional smoothness of the RF and the prediction of the response (r) to the stimulus (S). For each RF, we used 6-fold cross validation to choose the regularisation parameter λ that maximised the RF predictive performance. The RF performance was measured as the correlation between the predicted response and the data. For each neuron, we repeated three rounds of RF fitting in order to estimate the ON subfield, the OFF subfield, and the subfield responding to absolute changes in luminance. ON subfields were fit using only the white squares presentations as predictors. OFF subfields were fit using only the black squares presentations as predictors. Absolute subfields were fit using the full stream of stimuli as predictors. RF subfields were considered significant if their performance was > 0.2. The RF centre for each neuron was calculated as the weighted sum of its significant subfields.
Orientation tuning and retinotopic alignment of presynaptic ensembles
Multiple statistical tests were used to ascertain if the tuning of presynaptic ensemble accorded with that of the postsynaptic neuron. First, significant variations in angular counts of presynaptic preferred orientation were assayed with a two-sided, one-way Kruskal-Wallis test. Second, angular counts of presynaptic preferred and opposite direction were compared with a two-tailed Willcoxon signed-rank test. Third, circular correlation was used to ascertain if the average preferred orientation of presynaptic ensembles correlated with that of the postsynaptic neurons. As a further test of alignment, the circular V-statistic was used to assess if the difference between the presynaptic and postsynaptic preferred orientation formed a unimodal circular distribution centred at 0 deg. Finally, the circular variance of the presynaptic direction preferences was used to measure the tuning of the presynaptic ensemble.
As an internal control for each experiment, the same analyses were repeated on 104 surrogate distributions drawn from other simultaneously recorded neurons. To obtain an empirical p-value for this control, the statistics from the presynaptic ensembles were tested against a null distribution computed from the surrogate ensembles. These analyses were performed either by including all presynaptic neurons, or by splitting them by layer based on cortical depths. Surrogate distributions were generated accordingly.
The axis of presynaptic spatial patterns was measured as the sum of the angular positions of presynaptic neurons around the postsynaptic neuron. The alignment between the angle of the presynaptic axis and the orientation selectivity of the postsynaptic neuron was tested with circular correlation and circular V-test, with analyses equivalent to the ones described for orientation preference. To craft surrogate retinotopic ensembles matched in size and spatial scale, each cortical distribution of presynaptic neurons was modelled as a 2D isotropic Gaussian. Surrogate ensemble drawn from these fits were isotropic in cortical space by design, and once transformed into visual space, reflected and controlled for biases due to local inhomogeneity or varying magnification factor in the retinotopic map.
The presynaptic spatial angular distributions were modelled as:
where the density A of presynaptic neurons in each angular bin x around the postsynaptic neuron was the sum of a sinusoidal function aligned to the postsynaptic preferred orientation and a Gaussian function aligned to the postsynaptic anti-preferred direction.
To average the excitatory and inhibitory presynaptic densities measured in each experiment, we rotated them, aligned them, and scaled them to a common template in which the preferred direction of the postsynaptic neuron pointed rightwards. Rotation was designed to align the preferred direction of the postsynaptic cell to 0 deg in visual space. Scaling was tailored to match in size symmetric Gaussian fits to the density of the inhibitory ensembles.
To estimate the direction selectivity of the postsynaptic neuron from the distribution of excitatory and inhibitory presynaptic ensembles, we used the following expression:
where Eo and Io are the densities of excitatory and inhibitory presynaptic neurons in the angular sector opposite the preferred direction, and Ea and Ia are densities for the angular sector ahead.
Circular statistics were computed using the CircStat toolbox64.
Statistics and reproducibility
We present results obtained from N = 17 independent replicates of the same experiment. Throughout the figures: N represents the number of independent datasets; n represents the number of neurons, or samples, within a dataset; p-values are summarised as: n.s. = not significant; * p≤0.05; ** p ≤0.01; ***p≤0.001. Whenever results from representative experiments are shown, the number independent replicates (N) and total samples (n) is indicated either in the figure legend or in summary plots.
Extended Data
Extended Data Figure 1. Targeted single neuron electroporation with survival control in vivo.
(a) Experimental pipeline: electroporation of the postsynaptic neuron, targeted by shadow-imaging and expression of GCaMP6; imaging of the postsynaptic neuron, labelled by dsRed; injection of the modified rabies virus; imaging and tracing of the presynaptic neurons marked by dsRed. (b-d) Schematic of the electroporation technique, performed under a two-photon microscope on a transgenic mouse expressing GCaMP6 in cortical excitatory neurons. (b)A pipette filled with DNA plasmids and Alexa 594 is targeted to a craniotomy; an 820 nm laser (red) excites Alexa 594 fluorescence (magenta) and GCaMP6 fluorescence (cyan). The latter is insensitive to neural activity because 820 nm is an isosbestic wavelength, where calcium-bound and calcium-free isoforms fluoresce approximately equally. (c) Upon electroporation, DNA plasmids and Alexa594 are transferred into a neuron expressing GCaMP6. (d). A healthy neuron maintains its GCaMP6 concentration and the resulting calcium-insensitive fluorescence (top), while a neuron with a damaged membrane bleeds indicator, gradually darkening and disappearing against the surrounding neuropil (bottom). (e) Time-lapse of an electroporation in layer 2/3 of mouse V1, using Alexa 594 negative contrast and calcium insensitive GCaMP6 fluorescence imaging: approach (left), electroporation (middle), pipette withdrawal (right). Scale bar 15 μm (f) The same neuron, imaged the next day at 920 nm, expressing the electroporated genes for dsRed (red) and maintaining healthy GCaMP6 expression (green). (g) Average fluorescence (mean ± s.e.m.) of somatic Alexa 594 (magenta) and GCaMP6 (cyan) relative to neuropil background (dashed line represents unity) before and after electroporation (arrow, n = 10 neurons). (h,i) Same as e,f, with a slower time-lapse of a neuron that survived the procedure. Images in h are 30 s long averages acquired 0-1 min (left), 2-3 min (centre) and 5-6 min (right) after electroporation. (j,k) Same as h,i, for a neuron that did not recover from the electroporation. (l) Same as g, for GCaMP6 somatic fluorescence (mean ± s.e.m.) in neurons that did (cyan, n=18) or did not (grey, n=10) survive the procedure. Scale bar 15 μm, same for all fluorescence images.
Extended Data Figure 2. Photoablation of supernumerary postsynaptic neurons before rabies injection.
(a) Cartoon of the protocol. The target neuron expresses both GCaMP6 (green) and dsRed (red), while surrounding neurons only express GCaMP6. The day after electroporation (Day1), the neuron is targeted with steady two-photon illumination at 820 nm, focused with intensity ~ 200 mW, for 10-20 s (top). The target neuron is ablated and by the next day (Day 2) it has disappeared (bottom). (b) Time lapse imaging during the photoablation of two neurons neighbouring neurons, lasting approximately 10 min. Imaging at 920 nm shows calcium sensitive fluorescence of GCaMP6 (top) and fluorescence of dsRed (bottom). Each of them was targeted with two photoablation pulses (red triangles). Photoablation pulses lasted 20 s, and each neuron was imaged for 30s afterwards. Each pulse increases cellular damage: localised photo-bleaching after the first pulse; elevated intracellular calcium and cell swelling after the second pulse. Neighbouring cells, not expressing dsRed, resist the photo-damage. (c) The successful elimination of the target neurons (red, see insets) is confirmed the day following the photoablation procedure: by Day 2 the target neuron has either disappeared (yellow arrow, top neuron) or gone in apoptosis (yellow arrow, bottom neuron). The surrounding tissue is unaffected, as shown by the normal activity detected in neighbouring neurons using Suite2p (blue-green ROIs and traces, scale bar 30 s and 10 s.d.). (d) Effectiveness of photoablation as a function of cortical distance from the photoablation target neuron (n = 9 attempts, mean ± s.e.).
Extended Data Figure 3. Time-course of rabies tracing and recordings.
(a) Viability of postsynaptic neurons as a function of day after the rabies virus injection, based on N = 17 injections. (b) Count of observed presynaptic neurons traced over the same period from N = 17 postsynaptic neurons (mean ± s.e.m.). (c) Fraction of viable presynaptic neurons (red) over the total traced (grey), and worst-case scenario population mortality of presynaptic neurons (dashed), estimated assuming the viability of each newly labelled presynaptic neuron degrades at the same rate as the viability of the postsynaptic neurons measured in a. (d) Average distribution across animals (N = 17, mean ± s.e.) of the imaging sessions used to record the responses of presynaptic neurons, split by cortical layer. The time of imaging did not systematically change across layer (red triangle, median, first and third quartiles), and most of the data was acquired before presynaptic neurons suffer from the toxicity of the rabies virus. (e) Distribution of responsivity of the presynaptic neurons across days (red violin plot with black median). Responsivity was measured as the maximum average stimulus-triggered response. To compare across sessions, presynaptic responsivity was normalised to the median responsivity of the local population (shaded line). (f) Longitudinal imaging of presynaptic neurons identified before (left, black ROI) and 5-12 days after (right, red ROI) rabies virus infection. Scale bar 25 μm. (g) Average responses to drifting gratings of the same presynaptic neurons before (black) and after (red) the rabies virus infection. Responses (4 s long) were z-scored with the respect to blank trials. Scale bar 1 std. (h) Preferred orientation of presynaptic neurons recorded before and after the rabies virus infection. At the time of recording used in this study, the preferred orientation of presynaptic neurons is unperturbed by the rabies virus infection (n = 51 neurons from N = 4 animals, circular correlation 0.76, pr = 1.6*10-6, Z-test).
Extended Data Figure 4. Classification of excitatory and inhibitory presynaptic neurons.
(a) Three example excitatory presynaptic neurons showing similar expression of dsRed (left) and decreasing expression of GCaMP6 (middle). The somatic mask obtained from dsRed and the GCaMP6 signal were used to compute a map of phase correlation in the 5 μm radius annulus around the somatic centre (right). In the first two examples, the stronger GCaMP expression in the soma compared to the surrounding neuropil results in positive peaks of the phase correlation. (b) Same as a for three example inhibitory neurons. The lack of GCaMP6 expression in the soma results in negative peaks of the phase correlation. (c) For each presynaptic neuron, the central peak of phase correlation is plotted against the standard deviation of the phase correlation within the 5 μm annulus around the soma (top). Darker dots indicate neurons whose identity was confirmed by immunostaining. Open dots represent example neurons shown in a-b. A classification boundary was used to split the clusters of excitatory (red) and inhibitory neurons (blue). This boundary was identified independently for each presynaptic ensemble with a bilinear fit. The average fit across datasets is shown (black line). The histogram (bottom) summarises the classification across experiments, with the average classification boundary. (d) Average expression of dsRed (left), GCaMP6 (middle) and map of phase correlation (right) for presynaptic neurons classified as excitatory neurons (top, n=516) or inhibitory neurons (bottom, n = 478). (e) Number of presynaptic neurons classified as inhibitory vs excitatory in experiments in CaMK2-GCaMP6 mice (red upward triangles, N=13) and GAD2-NLS-mCherry mice (red downward triangles, N=4). A linear fit (blue, r = 0.6, pr=2.6*10-3, linear correlation, F-test) shows that the fraction of traced presynaptic neurons that are inhibitory tends towards 30% as the yield of tracing increases; yet, due to the positive intercept, the fraction of inhibitory neurons may appear as high as 60% in experiments with low tracing yield. In control experiments where the red marker tdTomato was expressed only in excitatory neurons (AAV-CaMK2-tomato in CaMK2-GCaMP6 animals, grey circles), the fraction of neurons incorrectly classified as inhibitory was below 5%.
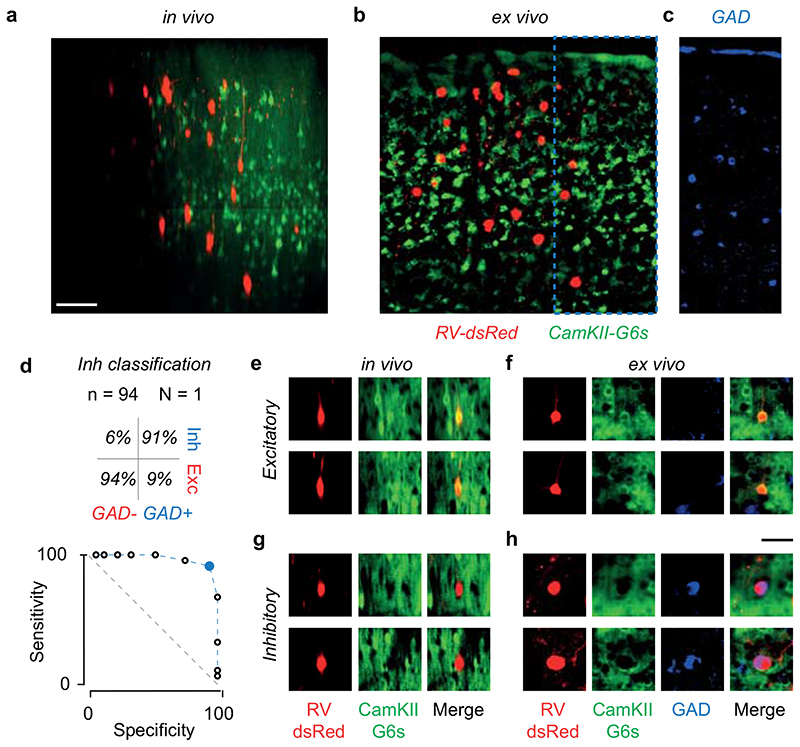
Extended Data Figure 5. Immuno-histochemical verification of presynaptic neuron classification method.
(a) Coronal maximum projection from a z-stack acquired in vivo, showing a section through a presynaptic network labelled with RV-dsRed (red) in a CaMK2a-GCaMP6s transgenic animal (green). Scale bar 50 μm. (b) Coronal brain slice matching the section in a. We could match n=94 out of the n=105 neurons traced in vivo. (c) Inset from b (dashed) showing the immunostaining for the inhibitory neurons marker GAD (blue). (d) ROC curve illustrating the sensitivity and specificity of the neuron classification method based on somatic GCaMP6 fluorescence (Extended Data Figure 4) against the ground-truth measurements obtained by immunostaining against GAD, for a range of classification boundaries. The fitted classification boundary was optimal (blue dot), yielding a specificity of 94% and sensitivity of 91%. (e) Two example presynaptic neurons classified as excitatory (n=49) from the z-stack in a. (f) Slice immunostaining of the two neurons in e. Neurons where confirmed excitatory if they expressed GCaMP6 and were GAD-negative (n = 45). Scale bar 40 μm. (g,h) Same as e,f, for two example presynaptic neurons classified as inhibitory. Neurons where confirmed inhibitory if they did not express GCaMP6 and were GAD-positive (n = 42).
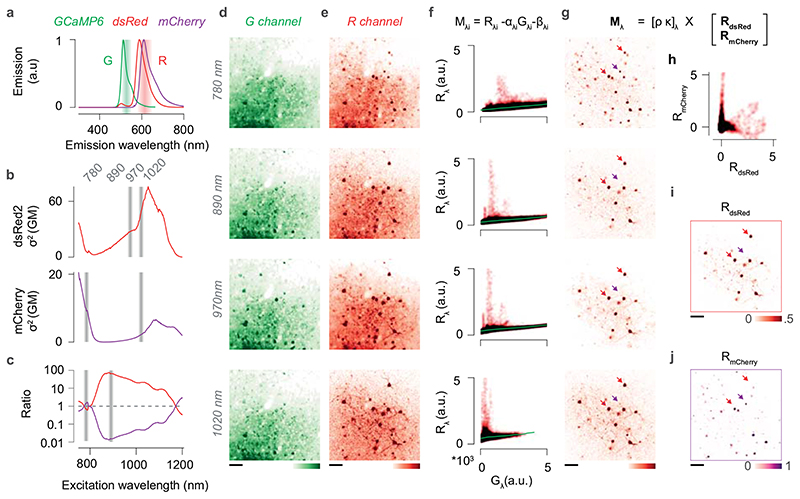
Extended Data Figure 6. Spectral unmixing of dsRed and mCherry fluorescence.
(a) Emission spectra of GCaMP6, dsRed and mCherry. Shaded areas indicate the emission band captured by the green (G) and red (R) channels of the microscope. Note that the G channel collects mostly GCaMP6 fluorescence, while the R channel captures a mixture of mCherry, dsRed and GCaMP6 fluorescence. Emission spectra were normalised to their peak. (b) Two-photon action cross-section of dsRed (top, red) and mCherry (bottom, purple). Shaded bands indicate the excitation wavelengths used for imaging: 780, 890, 970, and 1020 nm. (c) Ratio between the two-photon action cross-sections of dsRed and mCherry (red) and its inverse (purple). The four wavelengths used for imaging (dark red) were chosen to maximise the SNR of each fluorophore while ensuring the ratio between the two signals was maximal. (d) Example field of view imaged at the four excitation wavelengths in the G channel. GCaMP6 was expressed in all neurons with an AAV2.1-Syn-GCaMP6s in a GAD-NLS-mCherry mouse; a subset of presynaptic neurons was traced with a dsRed rabies virus. (e) Same as d, for the R channel. (f) The fluorescence in the R channel (R λ) plotted against the fluorescence in the G channel (G λ) for each pixel, and for each excitation wavelength λ. Because the GCaMP6 labelling was dense and both the dsRed and the mCherry signals were sparse, and because the contribution of dsRed and mCherry to Gλ was minimal, the GCaMP6 signal contributing to Rλ could be recovered by piecewise robust linear regression (αGλ + β). (g) The image representing the linear mix of dsRed or mCherry signals, F λ, was recovered by subtracting the scaled GCaMP6 image from the Rλ. (h) An iterative algorithm was used to linearly unmix the two source images. Each unmixing iteration was constrained to minimise the quadratic reconstruction error over the data and return maximally uncorrelated sources RdsRed and RmCherry. (I,j) The two source images RdsRed and RmCherry for the example field of view in d-e. Note that the unmixing procedure correctly recovers the nuclear localisation of mCherry without any prior. Scale bars are 50 μm. Similar results were obtained for all GAD-NLS-mCherry mice (N=4).
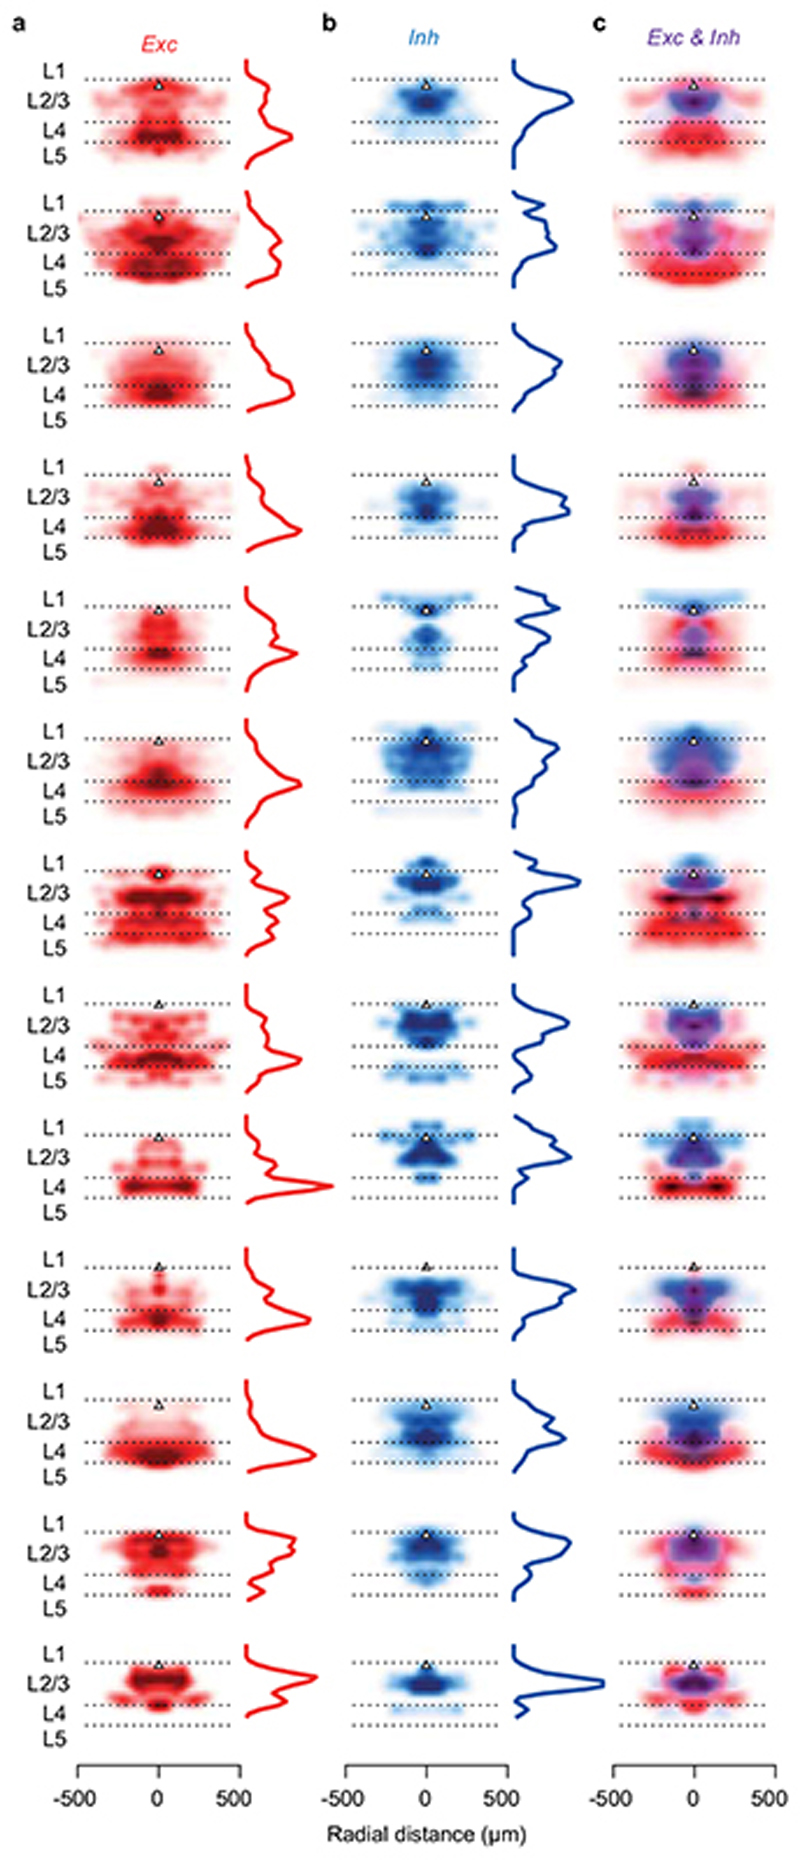
Extended Data Figure 7. Distributions of individual excitatory and inhibitory presynaptic ensembles.
(a) Density of excitatory presynaptic neurons around the postsynaptic neuron (black triangle) as a function of cortical depth and horizontal distance from the postsynaptic neuron. Density was normalised to its maximum for display purposes. Depth marginals are shown on the left of each density map. (b) Same as a, for inhibitory presynaptic neurons. (c) Overlay of excitatory and inhibitory densities shown in a and b. Data are shown for the 12 experiments that included substantial recordings from L4.
Extended Data Figure 8. L2/3 neurons receive presynaptic excitation preferentially tuned to their orientation preference.
(a) Average tuning across the postsynaptic neurons responding to drifting gratings (N=16, mean ± s.e.m.), after alignment of their preferred stimulus direction to 0 deg. (b) Distribution of preferred direction relative to the postsynaptic preferred direction, for excitatory presynaptic ensembles across all layers (N=15, median ± m.a.d.). (c) Same as b, for excitatory presynaptic ensembles within L2/3 (top) and within L4 (bottom). (d) Same as b, for inhibitory presynaptic ensembles. (e) Average orientation tuning across the postsynaptic neurons responding to drifting gratings (N=16, mean ± s.e.m.), after alignment of their preferred stimulus orientation to 0 deg. (f) Average distribution of preferred orientation relative to the postsynaptic preferred orientation, for excitatory presynaptic neurons pooled across all layers (N=15, median ± m.a.d.). Presynaptic ensembles tuning for orientation (pkw = 5*10-8, two-sided one-way Kruskal-Wallis test) was significantly stronger than expected from random samples of the surrounding population (grey, median±m.a.d.). (g) Same as f, for presynaptic ensembles within L2/3 (top, N = 15, pkw = 10-7) and within L4 (bottom, N= 13, pkw = 2*10-5). (h) Same as f, for inhibitory presynaptic ensembles. (i) The tuning of the distributions of preferred orientation of excitatory presynaptic ensembles across layers plotted against the preferred orientation of their postsynaptic neuron. The co-tuning for orientation (r = 0.75, circular correlation, pr = 4*10-3, Z-test; pv = 9*10-8 circular V-test) was stronger than expected from random samples of the local population (pr_rand < 10-4 for circular correlation, pv_rand < 10-4 for V statistic). Upwards triangles represent experiments in CaMK2-GCaMP6 mice (N=11); downward triangles indicate experiments in GAD2-NLS-mCherry mice (N=4). (j) Same as i for excitatory presynaptic ensembles within L2/3 (top, r =0.92, pr = 5*10-3, pv = 10-5, pr_rand = 2*10-4, pv_rand < 10-4, N = 15) and within L4 (bottom, r = 0.76, pr = 2*10-2, pv=3*10-3, pr_rand = 0.18, pv_rand = 3*10-3, N=13). (k) Same as i for inhibitory presynaptic ensembles. Inhibitory presynaptic ensembles were weakly biased to the orientation preference of the postsynaptic neuron (pv = 0.05, circular V-test, N=4).
Extended Data Figure 9. Mapping retinotopy using individual neurons vs. widefield signals.
(a) The stimulus used for retinotopic mapping was a sparse random pattern of white and black squares on a grey background (top). The fluorescence time-course from the entire field of view was used to compute a global stimulus-triggered average response elicited by changes in luminance at each position. The centre of mass of this global receptive field (RF) was used to constrain the fits of widefield and neuronal RF to the appropriate retinotopic region. (b) Maximal projection from an example field of view. In this example, the field of view was subsampled in a grid of 9×9 regions of interest (ROIs, red squares) to compute widefield RFs. Scale bar: 100 μm. (c) The widefield RFs calculated for the ROIs in b, normalised to their maximum. The widefield RF centres from the grid of ROIs were interpolated to estimate a retinotopic map, assigning a widefield RF to each cortical location, whether it contained a responsive neuron, an unresponsive neuron, or neuropil. (d) Estimation of neuronal RFs. ON (red) and OFF (blue) receptive fields were estimated by regularised smooth pseudoinverse regression using either streams of white (ON) or black stimuli (OFF) as predictors, and assuming a common response kernel across neurons. ON and OFF subfields were then combined to estimate the RF centre (green dot). RF were considered significant if the cross validated correlation coefficient between predicted (red trace) and actual response (black trace) was greater 0.2. (e) Azimuth of neuron RF centre vs. widefield RF centre for all excitatory presynaptic neurons (black dots, n = 113, rpre = 0.89, p r_pre = 2.8*10-39, linear correlation, F-test) and surrounding excitatory neurons (red density, n = 25677, rall = 0.88 p r_all < 10-308, linear correlation F-test) across experiments. (f) Same as e for elevation (rpre=0.80, pr_pre= 9*10-27; rall = 0.85, p r_all < 10-308). (g,h) Same as e and f for presynaptic inhibitory neurons (black dots, n = 37, rpre=0.92, pr_pre=1.3*10-15, for azimuth; rpre=0.71, pr_pre=9.7*10-7, for elevation) and all inhibitory neurons (n = 1963, rall=0.95, pr_all < 10-308, for azimuth; rall=0.74, p r_all < 10-308, for elevation).
Extended Data Figure 10. Spatial connectivity accords with direction selectivity in cortex and across layers.
(a) Distribution of excitatory and inhibitory presynaptic neurons in cortex, pooled across experiments (N=17), and polar tuning curves for each postsynaptic neuron (top). The colour hue indicates the average fraction of local excitatory (red) or inhibitory (blue) presynaptic neurons; the colour saturation indicates the max-normalised input density, averaged across experiments. (b,c) Same as a, plotting the excitatory and inhibitory presynaptic neurons separately. (d) Same as a, after rotating each presynaptic cortical distribution to align the postsynaptic preferred direction(N=16). The cortical angle of rotation, corresponding to the postsynaptic preferred direction, was calculated from the local retinotopic gradient at the postsynaptic location. After the alignment, the postsynaptic preferred orientation approximately maps to a line at the postsynaptic location (dashed line). (e) Same as d, for excitatory presynaptic neurons (f) Same as in d, for inhibitory presynaptic neurons. (g) Same as d, for the distribution of L1 and L2/3 excitatory and inhibitory presynaptic neurons in visual space, pooled across experiments after alignment to the preferred direction across postsynaptic neurons (N=16). (h,i) Same as g, distinguishing between excitatory and inhibitory presynaptic neurons. (j-l) Same as g-i, for presynaptic neurons in L4 and in superficial L5. In all panels, upwards triangles and circles represent CaMK2-GCaMP6 datasets; downward triangles and squares indicate GAD2-NLS-mCherry datasets.
Acknowledgments
We thank Ed Callaway for sharing viruses via the Salk Institute Vector Core; Matteo Rizzi for advice on electroporation; Michael Krumin for support with microscopy; Charu Reddy for help with plasmid production; Mikhail Drobizhev for providing the two-photon cross section of fluorescent proteins; Stephane Bugeon for help with histology and anatomical registration; Letizia Mariotti for help with anatomical reconstructions and cell counting; Massimo Scanziani for suggestions on the manuscript. We also thank Kamill Balint, Stuart Trenholm, Botond Roska, and Marco Tripodi for advice and for genetic materials that we used in pilot studies. This work was supported by the Wellcome Trust (grants 099692/Z/12/Z to LFR; grants 205093 and 108726 to KDH and MC). MC holds the GlaxoSmithKline / Fight for Sight Chair in Visual Neuroscience.
Footnotes
Author contributions.
LFR, KDH, and MC conceived the experiments. LFR refined the techniques, performed the experiments, and analysed the data. LFR, KDH, and MC wrote the paper.
Competing interest.
The author declares no competing interest.
Data availability
Source data for the figures are deposited at: https://github.com/lfedros/Rossi-et-al-2020
Other data will be available from the authors upon reasonable request.
Code availability
Code used in this study are deposited at: https://github.com/lfedros/Rossi-et-al-2020
References
- 1.Wertz A, et al. Single-cell-initiated monosynaptic tracing reveals layer-specific cortical network modules. Science. 2015;349:70–74. doi: 10.1126/science.aab1687. [DOI] [PubMed] [Google Scholar]
- 2.Ko H, et al. Functional specificity of local synaptic connections in neocortical networks. Nature. 2011;473:87–91. doi: 10.1038/nature09880. [DOI] [PMC free article] [PubMed] [Google Scholar]
- 3.Iacaruso MF, Gasler IT, Hofer SB. Synaptic organization of visual space in primary visual cortex. Nature. 2017;547:449–452. doi: 10.1038/nature23019. [DOI] [PMC free article] [PubMed] [Google Scholar]
- 4.Lee WC, et al. Anatomy and function of an excitatory network in the visual cortex. Nature. 2016;532:370–374. doi: 10.1038/nature17192. [DOI] [PMC free article] [PubMed] [Google Scholar]
- 5.Wilson DE, Whitney DE, Scholl B, Fitzpatrick D. Orientation selectivity and the functional clustering of synaptic inputs in primary visual cortex. Nat Neurosci. 2016;19:1003–1009. doi: 10.1038/nn.4323. [DOI] [PMC free article] [PubMed] [Google Scholar]
- 6.Cossell L, et al. Functional organization of excitatory synaptic strength in primary visual cortex. Nature. 2015;518:399–403. doi: 10.1038/nature14182. [DOI] [PMC free article] [PubMed] [Google Scholar]
- 7.Wilson DE, Scholl B, Fitzpatrick D. Differential tuning of excitation and inhibition shapes direction selectivity in ferret visual cortex. Nature. 2018;560:97–101. doi: 10.1038/s41586-018-0354-1. [DOI] [PMC free article] [PubMed] [Google Scholar]
- 8.Jia H, Rochefort NL, Chen X, Konnerth A. Dendritic organization of sensory input to cortical neurons in vivo. Nature. 2010;464:1307–1312. doi: 10.1038/nature08947. [DOI] [PubMed] [Google Scholar]
- 9.Packer AM, Yuste R. Dense, unspecific connectivity of neocortical parvalbumin-positive interneurons: a canonical microcircuit for inhibition? J Neurosci. 2011;31:13260–13271. doi: 10.1523/JNEUROSCI.3131-11.2011. [DOI] [PMC free article] [PubMed] [Google Scholar]
- 10.Hofer SB, et al. Differential connectivity and response dynamics of excitatory and inhibitory neurons in visual cortex. Nat Neurosci. 2011;14:1045–1052. doi: 10.1038/nn.2876. [DOI] [PMC free article] [PubMed] [Google Scholar]
- 11.Wickersham IR, et al. Monosynaptic restriction of transsynaptic tracing from single, genetically targeted neurons. Neuron. 2007;53:639–647. doi: 10.1016/j.neuron.2007.01.033. [DOI] [PMC free article] [PubMed] [Google Scholar]
- 12.Barlow HB, Levick WR. The mechanism of directionally selective units in the rabbit retina. Journal of Physiology. 1965;178:477–504. doi: 10.1113/jphysiol.1965.sp007638. [DOI] [PMC free article] [PubMed] [Google Scholar]
- 13.Fried SI, Munch TA, Werblin FS. Mechanisms and circuitry underlying directional selectivity in the retina. Nature. 2002;420:411–414. doi: 10.1038/nature01179. [DOI] [PubMed] [Google Scholar]
- 14.Briggman KL, Helmstaedter M, Denk W. Wiring specificity in the direction-selectivity circuit of the retina. Nature. 2011;471:183–188. doi: 10.1038/nature09818. [DOI] [PubMed] [Google Scholar]
- 15.Vaney DI, Sivyer B, Taylor WR. Direction selectivity in the retina: symmetry and asymmetry in structure and function. Nat Rev Neurosci. 2012;13:194–208. doi: 10.1038/nrn3165. [DOI] [PubMed] [Google Scholar]
- 16.Kim JS, et al. Space-time wiring specificity supports direction selectivity in the retina. Nature. 2014;509:331–336. doi: 10.1038/nature13240. [DOI] [PMC free article] [PubMed] [Google Scholar]
- 17.Alonso JM, Martinez LM. Functional connectivity between simple cells and complex cells in cat striate cortex. Nat Neurosci. 1998;1:395–403. doi: 10.1038/1609. [DOI] [PubMed] [Google Scholar]
- 18.Chen TW, et al. Ultrasensitive fluorescent proteins for imaging neuronal activity. Nature. 2013;499:295–300. doi: 10.1038/nature12354. [DOI] [PMC free article] [PubMed] [Google Scholar]
- 19.Priebe NJ. Mechanisms of Orientation Selectivity in the Primary Visual Cortex. Annu Rev Vis Sci. 2016;2:85–107. doi: 10.1146/annurev-vision-111815-114456. [DOI] [PubMed] [Google Scholar]
- 20.Isaacson JS, Scanziani M. How inhibition shapes cortical activity. Neuron. 2011;72:231–243. doi: 10.1016/j.neuron.2011.09.027. [DOI] [PMC free article] [PubMed] [Google Scholar]
- 21.Liu BH, et al. Broad inhibition sharpens orientation selectivity by expanding input dynamic range in mouse simple cells. Neuron. 2011;71:542–554. doi: 10.1016/j.neuron.2011.06.017. [DOI] [PMC free article] [PubMed] [Google Scholar]
- 22.Znamenskiy P, et al. Functional selectivity and specific connectivity of inhibitory neurons in primary visual cortex. biorRxiv. 2018 [Google Scholar]
- 23.Lee SH, et al. Activation of specific interneurons improves V1 feature selectivity and visual perception. Nature. 2012;488:379–383. doi: 10.1038/nature11312. [DOI] [PMC free article] [PubMed] [Google Scholar]
- 24.Atallah BV, Bruns W, Carandini M, Scanziani M. Parvalbumin-expressing interneurons linearly transform cortical responses to visual stimuli. Neuron. 2012;73:159–170. doi: 10.1016/j.neuron.2011.12.013. [DOI] [PMC free article] [PubMed] [Google Scholar]
- 25.Wilson NR, Runyan CA, Wang FL, Sur M. Division and subtraction by distinct cortical inhibitory networks in vivo. Nature. 2012;488:343–348. doi: 10.1038/nature11347. [DOI] [PMC free article] [PubMed] [Google Scholar]
- 26.Ma WP, et al. Visual representations by cortical somatostatin inhibitory neurons--selective but with weak and delayed responses. J Neurosci. 2010;30:14371–14379. doi: 10.1523/JNEUROSCI.3248-10.2010. [DOI] [PMC free article] [PubMed] [Google Scholar]
- 27.Monier C, Chavane F, Baudot P, Graham LJ, Fregnac Y. Orientation and direction selectivity of synaptic inputs in visual cortical neurons: a diversity of combinations produces spike tuning. Neuron. 2003;37:663–680. doi: 10.1016/s0896-6273(03)00064-3. [DOI] [PubMed] [Google Scholar]
- 28.Livingstone MS. Mechanisms of direction selectivity in macaque V1. Neuron. 1998;20:509–526. doi: 10.1016/s0896-6273(00)80991-5. [DOI] [PubMed] [Google Scholar]
- 29.Xu X, et al. Primary visual cortex shows laminar-specific and balanced circuit organization of excitatory and inhibitory synaptic connectivity. J Physiol. 2016;594:1891–1910. doi: 10.1113/JP271891. [DOI] [PMC free article] [PubMed] [Google Scholar]
- 30.Adesnik H, Scanziani M. Lateral competition for cortical space by layer-specific horizontal circuits. Nature. 2010;464:1155–1160. doi: 10.1038/nature08935. [DOI] [PMC free article] [PubMed] [Google Scholar]
- 31.Holmgren C, Harkany T, Svennenfors B, Zilberter Y. Pyramidal cell communication within local networks in layer 2/3 of rat neocortex. J Physiol. 2003;551:139–153. doi: 10.1113/jphysiol.2003.044784. [DOI] [PMC free article] [PubMed] [Google Scholar]
- 32.Sun W, Tan Z, Mensh BD, Ji N. Thalamus provides layer 4 of primary visual cortex with orientation-and direction-tuned inputs. Nat Neurosci. 2016;19:308–315. doi: 10.1038/nn.4196. [DOI] [PMC free article] [PubMed] [Google Scholar]
- 33.Ringach DL, et al. Spatial clustering of tuning in mouse primary visual cortex. Nat Commun. 2016;7 doi: 10.1038/ncomms12270. 12270. [DOI] [PMC free article] [PubMed] [Google Scholar]
- 34.Marques T, Nguyen J, Fioreze G, Petreanu L. The functional organization of cortical feedback inputs to primary visual cortex. Nat Neurosci. 2018;21:757–764. doi: 10.1038/s41593-018-0135-z. [DOI] [PubMed] [Google Scholar]
- 35.Bonin V, Histed MH, Yurgenson S, Reid RC. Local diversity and fine-scale organization of receptive fields in mouse visual cortex. J Neurosci. 2011;31:18506–18521. doi: 10.1523/JNEUROSCI.2974-11.2011. [DOI] [PMC free article] [PubMed] [Google Scholar]
- 36.Garrett ME, Nauhaus I, Marshel JH, Callaway EM. Topography and areal organization of mouse visual cortex. J Neurosci. 2014;34:12587–12600. doi: 10.1523/JNEUROSCI.1124-14.2014. [DOI] [PMC free article] [PubMed] [Google Scholar]
- 37.Haider B, Hausser M, Carandini M. Inhibition dominates sensory responses in the awake cortex. Nature. 2013;493:97–100. doi: 10.1038/nature11665. [DOI] [PMC free article] [PubMed] [Google Scholar]
- 38.Liu BH, et al. Intervening inhibition underlies simple-cell receptive field structure in visual cortex. Nat Neurosci. 2010;13:89–96. doi: 10.1038/nn.2443. [DOI] [PMC free article] [PubMed] [Google Scholar]
- 39.Li YT, Liu BH, Chou XL, Zhang LI, Tao HW. Strengthening of Direction Selectivity by Broadly Tuned and Spatiotemporally Slightly Offset Inhibition in Mouse Visual Cortex. Cereb Cortex. 2015;25:2466–2477. doi: 10.1093/cercor/bhu049. [DOI] [PMC free article] [PubMed] [Google Scholar]
- 40.Lien AD, Scanziani M. Tuned thalamic excitation is amplified by visual cortical circuits. Nat Neurosci. 2013;16:1315–1323. doi: 10.1038/nn.3488. [DOI] [PMC free article] [PubMed] [Google Scholar]
- 41.Li YT, Ibrahim LA, Liu BH, Zhang LI, Tao HW. Linear transformation of thalamocortical input by intracortical excitation. Nat Neurosci. 2013;16:1324–1330. doi: 10.1038/nn.3494. [DOI] [PMC free article] [PubMed] [Google Scholar]
- 42.Lien AD, Scanziani M. Cortical direction selectivity emerges at convergence of thalamic synapses. Nature. 2018;558:80–86. doi: 10.1038/s41586-018-0148-5. [DOI] [PubMed] [Google Scholar]
- 43.Hillier D, et al. Causal evidence for retina-dependent and -independent visual motion computations in mouse cortex. Nat Neurosci. 2017;20:960–968. doi: 10.1038/nn.4566. [DOI] [PMC free article] [PubMed] [Google Scholar]
- 44.Thiele A, Distler C, Korbmacher H, Hoffmann KP. Contribution of inhibitory mechanisms to direction selectivity and response normalization in macaque middle temporal area. Proceedings of the National Academy of Sciences of the United States of America; 2004. pp. 9810–9815. [DOI] [PMC free article] [PubMed] [Google Scholar]
- 45.Gorski JA, et al. Cortical excitatory neurons and glia, but not GABAergic neurons, are produced in the Emx1-expressing lineage. J Neurosci. 2002;22:6309–6314. doi: 10.1523/JNEUROSCI.22-15-06309.2002. [DOI] [PMC free article] [PubMed] [Google Scholar]
- 46.Mayford M, et al. Control of memory formation through regulated expression of a CaMKII transgene. Science. 1996;274:1678–1683. doi: 10.1126/science.274.5293.1678. [DOI] [PubMed] [Google Scholar]
- 47.Wekselblatt JB, Flister ED, Piscopo DM, Niell CM. Large-scale imaging of cortical dynamics during sensory perception and behavior. J Neurophysiol. 2016;115:2852–2866. doi: 10.1152/jn.01056.2015. [DOI] [PMC free article] [PubMed] [Google Scholar]
- 48.Peron SP, Freeman J, Iyer V, Guo C, Svoboda K. A Cellular Resolution Map of Barrel Cortex Activity during Tactile Behavior. Neuron. 2015;86:783–799. doi: 10.1016/j.neuron.2015.03.027. [DOI] [PubMed] [Google Scholar]
- 49.Wickersham IR, Finke S, Conzelmann KK, Callaway EM. Retrograde neuronal tracing with a deletion-mutant rabies virus. Nat Methods. 2007;4:47–49. doi: 10.1038/NMETH999. [DOI] [PMC free article] [PubMed] [Google Scholar]
- 50.Marshel JH, Mori T, Nielsen KJ, Callaway EM. Targeting single neuronal networks for gene expression and cell labeling in vivo. Neuron. 2010;67:562–574. doi: 10.1016/j.neuron.2010.08.001. [DOI] [PMC free article] [PubMed] [Google Scholar]
- 51.Rancz EA, et al. Transfection via whole-cell recording in vivo: bridging single-cell physiology, genetics and connectomics. Nat Neurosci. 2011;14:527–532. doi: 10.1038/nn.2765. [DOI] [PMC free article] [PubMed] [Google Scholar]
- 52.Osakada F, et al. New rabies virus variants for monitoring and manipulating activity and gene expression in defined neural circuits. Neuron. 2011;71:617–631. doi: 10.1016/j.neuron.2011.07.005. [DOI] [PMC free article] [PubMed] [Google Scholar]
- 53.Goldey GJ, et al. Removable cranial windows for long-term imaging in awake mice. Nat Protoc. 2014;9:2515–2538. doi: 10.1038/nprot.2014.165. [DOI] [PMC free article] [PubMed] [Google Scholar]
- 54.Judkewitz B, Rizzi M, Kitamura K, Hausser M. Targeted single-cell electroporation of mammalian neurons in vivo. Nat Protoc. 2009;4:862–869. doi: 10.1038/nprot.2009.56. [DOI] [PubMed] [Google Scholar]
- 55.Kitamura K, Judkewitz B, Kano M, Denk W, Hausser M. Targeted patch-clamp recordings and single-cell electroporation of unlabeled neurons in vivo. Nat Methods. 2008;5:61–67. doi: 10.1038/nmeth1150. [DOI] [PubMed] [Google Scholar]
- 56.Pologruto TA, Sabatini BL, Svoboda K. ScanImage: flexible software for operating laser scanning microscopes. Biomed Eng Online. 2003;2:13. doi: 10.1186/1475-925X-2-13. [DOI] [PMC free article] [PubMed] [Google Scholar]
- 57.Kim EJ, Jacobs MW, Ito-Cole T, Callaway EM. Improved Monosynaptic Neural Circuit Tracing Using Engineered Rabies Virus Glycoproteins. Cell Rep. 2016;15:692–699. doi: 10.1016/j.celrep.2016.03.067. [DOI] [PMC free article] [PubMed] [Google Scholar]
- 58.Drobizhev M, Makarov NS, Tillo SE, Hughes TE, Rebane A. Two-photon absorption properties of fluorescent proteins. Nat Methods. 2011;8:393–399. doi: 10.1038/nmeth.1596. [DOI] [PMC free article] [PubMed] [Google Scholar]
- 59.Brondi M, Sato SS, Rossi LF, Ferrara S, Ratto GM. Finding a Needle in a Haystack: Identification of EGFP Tagged Neurons during Calcium Imaging by Means of Two-Photon Spectral Separation. Front Mol Neurosci. 2012;5:96. doi: 10.3389/fnmol.2012.00096. [DOI] [PMC free article] [PubMed] [Google Scholar]
- 60.Kleiner M, Brainard D, Pelli D. What’s new in Psychtoolbox-3. Perception. 2007;36:1. [Google Scholar]
- 61.Burgess CP, et al. High-Yield Methods for Accurate Two-Alternative Visual Psychophysics in Head-Fixed Mice. Cell Rep. 2017;20:2513–2524. doi: 10.1016/j.celrep.2017.08.047. [DOI] [PMC free article] [PubMed] [Google Scholar]
- 62.Pachitariu M, et al. Suite2p beyond 10,000 neurons with standard two-photon microscopy. biorXiv. 2016 [Google Scholar]
- 63.Dipoppa M, et al. Vision and Locomotion Shape the Interactions between Neuron Types in Mouse Visual Cortex. Neuron. 2018;98:602–615. doi: 10.1016/j.neuron.2018.03.037. e608. [DOI] [PMC free article] [PubMed] [Google Scholar]
- 64.Berens P. CircStat: A MATLAB Toolbox for Circular Statistics. J Stat Softw. 2009;31:1–21. [Google Scholar]
Associated Data
This section collects any data citations, data availability statements, or supplementary materials included in this article.
Data Availability Statement
Source data for the figures are deposited at: https://github.com/lfedros/Rossi-et-al-2020
Other data will be available from the authors upon reasonable request.
Code used in this study are deposited at: https://github.com/lfedros/Rossi-et-al-2020


