Abstract
Infection by enveloped viruses involves fusion of their lipid envelopes with cellular membranes to release the viral genome into cells. For HIV, Ebola, influenza and numerous other viruses, envelope glycoproteins bind the infecting virion to cell-surface receptors and mediate membrane fusion. In the case of influenza, the receptor-binding glycoprotein is the haemagglutinin (HA), and following receptor-mediated uptake of the bound virus by endocytosis1, it is the HA that mediates fusion of the virus envelope with the membrane of the endosome2. Each subunit of the trimeric HA consists of two disulfide-linked polypeptides, HA1 and HA2. The larger, virus-membrane-distal, HA1 mediates receptor binding; the smaller, membrane-proximal, HA2 anchors HA in the envelope and contains the fusion peptide, a region that is directly involved in membrane interaction3. The low pH of endosomes activates fusion by facilitating irreversible conformational changes in the glycoprotein. The structures of the initial HA at neutral pH and the final HA at fusion pH have been investigated by electron microscopy4,5 and X-ray crystallography6–8. Here, to further study the process of fusion, we incubate HA for different times at pH 5.0 and directly image structural changes using single-particle cryo-electron microscopy. We describe three distinct, previously undescribed forms of HA, most notably a 150 Å-long triple-helical coil of HA2, which may bridge between the viral and endosomal membranes. Comparison of these structures reveals concerted conformational rearrangements through which the HA mediates membrane fusion.
We have used single-particle cryo-electron microscopy (cryo-EM) of the HA ectodomain to obtain structural information on the transitions between HAs at neutral pH and fusion pH. Specifically, we have examined the structures formed on incubation of HA at pH 5.0 and 4 °C as a function of time, using incubation times of 10 s, 20 s, 60 s and 30 min. We have characterized three structural intermediates that have been trapped through rapid freezing (by plunging grids into liquid ethane).
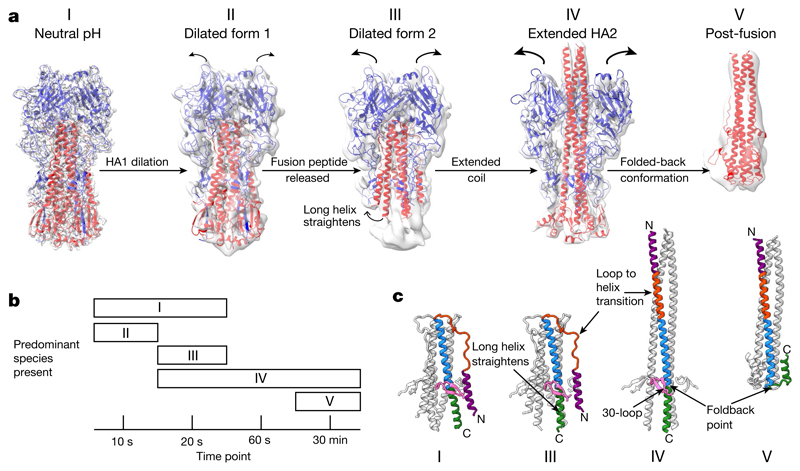
For each incubation time we image and classify a number of different conformations of HA (Fig. 1). The ratio of these species changes during the time course (Fig. 1b). We are able to describe three distinct, previously undescribed forms of HA (states II, III and IV) in addition to the neutral-pH (state I) and fusion-pH (state V) structures6, 7 (Fig. 1). We interpret the new forms as sequential intermediate states between the two previously known conformations. At the earliest sampling time of 10 s, we observe dilated HA structures in which the envelope-distal domains tilt away from the axis of the HA trimer and the membrane-proximal domain is disordered (state II). At 20 s another population is more evident, in which the membrane-distal domain is more dilated and the membrane-proximal region shows disorder and rearrangement (state III). At 20 s and 60 s we observe, increasingly, the most notable of the structural changes: a 150 Å-long α-helical coil projecting between the dilated membrane-distal domains (state IV).
Fig. 1. HA fusion intermediates.
a, Cryo-EM reconstructions of HA at fusion pH from various time points after acidification. Cryo-EM maps are shown (grey) with models of HA1 (blue) and HA2 (red). Structures for states I (indistinguishable from the neutral-pH state), III and IV are from 20 s, and for state II from 10 s. State V was obtained with a 30-min incubation, supplemented with 2-mercaptoethanol, dissociating the disulfide-linked HA1. The state V model shown is the previously determined crystal structure of fusion-pH HA2 (Protein Data Bank (PDB, https://www.ebi.ac.uk/pdbe/) code 1HTM; ref. 7). b, Distribution of different species at chosen time points. c, Rearrangements in HA2 residues 38–125 associated with conformational states I, III, IV and V. The 30-loop (HA1 residues 22–37) is in pink; HA2 is coloured by residue number: purple, 38–55; orange, 56–75; blue, 76–105; green, 106–125.
Dilation of the membrane-distal domains
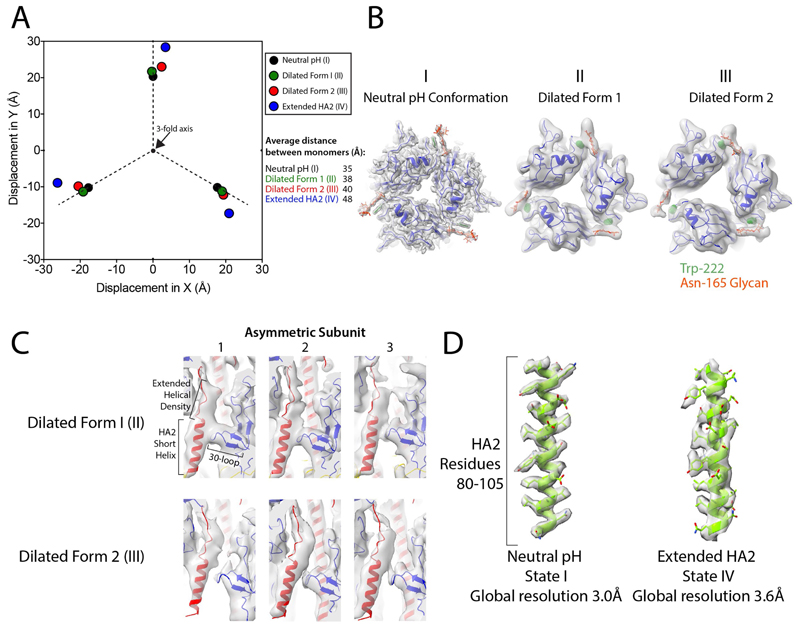
In state II, the globular HA1 domain rotates and alters the interactions between the subunits of the trimer (Fig. 2a). The rotation is small, increasing the distance between centroids of the domains to 38 Å, from 35 Å in the neutral-pH form (Extended Data Fig. 1a).
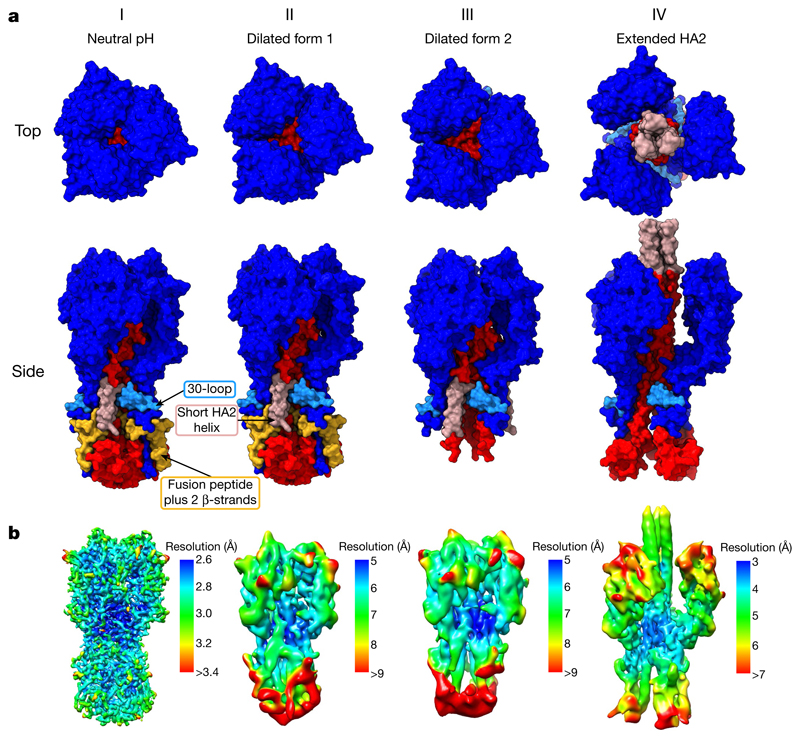
Fig. 2. Surface representations of HA fusion intermediates.
a, Molecular surfaces for states I–IV. HA1 is coloured in dark blue and the 30-loop (residues 22–37) in light blue. HA2 is in red, with residues 1–37 (containing the fusion peptide, residues 1–23) in yellow and the short helix (residues 38–55) in pink. Top views of surfaces show the increasing dilation of the membrane-distal domains. Side views show several features. Between states II and III, the fusion peptide and attached two β-strands are absent while the base of the protein becomes disordered. Between states III and IV, the 150 Å coiled-coil forms between the dilated HA1 domains. The base of HA2 has also opened up in state IV compared with state I. b, Cryo-EM maps, coloured by local-resolution estimations (contour bars are state-specific).
The requirement for these domains to separate for membrane fusion was previously concluded from experiments in which the low-pH-dependent conformational change was blocked by crosslinking the domains, either by introducing disulfide bonds9 or by antibody binding10. There are also reports of similar subunit dissociation in antigenic analyses of HAs at neutral pH, as judged by accessibility of the intersubunit interface to specific antibodies11,12. In our experiments, which were done at 4 °C, domain dilation was seen only at pH 5.0 and not in a parallel experiment at pH 8.0.
In state II and the other states, the membrane-distal parts of the dilated domains (HA1 residues 45–310) as monomers are indistinguishable from the equivalent regions of the neutral-pH form. The stability of this domain in isolation is consistent with X-ray crystallographic observations of the membrane-distal domain isolated from HA in the fusion-pH conformation13. As well as the rearrangements in the HA1 membrane-distal domain, there is also an indication of disorder in the membrane-proximal regions of HA, as shown by local-resolution estimates (Fig. 2b and Extended Data Fig. 2). There is, however, little evidence of large structural rearrangements.
State III shows further dilation of the membrane-distal domain (Fig. 2a) and a substantial rearrangement in the membrane-proximal region of HA2. The further dilation increases the average distance between centroids of the domain to 40 Å from 38 Å in state II (Extended Data Fig. 1a). Both states II and III appear to retain an interaction between the H3 subtype-specific N-linked glycan at Asn165 and Trp222 (Extended Data Fig. 1b).
The membrane-proximal regions of this state are disordered, as indicated by the low local resolution (Fig. 2b), which involves a loss of density for the fusion peptide (residues 1–23) and for the two attached membrane-proximal β-strands (residues 24–38). The shorter α-helix of HA2 (residues 38–59) remains intact, but is displaced towards a neighbouring longer α-helix. The loss of density for the fusion peptide is accompanied by a rearrangement of the carboxy (C) terminus of the long α-helix of HA2, in which residues 100–125 straighten into the space previously occupied by the fusion peptide (similar to state IV, Fig. 3a). States II and III both have an extension of density at the C terminus of the shorter α-helix of HA2, indicating elongation of the α-helix by inclusion of residues from the interhelical loop (Extended Data Fig. 1c).
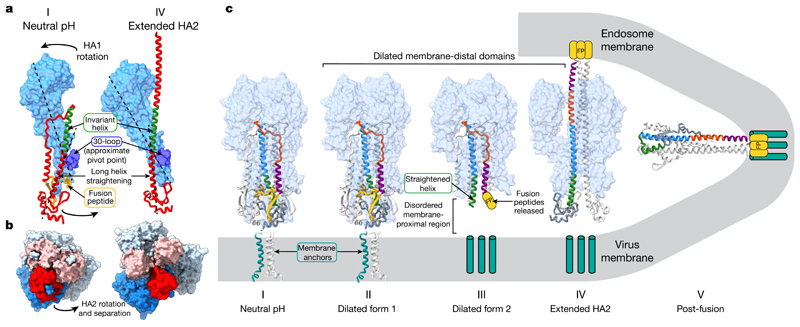
Fig. 3. Structural rearrangements of HA fusion intermediates.
a, Concerted rearrangements of HA1 and HA2 between states I and IV. HA1 is shown as a molecular surface in light blue, with the 30-loop in dark blue. HA2 is shown as a red ribbon with the invariant helix in green. The fusion peptide in state I is coloured yellow, but not ordered in state IV. Dotted lines show the trajectory of the membrane-proximal region of the extended helix in one case and the approximate long axis of HA1 in the other. HA1 rotates as a rigid body as the long helix of HA2 straightens relative to state I. This concerted motion is transmitted by the attachment of HA1 to HA2 via the 30-loop, which is the approximate pivot point of the HA1 rotation. The HA2 helix straightens into the space previously occupied by the now-displaced fusion peptide. b, Orthogonal view to a; membrane-proximal regions of HA2 open upon this concerted motion, transitioning from a closely packed neutral-pH conformation (state I) to the opened extended HA2 form (state IV). Images are molecular surfaces, with the monomers coloured as in a. c, Diagram showing HA membrane-fusion intermediates. HA1 is shown as a molecular surface with HA2 as a ribbon. One HA2 monomer is coloured by sequence: yellow, residues 1–37; purple, 38–55; orange, 56–75; blue, 76–105; green, 106–125; grey, 125–175. The location of the fusion peptide, not resolved in states III–V, is shown schematically (yellow). Membrane anchors (cyan), not present in the protein used here, are represented as blocks in the virus and endosome membranes in states III and IV. For states I and II the membrane anchor is that of another HA subtype, H1 (ref. 22). State IV is depicted as interacting with the virus membrane (via membrane anchors) and the endosomal membrane (via the fusion peptide) before refolding to state V, where the fusion peptide and membrane anchors are shown as colocated.
Extended coil conformation
State IV contains a 150 Å trimeric coil formed from a single continuous helix of residues 38–125 of HA2, which includes the short α-helix, the interhelical loop and the long α-helix of HA2 present in the neutral-pH structure (Fig. 1c). States I–IV share the common section of HA2 (residues 76–98), which forms a coiled-coil, extended in state IV from its amino (N) terminus by the interhelical loop (residues 59–75) and the shorter α-helix (residues 38–58) of HA2. The C-terminal region of the coil is formed by the remainder of the long central α-helix (residues 99–125). The coil projects between the membrane-distal domains (Figs. 1, 2), which are dilated further, creating additional space around the trimer axis and increasing the displacement between the membrane-distal domains to 48 Å, from 40 Å in state III (Extended Data Fig. 1a).
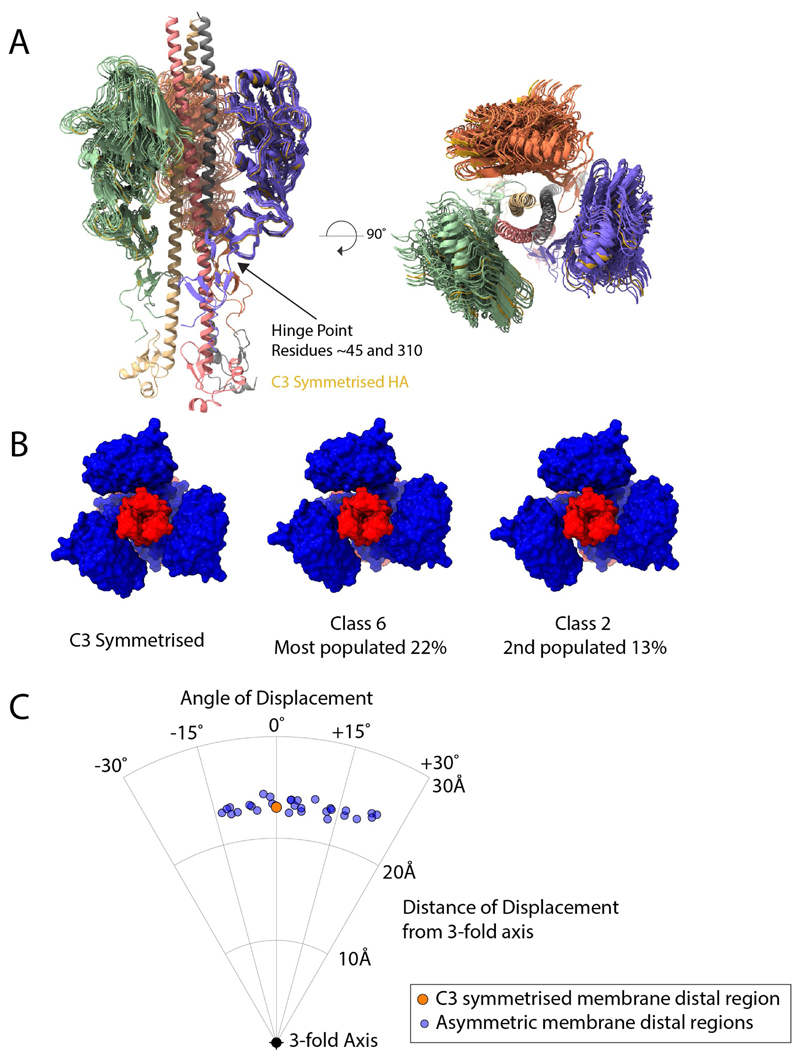
The membrane-distal domains in state IV exhibit lower local resolution (Fig. 2b), indicating structural heterogeneity, which we examined using asymmetric classifications (Extended Data Fig. 3). We obtained the state IV structure by applying threefold symmetry. The heterogeneity in the positions of these domains limits the global resolution to 4.0 Å and this can be improved to 3.6 Å, with some anisotropy, by subtracting membrane-distal regions from the particles.
HA2 residues 1–37–which include the fusion peptide and two strands of the five-stranded membrane-proximal β-sheet–are not detected in state IV, presumably indicating disorder with respect to the symmetric coiled-coil. The structure of the coiled-coil component of the 150 Å helix (residues 38–106) is very similar to those of the coiled-coils reported for the 110 Å structure of the HA-derived fusion-pH fragment7 and the fusion-pH conformation of Escherichia coli-expressed HA2 (ref. 8) determined by X-ray crystallography. They all extend to residue 38, which is a component of the helical cap structure in the E. coli-expressed molecule.
The formation of the extended structure described here is a reflection of the propensity of the residues involved to adopt a helical conformation. A similar proposal was made for a 150 Å α-helical coil in neutral-pH HA on the basis of the amino-acid sequence of HA2 (ref. 14), and for fusion-pH HA from studies of synthetic peptides15. Both predictions were made before the crystal structures revealed that the relevant forms adopt hairpin structures. The extended intermediate described here indicates the stability of such a helical structure before hairpin formation occurs. It is also consistent with cryotomography showing influenza virus HA interacting with target liposomes at low pH16.
The rearrangement of the remaining C-terminal regions of HA2 (residues 126–169) opens the structure by an outward rigid body rotation that accompanies the straightening of the coil (Fig. 3b). However, the density for this region is poorly defined (Fig. 2b), indicating a higher degree of mobility of the domains, as they lose the trimeric contacts observed at neutral pH.
The 30-loop
Insights into the concerted nature of HA1 and HA2 rearrangements are revealed by the structure and function of the 30-loop (HA1 residues 22–37). States I, II, III and IV all retain density for this loop, which is inserted in the region of residues 104–107 of HA2, in the long central α-helices, about 50 Å from the virus membrane (Fig. 1c).
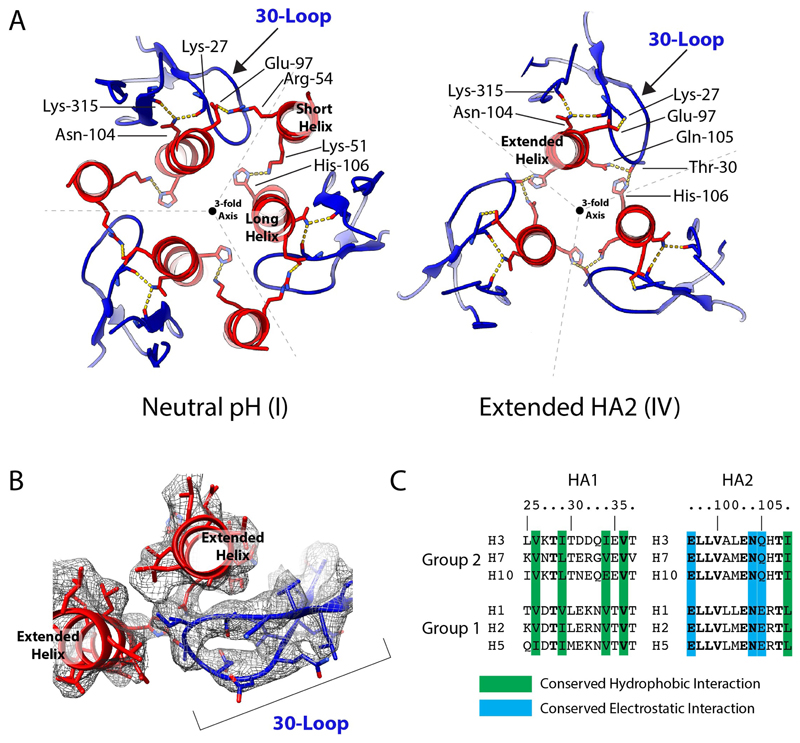
The location of the interaction of the 30-loop with the long helix of HA2 is similar in states I and IV. There are, however, several changes in the side chains contacted in state IV that are associated with the relocation of the short helix of HA2. In this state, the 30-loop makes interactions with His106 and Gln105 at the site of the 180° turn in the fusion-pH structure (Extended Data Fig. 4).
There are probably two roles for the 30-loop in the refolding process. First, it may couple changes in the orientation of the membrane-distal domains with helical rearrangements in the membrane-proximal domain. The interactions of this loop with HA2 occur at the approximate pivot point of HA1, and connect the dilation of the membrane-distal domains with the straightening of the HA2 helix that accompanies fusion-peptide release in states III and IV. Second, the 30-loop is positioned to stabilize the extended coil in state IV. The high conservation and importance of these interactions for membrane fusion has been noted in studies of mutant HAs that differ in their stability17–20, but, until now, without any obvious mechanism (Extended Data Fig. 4).
Concerted structural changes for fusion
This cryo-EM study and earlier X-ray crystallographic analyses7,8 indicate that the N-terminal part of HA2, up to residue 38, is flexible. Structure has been assigned to an analogue of the fusion peptide (residues 1–23) by nuclear magnetic resonance (NMR) spectroscopy21. Taken together, these results imply a flexibility of the region linking the α-helical coil to the fusion peptide (residues 24–37) that may be a requirement for the formation of the fusion-pH structure. We came to a similar conclusion from our previous cryo-EM analysis22 of a flexible region that links the membrane-anchor α-helices of neutral-pH, full-length HA to its ectodomain. The flexibility in these N- and C-terminal regions of HA2 would seem to be a requirement for accommodating the large-scale structural rearrangements and the close approach of the two membranes before fusion (Fig. 3c).
Our analysis of different states in the refolding of HA2 at fusion pH suggests staged, concerted changes of HA in its membrane-proximal and membrane-distal regions. The coincidence of these domain rearrangements also suggests that they are relayed throughout the length of the molecule to result in extrusion of the fusion peptide at the terminus of the α-helical coil through the dilated membrane-distal domain, locating the N and C termini of HA2 in opposing membranes. Residues 38–106 in the extended coil are identical to the fusion-pH structures previously obtained, suggesting that the coiled-coil serves as a scaffold for the subsequent refolding of the C-terminal regions to colocate the fusion-peptide and membrane-anchor domains in the same membrane (Fig. 3c).
In describing the three previously unknown structures involved in HA refolding, we have also identified potential functions in membrane fusion for the conserved loop formed by residues 22–37 of HA1, the 30-loop. This loop acts to stabilize the extended coil and delay reversal of the coil through the 180° turn, for which displacement of the 30-loop is necessary. This could enable effective interaction of the fusion peptide with the endosomal membrane, before the membrane-anchor region and the fusion peptide become positioned together at one end of the fusion-pH structure and in fused membranes (Fig. 3c). As a consequence, the interactions made by the 30-loop may be required for the controlled delivery of the membrane anchor and the virus membrane to the site of fusion.
Online content
Any methods, additional references, Nature Research reporting summaries, source data, extended data, supplementary information, acknowledgements, peer review information; details of author contributions and competing interests; and statements of data and code availability are available at https://doi.org/10.1038/s41586-020-2333-6.
Methods
No statistical methods were used to predetermine sample size. The experiments were not randomized and the investigators were not blinded to allocation during experiments and outcome assessment.
Protein preparation
The HA ectodomain was isolated from purified X-31(H3N2) virus, which contains the HA from A/Aichi/1/68. Virus was propagated in 11- to 12-day-old hens’ eggs and incubated for 48 h. Virus was purified from allantoic fluid by sucrose gradient centrifugation. HA ectodomain was released from the virus by detergent extraction with 2% (w/v) octyl-β-glucoside, followed by overnight digestion at room temperature with 5% (w/w) trypsin, which produces a fragment with the membrane anchor removed (HA1, and HA2 residues 1–174). Protein was further purified by anion-exchange chromatography and size-exclusion chromatography (SDS–PAGE shown in Extended Data Fig. 5). The final protein buffer was 25 mM Tris pH 8.0, 150 mM NaCl.
Cryo-EM sample preparation and data collection
Low-pH-induced conformations of HA were obtained by mixing with low-pH buffer followed by an incubation at 4 °C and plunge freezing. We mixed 2.5 mg ml-1 HA 1:1 with 0.1 M citrate pH 4.9 plus 0.1% octyl-β-glucoside, which gave a final pH of 5.0. Octyl-β-glucoside was added to reduce orientational bias, as used previously22. The mixture was rapidly applied to a grid equilibrated to 4 °C in 100% humidity for a set time period to obtain pH incubation times of 10 s, 20 s and 60 s. The 30-min time point was prepared by mixing HA with the low-pH buffer as above, supplemented with 10 mM 2-mercaptoethanol, followed by a 30-min incubation on ice. Specimens of HA at pH 8.0 were prepared by plunge freezing HA at 2.5 mg ml-1 concentration supplemented with 0.1% octyl-β-glucoside. All samples were prepared by applying 4 μl of sample to an R2/2 300 mesh Quantifoil grid, followed by a 4–4.5 s blot using a Vitrobot MkIII, plunge freezing into liquid ethane.
Data were collected using a Titan Krios microscope operating at 300 kV. Micrographs were collected using a Falcon 3 detector in electron-counting mode. Exposures were 60 s with a total dose of 33.9 e Å-2, fractionated into 30 frames, with a calibrated pixel size of 1.09 Å. Images were collected using a defocus of 1.5–3 μm.
Data processing
Movie frames were aligned using MotionCor2 (ref. 23) and contrast transfer function was fitted using CTFFIND4 (ref. 24). All data processing was carried out using both RELION25 and cryoSPARC26. Particles were picked using crYOLO27 by training models on manually picked micrographs. Data-processing workflows for each time point are shown in Extended Data Figs. 6–9.
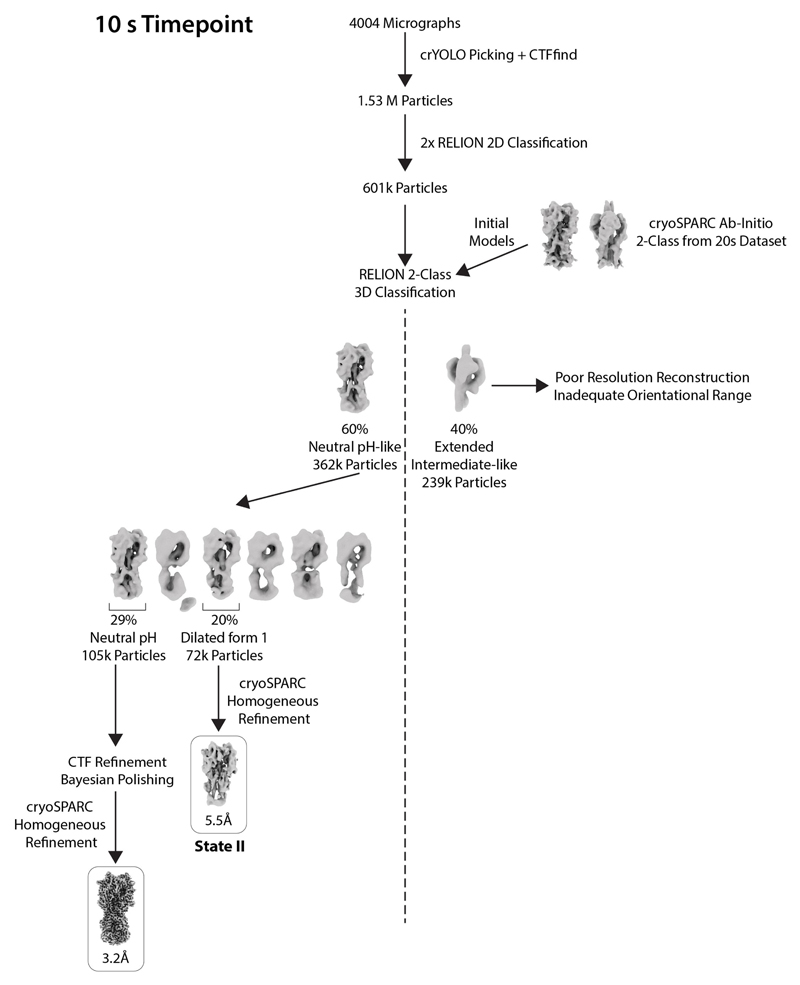
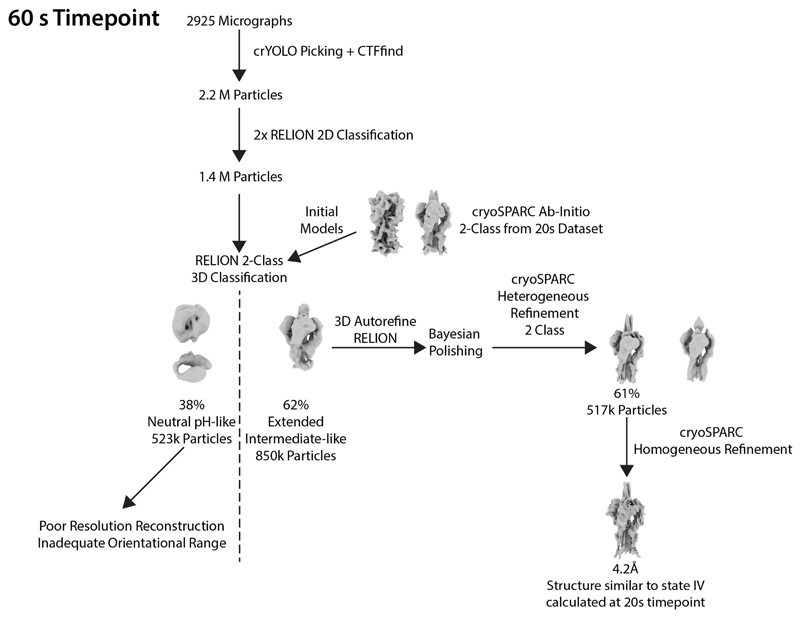
For 10 s, 20 s and 60 s time points, particles were subjected to two rounds of Relion two-dimensional (2D) classification, retaining classes that exhibited clear secondary-structure features (representative classes are shown in Extended Data Fig. 5). Initial models were generated using a cryoSPARC ab initio reconstruction initiated with two classes for the 20 s data. This generated models for the neutral-pH-like and extended-intermediate-like conformations. These two maps were used as initial models for a two-class Relion three-dimensional (3D) classification to sort particles into neutral-pH-like and extended-intermediate-like classes for each of the time points.
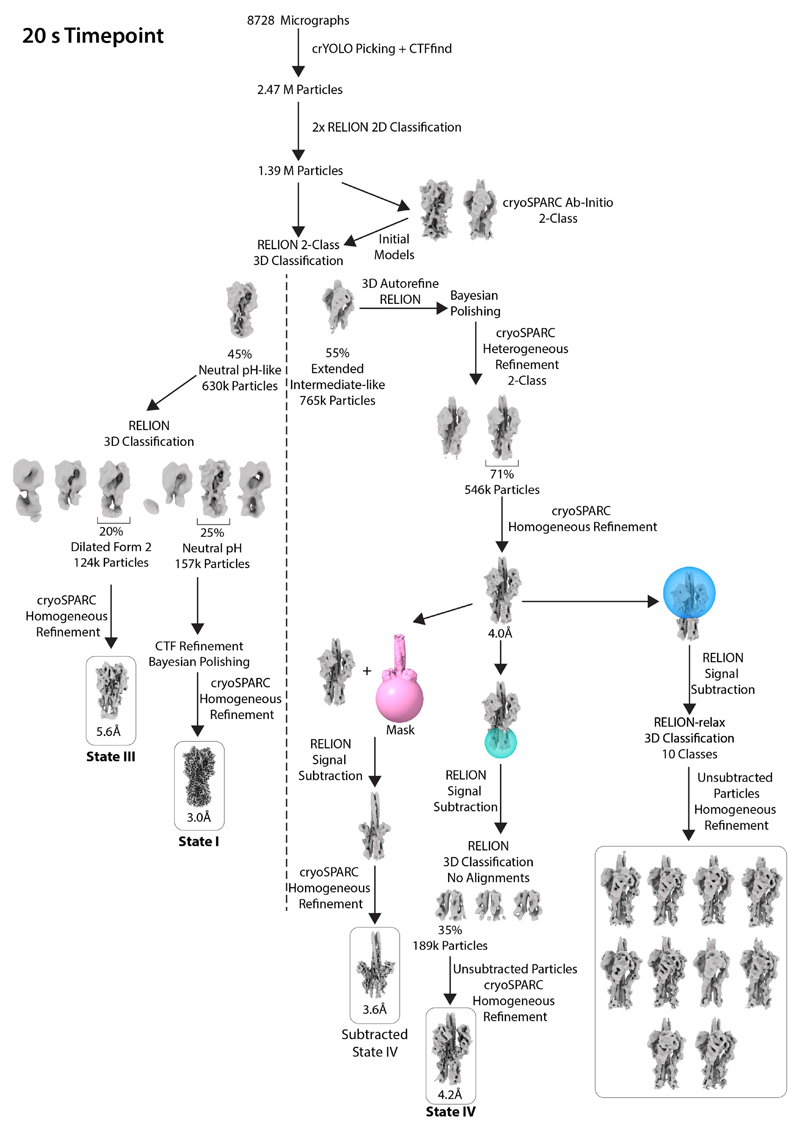
For the 20 s data set, the neutral pH-like conformation particles were further separated using RELION 3D classification, which generated a single class of neutral-pH HA and another of the dilated form 2. The 124,000 particles that made up the dilated form 2 were refined using cryoSPARC, yielding a map at 5.6 Å resolution (state III). There were 157,000 particles that made up the neutral-pH conformation. For these particles, we carried out CTF refinement and Bayesian polishing28,29 using RELION. These particles were then refined using cryoSPARC to obtain a map at 3.0 Å resolution (state I).
The intermediate-like particles were first classified using a two-class heterogeneous refinement in cryoSPARC to separate out a class with a stronger membrane-proximal region of 546,000 particles. These particles were then refined in RELION and Bayesian polishing was carried out. Particles were then refined using cryoSPARC imposing C3 symmetry, generating a map at 4.0 Å resolution. Particle subtraction was carried out using RELION to remove the membrane-distal parts of HA1. Subtracted particles were refined using cryoSPARC, imposing C3 symmetry. This generated a map with a global resolution of 3.6 Å (subtracted state IV). In order to further improve the membrane-proximal density of the extended-intermediate particles, particle subtraction was carried out to leave only the density of this region. A three-class 3D classification without alignments was carried out, which generated a class of 189,000 particles with a stronger membrane-proximal density. The unsubtracted particles were then refined using cryoSPARC homogeneous refinement imposing C3 symmetry to generate a map with a global resolution of 4.2 Å (state IV).
To examine the flexibility of the HA1 regions of extended-intermediate particles, which had been refined imposing C3 symmetry, signal subtraction was carried out to remove membrane-proximal regions. These particles were then classified into ten classes with a 3D classification using RELION-relax30, allowing asymmetric classification with C3 symmetry priors with a limited angular search range. The original unsubtracted particles from each class were then refined asymmetrically using cryoSPARC homogeneous refinement.
For the 10 s data, the neutral-pH-like particles were further separated using RELION 3D classification, yielding a single class, which resembled the neutral-pH form of HA (105,000 particles) and another which made up the dilated form 1 (72,000 particles). These dilated form 1 particles were refined using cryoSPARC to obtain a map at 5.5 Å resolution (state II).
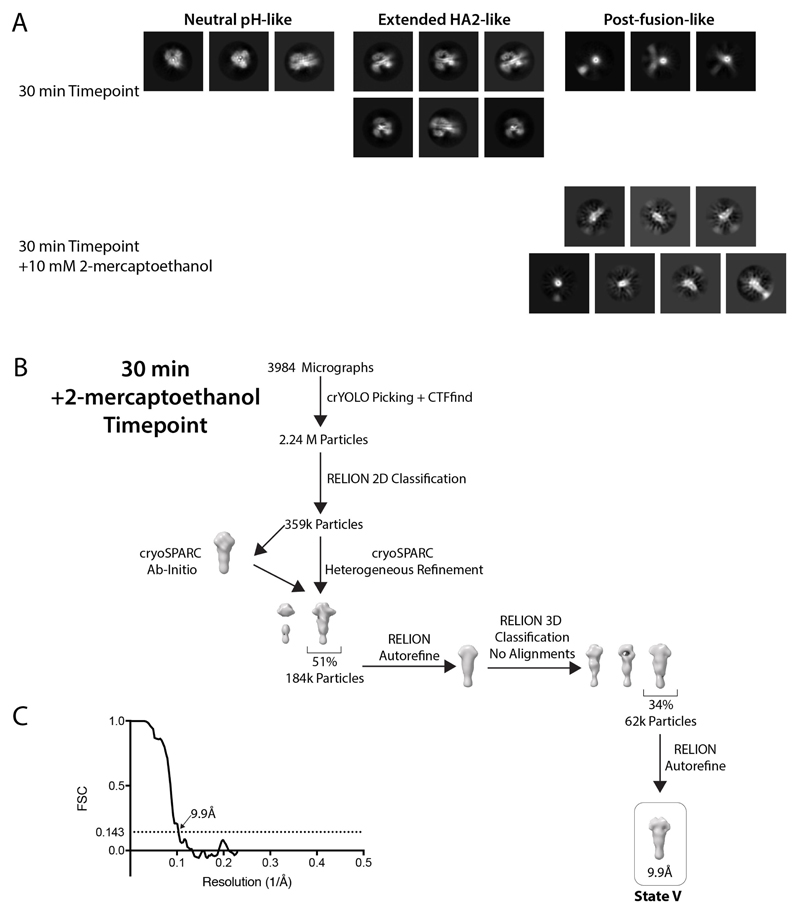
Particles from the 30-min plus 2-mercaptoethanol time point were picked, using crYOLO, generating 2.24 million particles. 2D classification was carried out using RELION. Classes with particles that resembled the post-fusion form of HA were selected (359,000) and subjected to a two-class cryoSPARC heterogeneous refinement using an initial model generated using the cryoSPARC ab inito reconstruction. The best class of 184,000 particles was refined using RELION, imposing C3 symmetry. The refined particles were classified using a 3D classification without particle alignments. The best class (of 62,000 particles) was chosen and refined using RELION, imposing C3 symmetry, generating a map at 9.9 Å resolution. We do not characterize other structural intermediates, other than the states listed above, possibly because of their low population or heterogeneity.
For the neutral-pH HA condition, data were collected at pH 8.0; 2,819 micrographs yielded 643,000 particles. After two rounds of 2D classification, 320,000 particles remained. These were 3D classified with RELION. The most-populated class of 237,000 particles had CTF refinement and Bayesian polishing carried out using RELION. The particles were further 3D classified without alignment, following refinement, which gave the most-populated class of 200,000 particles. These particles were refined using cryoSPARC to give a final map with a global resolution of 3.0 Å, which was indistinguishable from the neutral-pH-like structure obtained at pH 5.0 (state I).
Model building
Before model building, we determined the local resolution of maps using blocres31 implemented in cryoSPARC. Maps were automatically sharpened32 and locally filtered using cryoSPARC. Models were built using parts of previously determined structures of X-31 HA (PDB identification code 2YPG)33 and the post-fusion conformation from E. coli-expressed HA2 (1QU1)8. Models were manually adjusted using COOT34, with real-space refinement and validation carried out using PHENIX35. Measurements of domain displacement and figures were made using Chimera36.
Reporting summary
Further information on research design is available in the Nature Research Reporting Summary linked to this paper.
Extended Data
Extended Data Fig. 1. Features of intermediate states.
a, Displacement measurements between dilated HA1 domains. Measurements are the position of the centroid of HA1 residues 45–310, with structures aligned on the invariant parts of HA2 (residues 76–98). b, An interaction can be seen between the glycan attached to Asn165 (orange) and Trp222 (green) on the neighbouring HA1 monomer (blue), crosslinking the HA1 domains. This is present in states I, II and III. c, Cryo-EM density (grey) and model, with HA1 in blue and HA2 in red, for the short helix of HA2 (residues 38–55) and the 30-loop (HA1 residues 22–37). Density extends beyond the top of the helix, indicating elongation of this helix by residues from the interhelical loop. d, Example of typical density (grey) for the same section of an HA2 helix from states I and IV (green).
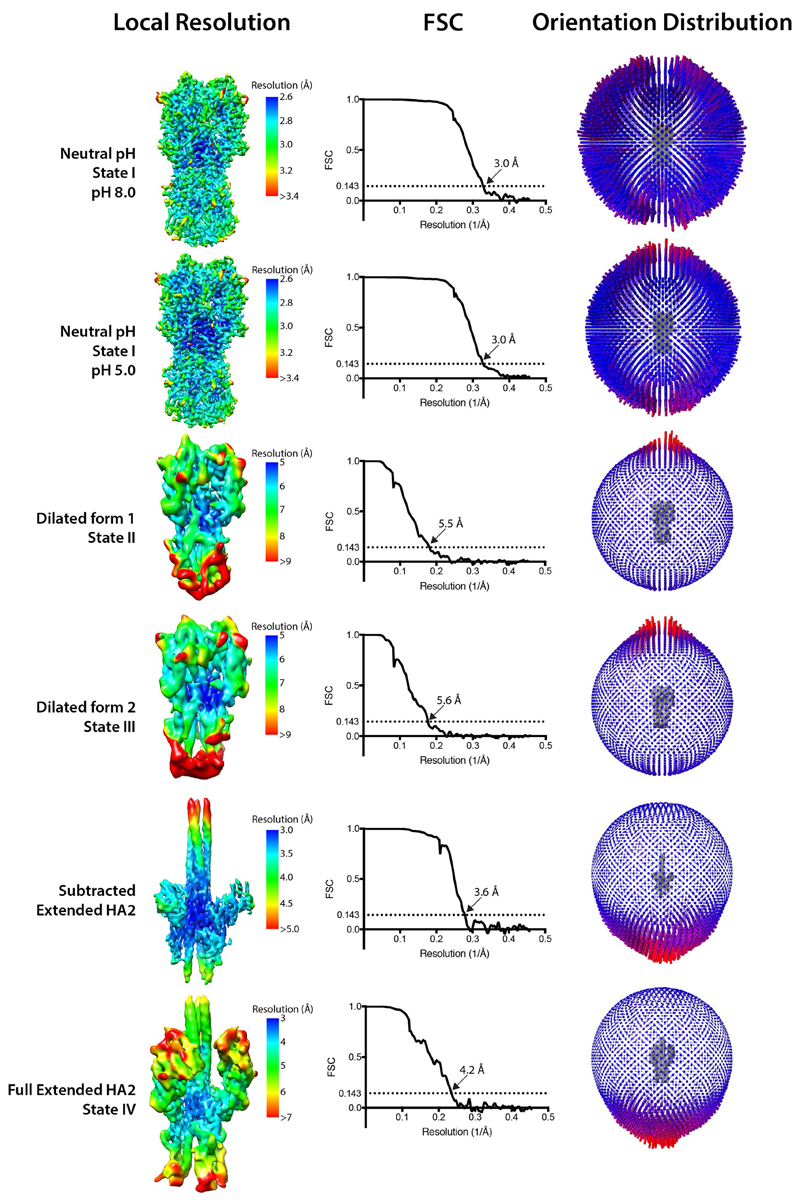
Extended Data Fig. 2. Resolution estimates of obtained cryo-EM maps.
Local-resolution estimates, global-resolution FSC curves and orientation-distribution plots for different conformations of HA. FSC curves have values for FSC of 0.143, shown as the resolution criterion. Reconstruction of state V has a resolution of 9.9 Å and has little variability in local resolution. See Extended Data Fig. 9 for the FSC curve for state V.
Extended Data Fig. 3. Flexibility of the membrane-distal domains.
The membrane-distal regions of HA1 (roughly residues 45–310) can adopt a range of different orientations compared with the C3 symmetrized structure (state IV). The remainder of HA1 and HA2 adopt a structure with less evidence of flexibility. We examined the flexibility in ten maps generated by asymmetric classification. a, The generated models are shown aligned to the symmetrized version of the protein (yellow). b, Examples of the most-populated classes are shown on a molecular surface, with HA1 in blue and HA2 in red to emphasize the different locations of these domains when compared with the symmetrized version. c, The displacements of the locations of the centroids of each of these mobile domains were measured to the nearest symmetrized monomer, giving 30 data points. These adopt a range of locations, with the main flexibility being in a rotation angle around the threefold axis, with little lateral movement towards and away from the threefold axis. The angles of displacement vary from −15° to +25°.
Extended Data Fig. 4. The 30-loop.
a, Potential interactions in the 30-loop are similar in both the neutral-pH (state I) and the extended HA2 (state IV) conformations. There are, however, several changes in the side chains involved in this interaction, owing to the relocation of the short helix of HA2 in the neutral-pH structure. This helix relocation removes an HA2 salt bridge between Arg54 of the short helix and Glu97 of the long helix, as well as the interaction of Lys51 with His106. These rearrangements permit new potential interactions between Thr30 of HA1 with Gln105 of HA2 and His106 of the adjacent HA2 chain. A salt bridge also forms between Lys27 of HA1 and Glu97 of HA2. b, Density of the 30-loop and interacting regions of the long helices of HA2 in the extended subtracted structure. c, The location and architecture of the 30-loop is conserved in all HAs, including influenza C HEF37. In HA, a cluster of conserved hydrophobic-loop residues at positions 26, 34 and 36 packs against the strictly conserved Ile108 in the long α-helix; the strictly conserved Asn104 forms hydrogen bonds with loop residue Lys27 and Lys315 of HA1; and HA2 residue 105, conserved as Gln or Glu, interacts with Thr30. Amino-acid substitutions in the loop (Thr30 to Ser), the short α-helix (Arg54 to Lys) and the long α-helix (Gln105 to Lys and His106 to Ala) that interact with loop residues 28, 29 and 30, respectively, destabilize the mutant HAs, as shown by their elevated fusion pH17,20. These observations indicate the functional importance of the loop and suggest its involvement in membrane fusion. Formation of the 180° turn in the extended helix requires removal of the 30-loop from its interactions with Gln105 and His106. The observed unfolding of the loop and its acquisition of susceptibility to protease digestion in stage V are consistent with this requirement and with the suggested role of the loop in supporting the extended helix in states II, III and IV.
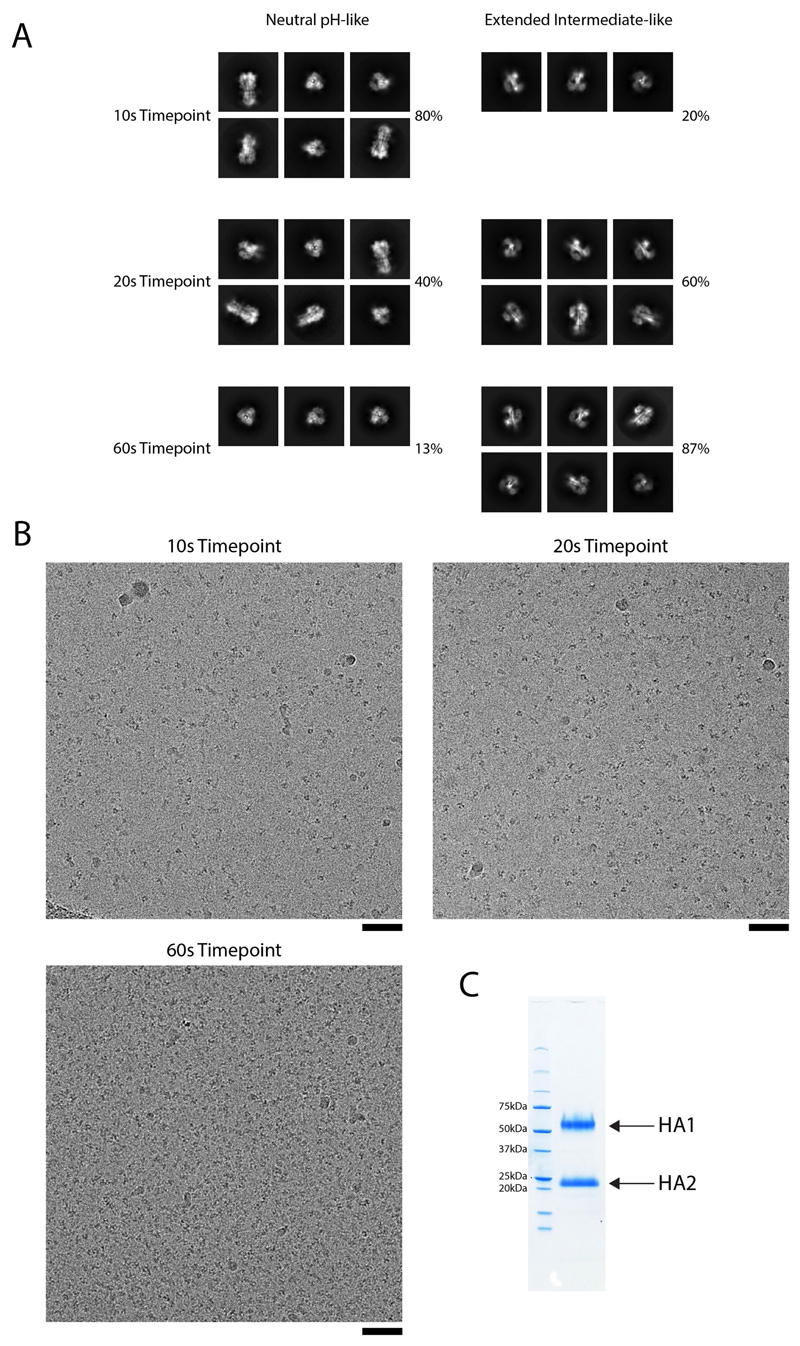
Extended Data Fig. 5. 2D class averages and representative micrographs for the 10 s, 20 s and 60 s time points.
a, 2D classes fall into two broad groups: neutral-pH-like and extended-intermediate-like. Representative classes are shown for each group for each time point, with the percentages indicating the overall numbers of particles that fall into these two broad groups. There is a general trend towards increasing numbers of extended-intermediate-like classes as the time point increases, with a decrease in numbers of neutral-pH-like classes. There is limited diversity in the orientations seen for the 10 s extended-intermediate-like and the 60 s neutral-pH-like classes. b, Representative micrographs (scale bars, 50 nm). Numbers of micrographs collected: 10 s, n = 4,004; 20 s, n = 8,728; 60 s, n = 2,925. c, SDS–PAGE of the HA sample used for experiments.
Extended Data Fig. 6. Classification scheme for the 10 s time point.
The figure shows the workflow for image processing to determine structures at 10 s.
Extended Data Fig. 7. Classification scheme for the 20 s time point.
The figure shows the workflow for image processing to determine structures at 20 s.
Extended Data Fig. 8. Classification scheme for the 60 s time point.
The figure shows the workflow for image processing to determine structures at 60 s.
Extended Data Fig. 9. Data processing for 30 min time points.
a, 2D classes from the 30 min time point show the presence of the extended HA2 (state IV) and the post-fusion conformations, as well as a minor population of neutral-pH conformations. The post-fusion averages are interpretable only for the end-on view down the threefold axis, where this conformation forms a characteristic dense ring-like shape. This limited range of interpretable views is probably due to the, now flexibly linked, HA1 domains increasing the structural heterogeneity. The interpretability of this species could be improved by the addition of 10 mM of 2-mercaptoethanol to detach the disulfide-linked HA1 domains. b, Classification scheme for the 30-min time point supplemented with 2-mercaptoethanol. c, FSC curve for the final refined structure, with resolution criterion FSC = 0.143 shown.
Extended Data Table 1. Cryo-EM statistics for map and model refinement.
| Pre-Fusion pH8 (EMDB-10696) (PDB 6Y5G) | Pre-Fusion pH5 (EMDB-10697) (PDB 6Y5H) | Dilated Form 1 (EMDB-10698) (PDB 6Y5I) | Dilated Form 2 (EMDB-10699) (PDB 6Y5J) | Full Extended HA2 (EMDB-10700) (PDB 6Y5K) | Subtracted Extended HA2 (EMDB-10701) (PDB 6Y5L) | Post Fusion (EMDB-10702) | |
|---|---|---|---|---|---|---|---|
| State Number | - | I | II | III | IV | IV | V |
| Timepoint | - | 20 s | 10 s | 20 s | 20 s | 20 s | 30 min + 2-ME |
| Data collection and processing | |||||||
| Magnification | 75 000 | 75 000 | 75 000 | 75 000 | 75 000 | 75 000 | 75 000 |
| Voltage (kV) | 300 | 300 | 300 | 300 | 300 | 300 | 300 |
| Electron exposure (e–/Å2) | 33.9 | 33.9 | 33.9 | 33.9 | 33.9 | 33.9 | 33.9 |
| Defocus range (μm) | 1.5-3 | 1.5-3 | 1.5-3 | 1.5-3 | 1.5-3 | 1.5-3 | 1.5-3 |
| Pixel size (Å) | 1.09 | 1.09 | 1.09 | 1.09 | 1.09 | 1.09 | 1.09 |
| Symmetry imposed | C3 | C3 | Cl | Cl | C3 | C3 | C3 |
| Initial particle images (no.) | 643 k | 1.39 M | 1.53 M | 1.39 M | 1.39 M | 1.39 M | 2.24 M |
| Final particle images (no.) | 200 k | 157 k | 72 k | 124 k | 189 k | 546 k | 62 k |
| Map resolution (Å) | 3.0 | 3.0 | 5.5 | 5.6 | 4.2 | 3.6 | 9.9 |
| FSC threshold 0.143 | |||||||
| Refinement Software | CryoSPARC | CryoSPARC | CryoSPARC | CryoSPARC | CryoSPARC | CryoSPARC | RELION |
| Map resolution range (Å) | 2.6-3.4 | 2.6-3.4 | 5-9 | 5-9 | 3-5 | 3-7 | - |
| Refinement | |||||||
| Initial model used (PDB code) | 2YPG | 2YPG | 2YPG | 2YPG | 2YPG&1QU1 | 2YPG&1QU1 | - |
| Map sharpening B factor (Å2) | -172 | -170 | -283 | -322 | -170 | -225 | - |
| Model composition | |||||||
| Non-hydrogen atoms | 12036 | 11994 | 11928 | 9609 | 10617 | 3855 | - |
| Protein residues | 1470 | 1470 | 1470 | 1185 | 1335 | 477 | |
| R.m.s. deviations | |||||||
| Bond lengths (Å) | 0.005 | 0.004 | 0.004 | 0.005 | 0.005 | 0.004 | - |
| Bond angles (°) | 0.553 | 0.959 | 0.987 | 1.000 | 1.049 | 0.999 | |
| Validation | |||||||
| MolProbity score | 1.48 | 1.35 | 1.54 | 1.82 | 1.65 | 1.78 | - |
| Clashscore | 3.69 | 2.81 | 4.31 | 10.88 | 10.23 | 5.46 | - |
| Poor rotamers (%) | 0.94 | 0.70 | 0.47 | 0.94 | 0 | 0 | - |
| Ramachandran plot | |||||||
| Favored (%) | 95.4 | 95.9 | 95.3 | 96.2 | 97.35 | 92.16 | - |
| Allowed (%) | 4.6 | 4.1 | 4.7 | 3.8 | 2.65 | 7.84 | - |
| Disallowed (%) | 0 | 0 | 0 | 0 | 0 | 0 | - |
Supplementary Material
Supplementary information is available for this paper at https://doi.org/10.1038/s41586-020-2333-6.
Acknowledgements
We thank A. Nans of the Structural Biology Science Technology Platform for assistance with data collection; P. Walker and A. Purkiss of the Structural Biology Science Technology Platform; the Scientific Computing Science Technology Platform for computational support; and L. Calder for discussions. This work was funded by the Francis Crick Institute, which receives its core funding from Cancer Research UK (grant numbers FC001078 and FC001143), the UK Medical Research Council (FC001078 and FC001143), and the Wellcome Trust (FC001078 and FC001143).
Footnotes
Author contributions D.J.B carried out research and collected and analysed data. All authors conceived and designed the research and wrote the paper.
Competing interests The authors declare no competing interests.
Peer review information Nature thanks Stephen Harrison, Juha Huiskonen and Yorgo Modis for their contribution to the peer review of this work.
Reprints and permissions information is available at http://www.nature.com/reprints.
Publisher’s note Springer Nature remains neutral with regard to jurisdictional claims in published maps and institutional affiliations.
Data availability
Maps and models have been deposited in the Electron Microscopy Data Bank (http://www.ebi.ac.uk/pdbe/emdb/, under accession numbers EMD-10696, EMD-10697, EMD-10698, EMD-10699, EMD-10700, EMD-10701, and EMD-10702). Models have been deposited in the Protein Data Bank (https://www.ebi.ac.uk/pdbe/, under identification codes 6Y5G, 6Y5H, 6Y5I, 6Y5J, 6Y5K and 6Y5L). The raw image for Extended Data Fig. 5c is provided in Supplementary Fig. 1.
References
- 1.Cossart P, Helenius A. Endocytosis of viruses and bacteria. Cold Spring Harb Perspect Biol. 2014;6:a016972. doi: 10.1101/cshperspect.a016972. [DOI] [PMC free article] [PubMed] [Google Scholar]
- 2.Skehel JJ, Wiley DC. Receptor binding and membrane fusion in virus entry: the influenza hemagglutinin. Annu Rev Biochem. 2000;69:531–569. doi: 10.1146/annurev.biochem.69.1.531. [DOI] [PubMed] [Google Scholar]
- 3.Brunner J. Testing topological models for the membrane penetration of the fusion peptide of influenza virus hemagglutinin. FEBS Lett. 1989;257:369–372. doi: 10.1016/0014-5793(89)81574-1. [DOI] [PubMed] [Google Scholar]
- 4.Ruigrok RW, et al. Electron microscopy of the low pH structure of influenza virus haemagglutinin. EMBO J. 1986;5:41–49. doi: 10.1002/j.1460-2075.1986.tb04175.x. [DOI] [PMC free article] [PubMed] [Google Scholar]
- 5.Ruigrok RWH, et al. Studies on the structure of the influenza virus haemagglutinin at the pH of membrane fusion. J Gen Virol. 1988;69:2785–2795. doi: 10.1099/0022-1317-69-11-2785. [DOI] [PubMed] [Google Scholar]
- 6.Wilson IA, Skehel JJ, Wiley DC. Structure of the haemagglutinin membrane glycoprotein of influenza virus at 3 Å resolution. Nature. 1981;289:366–373. doi: 10.1038/289366a0. [DOI] [PubMed] [Google Scholar]
- 7.Bullough PA, Hughson FM, Skehel JJ, Wiley DC. Structure of influenza haemagglutinin at the pH of membrane fusion. Nature. 1994;371:37–43. doi: 10.1038/371037a0. [DOI] [PubMed] [Google Scholar]
- 8.Chen J, Skehel JJ, Wiley DC. N-and C-terminal residues combine in the fusion-pH influenza hemagglutinin HA2 subunit to form an N cap that terminates the triple-stranded coiled coil. Proc Natl Acad Sci USA. 1999;96:8967–8972. doi: 10.1073/pnas.96.16.8967. [DOI] [PMC free article] [PubMed] [Google Scholar]
- 9.Godley L, et al. Introduction of intersubunit disulfide bonds in the membrane-distal region of the influenza hemagglutinin abolishes membrane fusion activity. Cell. 1992;68:635–645. doi: 10.1016/0092-8674(92)90140-8. [DOI] [PubMed] [Google Scholar]
- 10.Barbey-Martin C, et al. An antibody that prevents the hemagglutinin low pH fusogenic transition. Virology. 2002;294:70–74. doi: 10.1006/viro.2001.1320. [DOI] [PubMed] [Google Scholar]
- 11.Watanabe A, et al. Antibodies to a conserved influenza head interface epitope protect by an IgG subtype-dependent mechanism. Cell. 2019;177:1124–1135.e16. doi: 10.1016/j.cell.2019.03.048. [DOI] [PMC free article] [PubMed] [Google Scholar]
- 12.Bangaru S, et al. A site of vulnerability on the influenza virus hemagglutinin head domain trimer interface. Cell. 2019;177:1136–1152. doi: 10.1016/j.cell.2019.04.011. [DOI] [PMC free article] [PubMed] [Google Scholar]
- 13.Bizebard T, et al. Structure of influenza virus haemagglutinin complexed with a neutralizing antibody. Nature. 1995;376:92–94. doi: 10.1038/376092a0. [DOI] [PubMed] [Google Scholar]
- 14.Ward CW, Dopheide TA. Influenza virus haemagglutinin. Structural predictions suggest that the fibrillar appearance is due to the presence of a coiled-coil. Aust J Biol Sci. 1980;33:441–447. doi: 10.1071/bi9800441. [DOI] [PubMed] [Google Scholar]
- 15.Carr CM, Kim PS. A spring-loaded mechanism for the conformational change of influenza hemagglutinin. Cell. 1993;73:823–832. doi: 10.1016/0092-8674(93)90260-w. [DOI] [PubMed] [Google Scholar]
- 16.Calder LJ, Rosenthal PB. Cryomicroscopy provides structural snapshots of influenza virus membrane fusion. Nat Struct Mol Biol. 2016;23:853–858. doi: 10.1038/nsmb.3271. [DOI] [PMC free article] [PubMed] [Google Scholar]
- 17.Daniels RS, et al. Fusion mutants of the influenza virus hemagglutinin glycoprotein. Cell. 1985;40:431–439. doi: 10.1016/0092-8674(85)90157-6. [DOI] [PubMed] [Google Scholar]
- 18.Wharton SA, Skehel JJ, Wiley DC. Studies of influenza haemagglutinin-mediated membrane fusion. Virology. 1986;149:27–35. doi: 10.1016/0042-6822(86)90083-8. [DOI] [PubMed] [Google Scholar]
- 19.Xu R, Wilson IA. Structural characterization of an early fusion intermediate of influenza virus hemagglutinin. J Virol. 2011;85:5172–5182. doi: 10.1128/JVI.02430-10. [DOI] [PMC free article] [PubMed] [Google Scholar]
- 20.Collins PJ, et al. Recent evolution of equine influenza and the origin of canine influenza. Proc Natl Acad Sci USA. 2014;111:11175–11180. doi: 10.1073/pnas.1406606111. [DOI] [PMC free article] [PubMed] [Google Scholar]
- 21.Lorieau JL, Louis JM, Schwieters CD, Bax A. pH-triggered, activated-state conformations of the influenza hemagglutinin fusion peptide revealed by NMR. Proc Natl Acad Sci USA. 2012;109:19994–19999. doi: 10.1073/pnas.1213801109. [DOI] [PMC free article] [PubMed] [Google Scholar]
- 22.Benton DJ, et al. Influenza hemagglutinin membrane anchor. Proc Natl Acad Sci USA. 2018;115:10112–10117. doi: 10.1073/pnas.1810927115. [DOI] [PMC free article] [PubMed] [Google Scholar]
- 23.Zheng SQ, et al. MotionCor2: anisotropic correction of beam-induced motion for improved cryo-electron microscopy. Nat Methods. 2017;14:331–332. doi: 10.1038/nmeth.4193. [DOI] [PMC free article] [PubMed] [Google Scholar]
- 24.Rohou A, Grigorieff N. CTFFIND4: fast and accurate defocus estimation from electron micrographs. J Struct Biol. 2015;192:216–221. doi: 10.1016/j.jsb.2015.08.008. [DOI] [PMC free article] [PubMed] [Google Scholar]
- 25.Scheres SHW. RELION: implementation of a Bayesian approach to cryo-EM structure determination. J Struct Biol. 2012;180:519–530. doi: 10.1016/j.jsb.2012.09.006. [DOI] [PMC free article] [PubMed] [Google Scholar]
- 26.Punjani A, Rubinstein JL, Fleet DJ, Brubaker MA. cryoSPARC: algorithms for rapid unsupervised cryo-EM structure determination. Nat Methods. 2017;14:290–296. doi: 10.1038/nmeth.4169. [DOI] [PubMed] [Google Scholar]
- 27.Wagner T, et al. SPHIRE-crYOLO is a fast and accurate fully automated particle picker for cryo-EM. Commun Biol. 2019;2:218. doi: 10.1038/s42003-019-0437-z. [DOI] [PMC free article] [PubMed] [Google Scholar]
- 28.Zivanov J, et al. New tools for automated high-resolution cryo-EM structure determination in RELION-3. eLife. 2018;7:e42166. doi: 10.7554/eLife.42166. [DOI] [PMC free article] [PubMed] [Google Scholar]
- 29.Zivanov J, Nakane T, Scheres SHW. A Bayesian approach to beam-induced motion correction in cryo-EM single-particle analysis. IUCrJ. 2019;6:5–17. doi: 10.1107/S205225251801463X. [DOI] [PMC free article] [PubMed] [Google Scholar]
- 30.Ilca SL, et al. Multiple liquid crystalline geometries of highly compacted nucleic acid in a dsRNA virus. Nature. 2019;570:252–256. doi: 10.1038/s41586-019-1229-9. [DOI] [PubMed] [Google Scholar]
- 31.Cardone G, Heymann JB, Steven AC. One number does not fit all: mapping local variations in resolution in cryo-EM reconstructions. J Struct Biol. 2013;184:226–236. doi: 10.1016/j.jsb.2013.08.002. [DOI] [PMC free article] [PubMed] [Google Scholar]
- 32.Rosenthal PB, Henderson R. Optimal determination of particle orientation, absolute hand, and contrast loss in single-particle electron cryomicroscopy. J Mol Biol. 2003;333:721–745. doi: 10.1016/j.jmb.2003.07.013. [DOI] [PubMed] [Google Scholar]
- 33.Lin YP, et al. Evolution of the receptor binding properties of the influenza A(H3N2) hemagglutinin. Proc Natl Acad Sci USA. 2012;109:21474–21479. doi: 10.1073/pnas.1218841110. [DOI] [PMC free article] [PubMed] [Google Scholar]
- 34.Emsley P, Lohkamp B, Scott WG, Cowtan K. Features and development of Coot. Acta Crystallogr D. 2010;66:486–501. doi: 10.1107/S0907444910007493. [DOI] [PMC free article] [PubMed] [Google Scholar]
- 35.Adams PD, et al. PHENIX: a comprehensive Python-based system for macromolecular structure solution. Acta Crystallogr D. 2010;66:213–221. doi: 10.1107/S0907444909052925. [DOI] [PMC free article] [PubMed] [Google Scholar]
- 36.Pettersen EF, et al. UCSF Chimera—a visualization system for exploratory research and analysis. J Comput Chem. 2004;25:1605–1612. doi: 10.1002/jcc.20084. [DOI] [PubMed] [Google Scholar]
- 37.Rosenthal PB, et al. Structure of the haemagglutinin-esterase-fusion glycoprotein of influenza C virus. Nature. 1998;396:92–96. doi: 10.1038/23974. [DOI] [PMC free article] [PubMed] [Google Scholar]
Associated Data
This section collects any data citations, data availability statements, or supplementary materials included in this article.
Supplementary Materials
Supplementary information is available for this paper at https://doi.org/10.1038/s41586-020-2333-6.
Data Availability Statement
Maps and models have been deposited in the Electron Microscopy Data Bank (http://www.ebi.ac.uk/pdbe/emdb/, under accession numbers EMD-10696, EMD-10697, EMD-10698, EMD-10699, EMD-10700, EMD-10701, and EMD-10702). Models have been deposited in the Protein Data Bank (https://www.ebi.ac.uk/pdbe/, under identification codes 6Y5G, 6Y5H, 6Y5I, 6Y5J, 6Y5K and 6Y5L). The raw image for Extended Data Fig. 5c is provided in Supplementary Fig. 1.


