Abstract
Successfully navigating in physical or semantic space requires a neural representation of allocentric (map-based) vectors to boundaries, objects, and goals. Cognitive processes such as path-planning and imagination entail recall of vector representations, but evidence of neuron-level memory for allocentric vectors has been lacking. Here we describe a novel neuron type (Vector Trace cell, VTC) whose firing generates a new vector field when a cue is encountered, and also a ‘trace’ version of that field for hours after cue removal. VTCs are concentrated in subiculum distal to CA1. Compared to non-trace cells, VTCs fire at further distances from cues and exhibit earlier-going shifts in preferred theta phase in response to newly introduced cues, demonstrating a theta-linked neural substrate for memory encoding. VTCs suggest a vector-based model of computing spatial relationships between an agent and multiple spatial objects, or between different objects, freed from the constraints of direct perception of those objects.
Introduction
Neurons in the hippocampal formation represent an organism’s allocentric location and heading 1–5, and the fundamental coding underlying these spatial representations, for instance involving the theta oscillation, likely support planning, imagination, and memory beyond the purely spatial domain 6–9. Spatial coding may be vector-based, such that a neuron fires at a particular allocentric distance and direction from an environmental boundary or object 10–14, and path-planning and imagination often entail the recall of vector representations of environmental cues 7,14–16.
Here, we examined vector-based representations in the subiculum. The subiculum is a major output region of the hippocampal formation 17–19 The subiculum is known to contain vector representations 11, is implicated in memory retrieval 20,21, and has recently been identified as likely the hippocampal component of the default mode network 22. This could suggest a wide role for subicular vector-based representations in directing navigation and memory-based cognition, consistent with models of spatial memory and imagery 7.
Accordingly, we exposed rats to a range of cues differing in size, shape and sensory properties, and tested for memory-based responses in subicular neurons following cue removal.
Results
Cue responsive cells: Defining Vector Trace cells (VTCs) and non-trace cells
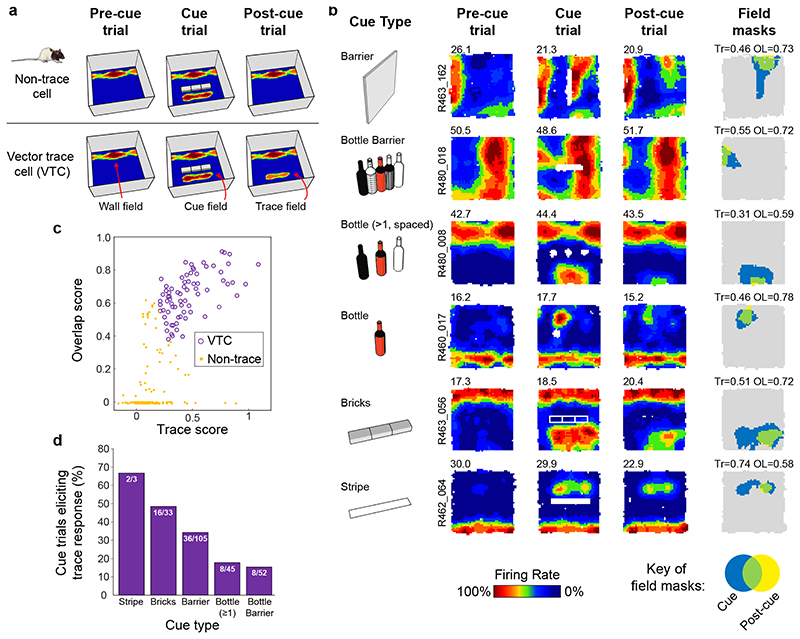
Fig. 1A shows a schematic of the experimental manipulations. The dataset comprised only subicular cue-responsive neurons which showed spatial tuning to environmental boundaries 11 and inserted cues. Responsiveness to inserted cues was defined by the appearance of a new firing field (‘cue-field’) in the cue trial (253 cells passing this criterion: see Methods). We quantified the strength of memory-based firing in the region of the cue-field, in the Post-cue trial using two measures: 1) a ‘Trace score’, which measured the strength of firing in the cuefield region, in the post-cue trial; 2) an ‘Overlap score’, which measured whether firing in the Post-cue trial, outside of the wall field (termed the ‘post-cue field’) was spatially overlapping with the cue field region. (Fig. 1B, rightmost column, Fig.1C; see Methods). Trace and Overlap scores together define a group of neurons which show memory-based firing persistence, specifically in the region of the cue-field (firing hereafter referred to as the ‘Trace field’). For further analysis, those neurons with Trace score ≥ 0.205 and Overlap score ≥ 0.380 were defined as showing trace responses, here termed ‘Vector Trace cells’ (VTCs) (73/253; Fig.1C; Extended Data Fig.1 shows co-recorded examples of both cell types: VTCs and non-trace cells; threshold values represent the 90th percentiles of populations of Trace and Overlap scores derived from spatially-shuffled data, see Methods).
Fig. 1. Vector trace responses to a range of cues.
(A) Schematic of experimental procedure, including illustrative results. Rats foraged for food while neurons were recorded in the dorsal subiculum. Heat maps show firing rate of a neuron as a function of rat’s position (warmer colours = higher firing). Top row: schematic of a ‘Non-trace’ vector cell responsive to insertion of a new cue (‘Cue’ trial) but lacking a memory ‘trace field’ in the ‘Post-cue’ trial. Bottom row: a Vector trace cell (VTC) whose cue-responsive firing field persists during ‘Post-cue’ trial following cue removal. (B) 6 representative VTCs. Left column: type of cue used. Middle columns: firing rate maps, peak firing rate (Hz) top-left of each map, rat and cell identifier numbers left of maps. Each cell (row) forms new firing field when cue (white space/lines) is introduced (Cue). Following cue removal (Post-cue), cue-responsive firing field persists in the region of the cue field. Right column: masks showing cue-responsive field (blue), post-cue field (yellow) and overlap between both, indicative of a trace response (green). Trace (Tr) and Overlap (OL) scores shown above each plot. (C) Scatter plot of Trace and Overlap scores for all cue-responsive neurons (n=73 VTCs, n=180 Non-trace cells). VTCs are defined by combined above-threshold Trace and Overlap scores. (D) Percentages of tested cue-responsive neurons categorized as VTCs for each cue type. Fractions overlaid on bars show the number of cue responsive neurons recorded for cue type (denominator) and number of these neurons categorized as VTCs (numerator).
For vector coding to enable efficient navigation, it should be flexible, operating over a range of cue types and distances. Subiculum neurons were responsive to a range of different cue types (Fig. 1B, left column), and all cue-types were also capable of eliciting a memory-based response (Fig. 1D). Cue-responsive subiculum neurons are therefore capable of encoding allocentric vectors to a wide range of external cues, including both discrete objects and extended boundaries11. A sub-set of cue-responsive cells were exposed to multiple cues during one experimental session. Non-trace cells demonstrated a significant tendency to not form memory traces in response to any cues presented (Extended Data Fig 2A, B). Systematic assessment of VTC responses to multiple cues was rendered difficult by proportionally lower sampling of VTCs in multiple-cue sessions and the long-lasting nature of trace responses (see below, Fig 4) making cue responses to later cues difficult to discriminate from trace responses to earlier cues. However, evidence from the limited numbers of cells where multiple cue responses are detectable suggests that VTCs were significantly likely to show a trace response to multiple cue types (Extended Data Fig 2C, D).
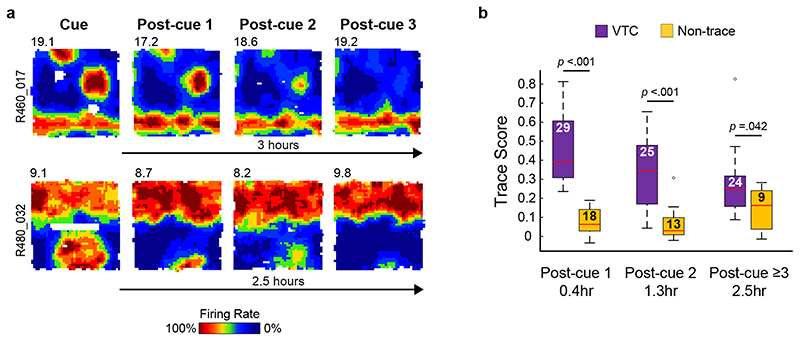
Fig. 4. Hours-long persistence of trace fields in Vector Trace cells after cue removal.
(A) Hours-long persistence of trace fields in two representative VTCs in absence of cue. (B) Box plots showing Trace scores for all VTCs and Non-trace cells recorded on multiple post-cue trials. Numbers within boxes indicate number of cells sampled for each respective delay. Boxes show 25th – 75th percentiles of each data group, central line shows median, whiskers show the extent of data 1.5x inter-quartile range beyond the 25th and 75th percentiles. Data beyond whisker extent are shown as individual data points. VTC Trace scores decay over time, but remain significantly above Non-trace cell trace scores at all time points (two tailed p values: VTC > non-trace cell Simple Main Effect comparisons. See text for full ANOVA details).
Vector Trace cells exhibit longer and more variable vector distance tunings than non-trace cells
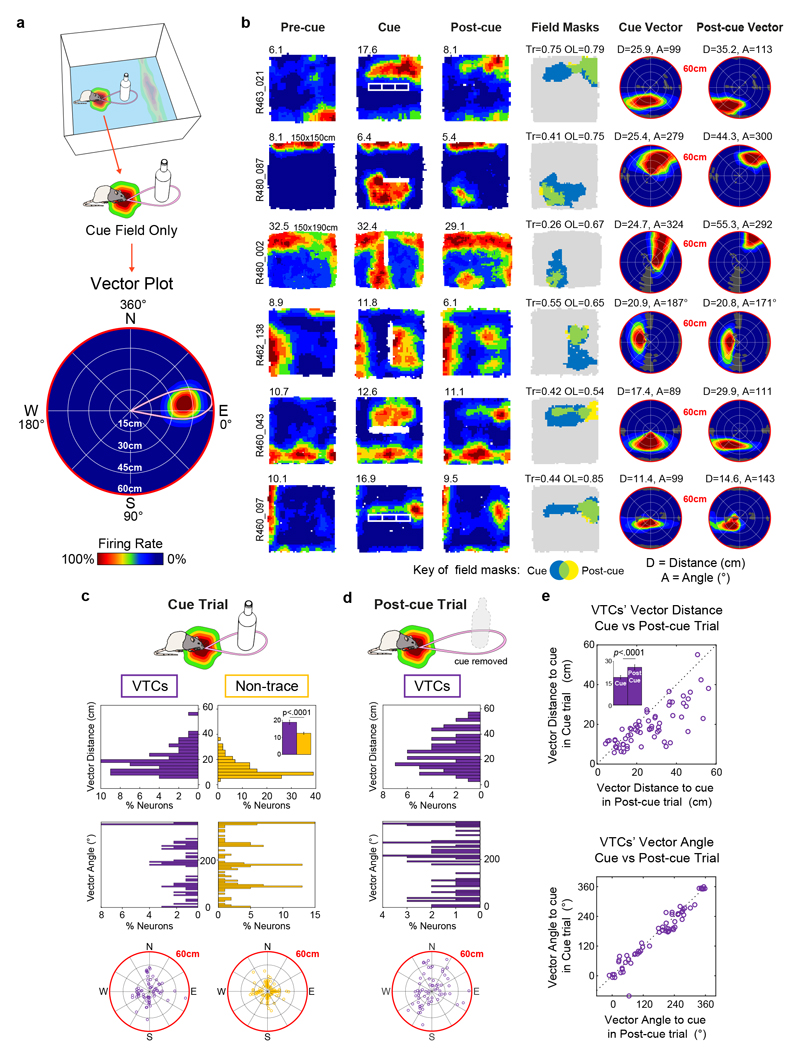
To quantify the spatial characteristics of both VTC and non-trace cell cue responses, we constructed vector firing rate maps which expressed cue-responsive and memory-based firing as a function of the animal’s distance and direction to the cue (2A, B; see Methods). The distance tunings of VTC cue responses were much longer (Fig. 2C, VTCs: 18.8 ± 1.2cm, non-trace: 12.4 ± 0.6cm, Welch t 195 = 4.68: p < 0.0001), and showed a much wider variance (F test variance ratio = 2.47, p < 0.001), than those of non-trace cells. Differences between VTC and non-trace cells therefore also extend to the nature of their spatial firing in response to a cue.
Fig. 2. Vector field properties.
(A) Schematic illustrating the estimation of cue vector from cue field. Top: A cell’s firing generates a wall field and cue field. Middle: analysis here focuses on cue field only. Bottom: Vector plot derived from cue field, which shows mean firing rate as a function of rat’s displacement from the cue position. Concentric rings from centre to circumference show 15cm intervals used to represent cell’s distance tuning; angles going clockwise (East = zero degrees) represent angular tuning. Thus, this example indicates the cell fires most strongly when a cue occurs ~22-30 cm away (distance tuning) to the rat’s East (angular tuning). (B) Rate maps and cue vector plots for six representative VTCs. Conventions as Fig.1 for first four columns. Non-standard box sizes are indicated above Pre-cue rate map. Right two columns show vector plots for cue field vector in the Cue trial (5th column) and trace field vector in the Post-cue trial (6th column). Vector plot conventions as in part A (bottom). ‘D’ and ‘A’ values above vector plots give peak of distance tunings (cm) and angular tunings (degrees). Dark grey regions indicate unsampled bins. Distance tuning scale max is 0-60cm (red circumference). (C) Cue vectors estimated from cue-present trial (VTCs: purple, n=64; Non-trace cells: yellow, n=132). Top histogram: VTCs’ distance tunings have larger variance and longer distance in VTCs’ vector tunings than those of Non-trace cells. Inset compares mean ± s.e.m. values for both cell types (two-tailed p value: Welch t195=4.68). Bottom histogram shows angular tunings: Non-trace cells’ angular tunings are clustered around the four NESW directions. Polar plots (bottom) depict distribution of vectors (each small circle = one cell; distance scale = 0-60cm from centre to circumference). (D) Distribution of distance tunings (top histogram), angular tunings (bottom histogram) and vectors (polar plot) derived from trace fields in Post-cue trial. (E) Scatterplots showing the changes in distance tunings (top) and angular tunings (bottom) between the Cue and Post-cue trial for VTCs (n = 64). Inset in top plot compares mean ± s.e.m. values for Cue trial (left) and Post-cue trial (right) (two-tailed, paired p value: t63 = 6.395). Distance tunings are longer in Post-cue trial than Cue trial; in contrast, angular tunings are stable across Cue and Post-cue trial.
Angular tunings (Fig.2C; middle and bottom rows) of both cell types were not unimodally concentrated (Rayleigh test for uniformity: VTCs, p = 0.95, non-trace; p = 0.17). Non-trace angular tunings showed a significant departure from uniformity in the form of concentrated angular tunings at the cardinal compass directions (probably reflecting north-south and east-west cue orientations; n = 132, U2 = 0.31, p < 0.005, Kuiper’s V = 2.48, p < 0.01). However, VTC angular tunings did not significantly depart from uniformity in VTCs (n = 64, U2 = 0.108, 0.25>p > 0.15, Kuiper’s V = 1.479, p > 0.15).
We also characterized the vector tunings of VTC trace fields in the Post-cue trial, and compared these to cue-field tunings in the Cue trial (Fig 2D, E). Whilst the angular tunings of VTC fields were largely stable (mean angular difference between the cue and trace field 6.6 ± 3.2°, mean absolute angular difference: 19.5 ± 2.7°), the distance tunings demonstrated a systematic increase between Cue and Post-cue trials, from 19.0 ± 1.2 cm in the cue field to 25.9 ± 1.7 cm in the trace field (t 63 = 6.395, p < 0.0001, Fig 2E, inset). Movements of the cue-responsive field between the Cue and Post-cue trial therefore uncovered a dissociation between the components of vector tuning: angular tuning being stable whilst distance tuning systematically increased.
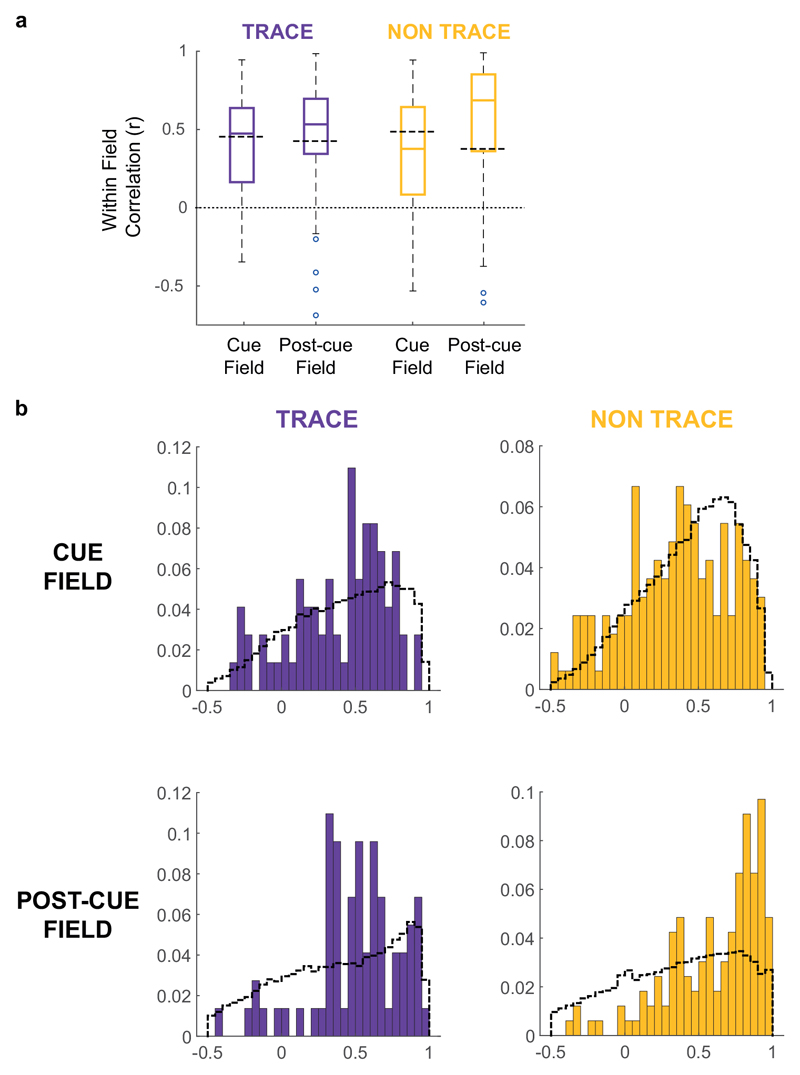
To further examine what determines trace field position in the Post-cue trial, we tested whether trace field location could be related to pre-existing spatial structure in a cell’s firing, already present in the Pre-cue trial. To do this, we calculated the correlations of spatial bin firing rates across the Pre- and Post-cue trials, specifically within the cue- and post-cue fields. We found that, although all such correlations were significantly greater than zero for VTCs the correlations were not significantly greater than populations of correlations derived from spatially shuffled field positions (Extended Data Fig 3). VTC trace field position does not therefore appear to be specifically related to pre-existing spatial firing structure in the Pre-cue trial.
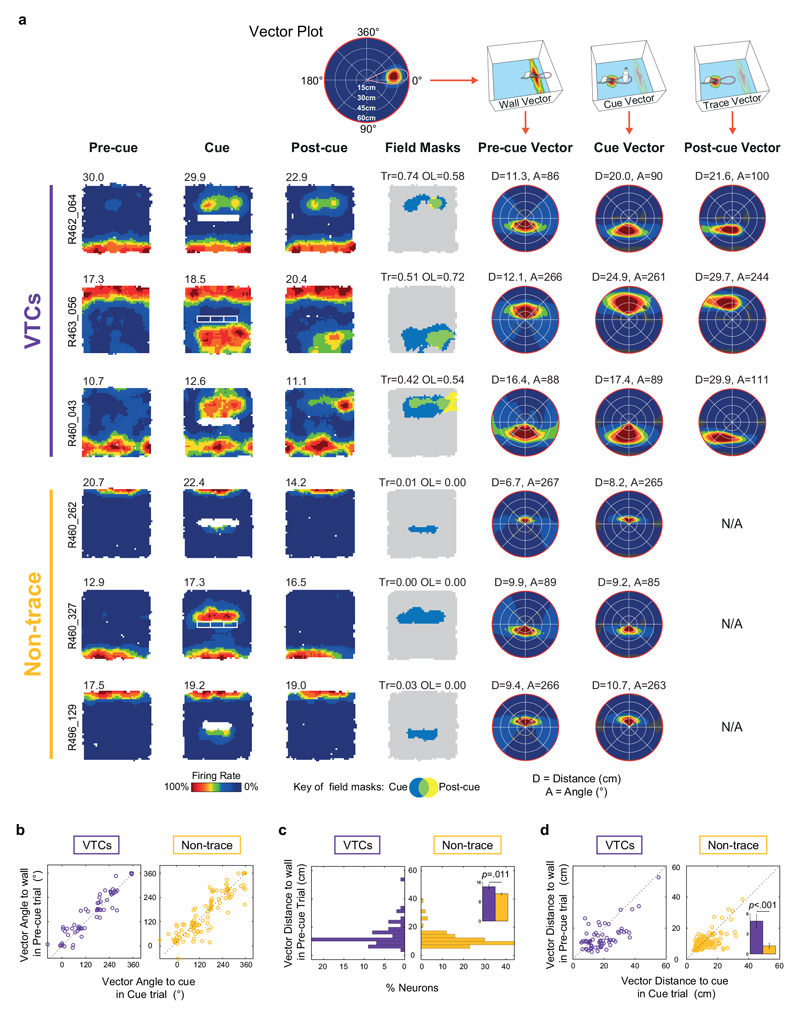
We also examined vector tunings for wall-responsive firing in the Pre-cue trial (Extended Data Fig 4). Angular tunings for wall-field and cue-field vectors were similarly stable across VTCs and non-trace cells (Extended Data Fig 4B). The distance tunings of VTCs’ wall field vectors were longer and showed more variance than those of non-trace cells (Extended Data Fig 4C). Distance tunings were longer for cue fields than wall fields in both cell types, but this was more pronounced in VTCs (Extended Data Fig 4D).
Vector trace fields reflect memory, not responses to local cues
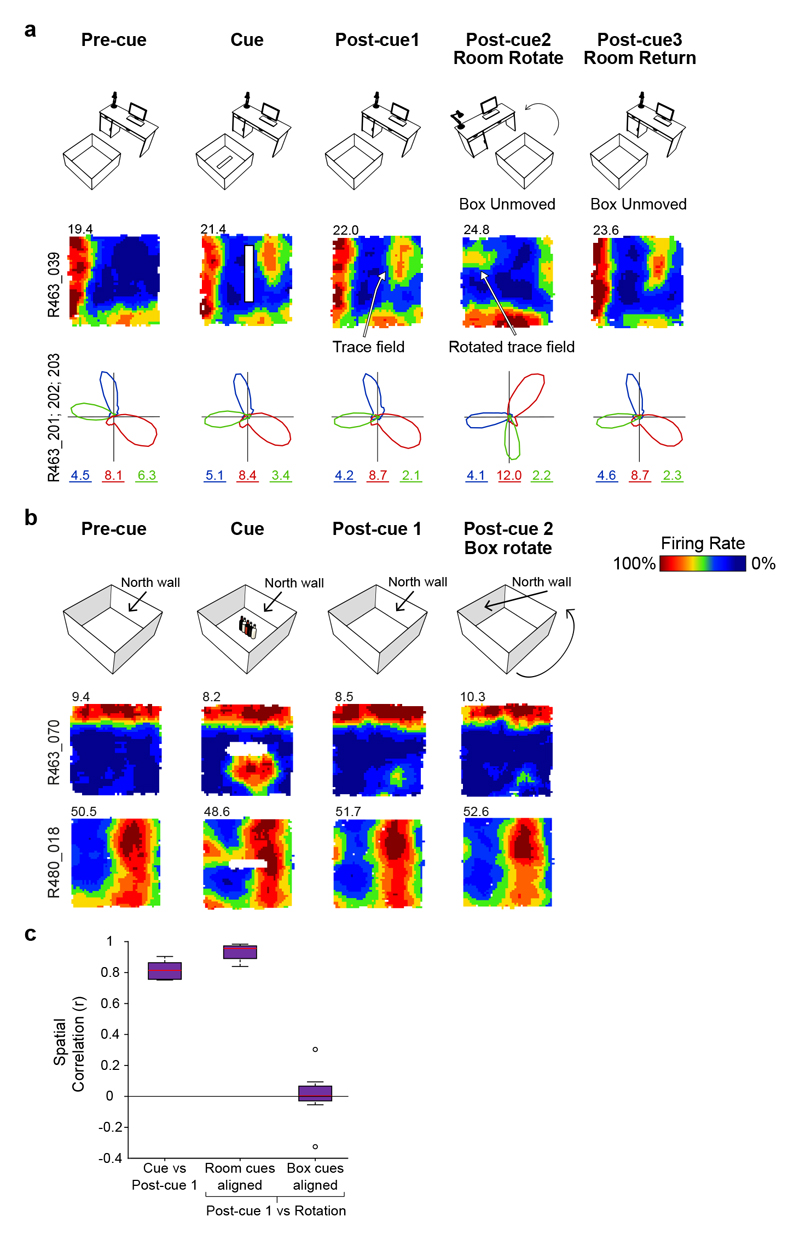
Could VTC trace fields reflect perceptual responses to odour cues left behind by objects rather than memory? To rule out this possibility, a sub-set of VTCs (18%, 13/72) in post-cue trials were subjected to the rotation of either the animal’s box-and-floor (‘intra-box’ cues) or room cues outside of the box (‘extra-box’ cues). In all cases, VTC field location was concomitant with extra-box, not intra-box cues (Fig. 3). When presubicular head-direction cells (HDCs) were co-recorded with VTCs, HDC preferred firing directions rotated in synchrony with VTCs (Fig. 3A, bottom row), suggesting that VTCs are coherently integrated into the overall hippocampal representation of the recording arena rather than responding to discrete local odour cues. These observations strongly argue that trace fields reflect mnemonic processing rather than responses to local cues (e.g. odours) left behind by the removed cues.
Fig. 3. Rotation of room cues and intra-box cues show trace fields do not reflect responses to local odour cues.
(A) Room-cue rotation manipulation (room cues rotated 90° anticlockwise; box-and-floor unchanged). Top row: schematic of experiment. Middle row: rate map for representative VTC. Bottom row: polar firing rate plots showing directional tuning of three co-recorded head direction (HD) cells (marked in different colors, numbers below polar plots show peak rate). HD cells rotated with VTC cell. (B) Intra-box cues rotation manipulation. Two example VTCs showing how rotating the walls and floor of the box had no effect upon location of VTC trace fields. Top row indicates sequence of four successive trials with two Post-cue trials. For Post-cue trial 2, box-and-floor configuration was rotated 90° anticlockwise. Middle row (Rat 463) and bottom row (Rat 480): representative VTCs showing that the wall fields and trace fields were unaltered by the box-and-floor rotation. (C) Box plots showing inter-trial correlations for VTCs (n=13) subjected to rotation trials, following post-hoc counter rotation of rate maps to align to either room, or box-and-floor, cues. Boxes show 25th – 75th percentiles of each data group, central line shows median, whiskers show the extent of data 1.5 x inter-quartile range beyond the 25th and 75th percentiles. Data beyond whisker extent are shown as individual data points. Post-cue firing fields align with room cues not box cues. Thus, fields do not reflect responses to lingering box odours.
Vector trace memory lasts for hours
To test how long VTC memory persists, a subset of VTCs were exposed to several Post-cue trials in succession (Fig. 4A, B). Over 0.4-2.5 hours (2-4 exposures), Trace scores of VTCs decayed over time, but they were consistently significantly higher than those of non-trace cells (Fig. 4B; 2-way ANOVA Trace scores: Exposure*Cell type; F 2,112 = 5.9, p = 0.004; 2-tailed post-hoc Simple Main Effects VTC vs Non-trace: 0.4 Hr, p < 0.001; 1.3 Hr, p < 0.001; 2.5 Hr, p = 0.042). These findings demonstrate that VTCs encode memories of cue location at hours-long timescales that would be highly likely to support adaptive spatial behaviour. The temporal decay in trace strength may additionally signal how long ago a cue was encountered.
Proximo-distal axis: vector trace cells are common in distal subiculum but rare in proximal subiculum
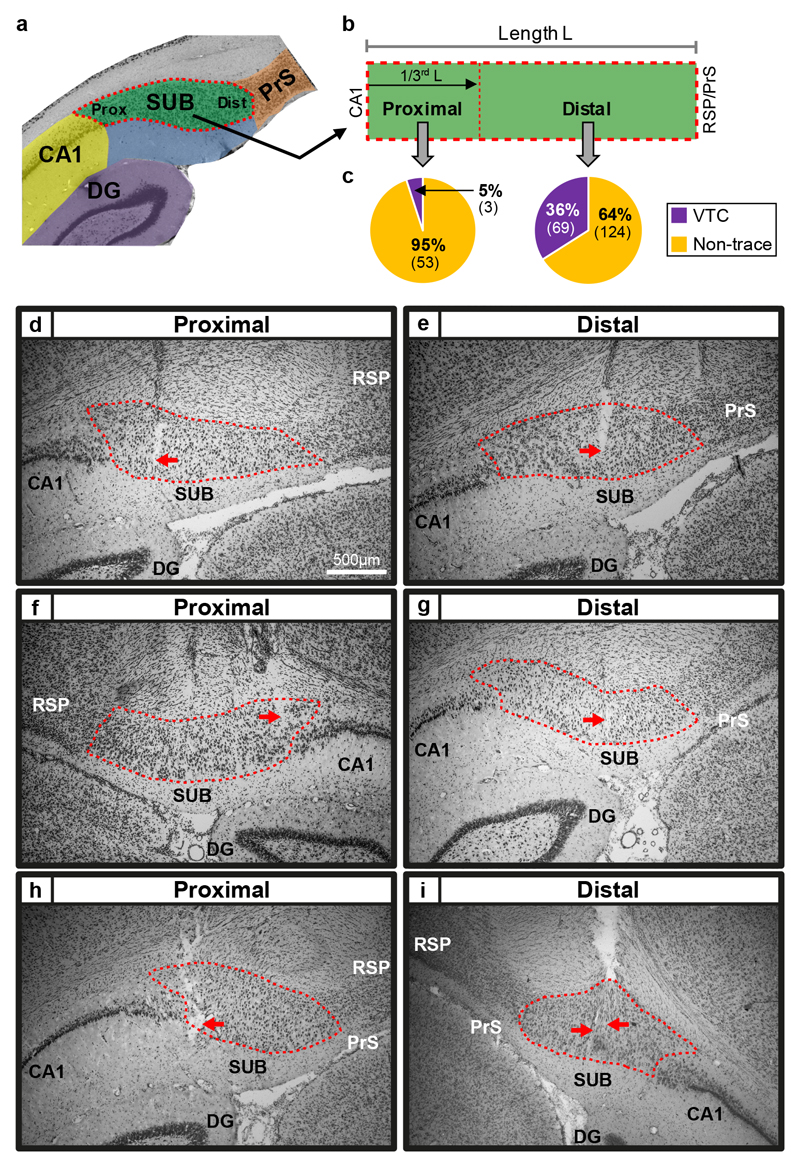
The proximo-distal anatomical axis is considered a major organizational feature of the subiculum, based on patterns of connectivity and gene expression 17–19, with proximal subiculum thought to support ‘What?’ memory and distal subiculum ‘Where?’ (allocentric) memory 18,23. However, in vivo electrophysiological evidence for proximo-distal functional specialisation is largely absent 11,24 consisting, at best, only of a gradient in mean firing rate and modest changes in spatial information content, e.g. 25,26. However, here, strikingly we find that VTCs are overwhelmingly found in distal subiculum (Fig. 5; distal VTCs constituting 69/193 (36%), and proximal VTCs 3/56 (5%) of cue-responsive cells (n = 249, χ2(1) = 19.51, p = 0.00001: for 4/253 cells, a distal or proximal location could not be confidently assigned), strongly suggesting that distal subiculum has a specialised role in spatial memory.
Fig. 5. Vector Trace cells were common in distal subiculum, but rare in proximal subiculum.
(A and B) Recording sites were assigned to proximal subiculum (the third nearest CA1), or distal subiculum (the two thirds furthest from CA1), divisions corresponding to previously reported connectivity and gene-expression patterns (see Methods). (C) High proportion of Vector Trace cells in distal, but not proximal, subiculum. (D to I) Photomicrographs of coronal sections depicting representative recording sites in proximal (D,F,H) and distal (E,G,I) regions. Red arrows point to estimated final location of the recording tetrodes. Dashed red lines indicate borders of subiculum’s pyramidal layer. Scale bar in (D) also applies to (E to I). Rat: 480 (D,E); 495 (F,G); 496 (H); 463 (I). Abbreviations: DG: Dentate gyrus; PrS: dorsal Presubiculum; RSP: Retrosplenial cortex; SUB: Subiculum.
As the scale of spatial representation is known to change along other anatomical axes in the broader hippocampal formation 3,27, it is possible that the longer and more variable vector distance tunings of VTCs compared to non-trace cells (Fig 2C, Extended Data Fig 2C) may be due to the concentration of VTCs in distal, as opposed to proximal, subiculum. However, differences between VTC and non-trace vector distance tunings remained robust even considering only those cells in the distal subiculum (Distance: VTCs, 19.3 ± 1.3cm; non-trace, 13.7 ± 0.7cm; Welch t 156=3.76, p = 0.0003; Variance: F test ratio = 2.27, p < 0.001). Accordingly, these distance tuning differences between VTCs and non-trace cells cannot be attributed to proximodistal variation in distance tuning.
Proximo-distal axis: cue-responsive cells in distal division of subiculum fired at an earlier phase of theta than proximal cue-responsive cells
Changes in spike timing with respect to the ongoing theta oscillation may modulate hippocampal neurons’ function in memory encoding and retrieval4,28–30. We began by first asking whether the degree of theta modulation and preferred phase of cue-responsive neurons differed across the proximal and distal divisions of the subiculum in the baseline situation.
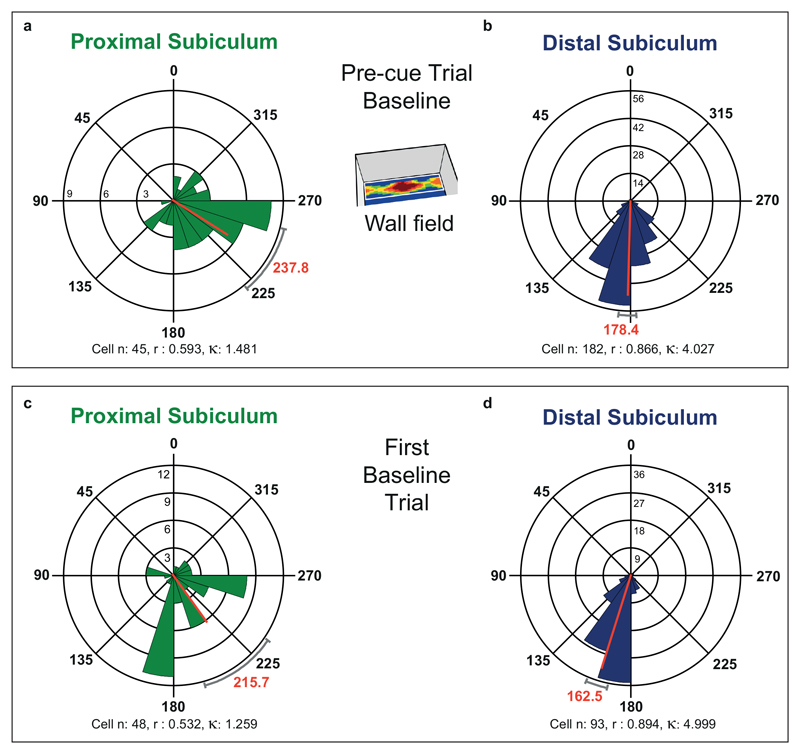
Theta modulation was higher in distal than proximal cue-responsive cells (Rayleigh r, Pre-cue trial: distal (n = 182): 0.162 ± 0.006; proximal (n = 45): 0.137 ± 0.010, T225 = 2.03, p = 0.04). When referencing the theta phase of all cells to distally-recorded theta, distal cue-responsive cells fired at a considerably earlier phase of theta than proximal cue-responsive cells (59.4°, Extended Data Fig 5A, B: Pre-cue trial, distal: 178±3°; proximal: 238±9°; Watson-Williams F 1,225 = 68.50, p < 1x10-12).
We asked if this marked difference in theta phase preference across proximal and distal divisions was specific to cue-responsive cells or extended to other cell types. Accordingly, we also analyzed phase preferences of non-cue responsive neurons, including cells with multiple or diffuse spatial firing fields and cells with no obvious spatial correlate. Again, distal cells were more theta modulated than proximal cells (Rayleigh r, distal: 0.168±0.006; proximal: 0.122 ± 0.008, T139 = 4.48, p < 0.0001) and distal cells fired at a considerably earlier theta phase than proximal cells (53.2°, Extended Data Fig 5C, D: distal: 163 ± 3°; proximal: 216 ± 10°; Watson-Williams F 1,139 = 40.11, p = 3.1x10⁻⁹).
While the higher degree of theta modulation in the distal division has previously been reported26, an earlier phase preference in the distal than proximal division is a novel observation. The difference in phase preference is considerable (50-60°). Taken together, the different theta modulation and phase preference seen over various cell types strongly suggests a general principle of differing temporal organization in the proximal and distal divisions of the subiculum.
Theta phase indexed mismatch detection: preferred theta phase shifted in response to a novel cue but remained consistent in response to the familiar wall
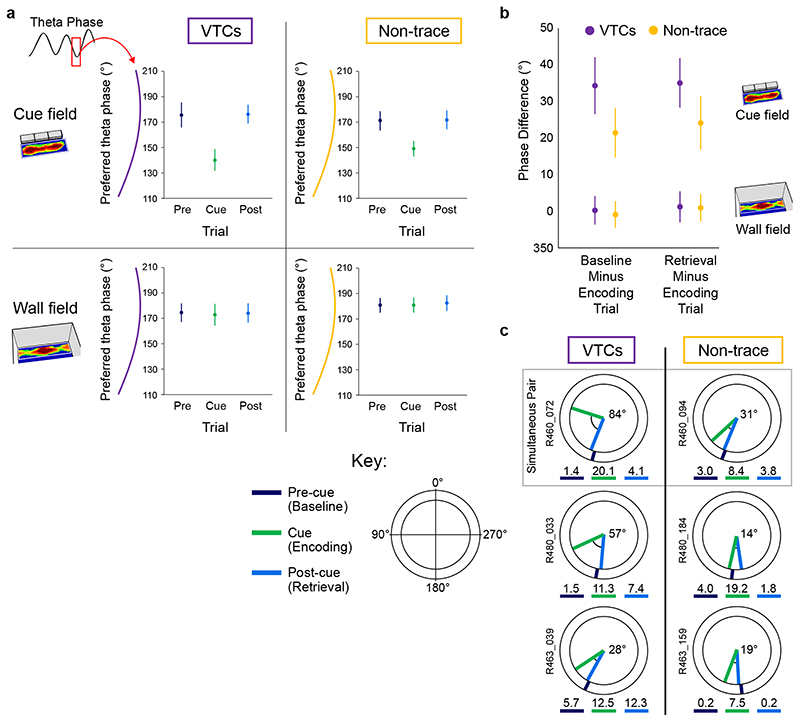
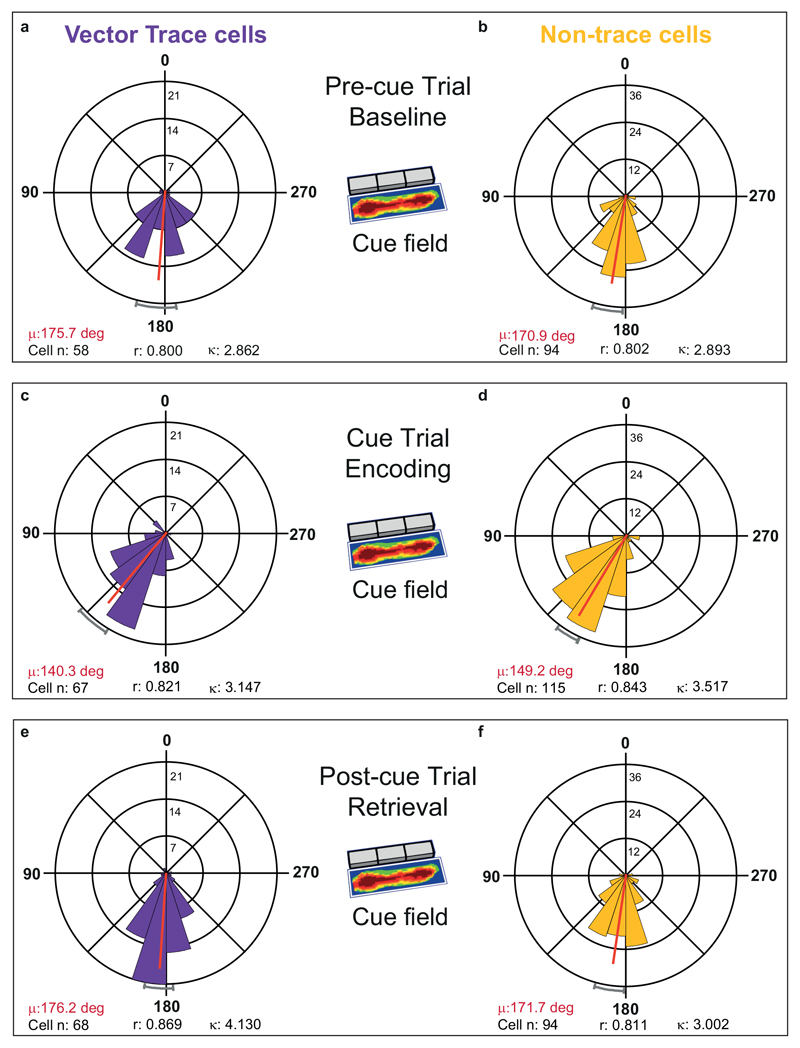
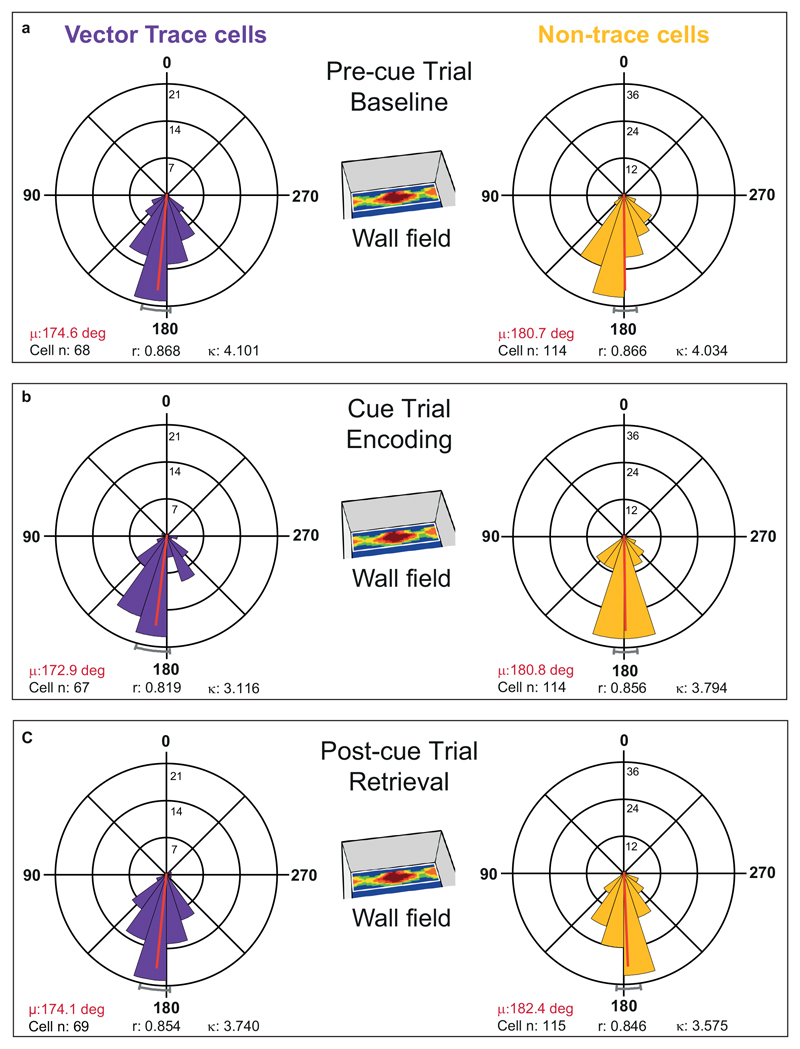
Given proximal-distal theta differences, and the large majority of VTCs (69 out of 72) being found in distal subiculum, we focused on distal subiculum to investigate specifically memory-related theta-modulation of VTCs. Encoding-vs-retrieval scheduling models 4,28,29 predict that these memory processing states are separated neurally by the theta phase of spiking, with phase linked to direction (potentiation, depression) and strength of synaptic plasticity. Overall theta modulation of firing was similar for VTCs and non-trace cells (Rayleigh r, pre-cue trial, VTCs: 0.155 ± 0.008; Non-trace: 0.166 ± 0.007; T180 = 0.93, p = 0.35). Consistent with theta scheduling models, cue insertion elicited a markedly different (earlier) preferred phase of theta in the newly-generated cue-field in all cue responsive cells (Fig.6A, top row; distributions, statistics: Extended Data Fig 6). Phase in the cue field (encoding) was earlier than in the same area in the Pre-cue trial (baseline) and Post-cue trial (retrieval) (-35.4°, -35.9°; non-trace cells: -21.7°, -22.5°: all p < 1.8x10⁻⁵). Importantly, preferred theta phase in wall fields remained constant throughout the trial sequence (Fig6A bottom row, Extended Data Fig 7), ruling out that cue-field earlier phase is driven by altered global state. Thus, earlier phase indexed ‘mismatch’ detection 1,4 which occurred in different box locations in a neuron-specific manner.
Fig. 6. Earlier-going theta phase shift in encoding is greater in VTCs than non-trace cells.
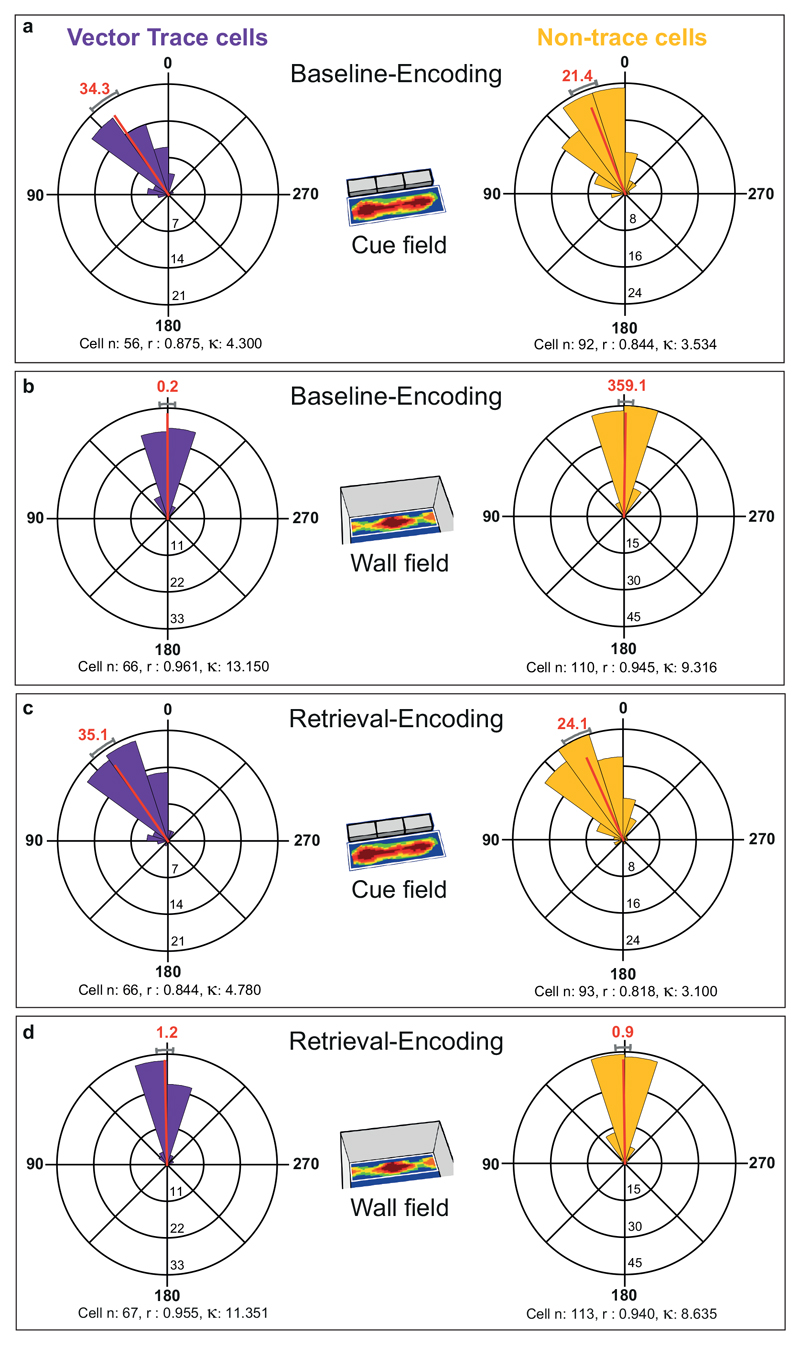
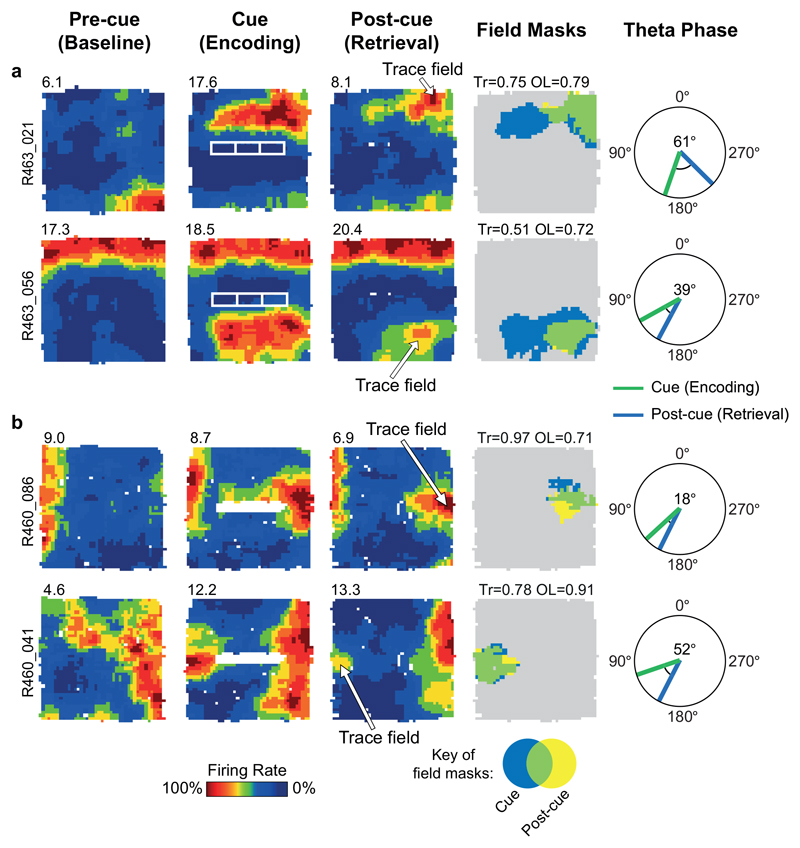
(A) Mean (±95% CI) preferred theta phase for neuronal firing, for the cue field (top row) and wall field (bottom row) areas. Preferred phase is markedly earlier in cue field in Encoding trial, for both VTCs (left) and Non-trace cells (right) (Watson-Williams (W-W) F tests: all Cue-vs-Pre-cue & Cue-vs-Post-cue p values < 1.8 x 10⁻⁵, see Extended Data Fig. 6), but is stable for wall fields in all trials (all trial comparisons p’s > 0.77, see Extended Data Fig. 7); no adjustments for multiple comparisons. (B) Mean (±95% CI) within-cell change in preferred phase in cue field area between Baseline and Encoding (left bars), and Encoding and Retrieval (right bars) for VTCs and Non-trace cells. Earlier-going phase shift in cue field, specifically in the Encoding trial, is greater in VTCs (Baseline minus Encoding, W-W F test, p = 0.018; Retrieval minus Encoding, W-W F test, p = 0.04); in the wall-field, phase difference was highly similar across cell-types and concentrated near zero (W-W F test, p values ≥ 0.68). See Extended Data Fig. 7 for further details. (C) Examples of preferred phase in cue field area, in single neurons (top VTC and Non-trace co-recorded pair) from three rats, with larger earlier-going shift in VTCs (angle shown in black at plot centers). Radial coloured ticks show mean preferred phase in each trial (see Key for colours), numbers below phase diagrams show mean firing rate (Hz) in each trial.
Cue-field earlier-going theta phase change was greater in Vector Trace cells than non-trace cells
Models of hippocampal memory operations have long posited that hippocampus detects mismatches, and mismatch drives encoding, e.g. 1,4,28,31. Could theta phase in the cue-field determine whether cue-responsive cells form a memory trace or not? There was no significant difference between the absolute phase of VTCs and non-trace cells in the cue-field (Extended Data Fig 6). However, we also tested whether the amount of within-cell late-to-early phase change following the insertion of a cue was associated with forming a memory trace. We found that VTCs showed larger phase changes in the cue-field than non-trace cells, both when comparing cue-trial (encoding) to pre-cue trial (baseline) (summary Fig 6B left; details Extended Data Fig 8A: Precue-Cue: VTCs: 34.3±3.9°; non-trace: 21.4±3.5°; Watson-Williams F 1,146 = 5.72, p = 0.018), and Cue-trial (encoding) to Post-cue trial (retrieval) (Fig 6B right; Extended Data Fig 8C: Postcue-Cue: VTCs: 35.1 ± 3.4°; non-trace: 24.1 ± 3.7°; Watson-Williams F 1,157 = 4.29, p = 0.04). In contrast, Precue-Cue and Postcue-Cue trial differences in the wall field were similarly concentrated near zero for VTCs and non-trace cells (summary Fig 6B bottom; Extended Data Fig 8B,D: Precue-Cue: VTCs: 0.2 ± 2.0°; non-trace: 359.1 ± 1.8°; Watson-Williams F 1,174 = 0.17, p = 0.68; Postcue-Cue: VTCs: 1.2 ± 2.1°; non-trace: 0.9 ± 1.9°; Watson-Williams F 1,178 = 0.01, p = 0.92). The earlier theta phase in the cue field alongside the constancy of theta phase in the wall field rules out that cue-field earlier phase is driven by altered global state.
Fig.6C shows examples of representative individual cells: preferred theta phase in the cue field is stable across Pre-cue and Post-cue trials, but earlier in the cue trial, and earlier in VTCs than non-trace cells.
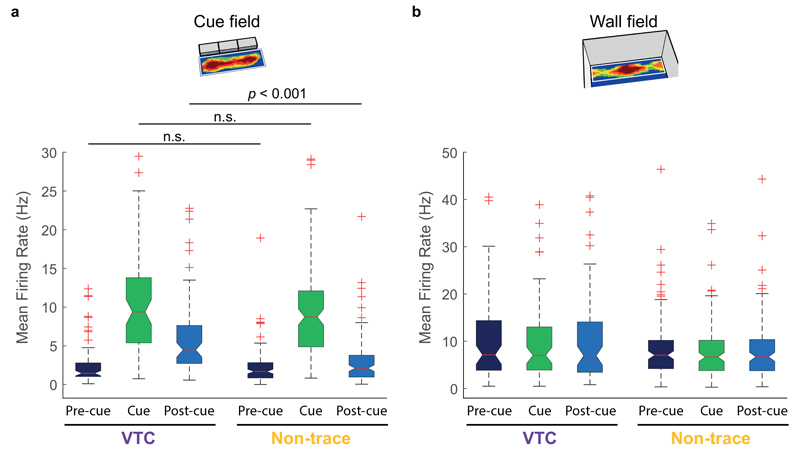
We emphasise that the changes in theta phase predicted by encoding-vs-retrieval models 4,28 observed here do not occur in a particular region of space that is consistent for all cells, as in say the choice-arm (vs a side-arm) of an alternation maze 29. Rather, cue and trace fields were distributed over the entire environment, and indeed these cue-related fields for one cell will thus sometimes occur in the same region as the wall field of another cell (Extended Data Fig. 9). Furthermore, these cell-type specific theta phase changes were not driven by changes in firing rate (Extended Data Fig.10).
Discussion
In summary, our results identify a new category of neuron, the vector trace cell, defined by two properties. First, a VTC responds when the rat is at a specific distance and allocentric direction from a small or extended cue, including environmental boundaries, by immediately generating a vector field. Second, the vector field persists after the cue that elicited it is subsequently removed, creating a vector trace field.
Our findings build on an emerging picture of the prevalence of vector coding in the hippocampal formation, but add the crucial dimension of vector memory. Thus, neurons in the medial 12 and lateral 32 entorhinal cortex can encode allocentric vectors to discrete objects (though not environmental boundaries) but do not show memory for previously-present cues. Likewise, recent reports of egocentric vector coding of environmental cues33–35 also do not describe memory traces. Lateral entorhinal neurons 36, and a few CA1 place cells 1,13 can encode a memory trace for previously-present objects, but these non-vectorial object fields, which develop only after cue removal, are confined to the exact object locations so cannot retrieve locations in the space between objects and boundaries as is the case for VTCs. One study found 12% of CA1 bat cells showed egocentric vector tuning to a goal, some with memory responses 37. Interestingly, however, these goal-directed CA1 cells appear to encode the vector to only a single goal at a time. The present study is the first to report a cell class that combines encoding the location of multiple cues using allocentric vectors, with memory of those cue locations when the cues are removed. Importantly, the subicular representation served by VTCs seems quite different to that in the medial entorhinal cortex, where the cells coding for vectors to objects are largely distinct from those coding for nearby environmental boundaries 12. In contrast, subicular VTCs appear to embody a global integrated representation of the entire environment, incorporating its boundaries, its objects, and the relationships between all these. Overall, VTCs suggest a vector-based model of computing spatial relationships between an agent and multiple cues (or between different cues), freed from the constraints of direct perception of those cues, thus enabling spatial planning and imaginative cognition 6–8.
The duration of VTC memory traces in our study is on the order of 3 hours. A previous study of lateral entorhinal neurons 36 reported much longer memory traces (several days) for a familiar object in a familiar object location, but only following extensive pretraining (typically 20 or more training sessions) to this standard object-location configuration. Indeed, in experimental conditions more similar to our own, lateral entorhinal neuron memory traces for the familiar object at novel locations, and for novel objects at novel locations, had disappeared by 3-4 hours 36. Future work should investigate how cue exposure conditions affect the duration of VTC memory traces, and whether memory trace duration is related to successful memory recall at the behavioral level.
The relative abundance and scarcity of VTCs in the distal and proximal subiculum, respectively, provide very clear in vivo electrophysiological evidence for hypothesised spatial memory specialisation along the CA1/subiculum proximal-distal pathway 5,18,19,23, and provide a cellular substrate for the demonstration that selective inactivation of distal subiculum disrupts spatial memory 18. This strong functional difference dovetails with our novel findings of remarkably different theta phase preference in the distal and proximal divisions of the subiculum: referenced to the same theta LFP signal, both cue-responsive cells and other cells in the distal subiculum fired 50-60° earlier than their proximal counterparts. This seemingly parallel temporal organization in subiculum is consistent with anatomical and physiological evidence of differential pathways along the hippocampal transverse axis 17–19,26. Distal subiculum, proximal CA1 (and likely distal CA3) form one stream preferentially linked to anterior thalamus, medial entorhinal, presubicular, and parahippocampal cortices, while proximal subiculum, distal CA1 (and likely proximal CA3) form another linked to amygdala, lateral entorhinal, perirhinal and piriform cortices 5,18,19,23,38,39. Taken together, our findings suggest pronounced functional and temporal organisational differences between the distal and proximal divisions in the subiculum.
Finally, we note that, consistent with encoding-vs-retrieval scheduling and dual-input control models of theta 4,28,29, all cue-responsive neurons encoded the presence of an inserted cue using an earlier phase of theta. The shift to earlier phase was specific to the cue-field, therefore not driven by global state changes nor, given the range of vectors especially in VTCs, restricted to a region in space. Rather, theta phase appeared to define a specific information channel for the presence of a newly-inserted cue within each neuron. Furthermore, the degree of relative late-to-early shift, within each neuron, was linked to whether a trace field would be formed. Thus our findings extend theta-scheduling models 4,28,29 by demonstrating theta-phase shift as a neural substrate for memory encoding. It will be important to determine the VTC-specific factors, such as particular anatomical inputs and/or enhanced plasticity, underlying VTCs’ theta-linked propensity to generate trace fields.
An important question is whether VTCs represent a novel class of neuron, characterised by their intrinsic property of exhibiting vector trace memory in many circumstances, or whether, instead, VTCs reflect a novel type of neuronal response, which could potentially be exhibited by most subicular neurons, given the appropriate experimental context. Deshmukh & Kneirim 13 argue in this vein that, for example, time cells 40 and splitter cells 41 in CA1 are better viewed as types of responses of CA1 pyramidal cells, rather than distinct types of neurons. Although we cannot currently give a definitive answer to this question, three lines of evidence argue for the former possibility that VTCs represent a class of neuron. Firstly, VTCs exhibit specific spatial firing, anatomical and physiological features (namely, longer vector distance tunings, concentration in distal subiculum and larger theta phase changes in response to cues, respectively) that could not have been predicted on the basis of the original classification criteria. In our view, this increases the likelihood that VTCs describe a specific category of neuron, rather than a type of neuronal response. Secondly, RNA sequencing and tract-tracing studies indicate that the subiculum does contain discrete categories of cell (in contrast to CA1, which does not contain such discrete categories) 42–44, thereby raising the possibility that VTCs represent the functional counterpart of one or more of these anatomical/genetic categories. Thirdly, non-trace cells exhibited a significant tendency to not produce trace responses across multiple cue types, suggesting that the lack of a trace response may be an intrinsic cell property (Extended Data Fig 2A, B). However, we can currently only present anecdotal evidence to suggest that VTCs intrinsically form memory traces for multiple cue types (Extended Data Fig S2C, D): further specific experiments are needed to definitely answer this question. Furthermore, we also note residual elevated firing is present even in the cue field of non-trace cells (Extended Data Fig S10): this may be due to imperfect classification, or may suggest lower levels of memory response across a broader range of subiculum neurons. Overall, further experiments are required to definitively conclude that VTCs represent a class of neuron, and, if so, how this functional class maps onto anatomically/genetically defined categories of subiculum neurons.
Intriguingly, the distance tunings of the vectors were typically longer for trace vectors in the post-cue trial than perceptual vectors in the cue-present trial. In other words, a given vector trace field (memory recall) implies the cue was located further away than its earlier real location (during perception/encoding). This finding is reminiscent of two findings from human navigation research: 1) Short navigational distances are often over-estimated in memory 45,46; 2) Distances to viewed objects-in-context are routinely overestimated when remembered, with this bias being hippocampus-dependent 47. We speculate that the lengthening of VTC distance tunings when recalling objects may be a neural substrate for these psychological phenomena.
We have shown a code for vector memory in the subiculum for vectors in 2-dimensional physical space. It seems increasingly likely that the hippocampal formation can use 2-D vector-based codes of a more abstract nature to serve cognition beyond navigation6–9,48. For example, grid cells can both support vector calculations for navigation49, and are able to encode a space defined by continuous abstract variables such as object features 8 implying that vector representations may be used to organize conceptual or semantic memories into quasi-physical spaces. Consistent with this, for instance, hippocampal activity during virtual social interactions varies with social distance defined by a vector in an abstract space involving a social power dimension and a social affiliation dimension50. In summary, we suggest that given VTCs’ flexible responsiveness to diverse cues both within and at bounding perimeters, subicular VTCs constitute a powerful universal code for long-term vector memory in the hippocampal formation, of utility in spatial and non-spatial cognition.
Methods
Subjects
Six male Lister Hooded rats, weighing 392-522g (aged 3-5 months) at the time of surgery, were used as subjects. All rats were maintained on a 12:12 hour light:dark schedule (with lights off at 10:00am, all animals tested during their dark phase). Food deprivation (after rats had recovered from surgery) was maintained during recording periods such that subjects weighed 85-90% of free feeding weight. All experiments were performed under the Animals (Scientific Procedures) Act 1986. Approval for the animal experiments was granted by both Durham University AWERB and UK Home Office Project and Personal Licenses.
Surgery and Tetrode implants
Under deep anaesthesia (Isoflurane: 1-3%) and using intra- and post-operative analgesia (Buprenorphine, 0.04mg/kg), rats were chronically implanted with two microdrives (one above the dorsal subiculum of each hemisphere). These microdrives allowed 4 or 8 tetrodes to be vertically lowered through the brain. The 8-tetrode loaded microdrives (implanted in four rats) used custom 3D-printed barrels to create a 4 x 2 tetrode array (150μm spacing between barrel holes). With the 4-tetrode loaded microdrives (implanted in two rats), all the tetrodes were loaded using a single cannula. Tetrodes were constructed from HM-L coated platinum-iridium wire (90%/10%, California Fine Wire, 25μm). The details of tetrode mapping for each drive were recorded using photographs and notes both before surgery and after perfusion.
Subiculum: Implant co-ordinates and histology
Our implants targeted the anterior portion of the dorsal subiculum. The skull coordinates used for insertion of the centroid of the tetrode array were based upon51 in the following range: AP: -5.8 to -6.4 mm; ML: ±2.9-3.3 mm. Details of recording sites were reconstructed using records of electrode movement, physiological markers and post-mortem histology. The rats were killed and perfused transcardially with saline followed by 4% paraformaldehyde. Each brain was sliced coronally into 40-μm thick sections, mounted and Nissl-stained (using Cresyl-Violet or Thionin) for visualisation of the electrode tracks/tips. Digital photomicrographs were converted from colour to black and white, and contrast and brightness adjusted, using Photoshop Express 3.5. Data from recording sites in CA1 or dorsal presubiculum were excluded, and recording sites in subiculum were classified as being located in either the Proximal subiculum or Distal subiculum (see next section). Representative recording locations are shown in Figure 5.
Parcellating the subiculum into Proximal and Distal zones
The proximodistal axis has long been thought to be important in the functional anatomy of the subiculum: the distal subiculum, proximal CA1 (and likely distal CA3) form a stream linked to spatial memory, with the proximal subiculum, distal CA1 (and likely proximal CA3) forming a stream linked to object memory (e.g. 17–19,23,26,38,39,43,52–58). In the Subiculum, the Proximal pole abuts CA1, and the Distal pole abuts the Retrosplenial cortex/Presubiculum. In the present study, the coronal sections were used to classify recording sites as belonging to either the Proximal zone, consisting of the third closest to CA1, or to the Distal zone, consisting of the two-thirds furthest from CA1. The rationale for this approach was twofold. First, the Distal two-thirds of the Subiculum define a region that projects heavily to cortical regions linked to spatial memory (Medial Entorhinal, Retrosplenial, dorsal Presubicular and Parasubicular cortices; e.g. 43,57,59. Second, the Proximal Subiculum (termed ‘Prosubiculum’ in 19,43,60 as defined by gene and protein expression patterns, occupies approximately one-third of the Proximodistal extent of the aπterodorsal Subiculum (see coronal sections #81-89 in Supplementary Figure 1 of 19; also see 61 .
Electrophysiological recording
Rats were allowed a week to recover post-operatively before screening sessions began. During screening and inter-trial intervals, the rat rested on a square, holding platform (40cm sides, 5cm high ridges) containing sawdust. Tetrodes were gradually lowered towards the Subiculum pyramidal layer over days/weeks. Tetrodes were left to stabilize for least twenty-four hours after tetrode movement before recording commenced. Electrophysiological data from screening and recording sessions was obtained using Axona DACQ systems (DacqUSB). Electrode wires were AC-coupled to unity-gain buffer amplifiers (headstage). Lightweight wires (~4 meters) connected the headstage to a pre-amplifier (gain 1000). The outputs of the pre-amplifier passed through a switching matrix, and then to the filters and amplifiers of the recording system (Axona, UK). Signals were amplified (6.5-14K) and band-pass filtered (500 Hz-7kHz). Each channel was continuously monitored at a sampling rate of 50 kHz and action potentials were stored as 50 points per channel (1ms, with 200 μs pre-threshold and 800μs post-threshold) whenever the signal from any of the 4 channels of a tetrode exceeded a given threshold. Local-field potential (LFP) signals were amplified 3.5-5K, band-pass filtered at 0.34-125 Hz and sampled at 250 Hz. Two arrays of infrared light-emitting diodes (LEDs), one array larger than the other for tracking discriminability, were attached to the rat’s head to track head position and orientation using a video camera and tracking hardware/software (DacqUSB, Axona, UK). The arrays of LEDs were positioned such that the halfway position between the two arrays was centred above the rat’s skull. Offline analysis defined this halfway position as the position of the rat (TINT, Axona, UK). Positions were sampled at 50Hz.
Testing laboratory and Recording Environments
External cues such as a lamp, PC monitor and cue cards on the walls provided directional constancy throughout the test trial series. For every trial, the rat was carried directly from the holding platform with its head facing towards the recording arena. During trials, the rat searched for grains of sweetened rice randomly thrown into the box about every 30 seconds. At the end of each trial, the rat was removed from the recording environment, and placed back on the holding platform until the next trial. Inter-trial intervals varied from 10 minutes to an hour but were typically around 25 minutes. The standard recording environment was a square box (100x100x50cm high) painted in ‘light rain’ grey. Occasionally, for more distally tuned cells, a larger, same coloured environment was used (either 150x150x50cm high or 150x190x50cm high). Four types of cue, introduced into the box during the ‘Cue trial’, were used (refer to Fig 1 for diagrams): a black painted barrier (50x2.5x50cm high); three wooden black bricks juxtaposed along their long axis (20x9.5x4.5cm high), thus creating an 60x28.5x4.5cm high cue; a high-contrast white stencil-painted stripe (60x10x0cm high) acting as a purely visual cue; and wine bottles (base diameter 7cm, 30cm high) painted with different large, high-contrast patterns and/or affixed with somatosensorily-different patches. In some trials, only one bottle was inserted into the environment. In other trials, two or more bottles were inserted in different configurations: tightly-juxtaposed in an array to create a continuous barrier; placed apart to create a linear spaced array; or placed apart in different regions of the box.
Standard test trial sequence and variants
The standard test trial sequence consisted of three consecutive trials: 1) a ‘Pre-cue trial’ in which the recording box contained no cue; 2) a ‘Cue trial’ in which the box contained one of the above-mentioned four types of cue; 3) a ‘Post-cue trial’ in which the box again contained no cue. In a minority of sessions, one variant of the standard test sequence was that more than one cue trial was run successively before the Post-cue trial. In this case, only the first Cue trial was used to define the cue field and cue responsiveness of the neuron. This procedure had no significant effect on the probability of a trace response arising (successive multiple cue trials 42% trace, single cue trials of matched cue type [barrier], 33% trace; Z-test for proportions: Z=0.84, p = 0.40). In other cases, the experimental session was extended to include a repeat of the standard three-trial sequence (Pre-cue trial, Cue trial, Post-cue trial), most often with physically different cues. In these cases, only the single cue trial with the strongest cue-elicited field (i.e. highest integrated firing rate, see description below), and its accompanying Pre-cue and Post-cue trials were selected for main analysis. Responses to the full set of cues are described in Extended Data Fig 2.
Extended post-cue trial sequences including rotation trials
In some sessions, two or more Post-cue trials were run successively. This enabled evaluation of how long trace fields persisted in the recording box in the continued absence of the cues that elicited them. In some instances, we also included a ‘rotation’ trial in this Post-cue trial sequence to test for the potential influence of uncontrolled local odour cues upon trace fields. Rotation trials took two forms. 1) The local, intra-box cues (box-and-floor ensemble) was rotated 90° anticlockwise with respect to room. 2) External cues such as lamps and tables were rotated, while the intra-box cues maintained their orientation with respect to the testing room. As trace fields failed to rotate in all cases of type (1) rotation (see Figure 2), these trials were also included in the analysis evaluating how long trace fields persisted in the recording box, in the absence of cue objects.
Cell isolation
Cluster cutting to isolate single units was performed using a combination of KlustaKwik v3 62 and manual isolation using TINT (Axona, UK). All the trials from a given session were loaded into Tint as a merged dataset, which was clustered using KlustaKwik’s principal component analysis. Subsequent manual adjustments were made where necessary. Once merged-trial cutting was complete, cell clusters were automatically split into each individual trial of that session (Axona MultiCutSplitter).
Firing Rate Maps
Firing rate maps for all recorded neurons were produced by first dividing the recording arena into a grid of 2x2cm square spatial bins, and finding the summed occupancy time and number of spikes fired in each bin. Summed occupancy and spiking maps were then smoothed with a 10x10cm boxcar kernel, and rate maps were constructed by dividing summed spiking by summed occupancy. Data from periods of immobility (movement speed <5cm/s) were excluded from rate maps, so as to restrict the analysis to neural firing from theta epochs, and exclude firing occurring during sharp-wave ripple epochs. Removal of immobility produced a very small but significant increase in the within-trial spatial stability of firing. A similar, but non-significant, trend was observed for firing specifically within the cue field (Supplementary Fig. 1).
Definition of cue fields and cue-responsive neurons
New firing fields generated by the insertion of a cue were detected as follows. First, firing rate maps were converted to z-scores, to allow comparison between different trials even following trial-to-trial fluctuations in firing rate. For each map, values for each bin had the overall mean firing rate subtracted, and were then divided by the overall variance of the firing rate across bins. Following this, the z-scored pre-cue map was subtracted from the z-scored cue map, thus producing a map describing where firing was increased specifically during the cue trial, relative to the pre-cue trial. Cue fields were then defined as contiguous regions of the resulting map with a value ≥ 1. If more than one cue field was present, only the largest was used for further analysis. Cue-responsive cells were defined as those where the sum of z-scored firing rate, within the cue field, was ≥70.
Definition of Trace and Overlap scores
To define Trace and Overlap scores, Cue and Post-cue firing rate maps were z-scored, and the Pre-cue map was subtracted from both, so as to highlight changes in firing relative to the Pre-cue trial. (Same procedure as described above, ‘Definition of cue fields and cue-responsive neurons’). The Trace score was defined as the mean value of z-scored firing within the cue field region (as defined above) in the Post-cue trial, divided by the mean of z-scored firing within the cue field region in the cue trial. A Trace score of 1 therefore indicates a memory-based response of equal strength to that induced by the presence of the cue. To define the Overlap score, we first detected whether any new regions of firing existed in the Post-cue trial, relative to the Pre-cue trial: such ‘Post-cue’ fields were defined as contiguous regions of the (z-scored, Pre-cue subtracted) Post-cue map with value ≥1. If several Post-cue fields existed, only the largest was used for further analysis. If a Post-cue field was present, the Overlap score was defined as follows:
Where ∑FR in all cases refers to the summed firing rate in a region of the Post-cue trial rate map: ∑FRPost being the summed rate in the Post-cue field, ∑FRCue the summed rate in the cue field, and ∑FRov being the summed rate in the overlap between the Cue and Post-cue fields. Overlap score therefore assesses the average extent to which Post-cue field firing overlaps the cue field firing, and vice versa. Where no Post-cue field was present, the Overlap score was set to zero.
Spatially-randomised Trace and Overlap scores
To calculate whether the proportion of VTCs observed in our dataset exceeded that expected by chance, we constructed a population of Trace and Overlap scores derived from a spatially randomised dataset. Spatial randomization was performed by first calculating the cue field position from the cue map, as per normal analysis (see above). Then, the mask representing the region defined as the cue field was subjected to a random rotation and shift, before Trace and Overlap scores were calculated using Post-cue map. Spatially-randomised scores therefore assessed the presence of memory-based firing, in a spatially random part of the Post-cue trial. Spatial shifts of the cue field mask were subject to two constraints: 1) the shifted, rotated mask must lie entirely within the recording arena, 2) the shifted, rotated mask must not overlap with the pre-existing fields (‘Wall fields’) in the Pre-cue trial (defined as contiguous areas with z-scored firing ≥ 1). This process was repeated 1000 times for each neuron. Finally, VTCs were then defined as cells whose Trace scores were greater than the 90th percentile of the spatially-randomised Trace scores, and whose Overlap scores were greater than the 90th percentile of the spatially-randomised Trace scores
Vector Spatial Firing Analysis
To characterize how VTCs and non-trace cells fired as a function of vector displacement from the cue, we constructed vector displacement firing rate maps, akin to those in 12, which show the overall mean firing rate at each specific angular and distance displacement. However, the above-mentioned study calculated vector displacements by approximating the position of the (small) cue object as a point in space, which was not feasible for our data, where the many cues were extended objects (e.g. barriers). We therefore began by calculating the set of vector displacements to the cue object that occurred at each spatial bin (defined here as a bin in the 2-dimensional rate map): for each spatial bin, we calculated the mean distance to the cue in every angular vector bin. Only the sides of the cue object not occluded by other sides, given the spatial position under consideration, were considered. Distances for angles in which the cue was not encountered at all were set to a null value. Angular vector bins were 6° wide. Then, the vector displacement map, describing mean cell firing at displacement angles A 1 – A n and distances D 1 – D m, was constructed as follows. The value of vector map describing firing at angle = A and distance = D was defined as the mean of the firing rates of all those spatial bins where the displacement vector for angle A fell between the upper and lower limits of distance bin D. Distance bins were 2.5 cm wide. Intuitively, therefore, each bin in a vector displacement rate map shows the mean firing rates over all those spatial bins where at least one of the displacement vectors to the cue match the specified vector angle and distance.
Following the construction of vector displacement maps, vector tunings for each neuron were defined by first isolating contiguous areas of elevated firing in the vector map (> 1 standard deviation above mean for whole map), following this the distance and angle tuning were defined as the firing rate-weighted centroid of the largest contiguous area of elevated firing. In order to describe the vector-tuning of firing specifically linked to cue presence or cue memory, only spatial bins in the cue field (for cue tunings) and the post-cue field (for memory trace tunings) were used to construct the vector displacement map. Vector displacement maps for Wall fields in the pre-cue trial were constructed using the same methods as described above, with the exceptions that the vectors were calculated to the positions of the arena walls, instead of to cues, and only spatial bins in the Wall field contributed to the construction of the vector map. Cells for which the cue trial consisted of multiple separated objects were excluded from the vector analysis, due to the difficulty in resolving the ambiguity of which cue object firing fields represented the vector displacement to. Due to the physical constrictions of space within the arena around some objects, not all vector displacements can be sampled: these vectors are shown as dark grey in the vector maps. Vector maps were converted to a circular display, with upsampled, interpolated bins, to enhance their clarity and comprehensibility for display purposes only: all calculations described above were applied to a binned map of 6° angle bins and 2.5cm distance bins.
Theta firing phase analysis
Instantaneous theta phase was defined by filtering LFPs using a 5-11Hz bandpass filter, and taking the angle of the Hilbert-transformed filtered signal. The theta phase of each spike was defined as the phase of the temporally corresponding LFP sample, from the hemisphere-matched LFP in the distal subiculum with the highest signal-to-noise ratio for the theta oscillation. The signal-to-noise ratio for theta was defined as the mean power in the theta band (±0.5Hz around the highest power between 7-10Hz) divided by the mean power in the range 2-20Hz, excluding the theta band. Spectral power was estimated using the fast-fourier transform. The overall theta modulation of each neuron was estimated using the length of the resultant mean vector of phases. As with rate maps, speed filtering (>5cm/s epochs passing) was applied; only neurons firing ≥50 spikes whilst the animal occupied the relevant firing field (over the course of a whole trial), and with significant theta phase modulation (defined as Rayleigh test p < 0.01) were used for phase analysis63–65. This was done to remove the influence of noisy data. The preferred firing phase of each neuron, in each firing field, was defined as the circular mean of the spike phases, for spikes occurring whilst the rat was within the given firing field (Wall field, Cue field regions). The above steps were performed using custom-written Matlab scripts. Subsequent circular statistical analyses were conducted in Oriana 4 (see ‘Circular Statistics’ below).
Statistics
No statistical methods were used to pre-determine sample sizes (cell numbers). All available sessions where cue responsive cells were present and thus vector trace cells could have been observed (i.e. precue/cue/postcue trial series) were analysed. Our sample sizes were similar to sample sizes reported in previous publications 12,24,33–37. Cues were varied (see below) but there was no formal randomization in the organization of stimulus presentations. Data collection and analysis were not performed blind to the conditions of the experiments.
Data distribution in linear tests was assumed to be normal and with equal variance but this was not formally tested. Welch t-tests were applied to analysis of distance vectors, since these distributions across the VTC and non-trace groups were of unequal variance. All linear statistical tests were conducted as two-tailed. There are no equivalents to tail number choices in the circular statistical tests employed in this report, i.e. the three tests of departure from uniformity (Rayleigh R, Watson’s U2, and Kuiper’s V), and the Watson-Williams F-test.
Circular statistics: Theta phase data
After the Matlab steps described in the preceding section ‘Theta phase firing analysis’, theta phase data was analysed in Oriana 4 (Kovach computing).
Distributions of neuronal preferred phases (e.g. Distal cells, VTCs) were characterized by: the mean phase, i.e. the circular mean of the neuronal preferred phases, circular standard error of mean (in main text), 95% confidence limits (in figures), Rayleigh vector r, and Von Mises κ (indexing concentration). The difference between mean absolute preferred phases was tested using Watson-Williams F tests. The shift of preferred spike phase was defined by the circular phase difference between two given trials in a given cue or wall field, with the differences then tested using Watson-Williams F tests.
Circular statistics: Angular tunings in vector displacement maps
To test for multimodal departures from uniformity such as angular biasing by North-South and East-West oriented cue and wall placements, we first applied Rayleigh’s test of uniformity, then Watson’s U2 and Kuiper’s V tests 66. Rayleigh’s test is much more sensitive to unimodal departures from uniformity than Watson’s U2 and Kuiper’s V tests. When a distribution is far from departing from uniformity as indexed by Rayleigh’s unimodal test, but significantly departs from uniformity as indexed by the omnibus tests (Watson’s U2 and Kuiper’s V), we interpret this as consistent with showing multimodal departures from uniformity.
Reproducibility
There were no separate replication experiments. Reproducibility was inferred by the observation of vector trace cells in the distal subiculum of each of the six rats tested, with mean per-rat proportion (35%; breakdown 17% (3/17); 29% (20/68); 33% (2/6); 36% (15/42); 47% (8/17); 50% (21/42)) similar to total proportion (36%, shown in Figure 5B). Not all Subicular cue-responsive cell ensembles contained VTCs. However, some ensembles contained just one or two cue-responsive cells, and/or sampled only from proximal subiculum, where (as described in main text & Figure 5) VTCs are rare.
Extended Data
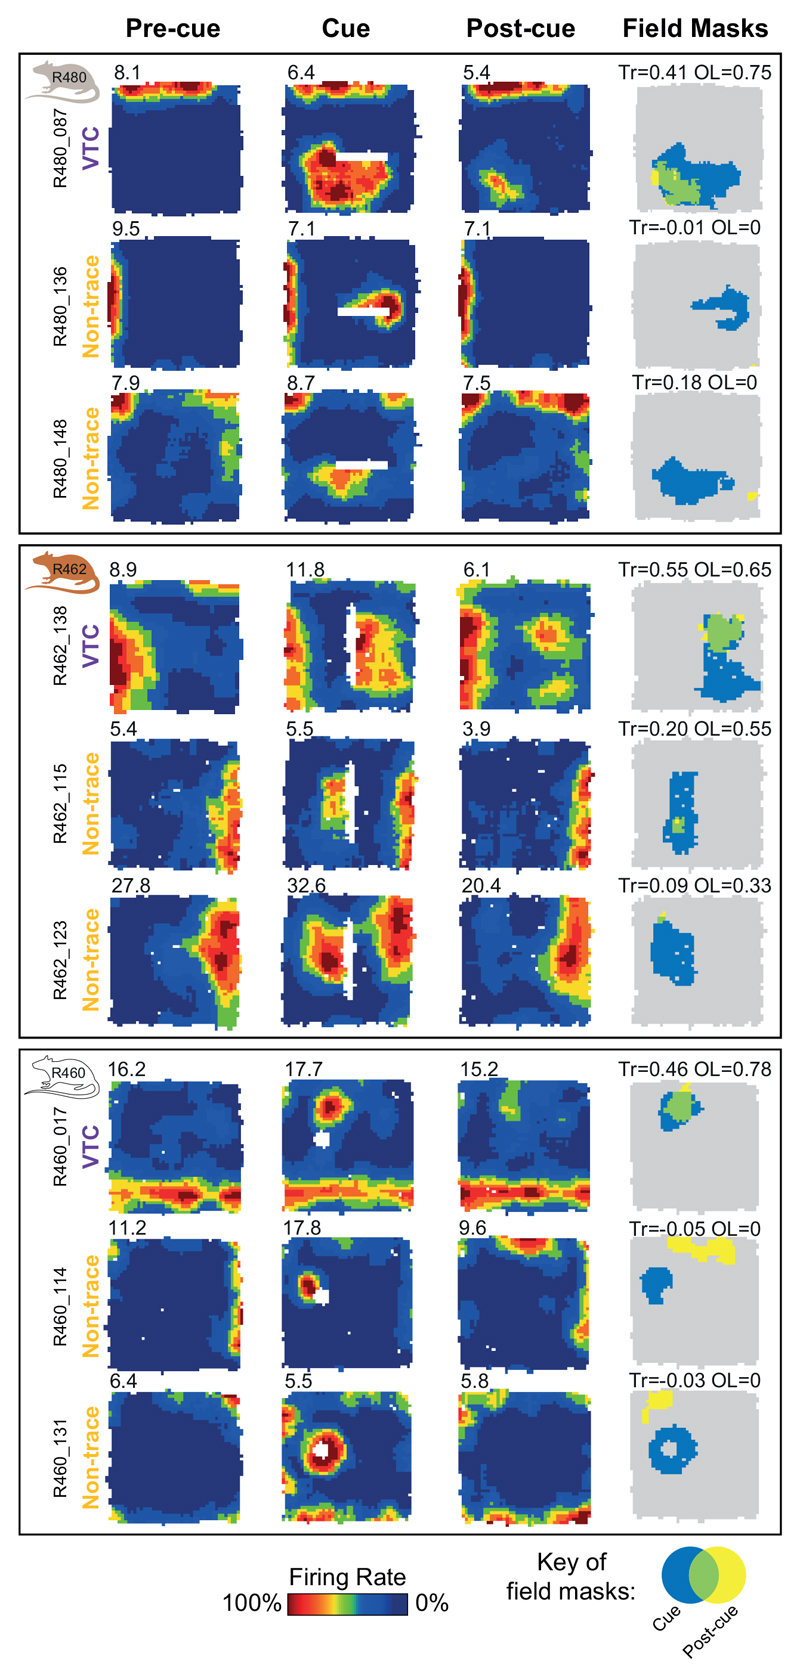
Extended Data Fig. 1. Co-recorded Vector Trace cells and Non-trace cells.
Firing rate maps of simultaneously-recorded Vector Trace cells (VTC) and Non-trace cells in three rats. Conventions as in Figure 1. Each row illustrates firing rate maps for one cell (peak-rate bin (Hz) top-left). Left column: Pre-cue trial. Left-middle column: Cue trial, where each cell forms a new firing field when the cue (white space) is introduced. Right-middle column: Post-cue trial. In VTCs (top row for each rat), following cue removal, the cue-responsive firing field persists. In contrast, in Non-trace cells, the cue-responsive firing field has diminished to below-threshold levels in the Post-cue trial. Right column: masks showing cue-responsive field (blue), post-cue field (yellow) and overlap between both (green). Trace (Tr) and overlap (OL) scores shown above each plot. Trace score value of non-trace cell R462_115 is 0.198, i.e. below Trace cell threshold of 0.20.
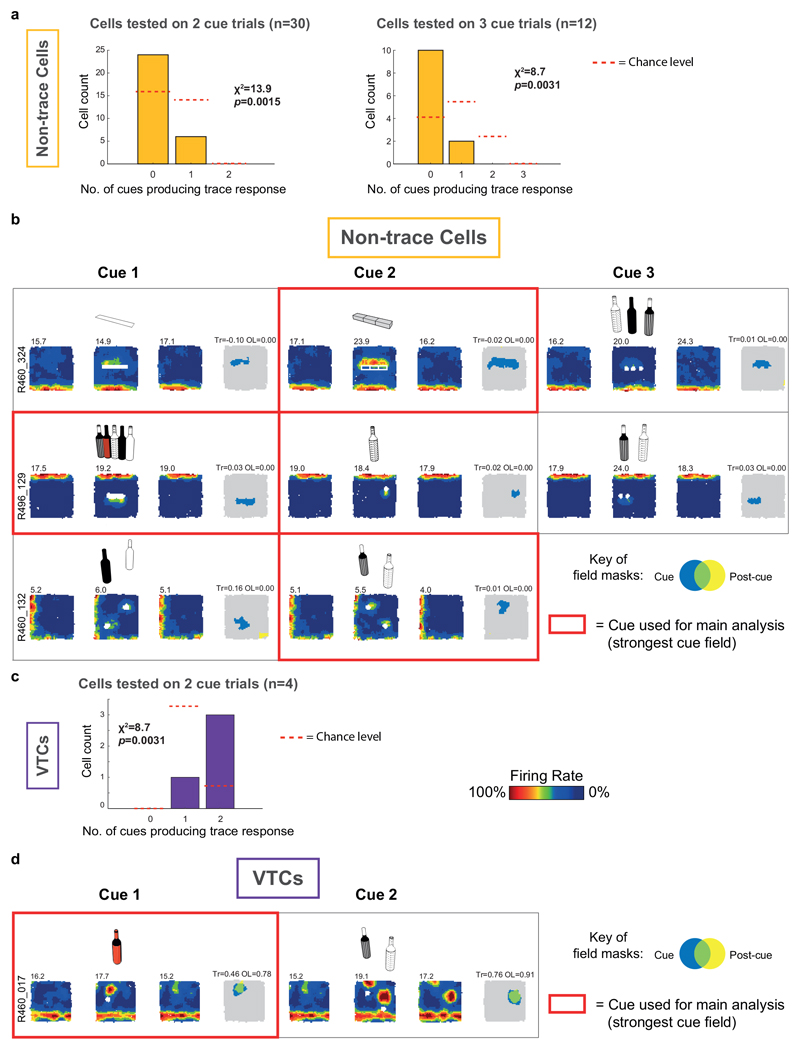
Extended Data Fig. 2. VTC and non-trace responses to multiple cue types.
(A) Occurrence frequency of trace responses across multiple cues, in non-trace cells. In the sub-set of cells exposed to multiple different cue trials in one experimental session, the cue that evoked the strongest cue field was used to classify the cell as VTC or non-trace (see Methods). Following this, the total number of cues which evoked a significant trace response was determined for each cell. Bar graphs in (A) show the numbers of non-trace cells exposed to two cue types (left) or three cue types (right) which were determined to show 0, 1 or 2 trace responses across the entire experimental session. (Data are split into 2-cue sessions vs 3-cue sessions to facilitate statistical testing). In both the two-cue and three-cue sessions, non-trace cells were significantly biased towards exhibiting fewer trace responses than expected by chance. Red dashed lines show chance levels, calculated under the assumption that, once a cell has been classified as non-trace on one trial, there is an independent 0.29/0.71 chance of observing a trace vs non-trace response for each further cue tested. (Chance levels equivalent to overall occurrence frequency of VTCs vs Non-trace cells amongst subiculum neurons). χ2 tests were used to assess the significance of the difference between the observed frequencies and those expected under chance assumptions: χ2 stats and significance levels are shown on the bar graphs (Y axis shows sample n). Note that chance levels are zero in the categories corresponding to trace responses occurring on all tested cues: non-trace cells must not exhibit a trace response on at least one cue by definition. (B) Three example non-trace cells recorded across 3 cue trials (top two rows) or 2 cue trials (bottom row), which never showed a trace response. Rectangular boxes contain each cue trial set (i.e. Pre-cue, Cue, Post-cue trials) for each cue that a cell was exposed to. Note that the Post-cue trial for one cue forms the Pre-cue trial for following cue, hence rate maps are repeated across cue trial sets. Cue trial sets outlined in bold red were those with the strongest cue field response, which were used for cell type classification, and contributed to the main analysis. Cartoons above each cue trial show the type of cue used. Figure conventions in (B) as per Figure 1. (C) Occurrence frequency of trace responses across multiple cues, in VTCs. Only a small number of VTCs are available to test (N=4) due to proportionally lower sampling of VTCs in multiple-cue sessions, and to the long-lasting nature of the trace response: as the Post-cue trial of one cue formed the Pre-cue trial of the following cue, trace responses to earlier cues prevented detection of cue responses to later cues. Only 4 VTCs were recorded in which cue-evoked responses can be detected across two different cue types. In these cells, more VTCs than expected by chance exhibited a trace response on both cue types. Assumptions for generation of chance levels and methods of statistical testing for (C) were as for (A). (D) One example VTC recorded across 2 cue trials, which showed a trace response on both cues. Black grid delineates each cue trial set (i.e. Pre-cue, Cue, Post-cue trials) for each cue run on each cell. Cue trial sets outlined in bold red were those with the strongest cue field response, which were used for cell type classification, and contributed to the main analysis. Cartoons above cue trial show the type of cue used.
Extended Data Fig. 3. Spatial firing in Pre-cue trial does not explain the position of trace fields in the Post-cue trial.
(A) Boxplots showing distributions of firing rate correlations across pre- and post-cue trials, restricted to those spatial bins within either the cue- or post-cue field. Boxes show 25th – 75th percentile, central line shows median. Whisker length is IQR x 1.5, data points beyond whiskers are shown as individual points. All analyses in this Figure based on n = 73 VTCs and n = 164 Non-trace cells, using two-tailed t-tests. Non-trace cells in which a post-cue field could not be defined (no elevated area of firing in post-cue compared to pre-cue trial could be detected) were excluded from this analysis. The mean correlation for both fields and both cell types are significantly greater than zero (T-test, Fisher-transformed r: VTC cue field, t72=9.5, p < 0.00001; VTC post-cue field, t72=9.7, p < 0.00001; Non-trace cue field, t163=11.0, p < 0.00001; Non-trace post-cue field, t163=15.8, p < 0.00001), indicating that some spatial structure of neuronal firing in the pre-cue trial is conserved in the Post-cue trial (despite the emergence of a trace field, in VTCs). However, for VTCs, the correlation observed is not significantly greater than the mean of a population of correlations derived from spatially-randomised Cue- and Post-cue field positions (see Methods; T-test Fisher-transformed r versus mean of shuffled population: VTC cue field, t72=1.14, p = 0.26; VTC Post-cue field, t72=1.65, p = 0.10), demonstrating that the Cue- and Post-cue fields are not areas of enhanced similarity between the Pre- and Post-cue fields, compared to the remainder of the rate map (excluding the Wall field). Grey dashed lines show medians of spatially-randomised r populations. For non-trace cells, correlations were significantly lower than the mean of the spatially randomized population within the cue field (t163 = 3.0, p = 0.003), but significantly higher than the spatially randomized population in the post-cue field (t163=8.33, p < 0.00001). (B) Histograms showing the distributions underlying the box plots in (A). Colored bars show distributions of within-field correlations, grey dashed lines show the cell- and field type-matched distributions of spatially randomized field correlations.
Extended Data Fig. 4. Analysis of wall vectors. Angular tunings between wall-field and cue-field vectors were similarly stable across VTCs and non-trace cells; VTCs’ distance tunings showed more variance and were longer than those of non-trace cells; distance tunings were longer for cue fields than wall fields in both cell types, but this was more pronounced in VTCs.
(A) Rate maps and vector plots for three representative VTCs, and three representative non-trace cells. Conventions as Fig.1A,B for first four columns. Conventions as Fig.2A,B for columns of vector plots: wall field vector in Pre-cue trial (5th column); cue field vector in Cue trial (6th column); and trace field (cue) vector in the Post-cue trial (7th column). Distance tuning scale is 0-60cm in all vector plots. (B) Scatterplots of angular tunings showing VTCs (left, n=64) and non-trace cells (right, n=132) showed stable angular tuning for wall-field vector in Pre-cue trial vs Cue-field vector in Cue trial. The overall mean angular difference between the wall-field and the cue field was 8.2 ± 4.4° (mean absolute angular difference: 26.2 ± 3.3°) for VTCs, and 0.9 ± 3.9° (mean absolute angular difference: 32.5 ± 3.0°) for Non-trace cells, with no difference between the cell types (Watson-Williams F1,194 = 1.32, p = 0.25; Welch t194 = 1.416, p = 0.16). For VTCs, the overall mean angular difference between the Pre-cue wall-field and the Post-cue trace field was similarly minimal at 4.1 ± 4.4° (mean absolute angular difference: 28.3 ± 2.9°). Thus, as expected, angular tunings were stable across wall fields and cue fields. The inter-trial absolute difference values involving the wall field show somewhat larger error than those in VTCs between the cue field and its trace field (19.5 ± 2.7°, see Fig 2E & main text), because square-walled environments are suboptimal for estimating angular orientation of vector fields67. (C) Histograms of distance tunings for VTCs (left) and Non-trace cells (right) for wall-field vector in Precue trial. Exactly as for cue field vectors’ distance tunings (main text, Fig.2C), VTCs’ distance tunings in their wall-field vectors showed a much wider variance than those of non-trace cells (F test variance ratio = 2.46, p < 0.001) and were longer than those of non-trace cells (Inset compares mean ± s.e.m. values: VTCs n=64: 14.1 ± 1.0cm; Non-trace n=132: 11.2 ± 0.4cm; Welch t194 = 2.605: p = 0.011). (D) Scatterplots of distance tunings for VTCs (left) and Non-trace cells (right) for wall-field vector in Pre-cue trial vs cue-field vector in Cue trial. Distance tunings were longer for cue field than wall field vectors in both cell types (VTCs: paired t63 = 5.04, p < 0.0001; Non-trace: paired t131 = 2.76, p = 0.007), and this lengthening effect was more pronounced in VTCs (Inset compares mean ± s.e.m. values: VTCs n=64: +4.9 ± 1.0cm; Non-trace n=132: +1.2 ± 0.4cm; Welch t194 = 3.435, p = 0.0009). All linear tests in this Figure were 2-tailed.
Extended Data Fig. 5. Extended Data Fig. 5 Preferred theta phase of firing in the distal subiculum occurs around a sixth of a theta cycle earlier than in the proximal subiculum.
(A and B) Polar histograms showing distribution of individual cell phases of cue responsive cells in the wall field area in the Baseline (Pre-cue) trial in the proximal subiculum (A) and in the distal subiculum (B). Phase distribution is more concentrated in the distal subiculum, where mean preferred phase occurs a sixth-cycle earlier than in the proximal subiculum (59.4 degrees earlier: Watson-Williams F test for difference between means: F1,225 = 68.50, p < 1x10-12). (C and D) Polar histograms showing distribution of individual cell phases for cells of all types (except cue-responsive cells above) in first baseline trial in the proximal subiculum (C) and in the distal subiculum (D). Similarly to cue-responsive cells, phase distribution is again more concentrated in the distal subiculum, and mean preferred phase occurs considerably earlier in the distal than proximal subiculum (53.2 degrees earlier: Watson-Williams F test for difference between means: F1,139 = 40.11, p = 3.1x10⁻⁹). Phases are divided into twenty 18-degree bins (0/360=peak;180=trough). Scale near 90-degree line (A), and zero-degree line (B,C,D) indicates number of cells in a given phase bin. Key: μ is mean phase (red line, red font text), r is length of Rayleigh vector (also indicated by length of red mean phase line, from centre to outer circumference), k is Von Mises’ k (indexing phase concentration). Grey curved caps depict +/-95% confidence limits. All phases are referenced to theta recorded from distal subiculum.
Extended Data Fig. 6. Preferred theta phase of firing shifts markedly earlier during cue-related encoding in both vector trace cells and non-trace cells.
Polar histograms showing distribution of individual cell phases in the cue field area whose mean phases (red lines, red-font text) and 95% confidence limits (grey curved caps at perimeter) are shown in Fig 6, for each of the two cell types: (A to C) trace cells, (D to F) non-trace cells, from Pre-cue trials (A,D), to Cue trials (B,E), to Post-cue trials (C,F). Preferred theta phase of firing is very stable across Pre-cue and Post-cue trials in both cell types. Notably, against this background of strong phase stability, preferred theta phase of firing is markedly earlier in both cell types during Encoding trials (Cue Trial: B,E) than during Baseline (Pre-cue Trial: A,D) and Retrieval (Post-cue Trial: C,F) trials (all Cue-vs-Pre-cue & Cue-vs-Post-cue F values >19.25, all p values < 1.82 x 10⁻⁵). Within-cell earlier shift in Encoding was greater in vector trace cells than non-trace cells (main text; Fig 6) There were no within-trial, across-cell-type, absolute-phase differences (Watson-Williams F tests: Pre-cue trial: F1,150 = 0.55, p = 0.46; Cue-trial: F1,180 = 2.81, p = 0.10; Post-cue trial: F1,160 = 0.69, p = 0.41). Phases are divided into twenty 18-degree bins (0/360:peak,180:trough). Vertical scale near zero-degree line indicates number of cells in a given phase bin. Key: μ is mean phase (red line, red font text), r is length of Rayleigh vector (also indicated by length of red mean phase line, from centre to outer circumference), k is Von Mises’ k (indexing phase concentration). Grey curved caps depict +/- 95% confidence limits.
Extended Data Fig. 7. Preferred theta phase of firing is highly stable across trials in the wall field in both vector trace cells and non-trace cells.h.
Polar histograms detailing distribution of individual cell phases in the wall field area whose mean phases (red lines, red-font text) and 95% confidence limits (grey curved caps at perimeter) are shown in Figure 6B, for each of the two cell types: (left column) trace cells, (right column) non-trace cells, from Pre-cue trials (A), to Cue trials (B), to Post-cue trials (C). Across-trial preferred theta phase of firing is very stable (Watson-Williams F tests comparing within-cell-type, across-trial, phase distributions: 2x3=6 tests; all 6 test F values < 0.083, all p values > 0.77). There were no within-trial, across-cell-type differences (Pre-cue; F1,180 = 1.70, p = 0.19; Cue: F1,179 = 2.31, p = 0.13; Post-cue: F1,182 = 2.79, p = 0.10). Phases are divided into twenty 18-degree bins (0/360=peak; 180=trough). Vertical scale near zero-degree line indicates number of cells in a given phase bin. Key: μ is mean phase (red line, red font text), r is length of Rayleigh vector (also indicated by length of red mean phase line, from centre to outer circumference), k is Von Mises’ k (indexing phase concentration). Grey curved caps depict +/- 95% confidence limits.
Extended Data Fig. 8. Earlier-going shift in theta phase preference in the cue field is larger in vector trace cells than non-trace cells.
Polar histograms detailing distribution of phase difference data summarized in Figure 6B for Baseline-Encoding comparisons (A,B) and Retrieval-Encoding comparisons (C,D) for VTCs (left column) and non-trace cells (right column). Differences are expressed as Precue-minus-Cue trial (Baseline-Encoding) and Postcue-minus-Cue trial (Retrieval-Encoding). The earlier-going phase shift in the cue field was larger in distal VTCs than distal non-trace cells, both for the baseline-vs-encoding comparison (A): Precue-Cue: Watson-Williams F1,146 = 5.72, p = 0.018), and the retrieval-vs-encoding comparison (C): Postcue-Cue: Watson-Williams F1,157 = 4.29, p = 0.04). In contrast, the baseline-vs-encoding (B) and retrieval-vs-encoding differences (D) in the wall field were similarly concentrated near zero for both VTCs and non-trace cells (Precue-Cue (B): Watson-Williams F1,174 = 0.17, p = 0.68; Postcue-Cue (D): Watson-Williams F1,178 = 0.01, p = 0.92). Note appreciably higher concentrations of phase (indexed by Von Mises’ k) around the zero-difference values in wall fields than cue fields in both cell types, indicative of stability of theta phase in the wall field. Phases are divided into twenty 18-degree bins (0/360=peak; 180=trough). Vertical scale near 180-degree line indicates number of cells in a given phase bin. Key: μ is mean phase (red line, red font text), r is length of Rayleigh vector (also indicated by length of red mean phase line, from centre to outer circumference), k is Von Mises’ k (indexing phase concentration). Grey curved caps depict +/- 95% confidence limits.
Extended Data Fig. 9. Examples of simultaneously-recorded vector trace cell pairs, demonstrating phase changes are specific to cue-driven firing, and not linked to one region in the recording arena.
(A and B) Simultaneously-recorded pairs of vector trace cells in two rats. Columns left to right: rate maps for each cell across trials (Pre-cue, Cue, Post-cue), field masks (Cue and Post-cue), and preferred (mean) theta phase of firing in Encoding and Retrieval trials (‘Theta phase in cue field region’). These examples show that the same cue (A: 4.5cm high brick array; B: 50cm high wall) elicits, in simultaneously-recorded cells, trace fields occupying different areas of the box, far from each other. VTC firing at earlier theta phase is specifically linked to the cue-driven firing field for each cell, and, across cells, is dissociated from the rat’s position.
Extended Data Fig. 10. Firing rates in VTC and non-trace cells in distal subiculum can be dissociated from phase.
Boxplots showing distributions of mean neuronal firing rates in the cue field (A) and wall field (B), in both VTCs and Non-trace cells in distal subiculum. Boxes show 25th – 75th percentile, central line shows median. Whisker length is IQR x 1.5, data points beyond whiskers are shown as individual points. One possible account of changes in preferred phase (e.g. following cue insertion), is that these may reflect high-rate and low-rate regimes of firing respectively, under models of theta phase precession in which higher depolarisation drives earlier phase of firing68,69 but see, 70. Here we show that, by contrast, phase and firing rate can be dissociated, in particular in the Post-cue trial. Consistent with our cell-type classifications, VTC firing rates were significantly greater than Non-trace cell firing rates in the cue field area in the Post-cue trial (A: 2-way mixed ANOVA cue field firing rates: Trial*Cell type; F2,284 = 8.1, p < 0.001; Post-hoc Simple Main Effects VTC vs Non-trace: Pre, p = 0.63; Cue, p = 0.137; Post, p < 0.001. N Cells = 56 VTCs, 88 Non-trace cells. Cells were filtered as for phase analyses: cells without theta modulation [Rayleigh p>0.01] or <50 spikes in cue field were excluded). By contrast, there was no difference in the preferred phase of VTC and Non-trace cells, in any trial, including the Post-cue trial (see Fig. 6, Extended Data Fig. 6, Watson-Williams F tests: Pre-cue trial: F1,150 = 0.55, p = 0.46; Cue-trial: F1,180 = 2.81, p = 0.10; Post-cue trial: F1,160 = 0.69, p = 0.41). There is therefore no significant difference between VTCs and Non-trace firing rate in the cue trial which could explain the greater earlier-ghoing phase shift. Furthermore, there is a strong dissociation between phase and rate in the Post-cue trial, whereby VTC rates are significantly higher than Non-trace cell rates, but preferred phase is strongly similar for the two classes of neuron. We note that, even in Non-trace cells, firing rates in the cue field increase between the Pre- and Post-cue trials (Simple Main Effects, p = 0.005), possibly due to imperfect classification of VTC versus Non-trace cells, or due to some residual memory-based firing occurring even in non-trace cells. In the wall field (B), VTCs showed significantly greater firing rates overall (2-way mixed ANOVA wall field firing rates: Trial; F2,352 = 6.9, p = 0.001), but no cell-type specific changes in firing across trials (Trial*Cell type; F2,352 = 0.65, p = 0.52. N Cells = 66 VTCs, 112 non-trace cells. Cells were filtered as for phase analyses: cells without theta modulation [Rayleigh p>0.01] or <50 spikes in wall field were excluded). All linear tests in this Figure were 2-tailed.
Supplementary Material
Reporting Summary.
Further information on the software and methods relevant for this study is available in the Nature Research Reporting Summary.
Acknowledgments
We thank the three referees for their constructive comments. We thank E. Stanton, A. Long and S. Thurlbeck for technical assistance. We thank N. Burgess and D. Bush for helpful comments on an earlier version of this manuscript. We acknowledge funding from the BBSRC (BB/M008975/1 to CL & co-I TJW; BB/T014768/1 to CL & co-I SP); the Royal Society (UF100746 to TJW); the MRC (MR/N026012/1 to TJW) and start-up funds from CIMEC, Trento, Italy (SAL).
Footnotes
Author contributions
SP and CL conceptualised and designed the study. SP performed the experiments. SP, TJW and CL analysed the data and wrote the manuscript. SAL contributed to conceptualisation, experimental design and training. JD contributed to training, surgery and histology. CL, SP, TJW and SAL contributed to funding acquisition. All the authors discussed the results and contributed to the manuscript.
Competing Interests Statement
The authors declare no competing interest.
Code Availability Statement
Key custom Matlab code, including that for defining Trace and Overlap scores, and constructing vector rate maps, will be made publicly available at: https://github.com/WillsCacucciLab/VectorTraceCode
Data Availability Statement
Data are available upon reasonable request from the authors.
References
- 1.Okeefe J. PLACE UNITS IN HIPPOCAMPUS OF FREELY MOVING RAT. Exp Neurol. 1976;51:78–109. doi: 10.1016/0014-4886(76)90055-8. [DOI] [PubMed] [Google Scholar]
- 2.Taube JS, Muller RU, Ranck JB., Jr Head-direction cells recorded from the postsubiculum in freely moving rats. I. Description and quantitative analysis. J Neurosci. 1990;10:420–435. doi: 10.1523/JNEUROSCI.10-02-00420.1990. [DOI] [PMC free article] [PubMed] [Google Scholar]
- 3.Hafting T, Fyhn M, Molden S, Moser MB, Moser EI. Microstructure of a spatial map in the entorhinal cortex. Nature. 2005;436:801–806. doi: 10.1038/nature03721. [DOI] [PubMed] [Google Scholar]
- 4.Hasselmo ME. How We Remember: Brain Mechanisms of Episodic Memory. MIT Press; 2012. [Google Scholar]
- 5.Poulter S, Hartley T, Lever C. The Neurobiology of Mammalian Navigation. Current Biology. 2018;28:R1023–R1042. doi: 10.1016/j.cub.2018.05.050. [DOI] [PubMed] [Google Scholar]
- 6.Epstein RA, Patai EZ, Julian JB, Spiers HJ. The cognitive map in humans: spatial navigation and beyond. Nat Neurosci. 2017;20:1504. doi: 10.1038/nn.4656. [DOI] [PMC free article] [PubMed] [Google Scholar]
- 7.Bicanski A, Burgess N. A neural-level model of spatial memory and imagery. eLife. 2018;7:e33752. doi: 10.7554/eLife.33752. [DOI] [PMC free article] [PubMed] [Google Scholar]
- 8.Constantinescu AO, O’Reilly JX, Behrens TEJ. Organizing conceptual knowledge in humans with a gridlike code. Science (New York, NY) 2016;352:1464–1468. doi: 10.1126/science.aaf0941. [DOI] [PMC free article] [PubMed] [Google Scholar]
- 9.Bellmund JLS, Gärdenfors P, Moser EI, Doeller CF. Navigating cognition: Spatial codes for human thinking. Science. 2018;362:eaat6766. doi: 10.1126/science.aat6766. [DOI] [PubMed] [Google Scholar]
- 10.Hartley T, Burgess N, Lever C, Cacucci F, O’Keefe J. Modeling place fields in terms of the cortical inputs to the hippocampus. Hippocampus. 2000;10:369–379. doi: 10.1002/1098-1063(2000)10:4<369::Aid-hipo3>3.0.Co;2-0. [DOI] [PubMed] [Google Scholar]
- 11.Lever C, Burton S, Jeewajee A, O’Keefe J, Burgess N. Boundary Vector Cells in the Subiculum of the Hippocampal Formation. J Neurosci. 2009;29:9771–9777. doi: 10.1523/jneurosci.1319-09.2009. [DOI] [PMC free article] [PubMed] [Google Scholar]
- 12.Hoydal OA, Skytoen ER, Andersson SO, Moser MB, Moser EI. Objectvector coding in the medial entorhinal cortex. Nature. 2019;568:400–404. doi: 10.1038/s41586-019-1077-7. [DOI] [PubMed] [Google Scholar]
- 13.Deshmukh SS, Knierim JJ. Influence of local objects on hippocampal representations: Landmark vectors and memory. Hippocampus. 2013;23:253–267. doi: 10.1002/hipo.22101. [DOI] [PMC free article] [PubMed] [Google Scholar]
- 14.Bicanski A, Burgess N. Neuronal vector coding in spatial cognition. Nature Reviews Neuroscience. 2020;21:453–470. doi: 10.1038/s41583-020-0336-9. [DOI] [PubMed] [Google Scholar]
- 15.Gallistel CR. THE ORGANIZATION OF LEARNING. 1990 [Google Scholar]
- 16.Poucet B. Spatial cognitive maps in animals: new hypotheses on their structure and neural mechanisms. Psychol Rev. 1993;100:163–182. doi: 10.1037/0033-295x.100.2.163. [DOI] [PubMed] [Google Scholar]
- 17.Witter MP, Groenewegen HJ. The subiculum: cytoarchitectonically a simple structure, but hodologically complex. Prog Brain Res. 1990;83:47–58. doi: 10.1016/s0079-6123(08)61240-6. [DOI] [PubMed] [Google Scholar]
- 18.Cembrowski MS, et al. Dissociable Structural and Functional Hippocampal Outputs via Distinct Subiculum Cell Classes. Cell. 2018;173:1280–1292.e1218. doi: 10.1016/j.cell.2018.03.031. [DOI] [PubMed] [Google Scholar]
- 19.Bienkowski MS, et al. Integration of gene expression and brain-wide connectivity reveals the multiscale organization of mouse hippocampal networks. Nat Neurosci. 2018;21:1628–1643. doi: 10.1038/s41593-018-0241-y. [DOI] [PMC free article] [PubMed] [Google Scholar]
- 20.Roy DS, et al. Distinct Neural Circuits for the Formation and Retrieval of Episodic Memories. Cell. 2017;170:1000–1012.e1019. doi: 10.1016/j.cell.2017.07.013. [DOI] [PMC free article] [PubMed] [Google Scholar]
- 21.Nitzan N, et al. Propagation of hippocampal ripples to the neocortex by way of a subiculum-retrosplenial pathway. Nature Communications. 2020;11 doi: 10.1038/s41467-020-15787-8. 1947. [DOI] [PMC free article] [PubMed] [Google Scholar]
- 22.Braga RM, Van Dijk KRA, Polimeni JR, Eldaief MC, Buckner RL. Parallel distributed networks resolved at high resolution reveal close juxtaposition of distinct regions. J Neurophysiol. 2019;121:1513–1534. doi: 10.1152/jn.00808.2018. [DOI] [PMC free article] [PubMed] [Google Scholar]
- 23.Knierim JJ, Neunuebel JP, Deshmukh SS. Functional correlates of the lateral and medial entorhinal cortex: objects, path integration and local-global reference frames. Philosophical transactions of the Royal Society of London Series B, Biological sciences. 2014;369:20130369–20130369. doi: 10.1098/rstb.2013.0369. [DOI] [PMC free article] [PubMed] [Google Scholar]
- 24.Olson JM, Tongprasearth K, Nitz DA. Subiculum neurons map the current axis of travel. Nat Neurosci. 2017;20:170–172. doi: 10.1038/nn.4464. [DOI] [PubMed] [Google Scholar]
- 25.Sharp PE, Green C. Spatial correlates of firing patterns of single cells in the subiculum of the freely moving rat. J Neurosci. 1994;14:2339–2356. doi: 10.1523/JNEUROSCI.14-04-02339.1994. [DOI] [PMC free article] [PubMed] [Google Scholar]
- 26.Kim SM, Ganguli S, Frank LM. Spatial information outflow from the hippocampal circuit: distributed spatial coding and phase precession in the subiculum. J Neurosci. 2012;32:11539–11558. doi: 10.1523/jneurosci.5942-11.2012. [DOI] [PMC free article] [PubMed] [Google Scholar]
- 27.Giocomo Lisa M, et al. Topography of Head Direction Cells in Medial Entorhinal Cortex. Current Biology. 2014;24:252–262. doi: 10.1016/j.cub.2013.12.002. [DOI] [PubMed] [Google Scholar]
- 28.Hasselmo ME, Bodelon C, Wyble BP. A proposed function for hippocampal theta rhythm: separate phases of encoding and retrieval enhance reversal of prior learning. Neural Comput. 2002;14:793–817. doi: 10.1162/089976602317318965. [DOI] [PubMed] [Google Scholar]
- 29.Fernandez-Ruiz A, et al. Entorhinal-CA3 Dual-Input Control of Spike Timing in the Hippocampus by Theta-Gamma Coupling. Neuron. 2017;93:1213–1226.e1215. doi: 10.1016/j.neuron.2017.02.017. [DOI] [PMC free article] [PubMed] [Google Scholar]
- 30.Douchamps V, Jeewajee A, Blundell P, Burgess N, Lever C. Evidence for encoding versus retrieval scheduling in the hippocampus by theta phase and acetylcholine. J Neurosci. 2013;33:8689–8704. doi: 10.1523/jneurosci.4483-12.2013. [DOI] [PMC free article] [PubMed] [Google Scholar]
- 31.Hasselmo ME, Schnell E. Laminar selectivity of the cholinergic suppression of synaptic transmission in rat hippocampal region CA1: computational modeling and brain slice physiology. J Neurosci. 1994;14:3898–3914. doi: 10.1523/jneurosci.14-06-03898.1994. [DOI] [PMC free article] [PubMed] [Google Scholar]
- 32.Deshmukh SS, Knierim JJ. Representation of non-spatial and spatial information in the lateral entorhinal cortex. Frontiers in behavioral neuroscience. 2011;5:69–69. doi: 10.3389/fnbeh.2011.00069. [DOI] [PMC free article] [PubMed] [Google Scholar]
- 33.Wang C, et al. Egocentric coding of external items in the lateral entorhinal cortex. Science. 2018;362:945–949. doi: 10.1126/science.aau4940. [DOI] [PMC free article] [PubMed] [Google Scholar]
- 34.Hinman JR, Chapman GW, Hasselmo ME. Neuronal representation of environmental boundaries in egocentric coordinates. Nature Communications. 2019;10 doi: 10.1038/s41467-019-10722-y. 2772. [DOI] [PMC free article] [PubMed] [Google Scholar]
- 35.Alexander AS, et al. Egocentric boundary vector tuning of the retrosplenial cortex. Science Advances. 2020;6:eaaz2322. doi: 10.1126/sciadv.aaz2322. [DOI] [PMC free article] [PubMed] [Google Scholar]
- 36.Tsao A, Moser MB, Moser EI. Traces of experience in the lateral entorhinal cortex. Current biology: CB. 2013;23:399–405. doi: 10.1016/j.cub.2013.01.036. [DOI] [PubMed] [Google Scholar]
- 37.Sarel A, Finkelstein A, Las L, Ulanovsky N. Vectorial representation of spatial goals in the hippocampus of bats. Science. 2017;355:176–180. doi: 10.1126/science.aak9589. [DOI] [PubMed] [Google Scholar]
- 38.Henriksen EJ, et al. Spatial representation along the proximodistal axis of CA1. Neuron. 2010;68:127–137. doi: 10.1016/j.neuron.2010.08.042. [DOI] [PMC free article] [PubMed] [Google Scholar]
- 39.Lee H, Wang C, Deshmukh SS, Knierim JJ. Neural Population Evidence of Functional Heterogeneity along the CA3 Transverse Axis: Pattern Completion versus Pattern Separation. Neuron. 2015;87:1093–1105. doi: 10.1016/j.neuron.2015.07.012. [DOI] [PMC free article] [PubMed] [Google Scholar]
- 40.MacDonald CJ, Lepage KQ, Eden UT, Eichenbaum H. Hippocampal “time cells” bridge the gap in memory for discontiguous events. Neuron. 2011;71:737–749. doi: 10.1016/j.neuron.2011.07.012. [DOI] [PMC free article] [PubMed] [Google Scholar]
- 41.Wood ER, Dudchenko PA, Robitsek RJ, Eichenbaum H. Hippocampal Neurons Encode Information about Different Types of Memory Episodes Occurring in the Same Location. Neuron. 2000;27:623–633. doi: 10.1016/S0896-6273(00)00071-4. [DOI] [PubMed] [Google Scholar]
- 42.Cembrowski MS, et al. The subiculum is a patchwork of discrete subregions. eLife. 2018;7:e37701. doi: 10.7554/eLife.37701. [DOI] [PMC free article] [PubMed] [Google Scholar]
- 43.Ding S-L, et al. Distinct Transcriptomic Cell Types and Neural Circuits of the Subiculum and Prosubiculum along the Dorsal-Ventral Axis. Cell reports. 2020;31 doi: 10.1016/j.celrep.2020.107648. 107648. [DOI] [PMC free article] [PubMed] [Google Scholar]
- 44.Cembrowski MarkS, et al. Spatial Gene-Expression Gradients Underlie Prominent Heterogeneity of CA1 Pyramidal Neurons. Neuron. 2016;89:351–368. doi: 10.1016/j.neuron.2015.12.013. [DOI] [PubMed] [Google Scholar]
- 45.Lederman SJ, Klatzky RL, Collins A, Wardell J. Exploring environments by hand or foot: Time-based heuristics for encoding distance in movement space. Journal of Experimental Psychology: Learning, Memory, and Cognition. 1987;13:606–614. doi: 10.1037/0278-7393.13.4.606. [DOI] [PubMed] [Google Scholar]
- 46.Lloyd R, Heivly C. Systematic Distortions in Urban Cognitive Maps. Annals of the Association of American Geographers. 1987;77:191–207. doi: 10.1111/j.1467-8306.1987.tb00153.x. [DOI] [Google Scholar]
- 47.Mullally SL, Intraub H, Maguire EA. Attenuated boundary extension produces a paradoxical memory advantage in amnesic patients. Current biology: CB. 2012;22:261–268. doi: 10.1016/j.cub.2012.01.001. [DOI] [PMC free article] [PubMed] [Google Scholar]
- 48.O’keefe J. Vector Grammar, Places, and the Functional Role of the Spatial Prepositions in English. van der Zee E, Slack J, editors. Representing Direction in Language and Space. 2003 [Google Scholar]
- 49.Bush D, Barry C, Manson D, Burgess N. Using Grid Cells for Navigation. Neuron. 2015;87:507–520. doi: 10.1016/j.neuron.2015.07.006. [DOI] [PMC free article] [PubMed] [Google Scholar]
- 50.Tavares RM, et al. A Map for Social Navigation in the Human Brain. Neuron. 2015;87:231–243. doi: 10.1016/j.neuron.2015.06.011. [DOI] [PMC free article] [PubMed] [Google Scholar]
- 51.Paxiπos G WC. The Rat Brain in Stereotaxic Coordinate. sixth. Academic Press/Elsevier, Amsterdam; Boston: 2007. [Google Scholar]
- 52.Tamamaki N, Nojyo Y. Preservation of topography in the connections between the subiculum, field CA1, and the entorhinal cortex in rats. J Comp Neurol. 1995;353:379–390. doi: 10.1002/cne.903530306. [DOI] [PubMed] [Google Scholar]
- 53.O’Mara SM, Commins S, Anderson M, Gigg J. The subiculum: a review of form, physiology and function. Prog Neurobiol. 2001;64:129–155. doi: 10.1016/s0301-0082(00)00054-x. [DOI] [PubMed] [Google Scholar]
- 54.Kim Y, Spruston N. Target-specific output patterns are predicted by the distribution of regular-spiking and bursting pyramidal neurons in the subiculum. Hippocampus. 2012;22:693–706. doi: 10.1002/hipo.20931. [DOI] [PMC free article] [PubMed] [Google Scholar]
- 55.Sun Y, et al. Cell-type-specific circuit connectivity of hippocampal CA1 revealed through Cre-dependent rabies tracing. Cell reports. 2014;7:269–280. doi: 10.1016/j.celrep.2014.02.030. [DOI] [PMC free article] [PubMed] [Google Scholar]
- 56.Aggleton JP, Christiansen K. The subiculum: the heart of the extended hippocampal system. Prog Brain Res. 2015;219:65–82. doi: 10.1016/bs.pbr.2015.03.003. [DOI] [PubMed] [Google Scholar]
- 57.O’Reilly KC, Gulden Dahl A, Ulsaker Kruge I, Witter MP. Subicular-parahippocampal projections revisited: development of a complex topography in the rat. J Comp Neurol. 2013;521:4284–4299. doi: 10.1002/cne.23417. [DOI] [PubMed] [Google Scholar]
- 58.Nakamura NH, Flasbeck V, Maingret N, Kitsukawa T, Sauvage MM. Proximodistal segregation of nonspatial information in CA3: preferential recruitment of a proximal CA3-distal CA1 network in nonspatial recognition memory. J Neurosci. 2013;33:11506–11514. doi: 10.1523/jneurosci.4480-12.2013. [DOI] [PMC free article] [PubMed] [Google Scholar]
- 59.Ishihara Y, Fukuda T. Immunohistochemical investigation of the internal structure of the mouse subiculum. Neuroscience. 2016;337:242–266. doi: 10.1016/j.neuroscience.2016.09.027. [DOI] [PubMed] [Google Scholar]
- 60.Ding SL. Comparative anatomy of the prosubiculum, subiculum, presubiculum, postsubiculum, and parasubiculum in human, monkey, and rodent. J Comp Neurol. 2013;521:4145–4162. doi: 10.1002/cne.23416. [DOI] [PubMed] [Google Scholar]
- 61.Slomianka L, Geneser FA. Distribution of acetylcholinesterase in the hippocampal region of the mouse: II. Subiculum and hippocampus. J Comp Neurol. 1991;312:525–536. doi: 10.1002/cne.903120404. [DOI] [PubMed] [Google Scholar]
- 62.Kadir SN, Goodman DFM, Harris KD. High-Dimensional Cluster Analysis with the Masked EM Algorithm. Neural Comput. 2014;26:2379–2394. doi: 10.1162/NECO_a_00661%M25149694. [DOI] [PMC free article] [PubMed] [Google Scholar]
- 63.Jones MW, Wilson MA. Theta Rhythms Coordinate Hippocampal–Prefrontal Interactions in a Spatial Memory Task. PLOS Biology. 2005;3:e402. doi: 10.1371/journal.pbio.0030402. [DOI] [PMC free article] [PubMed] [Google Scholar]
- 64.Mizuseki K, Sirota A, Pastalkova E, Buzsáki G. Theta Oscillations Provide Temporal Windows for Local Circuit Computation in the Entorhinal-Hippocampal Loop. Neuron. 2009;64:267–280. doi: 10.1016/j.neuron.2009.08.037. [DOI] [PMC free article] [PubMed] [Google Scholar]
- 65.Mizuseki K, Diba K, Pastalkova E, Buzsáki G. Hippocampal CA1 pyramidal cells form functionally distinct sublayers. Nat Neurosci. 2011;14:1174–1181. doi: 10.1038/nn.2894. [DOI] [PMC free article] [PubMed] [Google Scholar]
- 66.Pewsey A, Neuhäuser M, Ruxton GD. Circular Statistics in R. 2013.
- 67.Derdikman D. Are the boundary-related cells in the subiculum boundary-vector cells? The Journal of neuroscience: the official journal of the Society for Neuroscience. 2009;29:13429–13431. doi: 10.1523/JNEUROSCI.4176-09.2009. [DOI] [PMC free article] [PubMed] [Google Scholar]
- 68.Mehta MR, Lee AK, Wilson MA. Role of experience and oscillations in transforming a rate code into a temporal code. Nature. 2002;417:741–746. doi: 10.1038/nature00807. [DOI] [PubMed] [Google Scholar]
- 69.Harris KD, et al. Spike train dynamics predicts theta-related phase precession in hippocampal pyramidal cells. Nature. 2002;417:738–741. doi: 10.1038/nature00808. [DOI] [PubMed] [Google Scholar]
- 70.Huxter J, Burgess N, O’Keefe J. Independent rate and temporal coding in hippocampal pyramidal cells. Nature. 2003;425:828–832. doi: 10.1038/nature02058. [DOI] [PMC free article] [PubMed] [Google Scholar]
Associated Data
This section collects any data citations, data availability statements, or supplementary materials included in this article.
Supplementary Materials
Data Availability Statement
Key custom Matlab code, including that for defining Trace and Overlap scores, and constructing vector rate maps, will be made publicly available at: https://github.com/WillsCacucciLab/VectorTraceCode
Data are available upon reasonable request from the authors.


