Abstract
The inner surfaces of the human heart are covered by a complex network of muscular strands that is thought to be avestige of embryonic development.1, 2 The function of these trabeculae in adults and their genetic architecture are unknown. To investigate this, we performed a genome-wide association study using fractal analysis of trabecular morphology as an image-derived phenotype in 18,096 UK Biobank participants. We identified 16 significant loci containing genes associated with haemodynamic phenotypes and regulation of cytoskeletal arborisation.3, 4 Using biomechanical simulations and human observational data, we demonstrate that trabecular morphology is an important determinant of cardiac performance. Through genetic association studies with cardiac disease phenotypes and Mendelian randomisation, we find a causal relationship between trabecular morphology and cardiovascular disease risk. These findings suggest an unexpected role for myocardial trabeculae in the function of the adult heart, identify conserved pathways that regulate structural complexity, and reveal their influence on susceptibility to disease.
The chambers of the mature human heart have a complex inner surface whose function is unknown. Unlike the smooth endothelium of the great vessels, the endocardial surfaces of both ventricles are lined by a fenestrated network of muscular trabeculae which extend into the cavity. Their embryological development is driven by highly-conserved signalling pathways involving the endocardium-myocardium and extra-cellular matrix that regulate myocardial proliferation during cardiac morphogenesis.2, 5–9 Cell lineage tracing suggests that trabeculae have a molecular and developmental identity which is distinct from the compact myocardium.10 The high surface area of trabeculae enables nutrient and oxygen diffusion from blood pool to myocardium before the coronary circulation is established.1 Trabeculae are also vital to formation of the conduction system.11 Theoretical analyses have proposed that their complex structure may contribute to efficient intra-ventricular flow patterns.12–14 While hypertrabeculation is observed as a feature of some genetically-characterised cardiomyopathies,15 the physiological function of trabeculae in adult hearts, their genetic architecture, and potential role in common disease have not been determined.
The distinguishing trait of trabeculae is their branching morphology and the degree of such biological complexity in the heart can be quantified by fractal dimension (FD) analysis of cardiac magnetic resonance (CMR) imaging.8 In a replicated genome-wide association study (GWAS), using FD as an image-derived phenotype, we identify loci linked with trabecular morphology. Knockout models of loci-associated genes showed a marked decrease in trabecular complexity. Using biomechanical modelling and human observational data, we find a causal relationship between myocardial trabeculation and ventricular performance, with Mendelian randomisation showing that reduced trabecular complexity is causally associated with the risk of heart failure.
Data overview
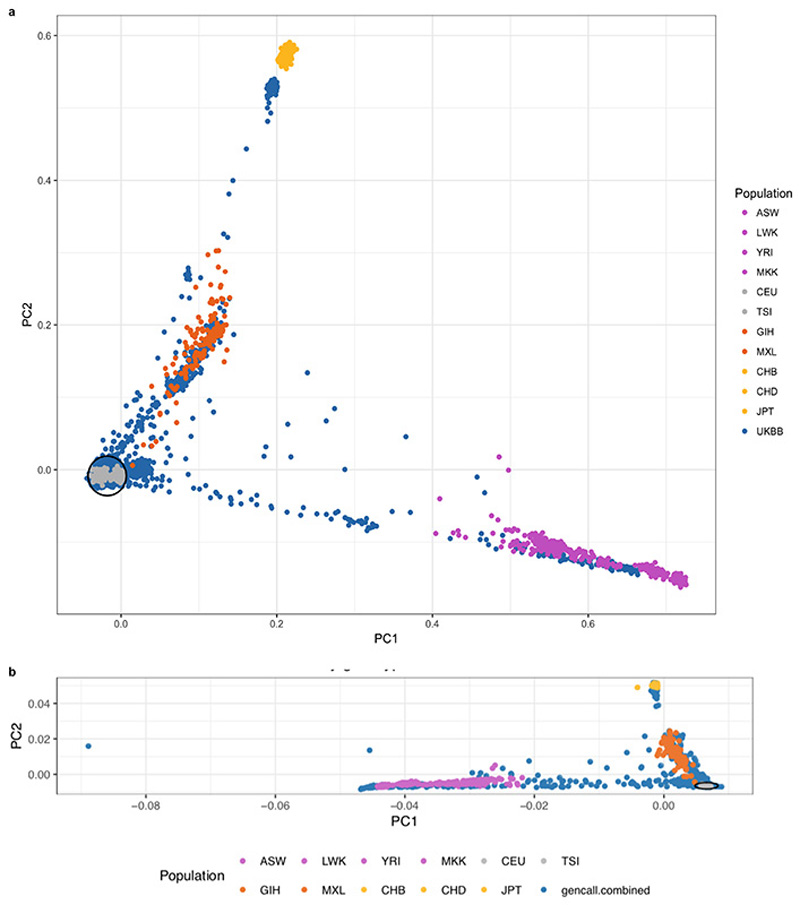
UK Biobank is a prospective cohort study collecting deep genetic and phenotypic data on approximately 500,000 individuals from across the United Kingdom, aged between 40 and 69 at recruitment.16 Of these, 100,000 participants are being recalled for enhanced phenotyping which includes CMR imaging.17 Non-invasive data on a range of haemodynamic parameters are also collected at the time of imaging. Following automated image-quality control18 and exclusion of subjects with missing covariates, 18,096 unrelated participants that formed a well-mixed population of European ethnicity (Extended Data Fig 1a) were used for discovery (Extended Data Table 1 and Fig. 1d). A separate UK Biobank dataset of 6,536 participants and a further independent cohort of 1,129 healthy adults (UK Digital Heart study) were used for validation (Extended Data Fig 1b).19 Disease associations were assessed in 510 patients with dilated cardiomyopathy (DCM) (Extended Data Table 1) of which 307 also had CMR imaging, as well as in summary GWAS data for heart failure of mixed aetiology from 47,309 cases and 930,014 controls, across 26 studies of European ancestry from the HERMES consortium.20
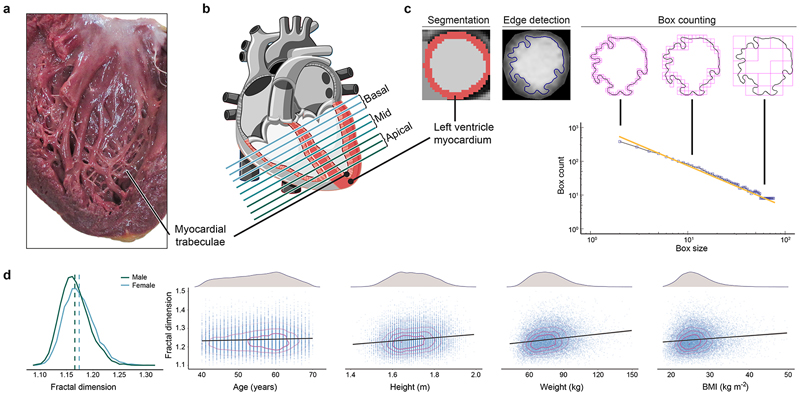
Figure 1. Trabeculation phenotypes and covariates.
a) Macroscopic cut pathological section of the left ventricle demonstrating the branching network of muscular trabeculae lining the endocardial surface (Arpatsara/Shutterstock.com). b) Diagram of the heart illustrating the positioning of sections acquired during cardiac magnetic resonance (CMR) imaging for the assessment of trabecular complexity (GraphicsRF/Shutterstock.com). c) Deep learning image segmentation was used for anatomical annotation of each pixel in the CMR dataset and to define an outer region of interest for subsequent fractal analysis. A binary mask was taken of the image followed by edge detection of the trabeculae. Box-counting across a range of sizes generated a log-log plot from which the gradient of a least-squares linear regression defined the fractal dimension. d) Distribution of fractal dimension and its relation to covariates used in the association study (n=18,096).
Fractal analysis of trabeculation
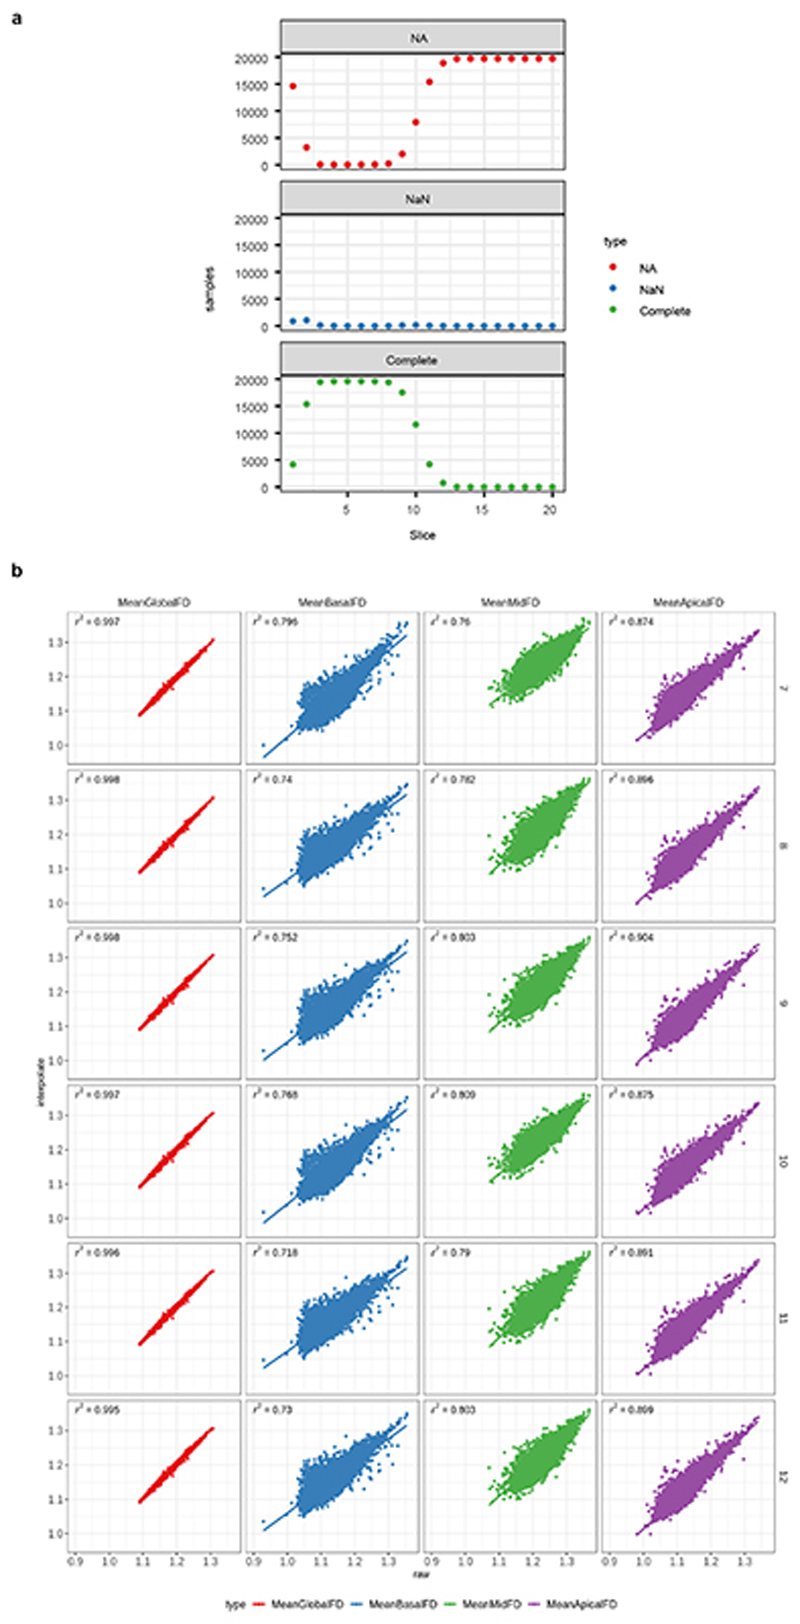
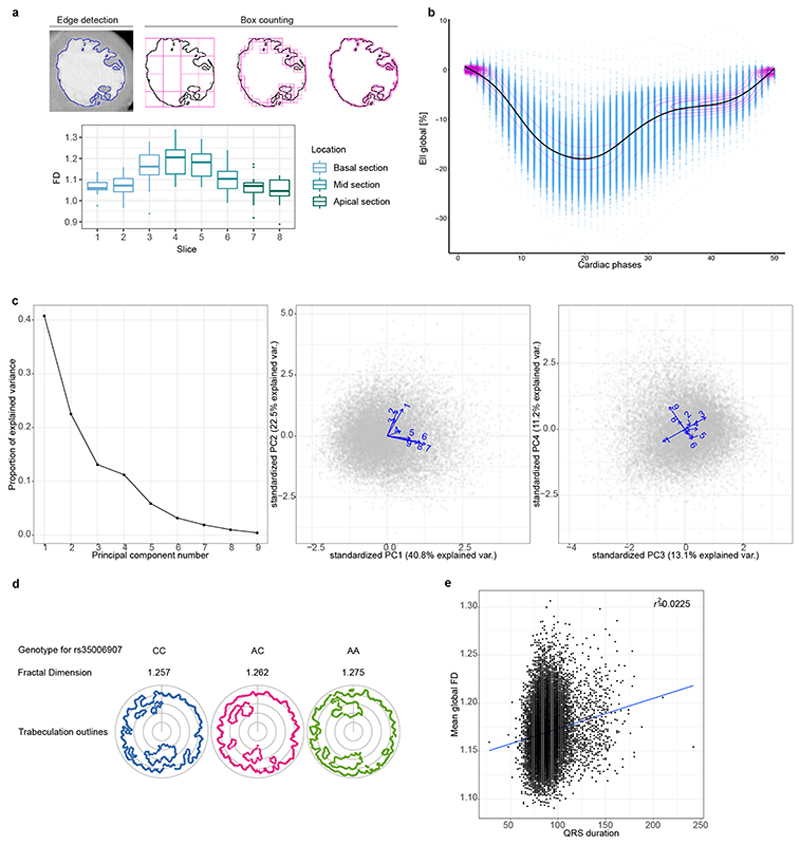
We used a fully convolutional network for automated left ventricular segmentation and volumetry of CMR images.21 Using edge detection of the endocardium we derived a scale invariant FD ratio for each slice, where a higher value indicates a greater degree of surface complexity (Fig. 1).22 To account for variations in cardiac size and for consistent anatomical comparisons within and between populations we interpolated the data to 9 slices (Extended Data Fig 2) which were equally divided into basal, mid-ventricular and apical thirds. An identical analytic pipeline was performed in the validation cohorts. We also showed that fractal analysis could be performed on other imaging modalities (Extended Data Fig 3a). In addition, we used motion analysis to determine spatial components of myocardial strain (Extended Data Fig 3b).
Genome-wide association analysis
We first explored variation in FD across slices using principal components analysis and noted multiple modes of variation. (Extended Data Fig 3c). We then used individual slice level GWAS to test association for different modes of variation, followed by meta-analysis across the slices to capture any additional global associations.
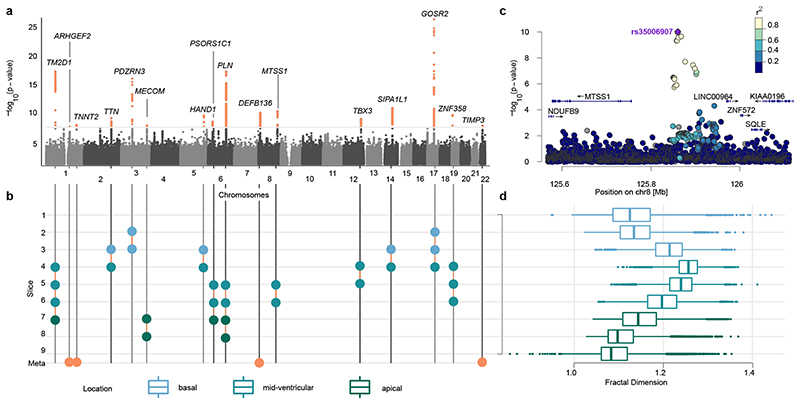
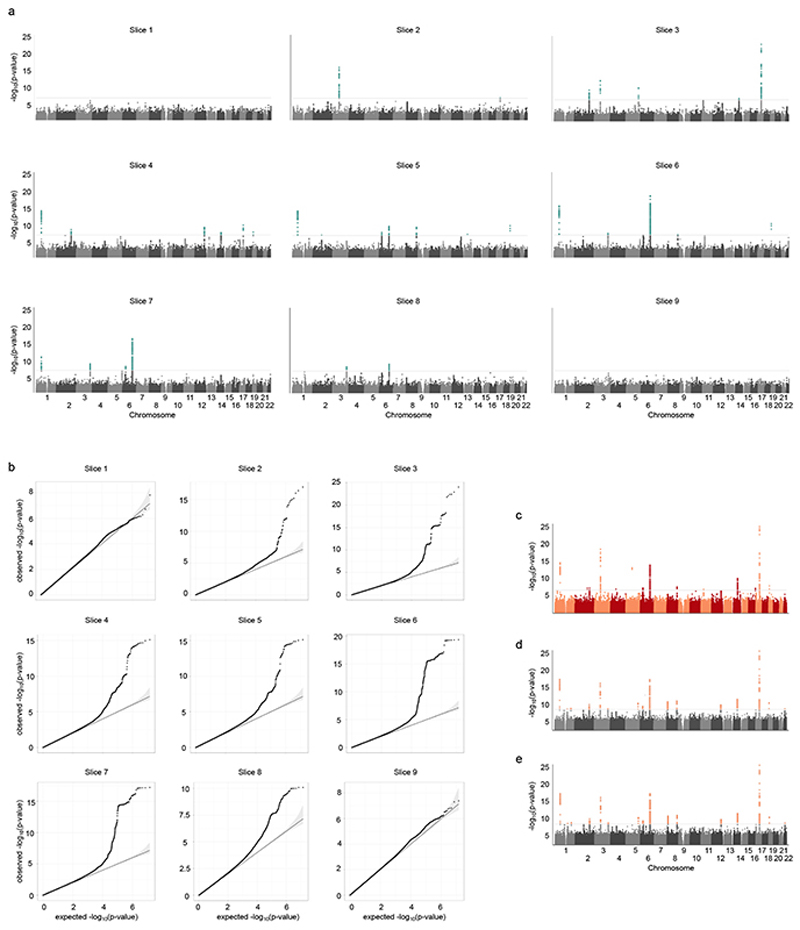
We performed a linear model for genetic association of 14,134,301 genetic variants on each of the 9 interpolated slice FD measures (Fig. 2a, Supplementary Data 1) of 18,096 individuals using anthropometric variables and genetic principal components as covariates. These genome-wide association studies showed low inflation and many individual loci passing the commonly used genome-wide association threshold of 5*10−8 after p-value adjustment for multiple testing by the effective number of tests (Teff = 6.6; Extended Data Fig 4a, b; Supplementary Table 1). Figure 2b shows the resulting 16 independent loci from the meta-analysis of the per-slice GWAS summary statistics and the individual slice(s) which the loci are associated with. Four loci were only discovered using this joint meta-analysis approach (Fig. 2b, orange circles); the remaining 12 loci show patterns of association that extend over multiple adjacent slices with varying effect sizes from base to apex (Extended Data Fig 5a). We conducted two additional, analogous association studies including either end-diastolic volume or myocardial strain as covariates. Both studies led to the discovery of the same loci, indicating that FD associations are independent of ventricular size and strain (Extended Data Fig 4c, d).
Figure 2. Genetic associations of left ventricular trabeculation.
a) Manhattan plot (number of variants = 14,134,301) of meta-analysis p-values, depicted on log10 scale, uncorrected for multiple comparisons. Meta-analysis p-values estimated based on transformation of univariate signed t-statistic and χ 2 distribution with 9 degrees of freedom. Loci passing the genome-wide significance threshold 5*10−8 highlighted in orange (top). b) Diagram showing the slices driving the genetic association signal (compare Extended Data Fig 4): circles indicate a locus being associated (panel a) with respective slice and region (panel d). Loci marked in orange circles have no individual association padjusted = p *Teff < 5 *10−8 (where Teff = 6.6 is the effect number of independent phenotypic tests) and were only discovered in the meta-analysis. Loci are labeled by their nearest protein coding gene. c) Locus zoom of the locus on chromosome 8, associated with slices 5 and 6. d) Box-plot of FD measurements per slice, colour-coded by cardiac region. The lower and upper hinges in the boxplot correspond to the 25th and 75th percentiles (IQR), the horizontal line in the boxplot the median. The lower/upper whisker extends from the hinge to the smallest/largest value no further than 1.5 × IQR. Association (a) and phenotype (d) sample size: n=18,096.
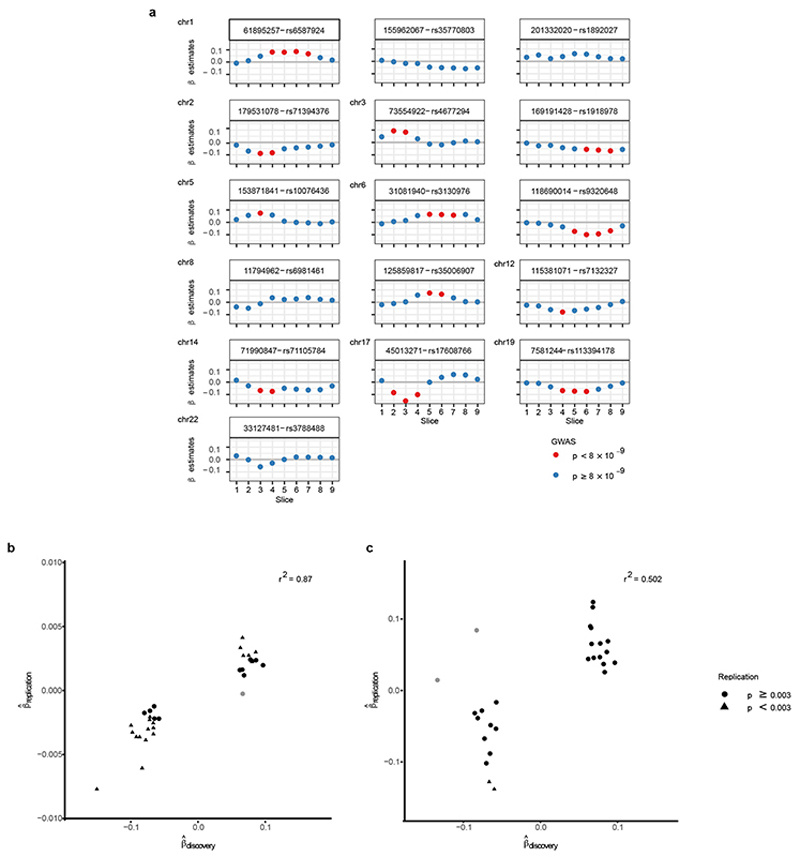
To replicate our findings, we analysed the genetic associations of the discovered loci with trabeculation-derived FD measurements in two separate cohorts: CMR images of 6,536 UK Biobank participants (released after the initial discovery GWAS) and 1,129 healthy volunteers from the UK Digital Heart Study. We applied the same image analysis pipeline and conducted an equivalent genetic association study on genetic variants in the 16 loci associated in the discovery cohort. In the larger UK Biobank replication cohort, eight of the loci replicated the results observed in the discovery cohort (Supplementary Tables 2 and 3). In the smaller, healthy volunteer replication cohort fewer associations passed the Bonferroni-adjusted p-value threshold (threshold pBon ferroni = 0.003; 2 variants, Supplementary Table 4). In both replication studies, the estimates of effect direction were highly concordant with the original discovery effect sizes (UK Biobank: 97% and UK Digital Heart: 91% of comparisons concordant) and showed correlation of the effect size estimates (r 2 = 0.87 and r 2 = 0.50, respectively; Extended Data Fig 5b, c). Permutation tests generating empirical concordance distributions show that the observed concordances are unlikely to be observed by chance (pempirical < 10−5).
Associations of discovered loci
We systematically analysed the 16 discovered loci with the rich genetic resources of other studies, drawing from both the extensive GWAS Catalog,23 and more recent phenome-wide associations (PheWAS) from UK Biobank.24 Extended Data Table 2 summarises our findings (for details on loci see Supplementary Table 5).
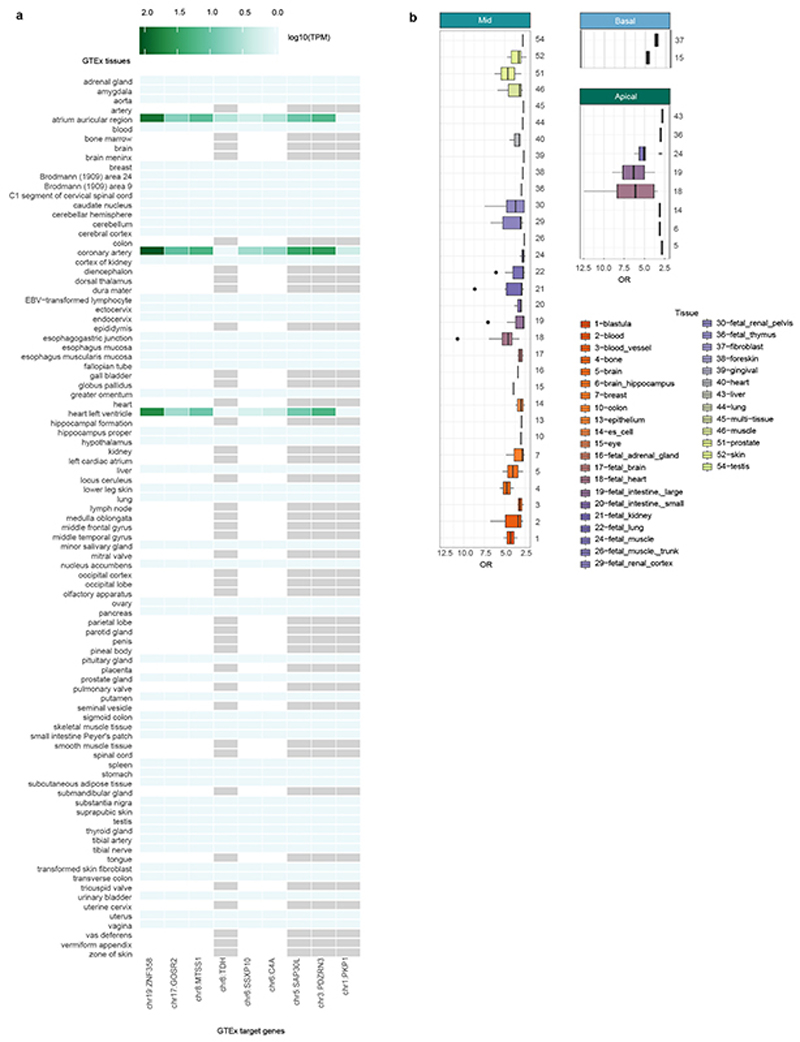
Ten of the 16 loci are also associated with at least one component of heart function, such as pulse rate, QRS duration, left ventricular structure and function (Supplementary Data 2 and Supplementary Table 6). We compared our loci to the extensive GTEx catalog25 of gene expression quantitative trait loci (eQTL; Extended Data Table 2, Supplementary Data 3 and Extended Data Fig 6a)). Nine of the 16 loci showed an overlap with a GTEx locus; in eight cases at least one of the eQTL tissues was either cardiac tissue or skeletal muscle; in one case the only significant tissue was transformed fibroblasts. A particularly strongly annotated association is on chromosome 8, in a region of open chromatin that is an eQTL for the MTSS1 gene (Fig. 2c). This locus is also associated with a variety of cardiac structure and function phenotypes (Extended Data Table 2, rs35006907), and the lead genetic variant located is in a region of open chromatin in heart tissues (ENSR00000868700, ENSEMBL regulatory build, Ensembl release 9926). Representative myocardial borders associated with this locus are depicted in Extended Data Fig 3d.
As well as previously reported associations, we were interested in the functional annotations of our GWAS results. As the per-slice GWAS (Fig. 2b) suggested regionally-driven signals, we conducted genome-wide associations of FD in basal (1-3), mid-ventricular (4-6) and apical (7-9) slices. We analysed all genetic variants of these association results for enrichment in regulatory and functional annotations. The strongest associations of the genetic loci were to open-chromatin regions in fetal heart tissue, particularly in the mid and apical regions (Extended Data Fig 6b).
Overall the discovered loci are mainly linked with either molecular or physiological cardiac phenotypes. Some loci are likely developmental, such as the locus on chromosome 8 associated with MTSS1, affecting many aspects of cardiac function whereas other loci have more specific associations. Amongst the well-annotated loci electrophysiological, haemodynamic and structural traits are common themes, for example rs17608766 which is associated with QRS duration, blood pressure, cardiac anatomy and eQTLs to three genes in skeletal muscle.
Knockout models
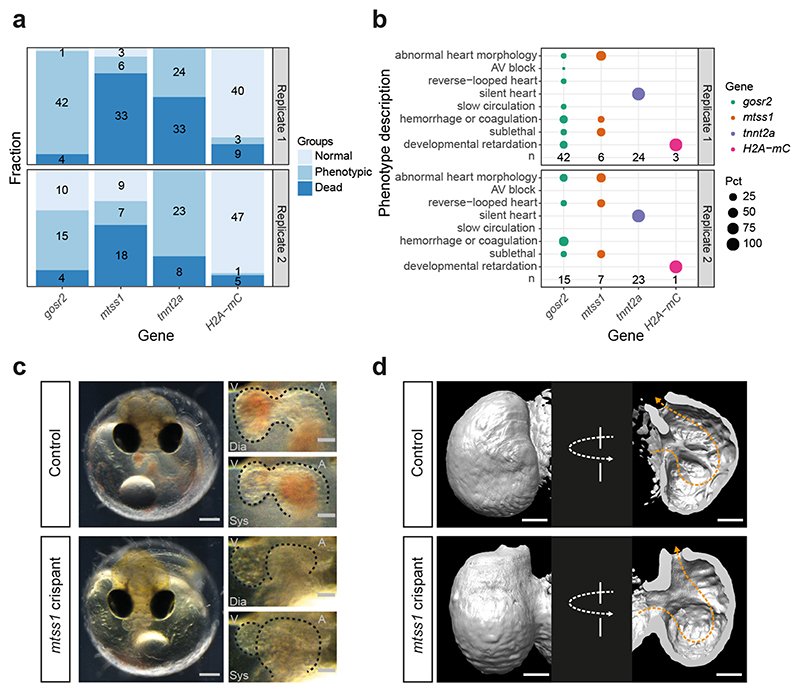
To gain further confidence in the role of the trabeculae-associated genes GOSR2 and MTSS1, we assessed in vivo CRISPR- Cas9-mediated gene knock-outs (KO) in medaka (Oryzias latipes). Crispant embryos were phenotypically evaluated at 4 days post fertilization when significant steps of cardiovascular development are complete. Two batches (replicates) of crispants were initially classified into three main categories (Fig. 3a). A significant proportion of embryos were dead after mtss1 KO. In viable embryos, we found retardation of development with a range of severe, sub-lethal to moderate phenotypes for both gosr2 and mtss1 crispants. Features observed on the level of the cardiovascular system were further described using qualitative phenotypic terms including morphological abnormalities, atrioventricular (AV) block, reverse heart looping, and haemorrhage or coagulation (Fig. 3b). Fig. 3c shows an example of a moderately affected mtss1 crispant embryo. To specifically address the endocardial structure, entire heart volumes of mtss1 crispant and control embryos (myl7::EGFP reporter line) were further analyzed at high resolution using light-sheet microscopy. Surface rendering revealed a marked reduction of trabeculation in the mtss1 crispant compared to the control (Fig. 3d).
Figure 3. Knock-out of mtss1 leads to reduction of cardiac trabeculation in medaka.
a) Counts (numbers) and corresponding proportion (bars) of normal, phenotypic and dead embryos after CRISPR-Cas9-mediated KO of gosr2, mtss1, and tnnt2a (positive control), and H2A-mCherry (H2A-mC, injection control) at 4 days post fertilization (DPF). b) Percentages of cardiovascular phenotypes, sublethal phenotypes, and developmental retardation. c) A moderately affected mtss1 crispant (total n=13) in comparison to a control embryo (total n=87) at 4 DPF; overview of injected embryos (left), magnifications of the heart region (right) captured in end-diastolic (Dia) and end-systolic (Sys) phase, respectively; scale bars: 200 μm (whole embryos) and 50 μm (hearts), atrium (A), ventricle (V). Corresponding videos of the control and mtss1 crispant embryo in Supplementary Data Video 1 and 2. d) Surface rendering of light-sheet microscopy recordings of control-injected embryo (n=1) at 6 DPF and mtss1 crispant (n=1) at 7 DPF, images cropped to the ventricle; frontal view (left), and 180° rotated (right, cut open to visualize the endocardial surface); direction of blood flow (orange line), scale bars: 50 μm.
Cardiac function
To understand the influence of myocardial trabeculation on cardiac function, we used a biomechanical simulation of the heart in a haemodynamic circuit. This allowed us to vary trabecular morphology selectively and observe its effects on ventricular performance in comparison to equivalent observational data in humans.
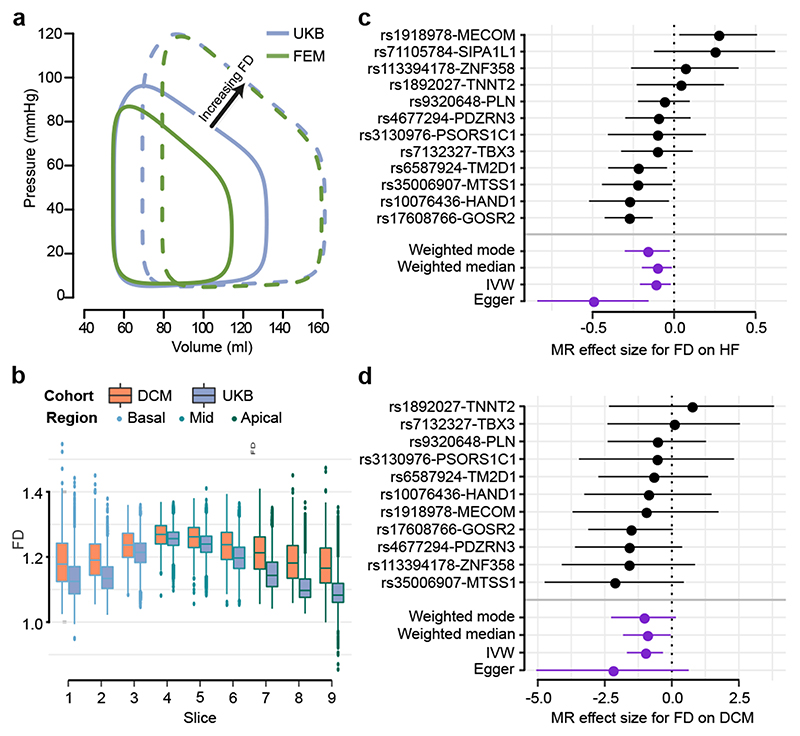
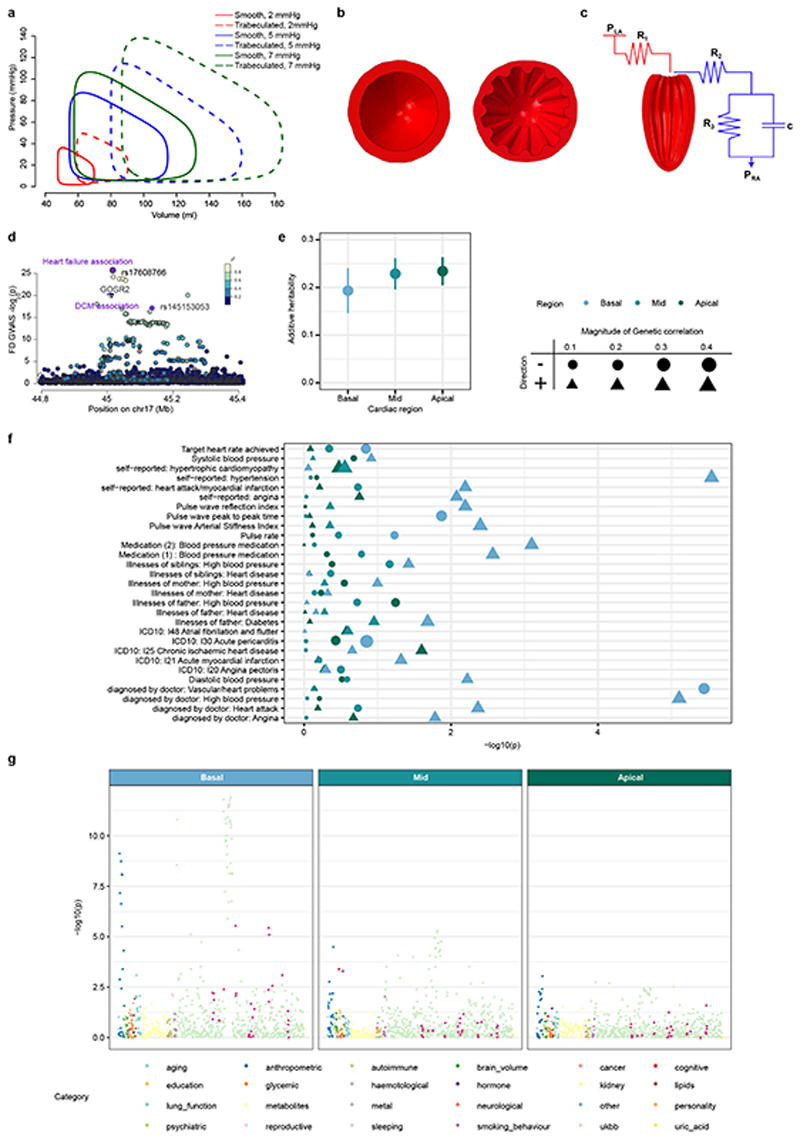
A visualisation of cardiac mechanics during systole and diastole is provided by plotting a closed loop describing the relationship between left ventricular pressure and left ventricular volume at multiple time points during a complete cardiac cycle (Fig. 4a).27, 28 To understand how trabeculae influence cardiac function we therefore assessed the relationship between FD and pressure-volume parameters of the left ventricle both in human populations and in silico models. We performed this in the UK Biobank participants by analysing non-invasive estimates of central pressures combined with volumetric CMR data. In parallel, we developed a cardiovascular simulation, using finite element analysis of the left ventricle in a haemodynamic circuit. In this simulation, we selectively varied trabecular complexity, under the same initial loading and boundary conditions, to observe the consequent effect on stroke work and contractility. In UK Biobank participants, increasing FD was associated with higher stroke volume, stroke work and cardiac index (standardised β = 0.52, 0.67, 0.12), findings which were concordant with the biomechanical simulation across a range of filling pressures (Fig. 4a). Together these results suggest a causal relationship between trabecular complexity and ventricular performance (Extended Data Fig 7a-c, Supplementary Table 7). Trabeculae also give rise to the ventricular conduction system during embryonic heart development,11 and we found a positive correlation in UK Biobank of QRS duration with FD (Extended Data Fig 3e).
Figure 4. Relationship between trabecular complexity and cardiac function and disease.
a) Variation in pressure-volume relationship with respect to trabecular fractal dimension (FD) in UK Biobank participants (UKB) and in silico biomechanical modelling (FEM) showing a positive association with left ventricular volumes and stroke work. b) Per-slice distribution of FD in the UK Biobank cohort (n=18,096) and dilated cardiomyopathy (DCM; n=307) patients. Boxplot: lower and upper hinges are 25th and 75th percentiles (IQR), the horizontal line at median; lower/upper whisker from hinge to the smallest/largest value no further than 1.5 * IQR. c). and d). Forest plots for FD effect on HF and DCM estimated by four MR methods. The contribution of each genetic variant to the overall estimate (black; estimated by Wald ratio) and their combined effect as a single genetic instrument (purple; estimated by indicated method) are shown for the four tested MR methods. Center values mark effect size point estimates, error bars the 95% confidence intervals. FD effect size estimates from uni-variate GWAS results on n=18,096 samples. HF samples sizes: ncases = 47,309, ncontrols = 930,014; DCM sample sizes: ncases = 510, ncontrols = 1,136.
Disease association
Finally, we explored the relationship of trabeculae-associated loci with cardiovascular disease using broad genetic correlation analyses and disease-specific locus and phenotype analyses. We first applied cross-trait LD score regression to screen for genetic correlations between trabecular complexity and 732 traits available on LDhub (Supplementary Data 4).29 The strongest positive and negative genetic correlations were with hypertension phenotypes and diagnosed vascular or heart problems (Extended Data Fig 7e-g), respectively.
We then analysed CMR images (n=307) in patients diagnosed with DCM, a disease of the myocardium that may progress to heart failure. We observed that these patients show higher trabecular FD than controls especially towards the base and apex of the left ventricle (Fig. 4b, linear mixed model -log 10(p) = 2846).
In a logistic regression association analysis between trabeculation-associated loci and DCM, we find two loci with genetic association (pempirical < 0.05) even in this more modestly sized patient cohort (510 DCM cases). We then used summary case-control GWAS data with a clinical diagnosis of heart failure (HF) of any aetiology from the HERMES Consortium to directly explore the associations of trabeculation-linked loci. We found that two of the loci are also associated with HF at a Boferroni-adjusted significance level (p < 0.003, Supplementary Table 8).
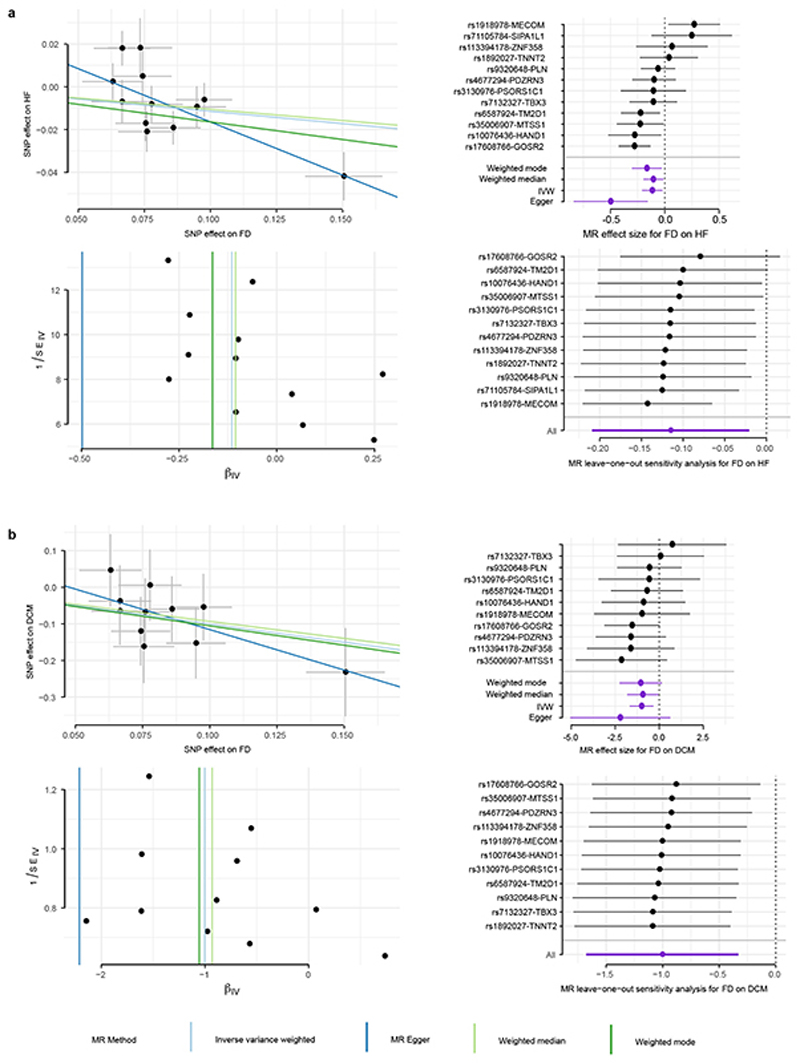
For both DCM and HF, we find a negative correlation with trabeculation, i.e. loci associated with decreasing trabeculation are associated with increased susceptibility to disease - with the locus around GOSR2 (Extended Data Fig 7d) showing a strong association in both cohorts. To test the hypothesis that trabecular morphology is causally-related to heart failure, we used a two-sample Mendelian randomisation (MR) framework,30 with the discovered independent loci as instrumental variables.31 We used FD as our exposure variable and HF or DCM as outcomes. We tested a number of MR techniques, each addressing different assumptions (for details refer to Supplementary Note 1.1: Mendelian Randomisation) and found parameter estimates that support a causal relationship between trabecular morphology and both HF (Fig. 4c; Supplementary Table 9 and Extended Data Fig 8a), and DCM (Fig. 4d; Supplementary Table 9 and Extended Data Fig 8b). In both populations an increase in trabeculation leads to decreased risk of disease. The directionality of the MR associations, with trabeculation causally upstream of HF and DCM, was confirmed by MR Steiger test32, Supplementary Table 10). Using MR Egger, we detected weak pleiotropic effects for MR on HF; for MR on DCM, none were observed (Supplementary Table 12). Furthermore, estimates of the F-statistic indicate no weak instrument bias (Supplementary Table 11 and Supplementary Note 1.1: Mendelian Randomisation, Limitations).
Discussion
Myocardial trabeculae were first described by the early human anatomists,33 and although they are remarkably well-conserved in vertebrate evolution,34 beyond a role in facilitating oxygenation of the developing fetal heart their function in adults has remained an enigma.35 Deep learning image analysis enabled us to perform the first reported GWAS of trabecular morphology - using fractal dimension to quantify their characteristic geometric complexity. We found associations with trabecular complexity in loci related to cardiac function and electrocardiographic phenotypes, gene expression variation in cardiac tissues and cardiac development chromatin annotation that were independent of biophysical variables, ventricular volume and myocardial strain.
Two discovered loci (MTSS1, GOSR2) point to molecular pathways involved in cytoskeletal actin dynamics. Variants of MTSS1 are known to be associated with myocardial geometry and cardiac function in mouse models and patient populations.36–38 Interference with mtss1 function in medaka was characterised by a range of phenotypes that included marked reduction in trabeculation. MTSS1 is also highly expressed in cerebellar Purkinje cells where it regulates dendritic complexity by promoting the branching of actin filaments and inhibiting the formation of straight filaments.3 Similarly, truncating mutations in GOSR2 cause cytoskeletal fragmentation with reduced elaboration of neuronal dendritic arbors.4 Dichotomous fractal branching greatly amplifies the surface area of tissues whether for information processing (neurons) or haemodynamic effects (heart),39 suggesting these discovered loci may play a critical role in regulating arborisation traits across different organs.
Observational data in UK Biobank showed that trabecular complexity was associated with increasing stroke work – and biomechanical simulations provided concordant data showing that trabeculae have a load independent effect on left ventricular diastolic filling, contractility and systemic blood pressure. The architecture of trabeculae, at the interface between intra- cardiac flow and the compact myocardium, may therefore be important in explaining individual variation in cardiac efficiency. Furthermore, we found that trabecular morphology in humans was associated with intra-ventricular conduction – a discovery that implicates these complex structures in cardiac electrophysiology as well as mechanical function.40
Our MR analyses support a causal role for trabecular morphology in both mixed aetiology heart failure and DCM. Taken with the observation of higher FD in disease phenotypes and our computational modelling of trabecular function, these findings suggest that trabeculae maintain cardiac performance in both healthy and failing hearts by increasing contractility and stroke work. We also found a number of loci that overlap with well-established cardiac genes (TTN, TNNT2), linked to sarcomeric function and cardiac morphogenesis, that are related to a spectrum of hyper-trabeculation phenotypes.41–43 This suggests that genes linked to primary cardiomyopathies highlight molecular pathways that are important for trabecular formation and cardiac function more generally.44
The triangulation of theoretical models, observational data and genomics45 is persuasive evidence that trabeculae are not simply vestigial features of development but are unexpected determinants of cardiac performance in adult hearts. Understanding the pathways which regulate the development of such complex biological structures provides a foundation for exploring new causal mechanisms in common cardiovascular diseases.
Extended Data
Extended Data Figure 1. Participant ethnicities in discovery and replication.
Principal components 1 and 2 of the principal component analysis on the combined genotypes of the HapMap III datasets (n=1184) and either a. the discovery cohort UK Biobank (n=19,262; 159,243 independent genetic variants) and b. the UK Digital Heart study (n=2,985; 149,707 independent genetic variants). UK Biobank (a) or UK Digital Heart cohort (b) are depicted in blue, HapMap individuals colored by their ethnicity. Cohort individuals within 1.5 standard deviations distance from the center of the European HapMap individuals (grey) are selected for further analyses.
Extended Data Figure 2. FD phenotypes.
The upper panels show the distribution of CMR image slices where FD was successfully measured. Missing FD measurements per slice can either arise because a slice was not measured (NA) or the FD estimation failed due to poor image quality or estimated FD failing quality control (NaN). a. depicts the distribution in the UK Biobank samples (n=19,761), b. the distribution in the UK Digital Heart samples (n=1,901). The lower panels show the correlation between FD summary measures derived from the observed FD slice measurements and interpolated FD measurements per sample. Interpolated FD measurements per sample were derived by using a Gaussian kernel local fit to a different numbers of slice templates, allowing for direct slice comparisons across individuals. Different numbers of slices for interpolation were tested (rows). Columns show different summary measures, either mean FD across all measured slices or mean FD per slice region. c. Linear model of measured interpolated (r 2) of the summary measures between measured and interpolated FD in the UK Biobank samples (n=19,761), d. linear model in the UK Digital Heart samples (n=1,901).
Extended Data Figure 3. Phenotypes acquisition and processing.
a. Fractal dimension analysis on cardiac CT images. Fractal dimension was calculated using the same method as for CMR, but with manual regions of interest, in a set of gated cardiac computed tomography (CT) images. a. Analogous processing as described in Fig. 1c, using edge detection of the trabeculae and subsequent box-counting across a range of sizes. b. Analogous to Fig. 2a, box-plots of the FD measurements for 20 individuals per slice, colour-coded by cardiac region. The lower and upper hinges in the boxplot correspond to the 25th and 75th percentiles (IQR), the horizontal line in the boxplot the median. The lower/upper whisker extends from the hinge to the smallest/largest value no further than 1.5 * IQR. b. Myocardial strain. Global longitudinal Lagrangian strain at each cardiac phase for all UK Biobank participants with CMR imaging (n=26,893). Individual data points shown with a smoothed mean and density contours. c. Principal component analysis of trabeculation phenotypes. Principal component analysis of FD measurements across all 9 slices in the 18,096 individuals of the UK Biobank discovery cohort. Proportion of variance explained of each prinicipal component (left). Biplot of individuals’ first and second/third and fourth principal components (grey points) and the corresponding loadings for FD of slices 1-9 as vectors (middle and right). d. Genotype, FD and trabeculation outlines for rs35006907. Representative, registered, trabecular outlines at slice 5 representing the median FD for individuals with homozygous major (blue), heterozygous (pink) and homozygous minor (green) genotype for rs35006907. Pearson correlation of global FD and QRS duration (n=18,096). QRS duration phenotype from UKB ID: qrs_duration_f12340_2_0. The Pearson correlation coefficient is indicated in the upper right corner.
Extended Data Figure 4. Per-slice FD GWAS and inclusion of additional covariates.
a. Manhattan plots and b. quantile-quantile plots of the independently conducted, nine univariate GWAS on the per-slice FD measurements for 18,096 samples. In the Manhattan plots (a), the p-values (derived from linear association t statistic) were multiplied by the effective number of independent phenotypic tests Teff = 6.6 and min(padjust, 1) reported. In the qq-plots, the unadjusted p-values are plotted against equally spaced values in [0, 1] of the same sample size (expected p-values). The diagonal line starts at the origin and has slope one. The genomic control λ values for each qqplot are: 1.0557, 1.0436, 1.0496, 1.0557, 1.0649, 1.0679, 1.0679, 1.0618, 1.0436. λ were generated with LD score regression, for details see Supplementary Table 1. c, d. Manhattan plot based on meta-analysis GWAS (sample size n=18,096) with end-diastolic volume of the left ventricle (c.) or myocardial strain (d.) as co-variate. e. Manhattan plot based on meta-analysis GWAS (same as Fig. 2a; shown for comparison). Other co-variates and analysis parameters (as described in methods) were kept the same in a-c. P-values are meta-analysis p-values, not adjusted for multiple testing derived from the transformation of the univariate signed t-statistics (associations on 14,134,301 genetic variants at 16 independent loci from 18,096 samples) and χ 2 distribution with 9 degrees of freedom. In a. and c., the horizontal grey line is drawn at the level of genome-wide significance: p = 5 × 10⁻⁸.
Extended Data Figure 5. GWAS effect size estimates and replication.
a. Effect size distribution of loci with genetic variant associations of padjust = 5*10−8 in any uni-variate per-slice FD GWAS (sample size n=18,096). P-values derived from linear association t statistic. Distribution shown for each locus (indicated by chromosomal position and lead genetic variant in subplot title) across all slices and effect size colour-coded by p-value of the association. Variants with no padjust < 5 *10−8 in the univariate per-slice FD GWAS (all blue) were discovered in the multi-trait meta-analyses. b, c. Effect size estimate concordance in discovery and replication cohorts. For each of the nine uni-variate, per-slice FD GWAS, the effect size estimates of the genetic variants with the smallest p-value for each of the independent loci in the discovery cohort (n=18,096) were selected. For some variants, associations passing the GWAS threshold of padjust < 5 * 10−8 were discovered in more than one of the nine uni-variate GWAS FD slices; for these variants all effect size estimates were selected. Estimates were plotted against the corresponding slice-variant associations in the replication GWAS (b: UK Biobank replication, n=6,356; c: UK Digital Heart cohort, n=1,029). Non-concordant estimate pairs are depicted in light grey. Effect size estimates passing the Bonferroni-adjusted validation p-value threshold of p <0.05/16 = 0.003 are depicted as triangles. r 2 for linear model of .
Extended Data Figure 6. Annotation of trabeculation associated loci.
a. Gene expression of GTEx associated genes and tissues. Gene expression in log10 transcripts per million (TPM) for genes whose expression is associated with trabeculation loci (via GTEx look-up, Supplementary Data 3). Gene expression values and tissues were downloaded from https://www.ebi.ac.uk/gxa/home by querying: gene name AND tissue AND species, i.e. GTEx gene AND heart component AND Homo sapiens. Light grey tiles indicate NA gene expression values for gene/tissue pair. b. Enrichment of trabeculation associated variants in DNaseI Hypersensitive sites for all available tissues in GARFIELD. GARFIELD was used to compute the functional enrichment (odds ratio, OR) of genetic variants associated with the trabeculation phenotypes (GWAS: n=18,096, p-values derived from linear association t statistic) at p < 10−6 for open chromatin regions. The results across all available studies per tissue are depicted in boxplots. Lower/upper hinges: 25th and 75th percentiles (IQR); horizontal line: median; lower/upper whisker extends from the hinge to the smallest/largest value no further than 1.5 × IQR.
Extended Data Figure 7. Biomechanical model, genetic correlation and disesase associations.
a. Left ventricular pressure-volume loops from finite-element modelling across range of atrial pressures. Solid and dashed lines indicate smooth and trabeculated ventricles, respectively. Mid short axis cross sections of the finite element model of the left ventricle, looking towards the apex, at different trabecular complexities. The ventricular model was in series with pre-load (red) and after-load circuits (blue) defining left atrial pressure (PLA), right atrial pressure (PRA), inflow resistance (R1), aortic resistance (R2), peripheral resistance (R3) and vascular capacitance (c). Initial parameters calibrated to approximate UK Biobank observations; the reference model was a trabeculated left ventricle with a PLA of 5 mmHg. d. FD association p-values (depicted on -log10 scale, uncorrected for multiple comparisons; estimated by transformation of univariate signed t-statistic with χ 2 distribution with 9 degrees of freedom; univariate GWAS with n=18,096 samples) for the chr17 GOSR2 locus and variants associated with mixed aetiology heart failure (HF; ncases = 47, 309, ncontrols = 930, 014) and DCM (ncases = 510, ncontrols = 1, 136) highlighted in purple. Summary statistics of basal, mid and apical trabeculation GWAS were analysed for genetic correlation with all available summary statistics on LDhub (e-g). e. Additive heritability estimates h 2 for regional summary statistics based on 1,208,036 genetic variants. f. Genetic correlation p-values (based on LD score regression correlation of 1,208,036 genetic variants) by region summarised in LDhub categories (color-code). Heart and cardiovascular phenotypes (Supplementary Table 13 and y-axis in panel g are depicted in dark red. g. Association p-values of heart and cardiovascular phenotypes with corresponding estimate of genetic correlation (encoded by size). P-values are derived from cross-trait correlation analysis and block-jackknife approach for standard error estimation, Supplementary Table 13; depicted on -log10 scale, uncorrected for multiple comparisons.
Extended Data Figure 8. MR analysis of trabeculation on heart failure (HF) and dilated cardiomyopathy (DCM).
a. MR on HF with HF effect size estimates based on ncases = 47, 309 and ncontrols = 930, 014 in HERMES study.20 b. MR on DCM with DCM effect size estimates based on ncases = 1, 136 and ncontrols = 510. For all panels in a. and b. FD effect size estimates from uni-variate GWAS results on n=18,096 samples. Scatter plots (upper left) depict the genetic variant-exposure effect versus the genetic variant-outcome effect. Center values show effect size estimate on FD and DCM, error bars indicate standard error of association test (t-statistic for FD, logistic regression for HF). Forest plots (upper right) show the contribution of each genetic variant to the overall estimate (black; estimated by Wald ratio) and combined as a single genetic instrument (purple; estimated by indicated method) for the four tested MR methods (see legend). Funnel plots (lower left) depict the instrument strength against the causal effect of each instrument as a single IV. Vertical lines indicate the average estimated effect for the tested MR methods. Strong instruments are close to the estimated average effect, while weak instruments spread evenly on both sides. Leave-one-out plots (lower right) show the results of MR analysis (IVW only) where each genetic variant is sequentially excluded and can indicate if there are any single variants that drive the MR results. In right panels, center values mark effect size point estimates, error bars the 95% confidence intervals.
Extended Data Table 1. Participant characteristics.
Characteristics of all participants that passed quality control in the UK Biobank (UKBB) discovery and replication cohort, the UK Digital heart cohort (UKDH) used as a second replication cohort and the dilated cardiomyopathy (DCM) patients used for disease association. Measurements are depicted in mean ± standard deviation. End-systolic volume, end-diastolic volume and mass from CMR are indexed to body surface area. BP, Blood pressure; FD, fractal dimension. *: FD measurements on the subset of 307 DCM patients with cardiac magnetic resonance imaging (Fig. 4b).
| Characteristics | UKBB (discovery) | UKBB (replication) | UKDH | DCM |
|---|---|---|---|---|
| Participants | 18,096 | 6,536 | 1,129 | 510 |
| Age (years) | 55 ± 7 | 55 ± 7 | 41 ± 13 | 54 ± 15 |
| Body surface area (m2) | 1.90 ± 0.21 | 1.90 ± 0.22 | 1.85 ± 0.20 | 1.99 ± 0.28 |
| Sex (m/f) | 9402/8694 | 3378/3158 | 621/508 | 357/153 |
| Haemodynamics | ||||
| Systolic BP (mmHg) | 137 ± 18 | 136 ± 18 | 120 ± 14 | 122 ± 31 |
| Diastolic BP (mmHg) | 81 ± 10 | 82 ± 10 | 79 ± 9 | 73 ± 20 |
| Heart rate (beats/minute) | 62 ± 10 | 63 ± 11 | 62 ± 21 | 75 ± 24 |
| Cardiac output (1/min) | 5.5 ± 1.3 | 5.4 ± 1.3 | 6.0 ± 2.0 | 7.0 ± 3 |
| Left ventricular Volumetry | ||||
| Ejection fraction (%) | 59.5 ± 6.0 | 59.6 ± 6.3 | 65.3 ± 6.9 | 40 ± 17 |
| End-systolic volume (ml/m2) | 31.9 ± 8.6 | 31.6 ± 8.9 | 28.2 ± 7.9 | 79 ± 43 |
| End-diastolic volume (ml/m2) | 78.3 ± 13.9 | 77.7 ± 14.0 | 81.2 ± 14.4 | 127 ± 52 |
| Mass (g/m2) | 45.2 ± 8.5 | 44.9 ± 8.3 | 62.8 ± 15.3 | 91 ± 39 |
| Mean global ED | 1.169 ± 0.028 | 1.169 ± 0.029 | 1.215 ± 0.038 | 1.218* ± 0.075 |
Extended Data Table 2. Annotations of trabeculation-associated loci.
Overview of the 16 independent loci discovered in the trabeculation GWAS. The genetic variant with the lowest p-value per locus is shown. Annotations: PheWAS: phase 2 PheWAS described by46 (phenotype reference ID in parentheses; derived from open Targets Genetics v0.3.2), GWAS: GWAS catalogue23, eQTLs and tissues: GTEx catalogue v725. Chromosomes (CHR), base pair positions (BP) and nearest protein coding gene (nPCG): GRCh37 (Ensembl GRCh37 Release 95). No entry indicated by -. BP, Blood pressure; LV, left ventricle; AA, atrial appendage.
| CHR | BP | SNP | nPCG | PheWAS | GWAS | eQTLS | Tissues |
|---|---|---|---|---|---|---|---|
| 1 | 61895257 | rs6587924 | TM2D1 | - | - | - | - |
| 1 | 155962067 | rs35770803 | ARHGEF2 | - | - | - | - |
| 1 | 201332020 | rs 1892027 | TNNT2 | - | - | PKP1 | Skeletal muscle, adipose |
| 2 | 179531078 | rs71394376 | TTN | - | - | - | - |
| 3 | 73554922 | rs4677294 | PDZRN3 | - | - | PDZRN3, PDZRN3-AS1 | LV, artery, AA, aorta |
| 3 | 169191428 | rs 1918978 | MECOM | - | - | - | - |
| 5 | 153871841 | rs 10076436 | HAND1 | - | - | SAP30L | Transformed fibroblasts |
| 6 | 31081940 | rs3130976 | PSORS1C1 | 84 phenotypes | Nephropathy, adult asthma, CLE | 18 genes | 37 tissues including LV and AA |
| 6 | 118690014 | rs9320648 | PLN | Pulse rate, diastolic BP (4195, 102) | - | SSXP10, CEP85L, SLC35F1 | 13 tissues including AA |
| 8 | 11794962 | rs698l46l | DEFB136 | - | C-reactive protein | 28 genes | 35 tissues including LV and AA |
| 8 | 125859817 | rs35006907 | MTSS1 | - | Ejection fraction, fractional shortening, LV internal dimension in systole and diastole, relative wall thickness, LV internal dimension, atrial fibrillation | MTSS1, LINC00964 | LV, lung, AA |
| 12 | 115381071 | rs7132327 | TBX3 | - | Global electrical heterogeneity phenotypes, QRS complex, QRS duration, PR segment, PR interval | - | - |
| 14 | 71990847 | rs71105784 | SIPA1L1 | - | QRS complex, QRS duration, mitral valve prolapse | - | - |
| 17 | 45013271 | rs 17608766 | GOSR2 | Systolic BP, hypertension (4080, 6150_4, 6150_100, 20002_1065, 103) | Systolic BP, QRS duration, pulse pressure, BP, aortic root size, atrial fibrillation | RPRML, GOSR2, CDC27, RP11-63A1.2, RP11-156P1.3 | Skeletal muscle, testis, adrenal gland |
| 19 | 7581244 | rs 113394178 | ZNF358 | - | - | ZNF358 | AA |
| 22 | 33127481 | rs3788488 | TIMP3 | - | - | - | - |
Supplementary Material
Acknowledgments
The research was supported by the Medical Research Council, UK (MC-A651-53301); British Heart Foundation (NH/17/1/32725, RG/19/6/34387, RE/18/4/34215); Wellcome Trust (107469/Z/15/Z); National Institute of Environmental Health Sciences (R01 ES029917-02); Heidelberg University; the Simons Center for Quantitative Biology at Cold Spring Harbor Laboratory; and the National Institute for Health Research Biomedical Research Centre based at Imperial College Healthcare NHS Trust and Imperial College London. P.M.M. also has been in receipt of generous personal and research support from the Edmond J Safra Foundation and Lily Safra, an NIHR Senior Investigator’s Award, the Medical Research Council and the UK Dementia Research Institute. R.T.L. is supported by a UKRI Health Data Research Rutherford Fellowship (MR/S003754/1). A.H. is supported by a BHF PhD Studentship. J.G. is supported by a Research Center for Molecular Medicine (HRCMM) Career Development Fellowship, the MD/PhD program of the Medical Faculty Heidelberg, the Deutsche Herzstiftung e.V. (S/02/17), and by an Add-On Fellowship for Interdisciplinary Science of the Joachim Herz Stiftung.
Research funding for cohorts used in Mendelian Randomisation: NIHR Cardiovascular Biomedical Research Unit of Royal Brompton and Harefield NHS Foundation Trust (DCM cohort); Funding information for HERMES participating studies is detailed in Shah et al. 2020 (https://doi.org/10.1038/s41467-019-13690-5); data aggregation and downstream bioinformatics were funded through grants from the MRC Proximity to Discovery scheme, the NIHR UCLH Biomedical Research Centre, and the EU/EFPIA Innovative Medicines Initiative 2 Joint Undertaking BigData@Heart grant no. 116074.
The authors would like to thank Dr Hideaki Suzuki, previously of the Department of Medicine, Imperial College London, for his work on pre-processing the image data, and Prof Roberto Fumero, at the Politecnico di Milano, Italy, for advice on the finite element modelling. The authors thank Virginie Uhlmann (EMBL-EBI) for advice on radial image registration. We also thank L. Schertel and C. Baader for sgRNA production and the Wittbrodt Laboratory for critical discussion and support. We also acknowledge Ben Statton and Marjola Thanaj at Imperial College London for assisting with data pre-processing.
Footnotes
Competing interests
The authors declare no competing interests.
Author contributions
H.V.M. and T.J.W.D. performed the formal analysis and co-wrote the manuscript; M.S. and M.L.C. performed the in silico modelling; T.J.W.D and A.M. collected and analysed image data; R.T.L, A.H., J.S.W. and S.K.P collected and analysed the clinical data; W.B., P.T., J.C. and D.R. developed the computational phenotyping; J.G., T.T., and J.W. detailed the experimental strategy for the medaka validation; J.G. and T.T. designed and performed CRISPR-Cas9 knock-out experiments, and conducted phenotypic analysis under the guidance of J.W.; J.G. acquired LSM recordings, and analyzed and plotted the medaka knock-out and imaging data.; P.M.M., E.B., S.A.C. and D.P.O. provided critical interpretation of the results; E.B., S.A.C. and D.P.O. conceived the study, managed the project and revised the manuscript. All authors reviewed the final manuscript.
Data availability
The genetic and phenotypic UK Biobank data presented in this work are available to any bona fide researcher upon application to UK Biobank (https://bbams.ndph.ox.ac.uk/ams/). The research was conducted under access number 40616. The GWAS summary level data used in this study are publicly-available (https://www.ebi.ac.uk/gwas/, http://ldsc.broadinstitute.org/ and http://www.hermesconsortium.org/). Figures 1, 3 and 4 contain raw data which are provided as source data unless prior application to UK Biobank is required.
Code availability
The analysis code is freely available on GitHub (10.5281/zenodo.3698268).
References
- 1.Sedmera D, McQuinn T. Embryogenesis of heart muscle. Heart Fail Clin. 2008;4:235–245. doi: 10.1016/j.hfc.2008.02.007. [DOI] [PMC free article] [PubMed] [Google Scholar]
- 2.Sizarov A, et al. Formation of the building plan of the human heart: morphogenesis, growth, and differentiation. Circulation. 2011;123:1125–35. doi: 10.1161/CIRCULATIONAHA.110.980607. [DOI] [PubMed] [Google Scholar]
- 3.Kawabata Galbraith K, et al. MTSS1 regulation of actin-nucleating formin DAAM1 in dendritic filopodia determines final dendritic configuration of Purkinje cells. Cell Rep. 2018;24:95–106.e9. doi: 10.1016/j.celrep.2018.06.013. [DOI] [PubMed] [Google Scholar]
- 4.Praschberger R, et al. Mutations in Membrin/GOSR2 reveal stringent secretory pathway demands of dendritic growth and synaptic integrity. Cell Rep. 2017;21:97–109. doi: 10.1016/j.celrep.2017.09.004. [DOI] [PMC free article] [PubMed] [Google Scholar]
- 5.Chen X, et al. Knockout of SRC-1 and SRC-3 in mice decreases cardiomyocyte proliferation and causes a noncompaction cardiomyopathy phenotype. Int J Biol Sci. 2015;11:1056–72. doi: 10.7150/ijbs.12408. [DOI] [PMC free article] [PubMed] [Google Scholar]
- 6.Luxán G, D’Amato G, de la Pompa JL. Intercellular Signaling in Cardiac Development and Disease: The NOTCH pathway. Springer; Japan, Tokyo: 2016. pp. 103–114. [PubMed] [Google Scholar]
- 7.Han P, et al. Coordinating cardiomyocyte interactions to direct ventricular chamber morphogenesis. Nature. 2016;534:700–4. doi: 10.1038/nature18310. [DOI] [PMC free article] [PubMed] [Google Scholar]
- 8.Captur G, et al. Morphogenesis of myocardial trabeculae in the mouse embryo. J Anat. 2016;229:314–25. doi: 10.1111/joa.12465. [DOI] [PMC free article] [PubMed] [Google Scholar]
- 9.Miquerol L, et al. Biphasic development of the mammalian ventricular conduction system. Circ Res. 2010;107:153–161. doi: 10.1161/CIRCRESAHA.110.218156. [DOI] [PubMed] [Google Scholar]
- 10.del Monte-Nieto G, et al. Control of cardiac jelly dynamics by NOTCH1 and NRG1 defines the building plan for trabeculation. Nature. 2018;557:439–445. doi: 10.1038/s41586-018-0110-6. [DOI] [PubMed] [Google Scholar]
- 11.van Weerd JH, Christoffels VM. The formation and function of the cardiac conduction system. Development. 2016;143:197–210. doi: 10.1242/dev.124883. [DOI] [PubMed] [Google Scholar]
- 12.Vedula V, Seo J-H, Lardo AC, Mittal R. Effect of trabeculae and papillary muscles on the hemodynamics of the left ventricle. Theor Comput Fluid Dyn. 2016;30:3–21. [Google Scholar]
- 13.Sacco F, et al. Left ventricular trabeculations decrease the wall shear stress and increase the intra-ventricular pressure drop in CFD simulations. Front Physiol. 2018;9:458. doi: 10.3389/fphys.2018.00458. [DOI] [PMC free article] [PubMed] [Google Scholar]
- 14.Paun B, Bijnens B, Butakoff C. Relationship between the left ventricular size and the amount of trabeculations. Int J Numer Method Biomed Eng. 2018;34:e2939. doi: 10.1002/cnm.2939. [DOI] [PubMed] [Google Scholar]
- 15.van Waning JI, et al. Genetics, clinical features, and long-term outcome of noncompaction cardiomyopathy. J Am Coll Cardiol. 2018;71:711–722. doi: 10.1016/j.jacc.2017.12.019. [DOI] [PubMed] [Google Scholar]
- 16.Bycroft C, et al. The UK biobank resource with deep phenotyping and genomic data. Nature. 2018;562:203–209. doi: 10.1038/s41586-018-0579-z. [DOI] [PMC free article] [PubMed] [Google Scholar]
- 17.Petersen SE, et al. UK biobank’s cardiovascular magnetic resonance protocol. J Cardiovasc Magn Reson. 2016;18:8. doi: 10.1186/s12968-016-0227-4. [DOI] [PMC free article] [PubMed] [Google Scholar]
- 18.Tarroni G, et al. Learning-based quality control for cardiac MR images. IEEE Trans Med Imaging. 2019;38:1127–1138. doi: 10.1109/TMI.2018.2878509. [DOI] [PubMed] [Google Scholar]
- 19.Bai W, et al. A bi-ventricular cardiac atlas built from 1000+ high resolution MR images of healthy subjects and an analysis of shape and motion. Med Image Anal. 2015;26:133–45. doi: 10.1016/j.media.2015.08.009. [DOI] [PubMed] [Google Scholar]
- 20.Shah S, et al. Genome-wide association and Mendelian randomisation analysis provide insights into the pathogenesis of heart failure. Nat Commun. 2020;11 doi: 10.1038/s41467-019-13690-5. 163. [DOI] [PMC free article] [PubMed] [Google Scholar]
- 21.Bai W, et al. Automated cardiovascular magnetic resonance image analysis with fully convolutional networks. J Cardiovasc Magn Reson. 2018;20:65. doi: 10.1186/s12968-018-0471-x. [DOI] [PMC free article] [PubMed] [Google Scholar]
- 22.Captur G, et al. Fractal analysis of myocardial trabeculations in 2547 study participants: Multi-ethnic study of atherosclerosis. Radiology. 2015;277:707–15. doi: 10.1148/radiol.2015142948. [DOI] [PMC free article] [PubMed] [Google Scholar]
- 23.MacArthur J, et al. The new NHGRI-EBI Catalog of published genome-wide association studies (GWAS Catalog) Nucleic Acids Res. 2017;45:D896–D901. doi: 10.1093/nar/gkw1133. [DOI] [PMC free article] [PubMed] [Google Scholar]
- 24.Sudlow C, et al. UK biobank: an open access resource for identifying the causes of a wide range of complex diseases of middle and old age. PLoS Med. 2015;12:1–10. doi: 10.1371/journal.pmed.1001779. [DOI] [PMC free article] [PubMed] [Google Scholar]
- 25.GTEx portal. 2018 https://gtexportal.org/
- 26.Zerbino DR, Wilder SP, Johnson N, Juettemann T, Flicek PR. The Ensembl regulatory build. Genome Biol. 2015;16:56. doi: 10.1186/s13059-015-0621-5. [DOI] [PMC free article] [PubMed] [Google Scholar]
- 27.Burkhoff D, Mirsky I, Suga H. Assessment of systolic and diastolic ventricular properties via pressure-volume analysis: a guide for clinical, translational, and basic researchers. Am J Physiol Heart Circ Physiol. 2005;289:H501–12. doi: 10.1152/ajpheart.00138.2005. [DOI] [PubMed] [Google Scholar]
- 28.Seemann F, et al. Noninvasive quantification of pressure-volume loops from brachial pressure and cardiovascular magnetic resonance. Circ Cardiovasc Imaging. 2019;12:e008493. doi: 10.1161/CIRCIMAGING.118.008493. [DOI] [PubMed] [Google Scholar]
- 29.Zheng J, et al. LD Hub: a centralized database and web interface to perform LD score regression that maximizes the potential of summary level GWAS data for SNP heritability and genetic correlation analysis. Bioinformatics. 2017;33:272–279. doi: 10.1093/bioinformatics/btw613. [DOI] [PMC free article] [PubMed] [Google Scholar]
- 30.Hemani G, et al. The MR-Base platform supports systematic causal inference across the human phenome. eLife. 2018;7:e34408. doi: 10.7554/eLife.34408. [DOI] [PMC free article] [PubMed] [Google Scholar]
- 31.Smith GD, et al. Clustered Environments and Randomized Genes: A Fundamental Distinction between Conventional and Genetic Epidemiology. PLoS Med. 2007;4:e352. doi: 10.1371/journal.pmed.0040352. [DOI] [PMC free article] [PubMed] [Google Scholar]
- 32.Hemani G, Tilling K, Davey Smith G. Orienting the causal relationship between imprecisely measured traits using GWAS summary data. PLoS Genet. 2017;13:e1007081. doi: 10.1371/journal.pgen.1007081. [DOI] [PMC free article] [PubMed] [Google Scholar]
- 33.Keele K. Leonardo Da Vinci’s Elements of the Science of Man. Academic Press; 2014. [Google Scholar]
- 34.Jensen B, Wang T, Christoffels VM, Moorman AF. Evolution and development of the building plan of the vertebrate heart. Biochim Biophys Acta. 2013;1833:783–94. doi: 10.1016/j.bbamcr.2012.10.004. [DOI] [PubMed] [Google Scholar]
- 35.Brutsaert DL. Cardiac endothelial-myocardial signaling: its role in cardiac growth, contractile performance, and rhythmicity. Physiol Rev. 2003;83:59–115. doi: 10.1152/physrev.00017.2002. [DOI] [PubMed] [Google Scholar]
- 36.Morley MP, et al. Cardioprotective effects of MTSS1 enhancer variants. Circulation. 2019;139:2073–2076. doi: 10.1161/CIRCULATIONAHA.118.037939. [DOI] [PMC free article] [PubMed] [Google Scholar]
- 37.Wild PS, et al. Large-scale genome-wide analysis identifies genetic variants associated with cardiac structure and function. J Clin Invest. 2017;127:1798–1812. doi: 10.1172/JCI84840. [DOI] [PMC free article] [PubMed] [Google Scholar]
- 38.Aung N, et al. Genome-wide analysis of left ventricular image-derived phenotypes identifies fourteen loci associated with cardiac morphogenesis and heart failure development. Circulation. 2019;140:1318–1330. doi: 10.1161/CIRCULATIONAHA.119.041161. [DOI] [PMC free article] [PubMed] [Google Scholar]
- 39.Kenkel NC, Walker DJ. Fractals in the biological sciences. Coenoses. 1996;11:77–100. [Google Scholar]
- 40.Olejnícˇková V, Šanˇková B, Sedmera D, Janácˇek J. Trabecular architecture determines impulse propagation through the early embryonic mouse heart. Front Physiol. 2019;9:1876. doi: 10.3389/fphys.2018.01876. [DOI] [PMC free article] [PubMed] [Google Scholar]
- 41.Ingles J, et al. Evaluating the clinical validity of hypertrophic cardiomyopathy genes. Circ Genom Precis Med. 2019;12:e002460. doi: 10.1161/CIRCGEN.119.002460. [DOI] [PMC free article] [PubMed] [Google Scholar]
- 42.Schafer S, et al. Titin-truncating variants affect heart function in disease cohorts and the general population. Nat Genet. 2017;49:46–53. doi: 10.1038/ng.3719. [DOI] [PMC free article] [PubMed] [Google Scholar]
- 43.Miszalski-Jamka K, et al. Novel genetic triggers and genotype-phenotype correlations in patients with left ventricular noncompaction. Circ Cardiovasc Genet. 2017;10:e001763. doi: 10.1161/CIRCGENETICS.117.001763. [DOI] [PMC free article] [PubMed] [Google Scholar]
- 44.Tayal U, Prasad S, Cook SA. Genetics and genomics of dilated cardiomyopathy and systolic heart failure. Genome Med. 2017;9:20. doi: 10.1186/s13073-017-0410-8. [DOI] [PMC free article] [PubMed] [Google Scholar]
- 45.Munafo MR, Davey Smith G. Robust research needs many lines of evidence. Nature. 2018;553:399–401. doi: 10.1038/d41586-018-01023-3. [DOI] [PubMed] [Google Scholar]
- 46.UK Biobank - Neale Lab. 2018 http://www.nealelab.is/uk-biobank/
Associated Data
This section collects any data citations, data availability statements, or supplementary materials included in this article.
Supplementary Materials
Data Availability Statement
The genetic and phenotypic UK Biobank data presented in this work are available to any bona fide researcher upon application to UK Biobank (https://bbams.ndph.ox.ac.uk/ams/). The research was conducted under access number 40616. The GWAS summary level data used in this study are publicly-available (https://www.ebi.ac.uk/gwas/, http://ldsc.broadinstitute.org/ and http://www.hermesconsortium.org/). Figures 1, 3 and 4 contain raw data which are provided as source data unless prior application to UK Biobank is required.
The analysis code is freely available on GitHub (10.5281/zenodo.3698268).


