Summary
On March 11, 2020, the World Health Organization declared COVID-19 a pandemic1. The outbreak containment strategies in China based on non-pharmaceutical interventions (NPIs) appear to be effective2, but quantitative research is still needed to assess the efficacy of NPIs and their timings3. Using epidemiological and anonymised human movement data4,5, here we develop a modelling framework that uses daily travel networks to simulate different outbreak and intervention scenarios across China. We estimated that there were a total of 114,325 COVID-19 cases (interquartile range 76,776 -164,576) in mainland China as of February 29, 2020. Without NPIs, the COVID-19 cases would likely have shown a 67-fold increase (interquartile range 44 - 94) by February 29, 2020, with the effectiveness of different interventions varying. The early detection and isolation of cases was estimated to have prevented more infections than travel restrictions and contact reductions, but combined NPIs achieved the strongest and most rapid effect. The lifting of travel restrictions since February 17, 2020 does not appear to lead to an increase in cases across China if the social distancing interventions can be maintained, even at a limited level of 25% reduction on average through late April. Our findings contribute to an improved understanding of NPIs on COVID-19 and to inform response efforts across the World.
Introduction
As of March 30, 2020 the COVID-19 outbreak has resulted in 693,282 confirmed cases and33,106 deaths across the World6. As an emerging disease, effective pharmaceutical interventions are not expected to be available for months7, and healthcare resources will be limited for treating all cases. Nonpharmaceutical interventions (NPIs) are therefore essential components of the public health response to outbreaks6,8–10. These include isolating ill persons, contact tracing, quarantine of exposed persons, travel restrictions, school and workplace closures, cancellation of mass gatherings, and hand washing, among others8–10. These measures aim to reduce transmission, thereby delaying the timing and reducing the size of the epidemic peak, buying time for preparations in the healthcare system, and enabling the potential for vaccines and drugs to be used later on8.
Three major groups of NPIs have been implemented to contain the spread and reduce the outbreak size of COVID-19 across China11. First, inter-city travel restrictions were used to prevent further seeding of the virus during the Chinese new year (CNY) holiday. A cordon sanitaire of Wuhan and surrounding cities in Hubei Province was put in place two days before CNY’s day on January 25, 2020. Since CNY’s day, travel restrictions in other provinces were also put in place across the country. Early identification and isolation of cases comprised the second group of NPIs, including improving the screening, identification, diagnosis, isolation, reporting, and contact tracing of suspected ill persons and confirmed cases11. Along these lines, local governments across China encouraged and supported routine screening and quarantine of travellers from Hubei Province in an attempt to detect COVID-19 infections as early as possible. Highlighting how these efforts improved detection and diagnosis, the average interval from symptom onset to laboratory confirmation dropped from 12 days in the early stages of the outbreak to 3 days in early February3,12. Third, contact restrictions and social distancing measures, together with personal preventive actions, such as hand washing, were implemented to reduce the community-level exposure risk. As part of these social distancing policies, the Chinese government encouraged people to stay at home as much as possible, cancelled or postponed large public events and mass gatherings, and closed libraries, museums, and workplaces13,14. Additionally, school holidays were also extended, with the CNY holiday end date changed from January 30 to March 10 for Hubei province, and February 9 for many other provinces15,16.
The implementation of these NPIs coincided with a rapid decline in the number of new cases across China, albeit at high economic and social costs3,12. Previous studies have preliminarily explored the lockdown of Wuhan17,18, travel restrictions19, airport screening20, and the isolation of cases and contact tracing for containing virus transmission21. However, a comprehensive and quantitative comparison of the effectiveness of different NPIs in China and their timings for containing the COVID-19 outbreak is lacking. Based on epidemiological data on COVID-19 and historical and near-real time anonymised human movement data, we developed a travel network-based stochastic susceptible-exposed-infectious-removed (SEIR) modelling framework to simulate the COVID-19 spread across 340 prefecture-level cities in mainland China. Within each city, numbers of susceptible, exposed, infectious, and recovered/removed people were estimated per day since December 1, 2019. Using this modelling framework, we conducted before-and-after comparable analyses to quantify the relative effect of the three major groups of NPIs in China, including the restriction of inter-city population movement, the identification and isolation of cases, and the reduction of inner-city travel and contact to increase social distance. We also assessed the risk of COVID-19 transmission since the lifting of travel restrictions on February 17, 2020.
Results
Reconstruction of COVID-19 spread
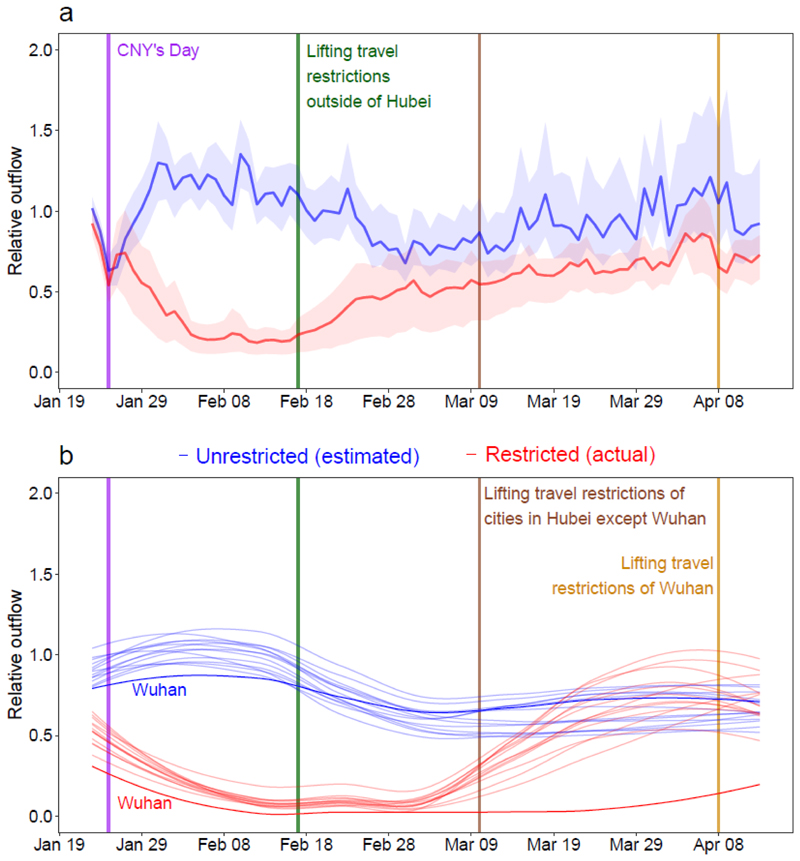
The epidemiological parameters estimated for the early stage of the outbreak in Wuhan were initially used to parameterise the epidemic before widely implementing interventions5. The three major groups of NPIs outlined above were derived and measured from inter-city and inner-city population movement data, obtained from smartphone users of Baidu location-based services4, and data on delay from illness onset to reporting of cases across the country. Population travel and contact patterns have changed significantly since the implementation of interventions, with the timeliness of case reporting also improving (Fig. 1 and Supplementary Information Files 1 and 2). These indicators were then incorporated into the model (see Methods).
Fig. 1. Relative daily volume of outbound travellers from cities (prefecture level) across mainland China, January 23 – April 13, 2020.
(a) All cities (n=340) in mainland China, presented with the median (solid line) and interquartile range (shading) of relative outbound flows. (b) Cities in Hubei province with Wuhan highlighted by using darker colours. Each red line represents the outflow of each city in 2020, standardized by the mean of daily outflows of each city on January 20th – 22nd, 2020. Each blue line represents estimates of normal outflow by city under the scenario of no travel restrictions, following travel in previous years. The lines of relative volume in (b) were smoothed by using locally estimated scatterplot smoothing (LOESS) regression.
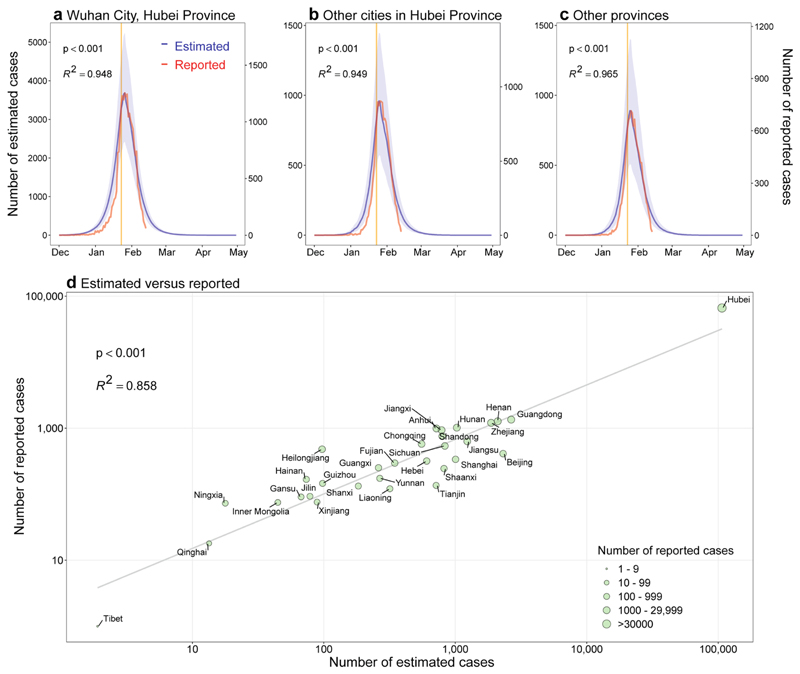
We estimated that there were a total of 114,325 COVID-19 cases (interquatile range [IQR] 76,776 – 164,576) in mainland China as of February 29, 2020, with 85% of these in Hubei Province (Extended Data Table 1). The outbreak increased exponentially prior to CNY, but the peak of epidemics across the country quickly appeared at CNY, following the implementing NPIs. The estimated epidemics and peaks were consistent with patterns of reported data by onset date, with high correlations between daily estimates and reported data found across time and regions (Extended Data Fig. 1). The overall correlation between the number of estimated cases and the reported number by province, as of February 29, 2020, was also significant (p<0.001, R 2=0.86), with a high sensitivity (91%, 280/308) and specificity (69%, 22/32) in predicting cities with or without COVID-19 cases (Extended Data Fig. 1Sa and 1b).
Quantifying the effect of different NPIs
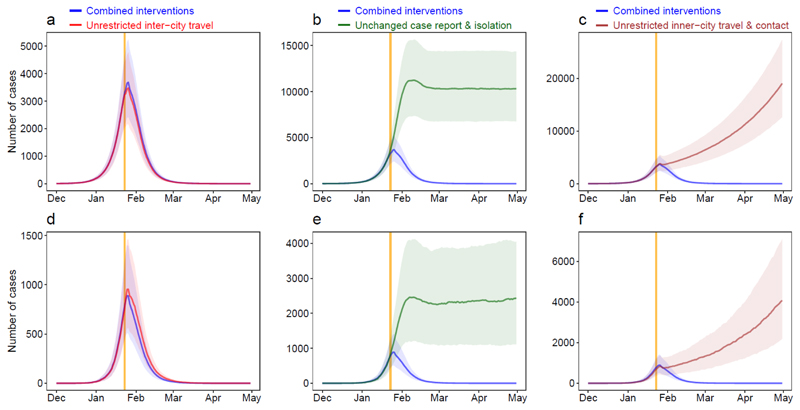
Without NPIs, as of February 29, the number of COVID-19 cases would increase rapidly across China, with a 51-fold (IQR 33 - 71) increase in Wuhan, a 92-fold (58 - 133) increase in other cities in Hubei, and a 125-fold (77 - 180) increase in other provinces. However, the apparent effectiveness of different interventions varied (Fig. 2). The lockdown of Wuhan might not have prevented the seeding of the virus from the city, as the travel ban was put in place at the latter stages of pre-CNY population movement out of the city (Fig. 1b)22. Nevertheless, if inter-city travel restrictions were not implemented, cities and provinces outside of Wuhan would have received more cases from Wuhan, and the affected geographic range would have expanded to the remote western areas of China (Extended Data Fig. 2c). Generally, the early detection and isolation of cases was estimated to quickly and substantially prevent more infections than contact reduction and social distancing across the country (5-fold versus 2.6-fold). However, without the intervention of contact reductions, in the longer term, the epidemics would increase exponentially across regions (Fig. 2c and 2f). Therefore, combined NPIs would achieve the strongest and most rapid effect on COVID-19 outbreak containment, with about a one-week interval from NPIs to epidemic peak (Extended Data Table 1).
Fig. 2. Estimated epicurves of the COVID-19 outbreak under various scenarios with or without non-pharmaceutical interventions (NPIs) by region.
(a) – (c) Wuhan City. (d) – (f) Provinces outside of Hubei Province in mainland China. The blue lines present estimated transmission under current combined NPIs, and each other line represents the scenario without one type of intervention. The median and interquartile range of estimates (1000 simulations) are presented here. The orange vertical line indicates the date of Wuhan’s lockdown on January 23, 2020.
Intervention timings
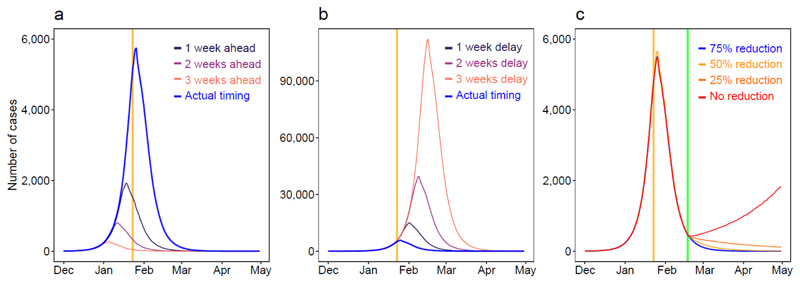
If interventions in China could have been conducted one week, two weeks, or three weeks earlier, cases could have been dramatically reduced by 66% (IQR 50% - 82%), 86% (81% - 90%), or 95% (93% - 97%), respectively (Fig. 3a). The geographical range of affected areas would also shrink from 308 cities to 192, 130, and 61 cities, respectively (Extended Data Fig. 3). However, if NPIs were conducted one week, two weeks, or three weeks later than they were, cases may have shown a 3-fold (IQR 2 - 4), 7-fold (5 - 10), or 18-fold (11 - 26) increase, respectively (Fig. 3b).
Fig. 3. Estimates of the COVID-19 outbreak under various scenarios of intervention timing and lifting of travel restrictions across China.
(a) Estimated epicurves under interventions implemented earlier than actual timing. (b) Estimated epicurves under interventions implemented later than actual timing. (c) Estimated COVID-19 spread under different population contact rates after lifting intercity travel restrictions on Feburary 17, 2020. The orange vertical lines indicate the date of Wuhan’s lockdown, and the green line shows the date of travel restrictions being lifted.
The lifting of travel restrictions
Under interventions implemented as of 17 February, 2020, the epidemics outside of Hubei province likely reached a low level (<10 cases per day, excluding imported cases from other countries) in early March, while Hubei Province might need another four weeks to reach same level as other provinces. However, if population contact resumed to the normal levels seen in previous years, the lifting of travel restrictions since February 17 might cause case numbers to rise again (Fig. 3c). Accordingly, our simulations suggest that maintaining social distancing at even a limited degree (e.g. 25% contact reduction on average) through late April would help ensure control of COVID-19 in epicentres like Wuhan.
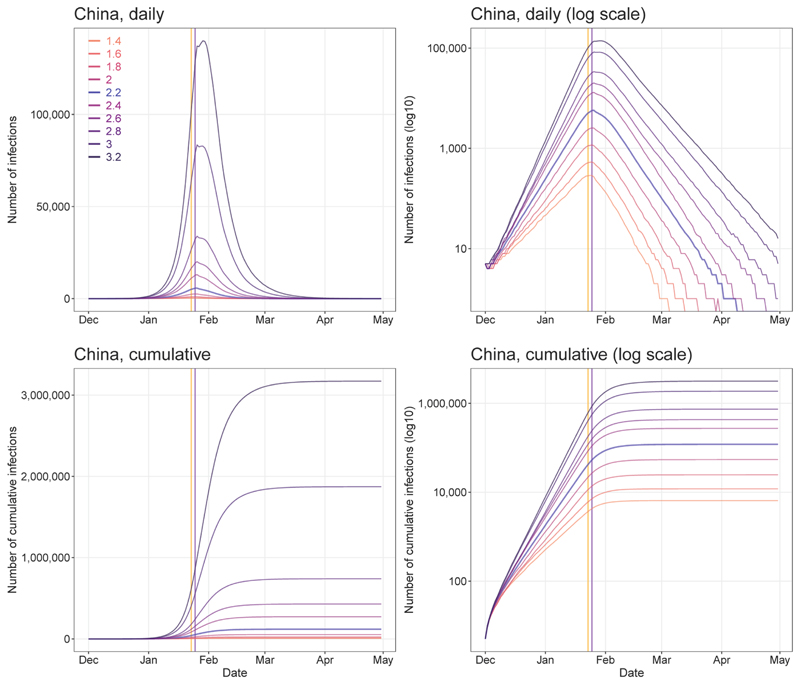
Our estimates were sensitive to the basic reproduction number (R0), with a higher and later peak of epidemics and longer time needed to contain the outbreak under a higher R0 (Extended Data Fig. 3). Sensitivity analyses also suggested that our model could have robustly measured relative changes in the efficacy of interventions under different epidemiological parameters and transmission senarios (Extended Data Figs. 4 - 9).
Extending findings
Our findings show that combined NPIs substantially reduced COVID-19 transmission across China. Earlier implementation of NPIs could have significantly reduced the magnitude and geographical range of the outbreak, but equally, a delayed response would have lead to a larger outbreak. China's aggressive, multifaceted response is likely to have prevented a far worse situation, which would have accelerated spread globally. The lessons drawn from China provide robust evidence and provide a preparation window and fighting chance for containing the spread and mitigating the effects of COVID-19 in other regions around the World3,12.
Our results suggest three key points. First, they support and validate the idea that population movement and close contact has a major role in the spread of COVID-19 within and beyond China22,23. As the lockdown of Wuhan happened at the latter stages of the pre-CNY movement, travel restrictions did not halt the seeding of the virus from Wuhan, but did prevent cases being exported from Wuhan to a wider area. Secondly, the importance and effects of the three types of NPIs differed. Compared to travel restrictions, improved detection and isolation of cases as well as the social distancing likely had a greater impact on the containment of outbreak. The social distancing intervention reduced contact with people who travelled from the epicentre of the outbreak. This is likely to have been especially helpful in curbing the spread of an emerging pathogen to the wider community, and reduced the spread risk from asymptomatic or mild infections8. Third, given travel and work resuming in China, the country should consider at least the partial continuation of NPIs to ensure that the COVID-19 outbreak is sustainably controlled for the first wave of this outbreak. For example, early case identification and isolation should be maintained, which may also help to prevent and delay the arrival of a second wave, considering the increasing numbers of cases imported from other countries and the presence of asymptomatic or subclinical infections found in China24.
The analyses presented here represent the most comprehensive study yet in which the effect of NPIs on COVID-19 transmission has been quantitatively assessed. The model framework accounts for daily interactions of populations, interventions between and within cities, as well as the inherent statistical uncertainty associated with a paucity of epidemiological parameters, before and after the implementation of interventions. The network-based SEIR model is methodologically robust and built on the basic SEIR models previously used to predict COVID-19 transmission in its early stages23. Considering delays in case reporting, our approach can be used for rapid, ongoing estimation of the effectiveness of various NPIs in different countries for outbreak control decision-making.
Our study has several limitations. First, as our simulations were based on parameters estimated for symptomatic cases found in the early stage of the outbreak in Wuhan, which may not account for asymptomatic and mild infections, we may have underestimated the total number of infections. Second, our findings could be confounded by other factors that changed during the outbreak. Although we have shown that the apparent fall in incidence of COVID-19 since CNY’s day in China is likely to be attributed to the interventions taken, we cannot rule out the possibility that the decrease is partially attributable to other unknown seasonal factors, e.g. temperature and absolute humidity25,26. Third, if the epidemiological parameters of COVID-19 transmission in other cities across China differed with estimates from the outbreak at the early stage where no NPIs were in place in Wuhan, then our estimates of the effectiveness of interventions in reducing COVID-19 transmission could be biased. Fourth, coverage biases in mobile phone and Baidu users likely exist. Though a high percentage (from 46.9% in 2013 to 55.3% in 2018) of the population owns smartphones in China27,28, the mobile user group still does not cover specific subgroups of the population, particularly children. Therefore, our population movement data may provide an incomplete picture, and differences between the characteristics of smartphone owners and non-owners may also bias estimates in this study. Additionally, the magnitude and patterns of movements could change year by year, although previous studies have supported the consistent seasonality of travel patterns across years in China and other countries.22 Lastly, we only examined three main groups of NPIs and other interventions might also have contributed to the outbreak containment. For example, due to the data availability, we did not assess the effect of personal hygiene and protective equipment on containing COVID-19 spread. Other data sources and further investigations are needed to measure and elaborate the efficacy of each intervention.
COVID-19 has caused a substantial burden on health systems and society across many countries. From a public health standpoint, our results highlight that countries should consider proactively planning NPIs and relevant resources for containment and mitigation, given how the earlier implementation of NPIs could have lead to significant reductions in size of the outbreak in China. The results here also provide guidance for countries as to the likely effectiveness of different NPIs at different stages of an outbreak. Suspected and confirmed cases should be identified, diagnosed, isolated and reported as early as possible to control the source of infection, and the implementation of cordon sanitaires or travel restrictions for significantly affected areas may prevent seeding the virus to wider regions. Reducing contact and increasing social distance, together with improved personal hygiene can protect vulnerable populations and mitigate COVID-19 spread at the community level, and these interventions should be promoted throughout the outbreak to avoid resurgence. As called by the World Health Organization, and backed up by our findings for China here, early and integrated NPI strategies should be prepared, deployed and adjusted to maximise benefits of these interventions and minimize health, social and economic impacts around the World3.
Methods
A travel network-based stochastic susceptible-exposed-infectious-removed (SEIR) model was built to simulate the COVID-19 spread between and within all prefecture-level cities in mainland China. This model has been made openly available for further use at https://github.com/wpgp/BEARmod. Population movement data across the country were used to estimate the intensity of travel restrictions and contact reductions. Data from illness onset to reporting of the first index case for each county were used to infer the changing timeliness of case identification and isolation across the course of the outbreak. The outputs of the model under NPIs were validated by using daily numbers of new cases reported across all regions in mainland China. Based on this modelling framework, the efficacy of applying or lifting non-pharmaceutical measures under various senarios and timings were tested and quantified.
Data sources
Three population movement datasets, obtained from Baidu location-based services providing over 7 billion positioning requests per day4,29, were used in this study to measure travel restrictions and social distancing across time and space. The first is an aggregated and de-identified dataset on near-real time daily relative outbound and inbound flow of smartphone users for each prefecture-level city in 2020 (340 cities in mainland China were included) to understand mobility patterns during the outbreak. The daily outflow from each city since Wuhan’s lockdown and travel restrictions that were applied on January 23 were rescaled by the mean daily flow for each city during January 20 – 22 for comparing travel reductions across cities and years (Fig. 1).
The second Baidu dataset is a historical relative movement matrix with daily total number of users at city level from December 26, 2014 to May 26, 2015, aligning with the 2020 CNY holiday period, for which the corresponding period is December 1, 2019 to April 30, 2020. We assumed that the pattern of population movements was the same in years when there were no outbreaks and interventions. Adjusted by the level of travel reductions derived from the 2020 dataset where applicable, the second dataset was used to simulate the COVID-19 spread and predict future transmission via population movements under various scenarios, with or without inter-city travel restrictions. Corresponding city-level population data in 2015 for modelling were obtained from the Chinese Bureau of Statistics30.
The third Baidu dataset measures daily population movements at county level (2862 counties in China) from January 26 through April 30, 2014, as described elsewhere31. Based on the assumption that the pattern of population contact was consistent across years when there were no interventions, it was used to estimate inner-city travel and contact reduction under the outbreak and interventions. First, we aggregated data from county to city level and rescaled the daily flows since January 29, 2014 by the mean of the daily flow for the January 26 – 28 period, aligning with the date of Wuhan’s lockdown and the 2020 CNY holiday. Then, the rescaled first dataset for 2020 under interventions was compared with the 2014 dataset to derive the percentage of travel decline for each city. The percentages for cities were averaged by day to preliminarily quantify the intensity of contact reduction in China under NPIs (Supplementary Information File 2), as the policies of travel restriction and social distancing measures were implemented and occurred at the same time across the country.
We also collated data of the first case reported by county across mainland China to measure the delay from illness to case report as a reference of the improved timeliness of case identification, isolation and reporting during the outbreak (Supplementary Information File 1). The daily number of COVID-19 cases by date of illness onset in Wuhan City, Hubei Province and other provinces as of February 13, 2020 were used to further validate the epicurves estimated in this study across time. There was an abnormal increase of cases in Wuhan City and Hubei Province on February 1, 2020, based on the date of illness onset.2 We interpolated the number on February 1 by using the mean of numbers of cases reported on January 31 and February 2 in the epicurve. The number of cases reported by city across mainland China as of February 29 were used to define the predictability of our model across space. These case data were collated from the websites of national and local health authorities, news media, and publications (Supplementary Information File 3)2,3,32.
Data analysis
We constructed a travel network-based SEIR modelling framework (BEARmod) for before-and-after comparable analyses on NPI efficacy. This model was extended from a typical SEIR model to specifically incorporate movement between locations that varied with each timestep. In this model, each city was represented in the model as a separate subpopulation, with its own susceptible (S), exposed (E) infected (I), and recovered/removed (R) populations.
Exposure, infection, and recovery
During each timestep, infected people first recovered or were removed at an average rate r, where r was equal to the inverse of the average infectious period, and removal represents self-isolation and effective removal from the population as a potential transmitter of disease. Explicitly, this was incorporated as a Bernoulli trial for each infected person with a probability of recovering 1 − exp(−r). We used the median of time lags from illness onset to reported case as a proxy of the average infectious period, indicating the improving case identification and isolation under improved interventions (Supplementary Information File 1). Then, the model converted exposed people to infectious by similarly incorporating a Bernoulli trial for each exposed individual, where the daily probability of becoming infectious 1 − r exp(−ε), where ε was the inverse of the average time spent exposed but not infectious, based on the estimated incubation period (5.2 days, 95% confidence interval [CI] 4.1 - 7.0).5 Finally, to end the exposure, infection, and recovery step of the model, newly exposed people were calculated for each city based on the number of infectious people in the city I i, and the average number of daily contacts that lead to transmission that each infectious person has c. We simulated the number of exposed in a patch on a given day through a random draw from a Poisson distribution for each infectious person where the mean number of new infections per person was c, which was then multiplied by the fraction of people in the city that were susceptible. We calculated the daily contact rate c using the basic reproduction rate calculated by other studies (R 0, 2.2, 95%CI 1.4 - 3.9) divided by the average days (5.8, 95%CI 4.3 - 7.5) from onset to first medical visit and isolation,5 weighted by the relative level of daily contact where relevant, based on the Baidu movement data (Supplementary Information File 2). Because simulation runs were not extended beyond five months, we did not include the addition of new susceptibles, or conversion of recovered people back to susceptible.
The infection processes within each patch therefore approximate the following deterministic, continuous-time model, where c and r through time:
Movement
After the model completed the infection-related processes, we moved infectious people between cities. To do this, we moved infected people from their current location to each possible destination (including remaining in the same place) using Bernoulli trials for each infected person, and each possible destination city. We parameterized the probability of moving from city i to city j (pij) was equal to the proportion of smartphone users who went from city j in the corresponding day from the Baidu dataset in 2015, accounting for the travel restrictions in 2020. This included modelling the numbers of people who stayed in the same location using pii, the proportion of users who did not move to a new location on that day. This allowed us to incorporate variance in the actual composition of travellers (infected vs non-infected), but because movement numbers were generated independently, it was possible for the number of infected stayers and movers in each patch to exceed or be fewer than the number of infected people in the patch. As we only wanted to incorporate variance into relative patterns of movement and not absolute numbers (particularly because the underlying values are proportions of people who moved and therefore cannot influence the total numbers of people infected), in any case where infected movers and stayers differed from the total number of infected people in the origin patch, we rescaled values to the total number of infected people. Rescaling in this way meant the variance introduced by the Bernoulli trials could only influence relative movement patterns, and not actual numbers of infected people. Further, because we explicitly model the number of stayers in the same way as movers, rescaling should not introduce any bias in terms of the final relative movement patterns.
Through this model, stochasticity in the numbers and places where COVID-19 appears between simulation runs in this model through variance in numbers of people becoming exposed, infectious, and removed/recovered, as well as variance in numbers of people moving from one city to another. By modelling the COVID-19 epidemic in this way, we could simulate the incidence of COVID-19 cases, accounting for variance in recovery, infection, and movement across many simulation runs (1000). Additionally, this allowed for us to account for uncertainty in contact rates after NPIs were implemented of lifted.
Simulation runs
Using this model, we quantified how transmission of COVID-19 varied with different intervention scenarios and timings, as well as the potential of further transmission after the lifting of travel restrictions and contact distancing measures on February 17, 2020. As the earliest date of illness onset in cases was December 2, 20203, considering the underreporting of cases and the delay from infection to onset and identification of this novel virus, we did simulations by initially infected 5 people in Wuhan on December 1, 2019 and propagating the epidemic through time, varying factors including timing and types of interventions used, assumed contact and recovery rates, and movement. We initially infected 5 people as a minimum number of infected people that prevented stochastic extinction of the epidemic during the initial days of simulation, and found no significant difference after 3 months, over simulation runs that started with 3, 5, and 8 initially infected people (though with 3 people initially infected, 50% of runs led to zero cases over the initial week of simulation). When using data from other years we fixed the simulation dates around Chinese New Year and adjusted the start date of the epidemic accordingly.
The estimates of the model for the outbreak under current NPIs as the baseline scenario were compared with reported COVID-19 cases across time and space. The sensitivity and specificity were also calculated to examine the performance of the model in predicting the occurrence of COVID-19 cases at city level across China. The relative effect of NPIs were quantitatively assessed by comparing estimates of cases under various NPIs and timings with that of the baseline scenario. We also conducted a series of sensitivity analyses to understand the impact of changing epidemiological parameters on the estimates and uncertainties of intervention efficacy. R version 3.6.1 (R Foundation for Statistical Computing, Vienna, Austria) was used to perform data collation and analyses.
Extended Data
Extended Data Fig. 1. Estimated and reported epicurves of COVID-19 outbreak in mainland China.
(a) Wuhan City in Hubei Province. (b) Other cities in Hubei Province. (c) Other 30 provincial regions in mainland China. The orange vertical lines indicate Wuhan’s lockdown on January 23, 2020. The estimated epicurve of COVID-19 cases presents the median (dark blue) and interquatile range (light blue) of estimates (1000 simulations), and the Pearson's correlation between the median of daily estimates and the number of daily reported cases by region as of February 13, 2020 are also presented. (d) The Pearson’s correlation between the total number of estimated cases and the total number of reported cases by province as of February 29, 2020. The p values of two-sided t-test are also provided.
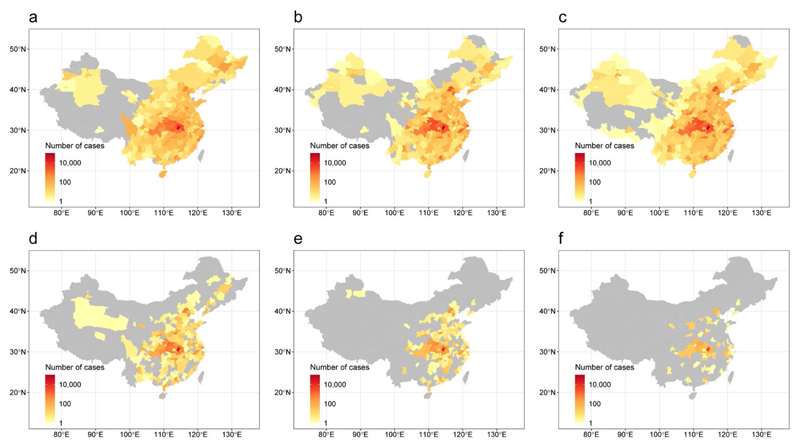
Extended Data Fig. 2. Affected areas of COVID-19 in mainland China under various intervention timings.
(a) A total of 308 cities reported COVID-19 cases, based on the data obtained from national and local health authorities, as of February 29, 2020. (b) Affected areas (298 cities) estimated by models under interventions implemented at actual timing. (c) Estimated affected areas (326 cities) under interventions at actual timing, but without inter-city travel restrictions. (d) Estimated affected areas (192 cities) under interventions at one week earlier than actual timing. (e) Estimated affected areas (130 cities) under interventions implemented at two weeks earlier than actual timing. (f) Estimated affected areas (61 cities) under interventions at three weeks earlier than actual timing. The administrative boundary maps were obtained from the National Platform of Common Geospatial Information Services of China (www.tianditu.gov.cn).
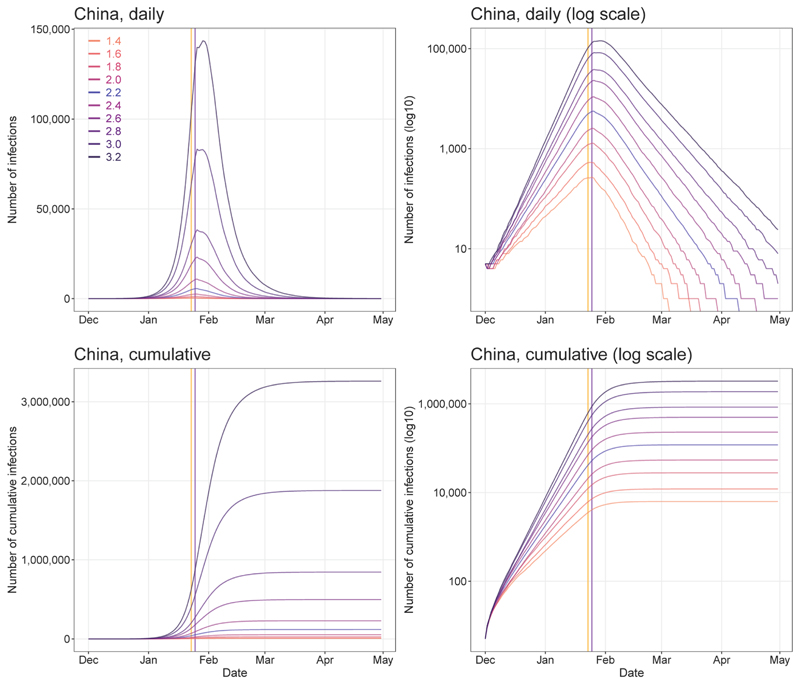
Extended Data Fig. 3. Sensitivity of estimates of COVID-19 epidemics under various values of R0.
All other parameters, NPIs and input data were the same as the baseline model with R0 = 2.2. Vertical lines: orange – date of Wuhan’s lockdown; purple - CNY’s day.
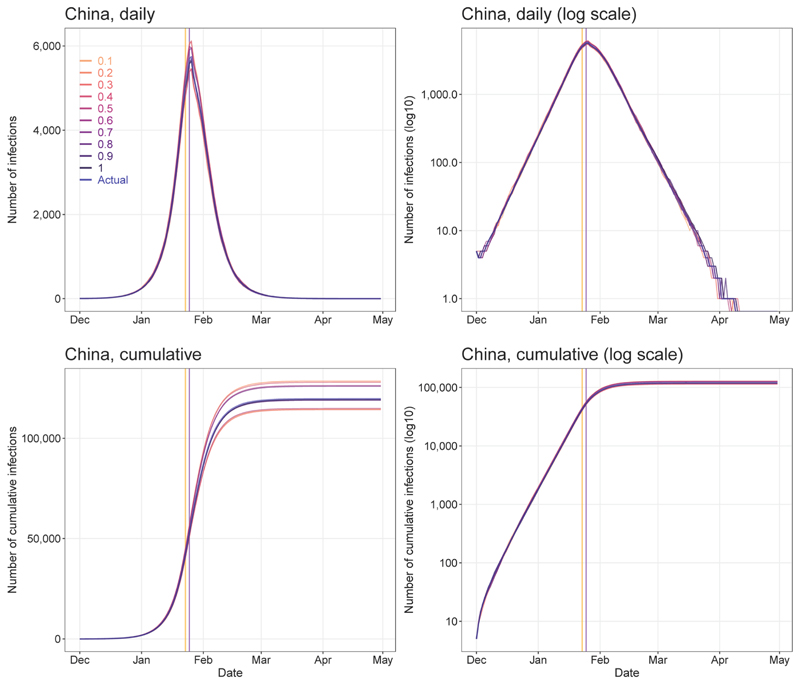
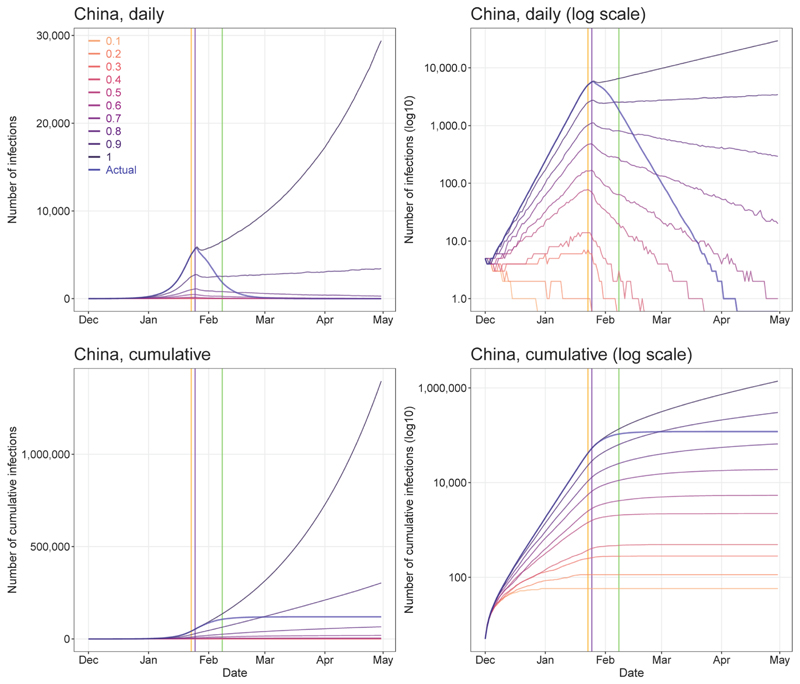
Extended Data Fig. 4. Sensitivity of estimates of COVID-19 epidemics under various levels of inter-city travel restrictions since January 23, 2020.
All other parameters, NPIs and input data were the same as the baseline model with R0 = 2.2. The actual percentages of inter-city travel restrictions changed day-by-day across cities in China (0.1 means 90% reduction from normal travel, 1 means no travel restrictions). Vertical lines: orange – date of Wuhan’s lockdown; purple - CNY’s day.
Extended Data Fig. 5. Sensitivity of estimates of COVID-19 epidemics under various numbers of days from illness onset to report/isolation.
All other parameters, NPIs and input data were the same as the baseline model with R0 = 2.2. The actual delays of illness onset to report/isolation changed day-by-day (appendix Table S2). Vertical lines: orange – date of Wuhan’s lockdown; purple -CNY’s day.
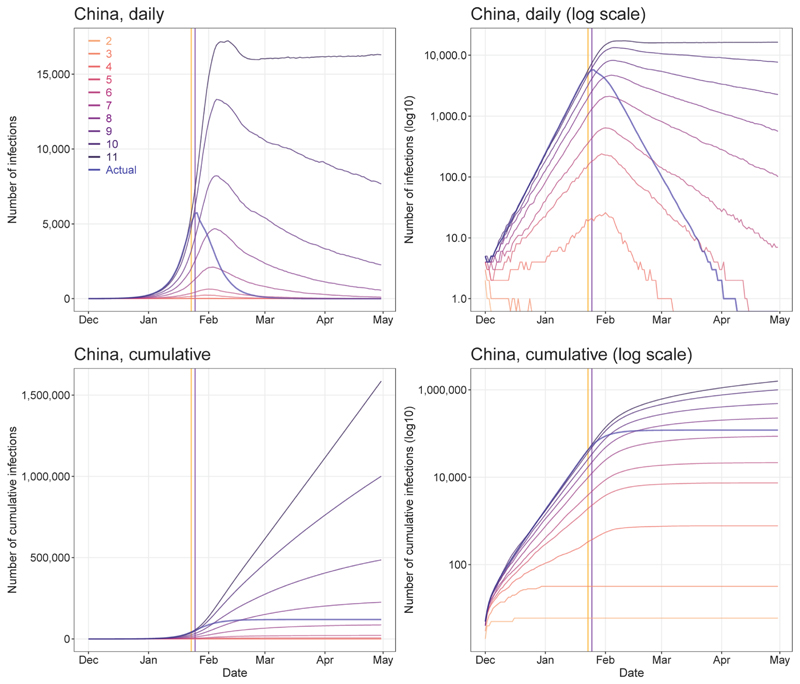
Extended Data Fig. 6. Sensitivity of estimates of COVID-19 epidemics under various contact rate values.
All other parameters, NPIs and input data were the same as the baseline model with R0 = 2.2. The actual percentage of population contact (0.1 means 10% contact as usual, 1 means no contact restrictions) changed day-by-day across the country (appendix Table S1). Vertical lines: orange – date of Wuhan’s lockdown; purple - CNY’s day.
Extended Data Fig. 7. Sensitivity of estimates of COVID-19 epidemics under various values of R0 and without inter-city travel restrictions.
All other parameters, NPIs and input data were the same as the baseline model with R0 = 2.2. Vertical lines: orange – date of Wuhan’s lockdown; purple - CNY’s day.
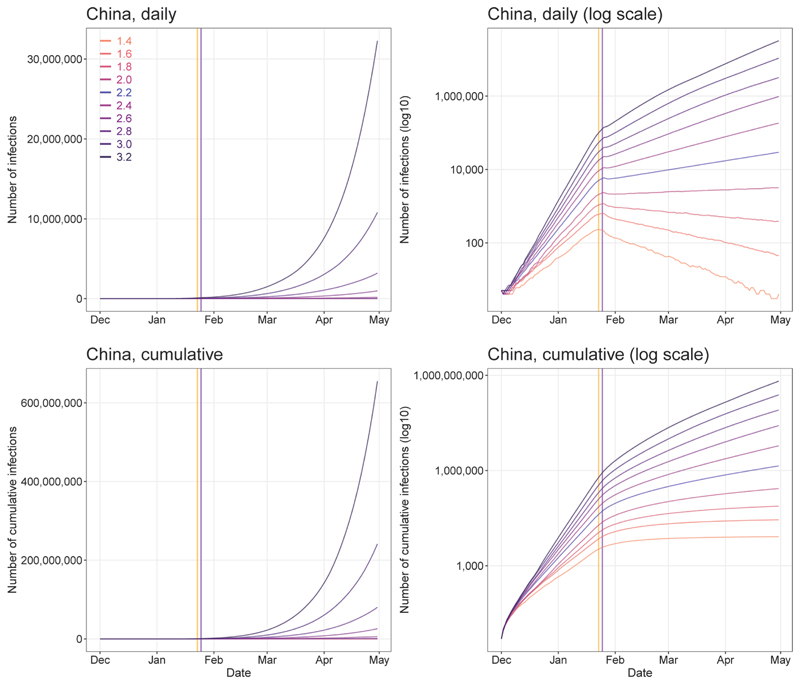
Extended Data Fig. 8. Sensitivity of estimates of COVID-19 epidemics under various values of R0 but without the intervention of inner-city contact restrictions.
All other parameters, NPIs and input data were the same as the baseline model with R0 = 2.2. Vertical lines: orange – date of Wuhan’s lockdown; purple - CNY’s day.
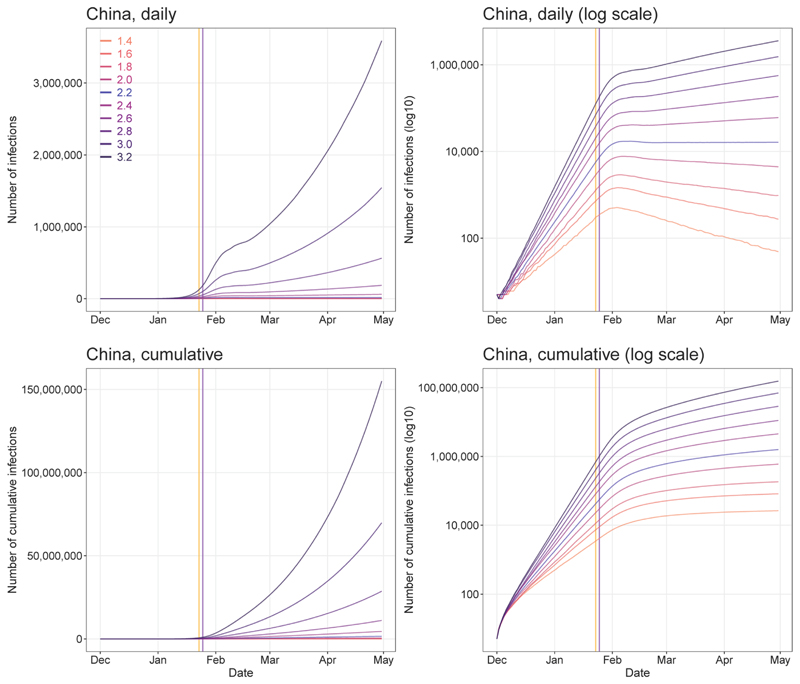
Extended Data Fig. 9. Sensitivity of estimates of COVID-19 epidemics under various values of R0 but without improved timeliness of case detection and isolation.
The delay from illness onset to detection and isolation was set as a constant of 11 days as that on January 16-18, 2020. All other parameters, NPIs and input data were the same as the baseline model with R0 = 2.2. Vertical lines: orange – date of Wuhan’s lockdown; purple - CNY’s day
Extended Data Table 1. Reports and estimates of the COVID-19 cases in mainland China, as of February 29, 2020.
| Interventions and timing | Wuhan City, Hubei Province | Other cities in Hubei Province | Other provinces | Mainland China |
|---|---|---|---|---|
| Under current non-pharmaceutical interventions (NPIs) | ||||
| No. of cases reported (%)a | 49,122 (62) | 17,785(22) | 12,917 (16) | 79,824 (100) |
| Estimates of cases (%) | 78,910(69) | 18,503(16) | 16,912 (15) | 114,325(100) |
| Interquartile range | 51,952-111,280 | 11,029-28,685 | 9,499-27,033 | 76,776-164,576 |
| Dates of estimated peak | Jan 25-27 | Jan 24-26 | Jan 24-26 | Jan 25-27 |
| Interval between NPIs and epidemic peakb | 7 days | 6 days | 6 days | 7 days |
| Percentage (%) of cases that could have been prevented with earlier interventions | ||||
| One week ahead | 61 (45-79) | 71 (55-86) | 78 (62-90) | 66 (50-82) |
| Two weeks ahead | 84 (78-89) | 90 (82-94) | 91 (84-95) | 86 (81-90) |
| Three weeks ahead | 94 (92-96) | 97 (95-99) | 98 (97-99) | 95 (93-97) |
| Estimated relative no. of cases with later interventions c | ||||
| One week delay | 2.4 (1.6-3.5) | 3.1 (1.8-4.6) | 3.3 (2-5.4) | 2.6 (1.8-3.8) |
| Two weeks delay | 5.8 (4.0-8.6) | 8.6 (5.3-12.8) | 9.4 (6.1-14.6) | 6.7 (4.6-10.0) |
| Three weeks delay | 15.1 (9-21.1) | 22.6 (13.5-33.9) | 27.9 (17.5-42.8) | 17.6(11.2-25.5) |
| Estimated relative no. of cases under various NPIs c | ||||
| Without inter-city travel restriction | 1.0 (0.6-1.3) | 1.1 (0.7-1.7) | 1.1 (0.7-1.7) | 1.0(0.6-1.4) |
| Without inner-city contact reduction | 2.5 (1.7-3.7) | 2.6(1.5-4.2) | 2.4(1.2-4.0) | 2.6(1.7-3.7) |
| Without case early detection and isolation | 5.0 (3.3-6.9) | 5.6 (3.2-8.4) | 5.1 (2.5-8.4) | 5.0 (3.3-7.1) |
| Without all interventions above | 51.4 (33.2-71.2) | 91.6 (57.6-132.5) | 124.7 (77.4-180) | 67.3 (43.7-93.7) |
The reported data on COVID-19 cases were obtained from the Chinese National Health Commission as of February 29, 2020.
The timeliness of case identification and reporting has been improved since January 19, 2020 and the travel restriction and social distancing were implemented from 23 January. We compared the peak dates by region with January 19 to define the interval from NPIs to epidemic peak.
Referring to the median of estimates under current interventions and timing. The median and interquartile range of estimates are provided here
Supplementary Material
Acknowledgments
We thank staff members at disease control institutions, hosptials, and health administractions across China where outbreaks occurred for field investigation, administration, and data collection. We thank Baidu Inc. sharing population movement data. We also thank Yanyan Zhu and Shuhao Lai for collating online data. This study was supported by the grants from the Bill & Melinda Gates Foundation (OPP1134076, OPP1195154); the European Union Horizon 2020 (MOOD 874850); the National Natural Science Fund of China (81773498); National Science and Technology Major Project of China (2016ZX10004222-009). AJT is supported by funding from the Bill & Melinda Gates Foundation (OPP1106427, OPP1032350, OPP1134076, OPP1094793), the Clinton Health Access Initiative, the UK Department for International Development (DFID) and the Wellcome Trust (106866/Z/15/Z, 204613/Z/16/Z). HY is supported by funding from the National Natural Science Fund for Distinguished Young Scholars of China (No. 81525023); Program of Shanghai Academic/Technology Research Leader (No. 18XD1400300); and the United States National Institutes of Health (Comprehensive International Program for Research on AIDS grant U19 AI51915). OP is supported by funding from the National Science Foundation, USA (No. 1816075).
Role of the funding source
The funder of the study had no role in study design, data collection, data analysis, data interpretation, or writing of the report. The corresponding authors had full access to all the data in the study and had final responsibility for the decision to submit for publication.
Footnotes
Author contributions
S.L. designed the study, built the model, collected data, finalised the analysis, interpreted the findings, and wrote the manuscript. N.W.R. built the model, analysed data, interpreted the findings, and wrote the manuscript. L.Z., D.W., and J.X. collected data, interpreted the findings, commented on and revised drafts of the manuscript. J.R.F., O.P., and W.L. built the model, commented on and revised drafts of the manuscript. C.Z. collected data, interpreted the findings and commented on and revised drafts of the manuscript. A.J.T. interpreted the findings and revised drafts of the manuscript. A.W., M.S., X.D., and H.Y. interpreted the findings and commented on and revised drafts of the manuscript. All authors read and approved the final manuscript.
Ethical approval
Ethical clearance for collecting and using secondary data in this study was granted by the institutional review board of the University of Southampton (No. 48002). All data were supplied and analysed in an anonymous format, without access to personal identifying information.
Competing interests
The authors declare no competing interests.
Data and code availability
The code for the model built in this study has been made openly available for further use at https://github.com/wpgp/BEARmod. The data on COVID-19 cases reported by county, city, and province across China are available from the data sources listed in the Supplementary Information File 3, and the average days from illness onset to report of the first case by each county used in the modelling are detailed in Supplementary Information File 1. The mobile phone datasets analysed during the current study are not publicly available since this would compromise the agreement with the data provider, but the information on the process of requesting access to the data that support the findings of this study are available from Dr Shengjie Lai (Shengjie.Lai@soton.ac.uk), and the data on travel and contact reductions derived from the datasets and used in our model are detailed in Supplementary Information File 2.
References
- 1.World Health Organization. WHO Director-General's opening remarks at the media briefing on COVID-19 - 11 March 2020. 2020 https://www.who.int/dg/speeches/detail/who-director-general-s-opening-remarks-at-the-media-briefing-on-covid-19---11-march-2020.
- 2.Novel Coronavirus Pneumonia Emergency Response Epidemiology Team. The epidemiological characteristics of an outbreak of 2019 novel coronavirus diseases (COVID-19) in China. Chinese Journal of Epidemiology. 2020;41:145–151. [Google Scholar]
- 3.World Health Organization. Report of the WHO-China Joint Mission on Coronavirus Disease 2019 (COVID-19) 2020 https://www.who.int/docs/default-source/coronaviruse/who-china-joint-mission-on-covid-19-final-report.pdf.
- 4.Baidu Migration. 2020 https://qianxi.baidu.com/
- 5.Li Q, et al. Early Transmission Dynamics in Wuhan, China, of Novel Coronavirus-Infected Pneumonia. N Engl J Med. 2020;382:1199–1207. doi: 10.1056/NEJMoa2001316. [DOI] [PMC free article] [PubMed] [Google Scholar]
- 6.World Health Organization. Novel coronavirus (2019-nCoV) 2020 https://www.who.int/emergencies/diseases/novel-coronavirus-2019.
- 7.Heymann DL, Shindo N. COVID-19: what is next for public health? The Lancet. 2020;395:542–545. doi: 10.1016/S0140-6736(20)30374-3. [DOI] [PMC free article] [PubMed] [Google Scholar]
- 8.Fong MW, et al. Nonpharmaceutical Measures for Pandemic Influenza in Nonhealthcare Settings-Social Distancing Measures. Emerg Infect Dis. 2020;26:976–984. doi: 10.3201/eid2605.190995. [DOI] [PMC free article] [PubMed] [Google Scholar]
- 9.Ryu S, et al. Nonpharmaceutical Measures for Pandemic Influenza in Nonhealthcare Settings-International Travel-Related Measures. Emerg Infect Dis. 2020;26:961–966. doi: 10.3201/eid2605.190993. [DOI] [PMC free article] [PubMed] [Google Scholar]
- 10.Xiao J, et al. Nonpharmaceutical Measures for Pandemic Influenza in Nonhealthcare Settings-Personal Protective and Environmental Measures. Emerg Infect Dis. 2020;26:967–975. doi: 10.3201/eid2605.190994. [DOI] [PMC free article] [PubMed] [Google Scholar]
- 11.Chen W, et al. Early containment strategies and core measures for prevention and control of novel coronavirus pneumonia in China. Chinese Journal of Preventive Medicine. 2020;54:1–6. doi: 10.3760/cma.j.issn.0253-9624.2020.03.003. [DOI] [PubMed] [Google Scholar]
- 12.World Health Organization. Press Conference of WHO-China Joint Mission on COVID-19. 2020 https://www.who.int/docs/default-source/coronaviruse/transcripts/joint-mission-press-conference-script-englishfinal.pdf?sfvrsn=51c90b9e_2.
- 13.The State Council of the People's Republic of China. The announcement from Wuhan's headquarter on the novel coronavirus prevention and control. 2020 http://www.gov.cn/xinwen/2020-01/23/content_5471751.htm.
- 14.The State Council of the People's Republic of China. The announcement on Strengthening Community Prevention and Control of Pneumonia Epidemic Situation of New Coronavirus Infection. 2020 http://www.gov.cn/zhengce/2020-01/27/content_5472516.htm.
- 15.The State Council of the People's Republic of China. The State Council's announcement on extending the Lunar New Year Holiday in 2020. 2020 http://www.gov.cn/zhengce/content/2020-01/27/content_5472352.htm.
- 16.The People's Government of Shanghai Municipality. The announcement on postponing the reoperation date of companies and the reopening date of schools. 2020 http://www.shanghai.gov.cn/nw2/nw2314/nw2315/nw43978/u21aw1423601.html.
- 17.Li X, Zhao X, Sun Y. The lockdown of Hubei Province causing different transmission dynamics of the novel coronavirus (2019-nCoV) in Wuhan and Beijing. medRxiv. 2020 2020.2002.2009.20021477. [Google Scholar]
- 18.Kraemer MUG, et al. The effect of human mobility and control measures on the COVID-19 epidemic in China. Science. 2020 doi: 10.1126/science.abb4218. eabb4218. [DOI] [PMC free article] [PubMed] [Google Scholar]
- 19.Chinazzi M, et al. The effect of travel restrictions on the spread of the 2019 novel coronavirus (COVID-19) outbreak. Science. 2020 doi: 10.1126/science.aba9757. aba9757. [DOI] [PMC free article] [PubMed] [Google Scholar]
- 20.Quilty BJ, Clifford S, Flasche S, Eggo RM, group, C. n. w Effectiveness of airport screening at detecting travellers infected with novel coronavirus (2019-nCoV) Euro Surveill. 2020;25 doi: 10.2807/1560-7917.ES.2020.25.5.2000080. 2000080. [DOI] [PMC free article] [PubMed] [Google Scholar]
- 21.Hellewell J, et al. Feasibility of controlling COVID-19 outbreaks by isolation of cases and contacts. The Lancet Global Health. doi: 10.1016/S2214-109X(20)30074-7. [DOI] [PMC free article] [PubMed] [Google Scholar]
- 22.Lai S, et al. Assessing spread risk of COVID-19 within and beyond China, January-April 2020: a travel network-based modelling study. medRxiv. 2020 2020.2002.2004.20020479. [Google Scholar]
- 23.Wu JT, Leung K, Leung GM. Nowcasting and forecasting the potential domestic and international spread of the 2019-nCoV outbreak originating in Wuhan, China: a modelling study. Lancet. 2020;395:689–697. doi: 10.1016/S0140-6736(20)30260-9. [DOI] [PMC free article] [PubMed] [Google Scholar]
- 24.National Health Commission of the People's Repulic of China. Updates on pneumonia of new coronavirus infections as of March 31 2020. 2020 http://www.nhc.gov.cn/xcs/yqtb/202004/28668f987f3a4e58b1a2a75db60d8cf2.shtml.
- 25.Wang M, et al. Temperature significant change COVID-19 Transmission in 429 cities. medRxiv. 2020 2020.2002.2022.20025791. [Google Scholar]
- 26.Luo W, et al. The role of absolute humidity on transmission rates of the COVID-19 outbreak. medRxiv. 2020 2020.2002.2012.20022467. [Google Scholar]
- 27.Lai S, Farnham A, Ruktanonchai NW, Tatem AJ. Measuring mobility, disease connectivity and individual risk: a review of using mobile phone data and mHealth for travel medicine. J Travel Med. 2019;26 doi: 10.1093/jtm/taz019. taz019. [DOI] [PMC free article] [PubMed] [Google Scholar]
- 28.List of countries by smartphone penetration. 2020 https://en.wikipedia.org/wiki/List_of_countries_by_smartphone_penetration.
- 29.Wang X, Liu C, Mao W, Hu Z, Gu L. Tracing the largest seasonal migration on earth. arXiv. 2014 1411.0983. [Google Scholar]
- 30.National Bureau of Statistics of China. China Statistical Yearbook 2014. 2020 http://www.stats.gov.cn/english/Statisticaldata/AnnualData/
- 31.Kraemer MUG, et al. Past and future spread of the arbovirus vectors Aedes aegypti and Aedes albopictus. Nat Microbiol. 2019;4:854–863. doi: 10.1038/s41564-019-0376-y. [DOI] [PMC free article] [PubMed] [Google Scholar]
- 32.Zhang J, et al. Evolving epidemiology of novel coronavirus diseases 2019 and possible interruption of local transmission outside Hubei Province in China: a descriptive and modeling study. medRxiv. 2020 2020.2002.2021.20026328. [Google Scholar]
Associated Data
This section collects any data citations, data availability statements, or supplementary materials included in this article.
Supplementary Materials
Data Availability Statement
The code for the model built in this study has been made openly available for further use at https://github.com/wpgp/BEARmod. The data on COVID-19 cases reported by county, city, and province across China are available from the data sources listed in the Supplementary Information File 3, and the average days from illness onset to report of the first case by each county used in the modelling are detailed in Supplementary Information File 1. The mobile phone datasets analysed during the current study are not publicly available since this would compromise the agreement with the data provider, but the information on the process of requesting access to the data that support the findings of this study are available from Dr Shengjie Lai (Shengjie.Lai@soton.ac.uk), and the data on travel and contact reductions derived from the datasets and used in our model are detailed in Supplementary Information File 2.


