

Abstract
The anorexigenic peptide glucagon-like peptide-1 (GLP-1) is secreted from gut enteroendocrine cells and brain preproglucagon (PPG) neurons, which respectively define the peripheral and central GLP-1 systems. PPG neurons in the nucleus tractus solitarii (NTS) are widely assumed to link the peripheral and central GLP-1 systems in a unified gut-brain satiation circuit. However, direct evidence for this hypothesis is lacking, and the necessary circuitry remains to be demonstrated. Here we show that PPGNTS neurons encode satiation in mice, consistent with vagal signalling of gastrointestinal distension. However, PPGNTS neurons predominantly receive vagal input from oxytocin receptor-expressing vagal neurons, rather than those expressing GLP-1 receptors. PPGNTS neurons are not necessary for eating suppression by GLP-1 receptor agonists, and concurrent PPGNTS neuron activation suppresses eating more potently than semaglutide alone. We conclude that central and peripheral GLP-1 systems suppress eating via independent gut-brain circuits, providing a rationale for pharmacological activation of PPGNTS neurons in combination with GLP-1 receptor agonists as an obesity treatment strategy.
Keywords: Glucagon-like peptide-1, preproglucagon, oxytocin, nucleus tractus solitarius, vagal afferent neurons, eating, feeding, satiation, behavioural satiety sequence, semaglutide
Glucagon-like peptide 1 (GLP-1) acts as an incretin hormone and anorexigenic neuropeptide, prompting the successful and ongoing development of GLP-1-based therapies for type 2 diabetes and obesity1,2. Endogenous GLP-1 is produced both by enteroendocrine cells in the gut, and preproglucagon (PPG) neurons in the brain, which are the defining populations of the peripheral and central GLP-1 systems, respectively3,4. PPG neurons in the nucleus tractus solitarius (PPGNTS neurons) suppress eating when chemogenetically or optogenetically activated5–7, consistent with substantial pharmacological evidence for anorexigenic GLP-1 signalling in the brain (reviewed by Muller et al4). Physiologically, PPGNTS neurons are the major source of GLP-1 in the brain, are necessary for stress-induced hypophagia, and their inhibition or ablation elicits transient hyperphagia during large intakes7. Although glutamate is a co-transmitter in these neurons8,9, selective Ppg knockdown has confirmed the necessity of proglucagon-derived peptides for their anorexigenic role10. PPGNTS neurons are thus the crucial component of the central GLP-1 system, which they comprise along with numerous populations of GLP-1 receptor (GLP-1R)-expressing neurons found throughout the brain11,12. PPGNTS neurons do not express GLP-1R mRNA, or directly respond to exogenous GLP-1 in ex vivo slice preparations13,14, therefore direct activation of the central GLP-1 system by peripheral GLP-1 is implausible. However, it is widely assumed that endogenous peripheral GLP-1 indirectly interacts with the central GLP-1 system (via vagal and/or endocrine routes) to control eating under physiological conditions, although this link is controversial and the necessary gut-brain circuitry has not been demonstrated empirically4,15–17. Indeed, experiments which could provide indirect evidence for this hypothesis suggest that functional connectivity between the two systems may in fact be very limited18,19 The difficulty in testing this link partly arises from the inherent complexity of interrogating these widely-distributed systems using pharmacological approaches, compounded by observations that native GLP-1 and pharmacokinetically-optimised therapeutic GLP-1 receptor agonists (GLP-1RAs) suppress eating via apparently divergent signalling pathways19–25.
Numerous studies have demonstrated the value of selective transgenic manipulations to determine the neuroanatomical organization and physiological functions of specific cell populations involved in eating control, including those comprising parts of the peripheral and central GLP-1 systems7,26–29. Here we utilized similar transgenic and viral approaches to address whether PPGNTS neurons have a role in physiological satiation, and determined their anatomical and functional connectivity to molecularly defined neuronal populations mediating gut-brain satiation signalling. Specifically, we tested the prevalent but unsubstantiated hypothesis that peripheral GLP-1 signals to the brain to suppress eating via vagal and/or endocrine activation of central GLP-1-producing preproglucagon (PPG) neurons, i.e. that peripheral and central GLP-1 systems comprise a unified, directly connected gut-brain satiation circuit. We furthermore tested the role of PPGNTS neurons in eating suppression induced by the anti-obesity GLP-1RAs liraglutide and semaglutide, to establish whether this neuronal population has translational importance as a distinct therapeutic target for obesity treatment.
Results:
PPGNTS neurons selectively encode large meal satiation
PPGNTS neurons are not necessary for control of daily or long term food intake or bodyweight in ad libitum eating mice7. However, it is unknown whether they regulate within- or between-meal parameters, or whether the absence of an ablation-induced bodyweight phenotype masks more subtle alterations in energy expenditure or physical activity. We addressed these questions by metabolic phenotyping of ad libitum eating mice following viral ablation of PPGNTS neurons, using AAV-mediated selective expression of diptheria toxin subunit A (DTA; Extended Data 1a). Food intake over the circadian cycle was unaffected by neuronal ablation in either sex (Extended Data 1b–c, k–l), and there was no effect on meal size, frequency or duration (Extended Data 1e–g). Similarly, ablation did not affect locomotion, energy expenditure, bodyweight or water intake (Extended Data 1d,h–j,m). As a positive control in this model we did, however, successfully replicate a previous report7 that ablation induces hyperphagia both during post-fast refeeding, and after a short liquid diet preload (Extended Data 1n–o).
The replicable observation that ablation of PPGNTS neurons elicits transient hyperphagia only under conditions manipulated to induce large intakes7 is consistent with results in rats indicating that these neurons are activated during ingestion of unusually large meals30. We thus tested the hypothesis that hyperphagic responses observed after PPGNTS neuronal ablation are specifically due to a delay in meal termination, to establish a bona fide role for PPGNTS neurons in the process of satiation. We conducted high resolution meal pattern analysis using home cage FED pellet dispensers (Feeding Experimentation Device28), and observational analysis of liquid diet intake, to test the effects of chemogenetic inhibition of PPGNTS neurons on termination of large solid and liquid meals, using the inhibitory hM4Di Designer Receptor Exclusively Activated by Designer Drugs (DREADD; Fig. 1a,g). PPGNTS neuron inhibition increased fasting-induced pellet refeeding during hour 1 in a sex-independent manner, and this effect was driven by increased meal size, rather than frequency (Fig. 1b–f). The hyperphagic effect in this model was also confirmed to be specific to large meals, as inhibition had no effect under ad libitum eating conditions (Extended Data 1p–r). We then modified a previously used Ensure liquid diet preload paradigm7 to test whether PPGNTS neurons are necessary for satiation during consumption of large liquid meals (Fig. 1g), as suggested by a previous cFos expression study in rats32. Under these conditions, Ensure intake was increased by PPGNTS neuron inhibition, and, consistent with effects on pellet intake in the FED system, this increase was driven by increased duration of Ensure eating (Fig. 1h–k). While the modest but non-significant increases in eating frequency mean we cannot rule out an additional role in satiety, our data unequivocally demonstrate that both under conditions of normal and negative energy balance, PPGNTS neurons are recruited to encode physiological satiation, specifically by ingestion of large meals.
Figure 1. PPGNTS neurons selectively encode large meal satiation.
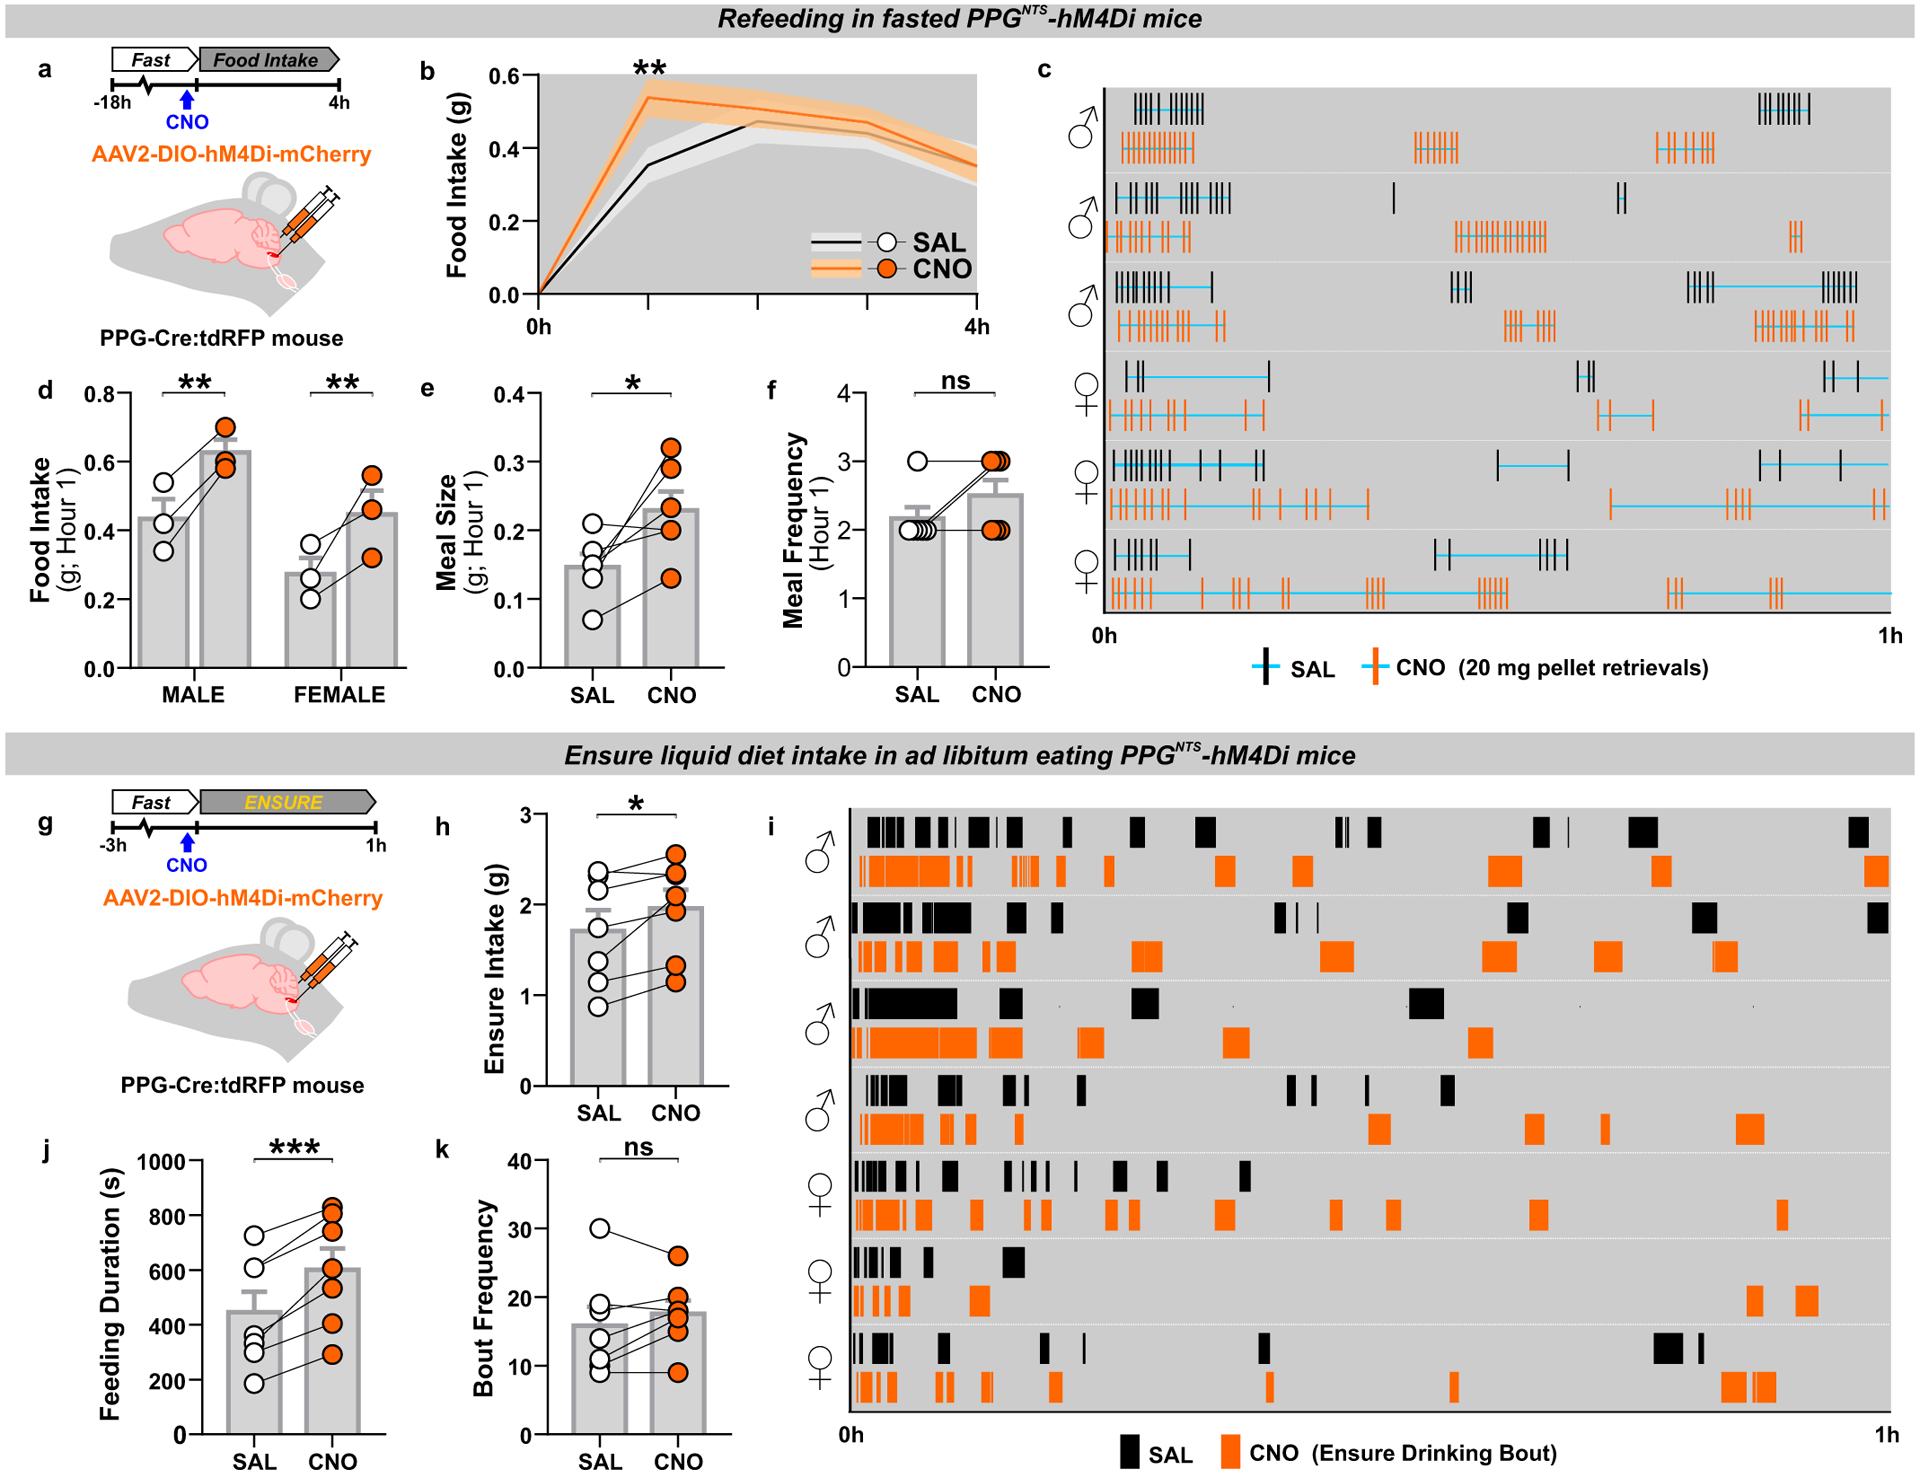
(a) Experimental model and paradigm for meal pattern analysis of post-fast refeeding in PPGNTS-hM4Di mice using FED system. n=6 animals for analyses presented in b-f.
(b) 4h dark phase food intake, 2-way within-subjects ANOVA: Drug × Time F(3,15)=3.664, p=0.0367.
(c) Raster plot of chow pellet retrievals over 1h dark phase. Plots from the same mouse after saline and CNO injections presented adjacently.
(d) 1h intake by sex, 2-way mixed-model ANOVA: Drug F(1,4)=29.09, p=0.0057.
(e-f) Meal pattern parameters during 1h refeed, paired 2-tailed t-test or Wilcoxon matched-pairs test: E) t(5)=2.757, p=0.040; F) W=−3, p=0.500.
(g) Experimental model and paradigm for temporal analysis of Ensure intake in PPGNTS-hM4Di mice. n=7 animals for analyses presented in h-k.
(h) 1h Ensure intake, paired 2-tailed t-test: t(6)=2.859, p=0.0288. Ensure intake was sex-independent, 2-way mixed-model ANOVA: Sex × Drug F(1,5)=2.553, p=0.171.
(i) Raster plot of Ensure drinking bouts over 1h dark phase. Plots from the same mouse after saline and CNO injections presented adjacently.
(j-k) Temporal parameters of Ensure drinking, paired 2-tailed t-test: J) t(6)=6.55, p=0.0006; K) t(6)=1.263, p=0.254; M) t(6)=4.784, p=0.0031.
All data presented as mean ± SEM.
PPGNTS neurons suppress eating without behavioural disruption
The observation that PPGNTS neurons selectively encode satiation during large meals, but apparently do not control intake under ad libitum eating conditions, suggests they have capacity to suppress eating when stimulated. Evidence for such capacity has been reported previously5–7, and could indicate translational potential for PPGNTS neurons as a target for therapeutic suppression of eating, provided that the eating suppression is robust, is not compensated for, and is not associated with nausea/malaise. We therefore extended these studies by testing whether hypophagia induced by chemogenetic activation of PPGNTS neurons was followed by compensatory rebound hyperphagia, or elicited significant disruption to the behavioural satiety sequence, using the excitatory hM3Dq DREADD (Fig. 2a,e). In ad libitum eating mice, PPGNTS activation reduced intake by ~40% in the first 24 hours (Fig. 2b) in a sex-independent manner (Extended Data 2b), predominantly driven by reductions in the first 5 hours of the dark phase (Extended Data 2a). No compensatory hyperphagia occurred, hence cumulative intake and bodyweight were still reduced 48 hours after acute CNO administration (Fig. 2c–d). This robust suppression of eating with sustained reduction in intake was also observed when PPGNTS neurons were activated immediately prior to dark onset refeeding after a prolonged (18hr) fast (Fig. 2e, Extended Data 2f). We thus combined the FED system with infrared video in this paradigm to investigate changes to the behavioural satiety sequence under relatively naturalistic home cage conditions. Following a period of eating (Extended Data 2g), PPGNTS neuron activation advanced the point of satiation by ~15 minutes (shift from time bin 4 to 1; Fig. 2f–g), and the stochastic sequence of satiety behaviours (eating → grooming → inactive) was not disrupted. Quantitative analyses revealed that PPGNTS neuron activation did not significantly alter eating rate (Extended Data 2h), but reduced eating duration during the first 15 minutes (Fig. 2h), as expected from the left-shifted satiation point. Time inactive was modestly increased, and grooming and active behaviours appeared to be correspondingly decreased, however the temporal patterns of these behaviours were maintained (Fig. 2i–k).
Figure 2. PPGNTS neurons suppress eating without behavioural disruption.

(a) Experimental model and paradigm for ad libitum pellet eating from FED in PPGNTS- hM3Dq mice. n=7 animals for analyses presented in b-d.
(b) Daily food intake during 48h test, 2-way within-subjects ANOVA: Drug × Day F(1,6)=14.52, p=0.0089.
(c) Cumulative hourly food intake over two days, 2-way within-subjects ANOVA: Drug × Time F(48,288)=6.481, p<0.0001.
(d) 24h and 48h bodyweight change, 2-way within-subjects ANOVA: Drug F(1,6)=10.41, p=0.018.
(e) Experimental model and paradigm for BSS analysis in 18h fasted PPGNTS-hM3Dq mice. n=7 animals for analyses presented in f-k.
(f-g) Behavioural satiety sequences following saline and CNO injections. Satiation point/satiety onset (when duration inactive exceeds eating) shown by dotted lines.
(h-k) Quantitative analysis of hM3Dq effect on BSS behaviours, 2-way with-subjects ANOVA: h) Drug × Time F(7,42)=5.673, p=0.0001; i) Drug F(1,6)=5.261, p=0.0616; j) Drug F(1,6)=12.48, p=0.0123; k) Drug F(1,6)=4.028, p=0.0915.
All data presented as mean ± SEM.
We have previously argued that chemogenetic activation of PPGNTS neurons is a supraphysiological stimulus, based on the extent of cFos expression in this population in comparison to physiological stimuli7. Here we report that chemogenetic activation of PPGNTS neurons activated 82% of transduced neurons (Extended Data 2e), comparable to a previous study using another PPG-Cre mouse line which reported 98% activation5. These levels are similar to the ~80% activation reported following acute restraint stress in mice33, but substantially higher than the <50% we previously observed following the physiological stimulus of a large liquid diet meal7. That the robust suppression of intake elicited by supraphysiological activation of PPGNTS neurons is not associated with significant alteration to the behavioural satiety sequence supports the idea that PPGNTS neurons have translational potential as a pharmacological target for obesity treatment.
Our observations following chemogenetic activation of PPGNTS neurons contrast with previously reported effects in the BSS assay of the emesis/nausea-inducing agent lithium chloride and the GLP-1RA Exendin-4, which reduce eating rate and almost completely suppress grooming and other active behaviours34,35. Instead, and consistent with prior evidence that PPGNTS activation does not condition flavour avoidance5, the absence of behavioural satiety sequence disruption reported here supports the view that PPGNTS neuronal activation suppresses eating without inducing nausea/malaise, in contrast to the effects of peripherally administered GLP-1RAs.
Glp1r-expressing VANs suppress eating and condition flavour avoidance
Direct synaptic input from undefined population(s) of vagal afferent neurons (VANs) to PPGNTS neurons14,29 presumably underlies the ability of gastrointestinal distension and large liquid intakes to induce cFos expression in this NTS population32,36, and to drive their role in large meal satiation reported here. However, the molecular identities of VAN inputs to PPGNTS neurons remain to be characterized. VANs defined by their expression of the GLP-1 receptor gene (Glp1r) innervate the gut and have been identified as a predominantly mechanosensory population which encode gastrointestinal distension, detected by intraganglionic laminar endings in the myenteric plexus and intramuscular arrays in the smooth muscle layers of the stomach and intestine27,28. These findings challenged the classical view that Glp1r VANs are chemosensory neurons which receive nutrient detection information in a paracrine manner, via binding of GLP-1 released locally from enteroendocrine cells17,25. However, it is well-established that gastrointestinal distension and the gut hormone CCK are able to synergistically activate mechanosensory VANs (original studies reviewed in37) and this has now also been demonstrated with GLP-138. Furthermore, recent transcriptomic analyses suggest that Glp1r VANs may be segregated into distinct mechanosensory and chemosensory subpopulations16,28. Crucially, it is unknown whether PPGNTS neurons are a major synaptic target of any Glp1r VAN populations, and thus to what extent direct vagal communication between peripheral and central GLP-1 systems is neuroanatomically plausible. To address this question, we developed approaches for viral targeting and activation of Glp1r VANs with chemogenetic and optogenetic effectors (Fig. 3a,f), and determined whether these manipulations produced effects on eating consistent with Glp1r VANs being part of a unified gut-brain satiation circuit with PPGNTS neurons. Chemogenetic activation of Glp1r VANs using the excitatory hM3Dq DREADD in ad libitum eating mice suppressed eating during the dark but not subsequent light phase (Fig. 3b, Extended Data 3a). Notably, however, the magnitude of this hypophagic effect appeared less robust than that following chemogenetic activation of PPGNTS neurons. Bodyweight was also transiently decreased, driven by suppressed eating rather than increased energy expenditure (Fig. 3c–e, Extended Data 3b–c). To functionally validate chemogenetic activation of Glp1r VANs, and explore their direct and/or indirect connectivity to PPGNTS neurons, we quantified neuronal activation in the NTS by cFos immunoreactivity (Extended Data 3d). Chemogenetic activation induced cFos expression in the NTS per se, however expression was not significantly increased in PPGNTS neurons (Extended Data 3e–f).
Figure 3. Glp1r-expressing VANs suppress eating and condition flavour avoidance.
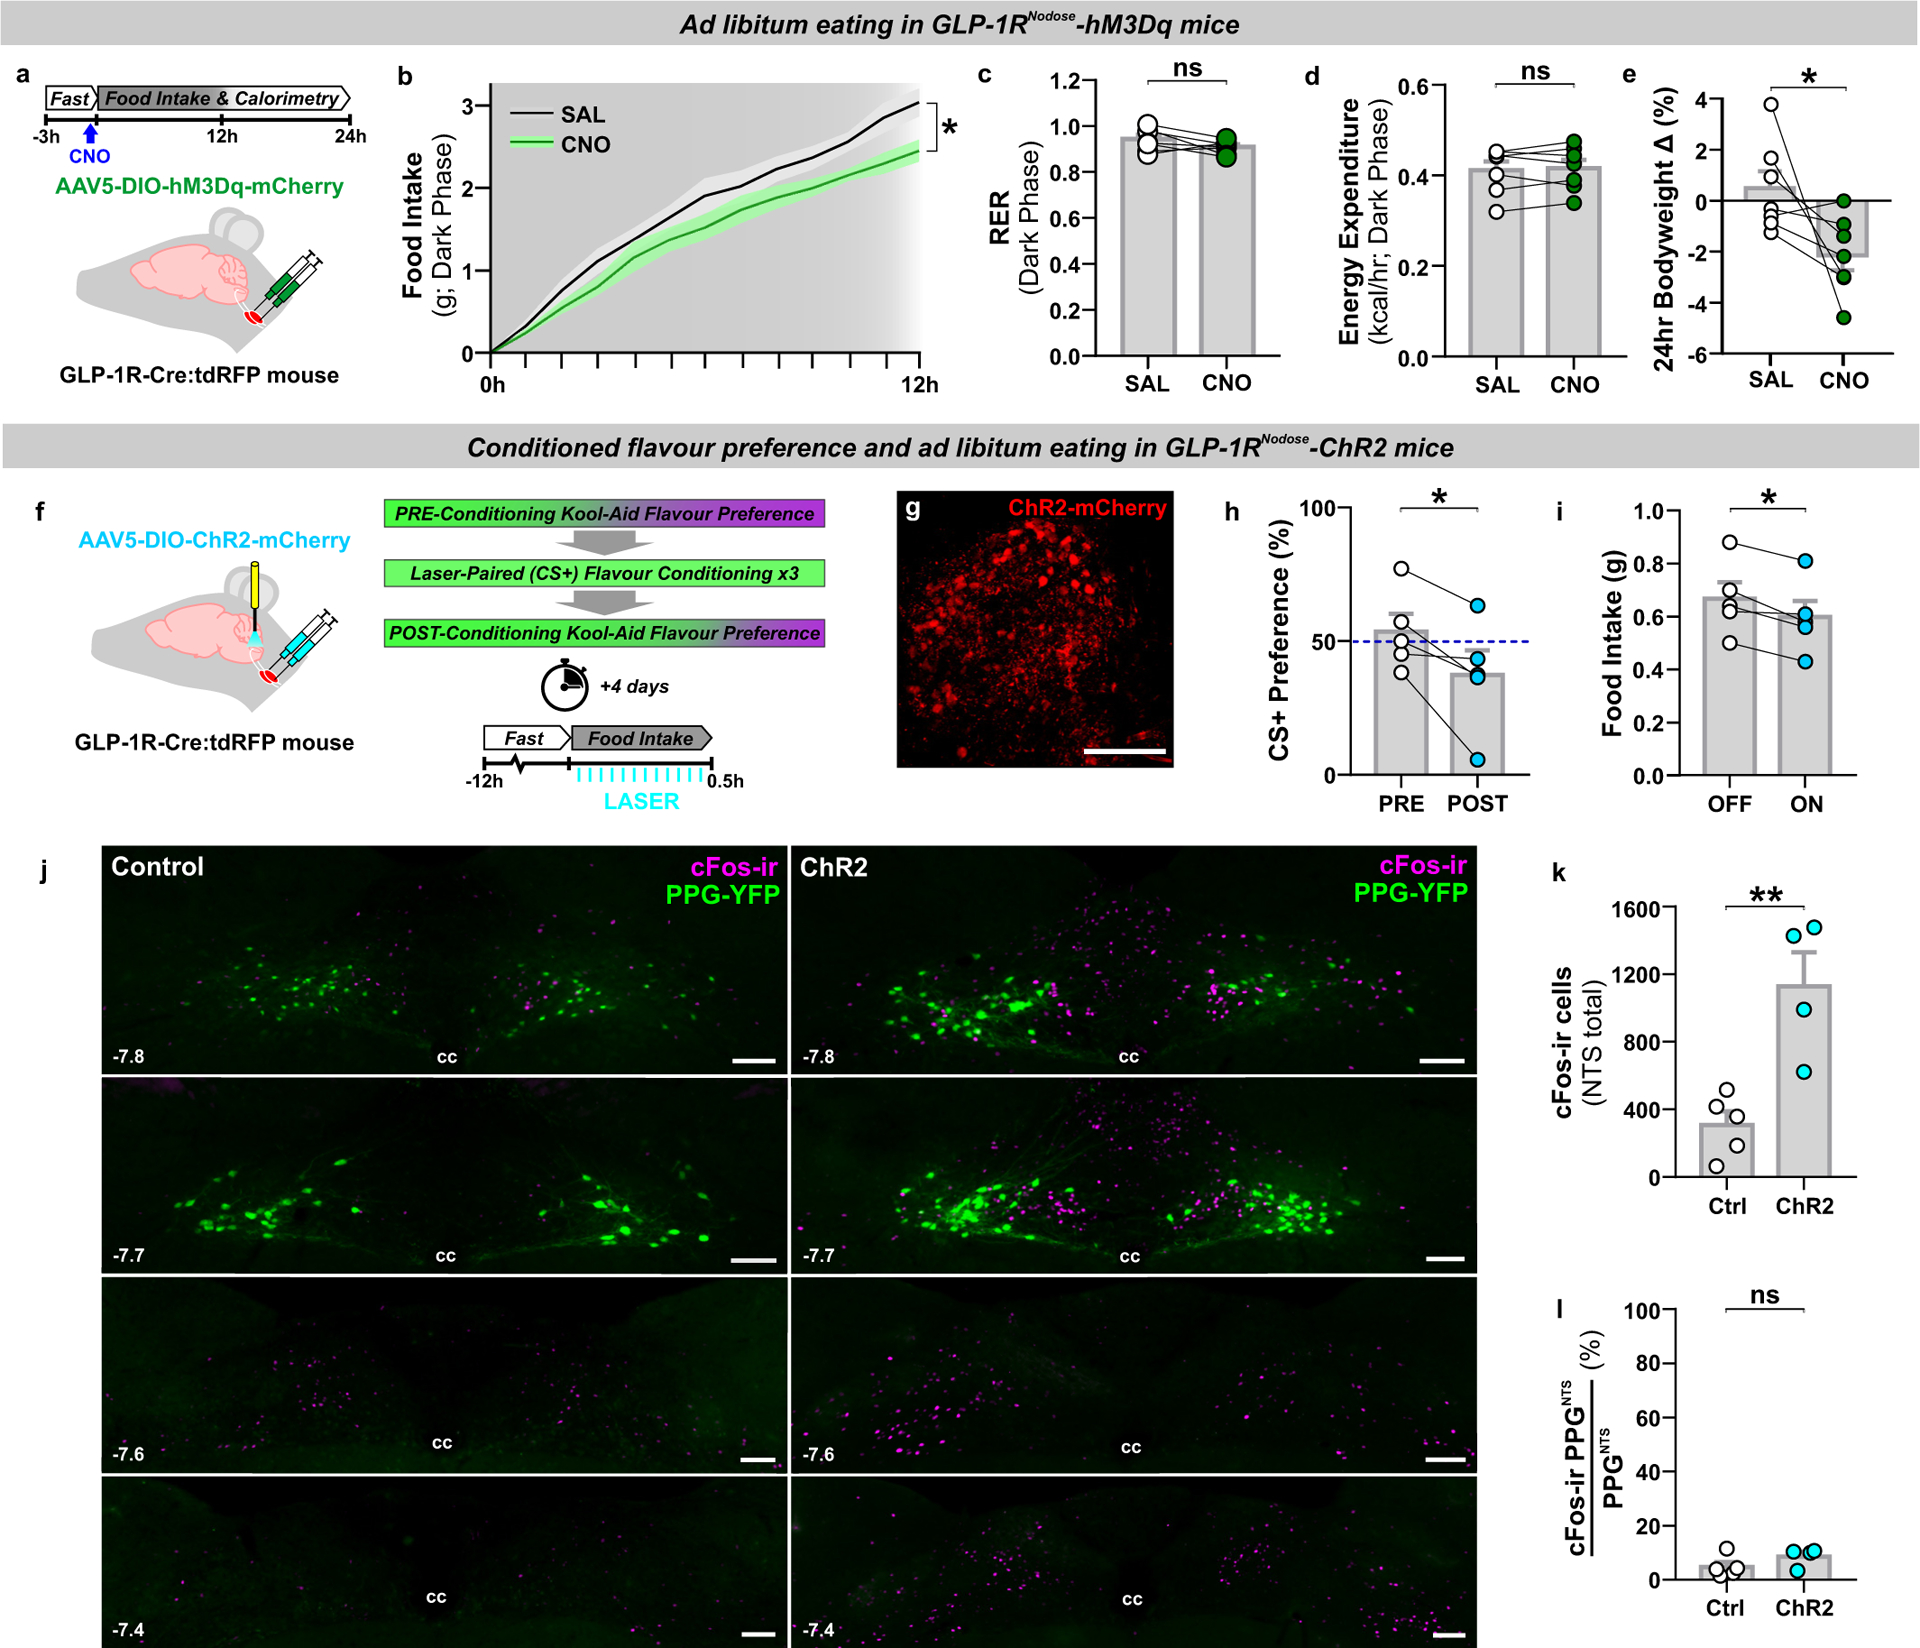
(a) Experimental model and paradigm for food intake and metabolic analysis of ad libitum eating GLP-1RNodose-hM3Dq mice. n=7 animals for analyses presented in b-e.
(b) Cumulative hourly dark phase food intake, 2-way within-subjects ANOVA: Drug × Time F(12,144)=2.078, p=0.0218.
(c-e) Dark phase metabolic parameters and 24h bodyweight change, paired 2-tailed t-test: c) t(6)=1.642, p=0.152; d) t(6)=0.543, p=0.607; e) t(6)=2.323, p=0.0296.
(f) Experimental model and paradigm for optogenetically-evoked conditioned flavour preference and intake analysis in GLP-1RNodose-ChR2 mice. n=5 animals for analyses presented in h-i; n=5 (Ctrl) / 4 (ChR2) for analyses presented in k-l.
(g) Z-projection photomicrograph of ChR2-mCherry expression in nodose ganglia (representative of 7 independent experiments). Scale=100μm.
(h-i) Conditioned stimulus (CS+) preference and 0.5h food intake, paired 2-tailed t-test: h) t(4)=3.216, p=0.0324; i) t(4)=3.976, p=0.0165.
(j) Photomicrographs of cFos immunoreactivity (cFos-ir) in coronal NTS sections from GLP-1R-Cre × PPG-YFP mice bilaterally injected in nodose ganglia with control virus (Control) or AAV9-DIO-ChR2-eYFP (ChR2) and exposed to blue light (photomicrographs representative of independent experiments from 4/5 animals). Distance in mm posterior to Bregma in bottom left, cc: central canal. Scale=100μm.
(k) Total cFos immunoreactive cells in the NTS of control and ChR2 mice, unpaired 2-tailed t-test: t(7)=4.122, p=0.0044.
(l) PPGNTS neurons co-localised with cFos immunoreactivity in the NTS. Mann-Whitney 2-tailed U-test: U=6, p=0.4127.
All data presented as mean ± SEM.
The modest anorexigenic effect of chemogenetic activation of Glp1r VANs in ad libitum eating mice precluded use of the 18hr fasted BSS paradigm in this model. We therefore instead tested whether optogenetic activation of the central axon terminals of Glp1r VANs with the excitatory opsin ChR2 was able to condition avoidance of, or a preference for, a paired novel flavour of Kool-Aid (Fig. 3f–g). Optogenetic activation of Glp1r terminals within the NTS conditioned avoidance of the paired flavour (Fig. 3h), and also modestly suppressed eating in a subsequently conducted acute eating test (Fig. 3i). Optogenetic activation of this vagal population induced robust cFos expression throughout the NTS (Fig. 3j), consistent with the effects of chemogenetic activation, and activation was similarly not significantly increased in PPGNTS neurons (Fig. 3k–j).
The behavioural responses to Glp1r VAN activation contrast both with the lack of disruption to the BSS we observed following activation of PPGNTS neurons, and a previous report that chemogenetic activation of PPGNTS neurons does not condition flavour avoidance5. They are however consistent with several reports that GLP-1RAs condition flavour avoidance and reduce reward-related behaviours39–41. These results thus support prior evidence that Glp1r VANs at least partly mediate endogenous or exogenous peripheral GLP-1 satiation signalling23,25. However, the modest anorexigenic effects and conditioning of avoidance produced by activation of Glp1r VANs, and the absence of cFos induction in PPGNTS neurons by these manipulations, argue against the hypothesis that Glp1r VANs are the primary driver of eating suppression by PPGNTS neurons.
Oxtr rather than Glp1r VANs are the major vagal input to PPGNTS neurons
We next tested the neuroanatomical connectivity between PPGNTS neurons and Glp1r VANs, using two complementary circuit mapping approaches. Utilizing a cross of GLP-1R-Cre and PPG-YFP mouse strains13 combined with unilateral viral targeting of nodose ganglia, we selectively labelled the NTS terminal fields of Glp1r VANs with the bright cell-filling fluorescent reporter tdTomato, allowing their simultaneous visualization with YFP-expressing PPG somata and dendrites in the NTS (Fig. 4a). While extensive innervation by both right and left branch Glp1r VANs was observed throughout the rostro-caudal extent of the NTS, there was little regional overlap with PPGNTS neurons. In the caudal NTS, Glp1r vagal afferents predominantly terminated dorsomedial to PPGNTS somata, and their terminal fields extended considerably beyond the rostral extent of the PPGNTS population (Fig. 4b–c).
Figure 4. Oxtr rather than Glp1r VANs are the major vagal input to PPGNTS neurons.
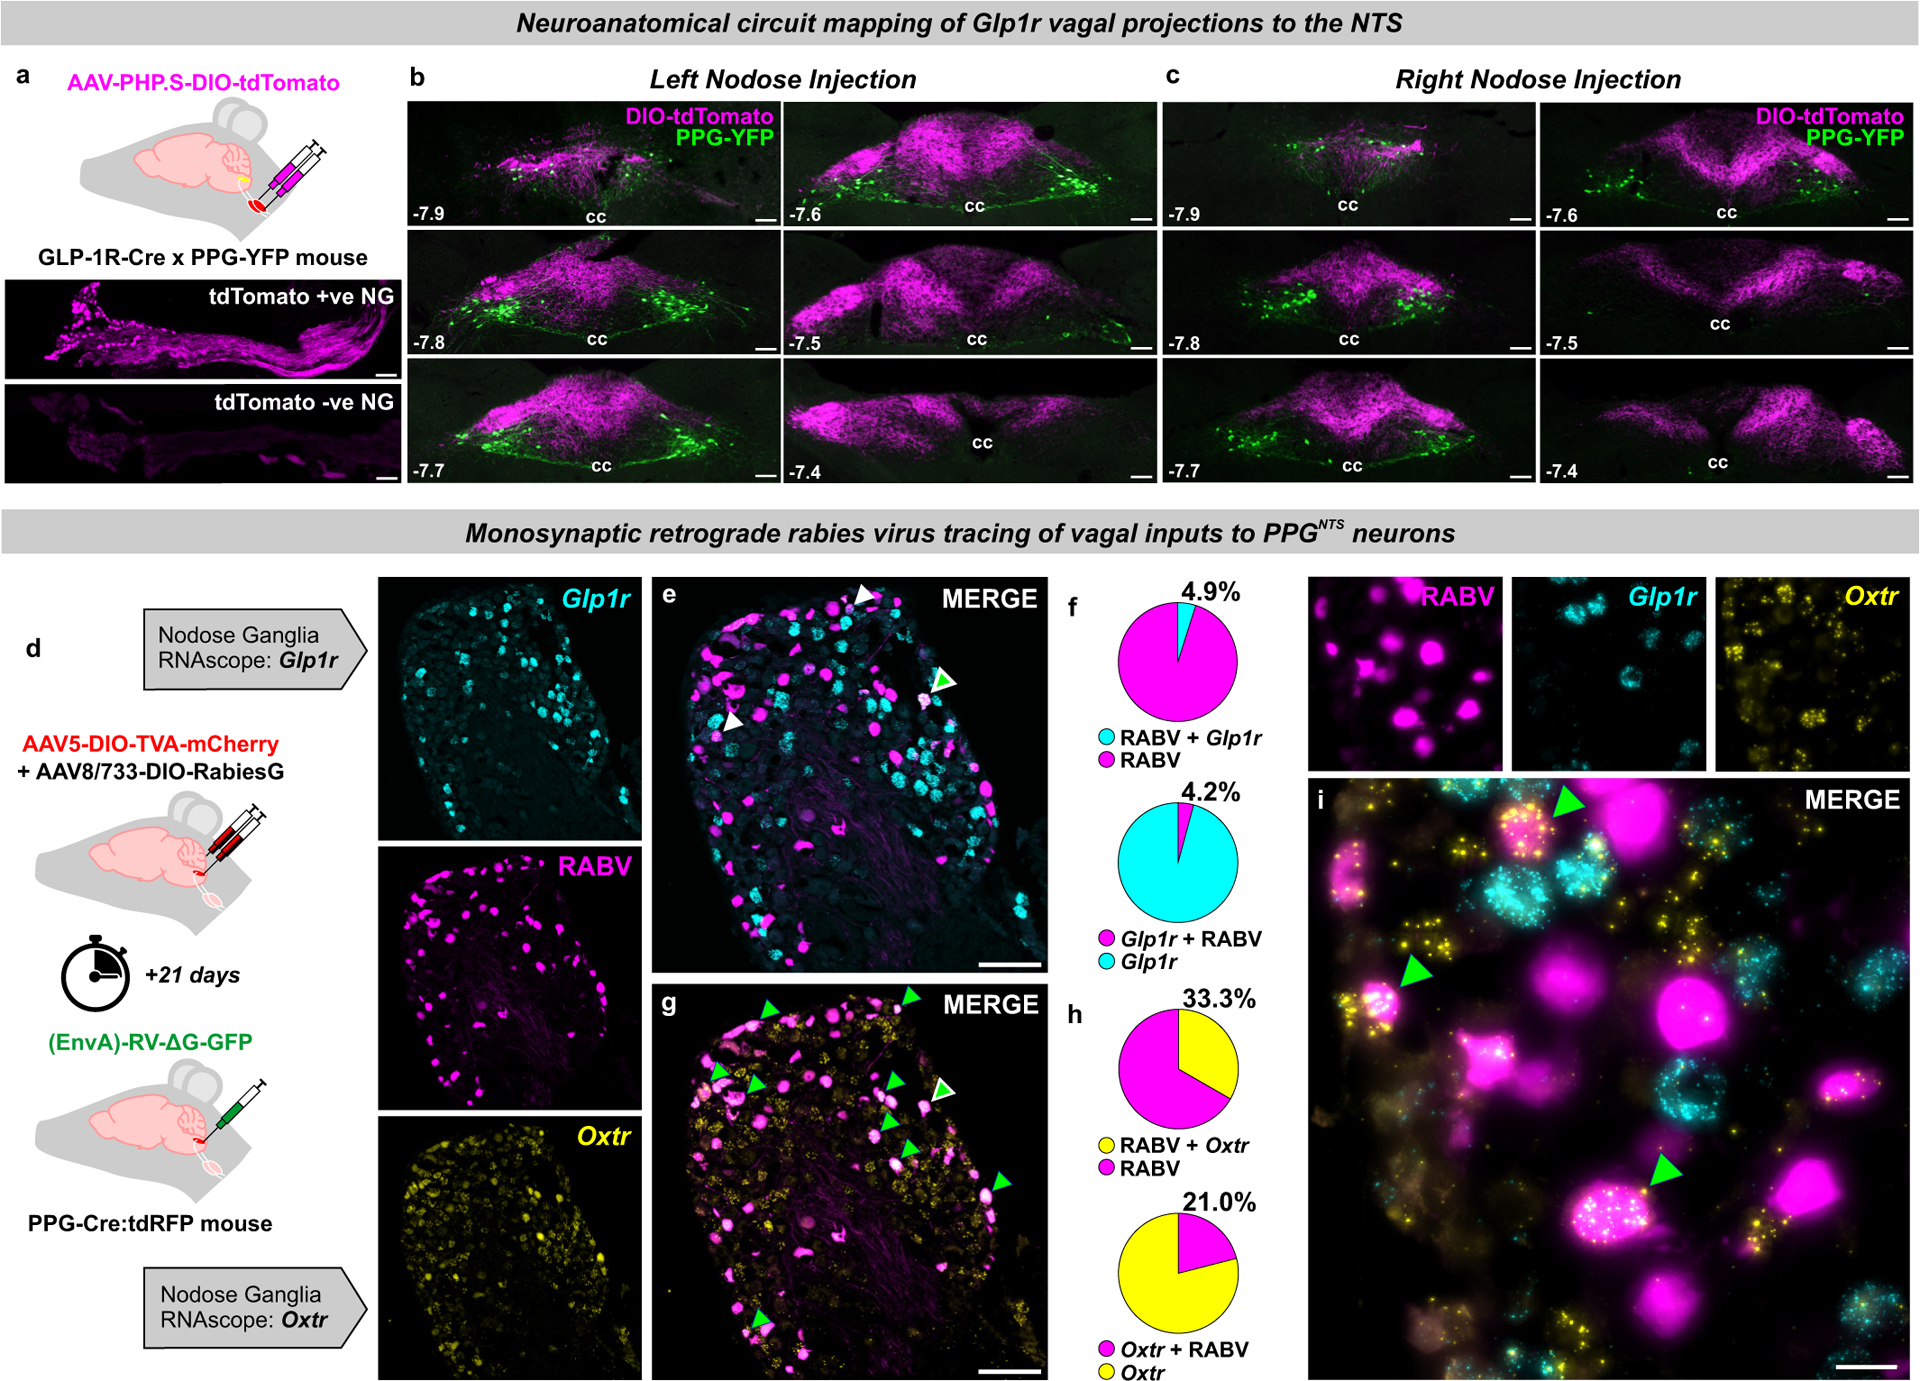
(a) Experimental model for viral-mediated mapping of left and right Glp1r vagal afferent projections to the NTS, and photomicrographs of tdTomato expression in virus-injected nodose ganglia (NG) and non-injected contralateral NG (photomicrographs in a-c representative of independent experiments from 3 animals per injection side). Scale=100μm.
(b-c) Photomicrographs of tdTomato-expressing terminal fields of L and R branch Glp1r vagal afferents along the rostro-caudal extent of the NTS (mm posterior to Bregma in bottom left) in PPG-YFP mice, cc: central canal. Scale=100μm.
(d) Experimental model for rabies virus (RABV)-mediated monosynaptic retrograde tracing of vagal inputs to PPGNTS neurons combined with RNAscope fluorescence in situ hybridization for GLP-1R (Glp1r) and oxytocin receptor (Oxtr) transcripts (photomicrographs in e-i representative of independent experiments from 8 animals).
(e) Photomicrograph of nodose ganglion showing rabies virus GFP expression (RABV) and Glp1r FISH. RABV+Glp1r co-localization shown by white arrows, RABV+Glp1r+Oxtr by white-edged green arrow. Scale=100μm.
(f) RABV and Glp1r co-localization as proportions of all RABV+ cells and all Glp1r+ cells, from 903 RABV+, 1188 Glp1r+ and 1460 Oxtr+ cells from L and R NG.
(g) Photomicrograph of nodose ganglion showing RABV expression and Oxtr FISH. Scale=100μm.
(h) RABV and Oxtr co-localization as proportions of all RABV+ cells and all Oxtr+ cells. RABV+Oxtr co-localization shown by green arrows, RABV+Glp1r+Oxtr by white-edged green arrow.
(i) High magnification Z-projection of RABV, Glp1r and Oxtr cells in NG. Scale=20μm.
All data presented as mean ± SEM.
The absence of overlap between Glp1r VAN terminals and PPGNTS somata does not preclude some vagal input via their distal dendrites in the dorsomedial NTS. We therefore quantified direct synaptic connectivity between Glp1r VANs and PPGNTS neurons by Cre-dependent monosynaptic retrograde rabies virus tracing in combination with RNAscope fluorescence in situ hybridisation in nodose ganglia for Glp1r and oxytocin receptor gene (Oxtr) expression (Fig. 4d). Expression of Oxtr was investigated based on reports of target-based scRNAseq analysis of VANs (target-scSeq), which suggest that mechanosensation of gastric and intestinal distension are predominantly encoded by VANs defined by Glp1r and Oxtr expression, respectively28. As previously reported29, we observed that rabies virus-GFP was expressed extensively in nodose ganglia, confirming substantial monosynaptic vagal innervation of PPGNTS neurons. Surprisingly, however, we found that <5% of PPGNTS neuron-innervating VANs express Glp1r alone, and similarly <5% of VANs expressing Glp1r alone synapse onto PPGNTS neurons (Fig. 4e–f). Conversely, 33% of all PPGNTS neuron-innervating VANs express Oxtr alone, and 21% of VANs which express Oxtr alone synapse onto PPGNTS neurons (Fig. 4g–h). VANs expressing both Oxtr and Glp1r (which are likely mechanosensory rather than chemosensory Glp1r VANs) comprise 20–25% of these populations (Extended Data 4c), and 26% of these Oxtr / Glp1r VANs synapse onto PPGNTS neurons, comprising an additional 9% of vagal input to this population (Extended Data 4d–h). We thus identified PPGNTS neurons as an important synaptic target of Oxtr VANs, in addition to the catecholaminergic target population previously identified28. Our findings strongly suggest that Oxtr- rather than Glp1r-expressing VANs are the primary source of gastrointestinal distension signals driving PPGNTS neuron-mediated satiation. Furthermore, as the overwhelming majority of VANs expressing Glp1r but not Oxtr (which presumably includes the chemosensory population) do not synapse onto PPGNTS neurons, they are highly unlikely to be a functionally relevant target of vagal-dependent paracrine signalling from the peripheral GLP-1 system.
PPGNTS neurons are necessary for oxytocin-induced eating suppression
Having identified Oxtr-expressing VAN input to PPGNTS neurons, we next characterized the effects of oxytocin itself on this population. We first performed ex vivo calcium imaging using coronal brainstem slices from transgenic mice expressing GCaMP3 in PPGNTS neurons42,43. Slices were taken at a rostro-caudal level containing the majority of PPGNTS neurons, and which is reported to contain substantial Oxtr VAN terminal fields28. Superfusion of oxytocin activated 84% of glutamate-responsive PPGNTS neurons, as determined by increased calcium-dependent fluorescence (Fig. 5a–e). Notably, superfusion of GLP-1 has no effect on PPGNTS neurons in the same preparation13.
Figure 5. PPGNTS neurons are necessary for oxytocin-induced eating suppression.
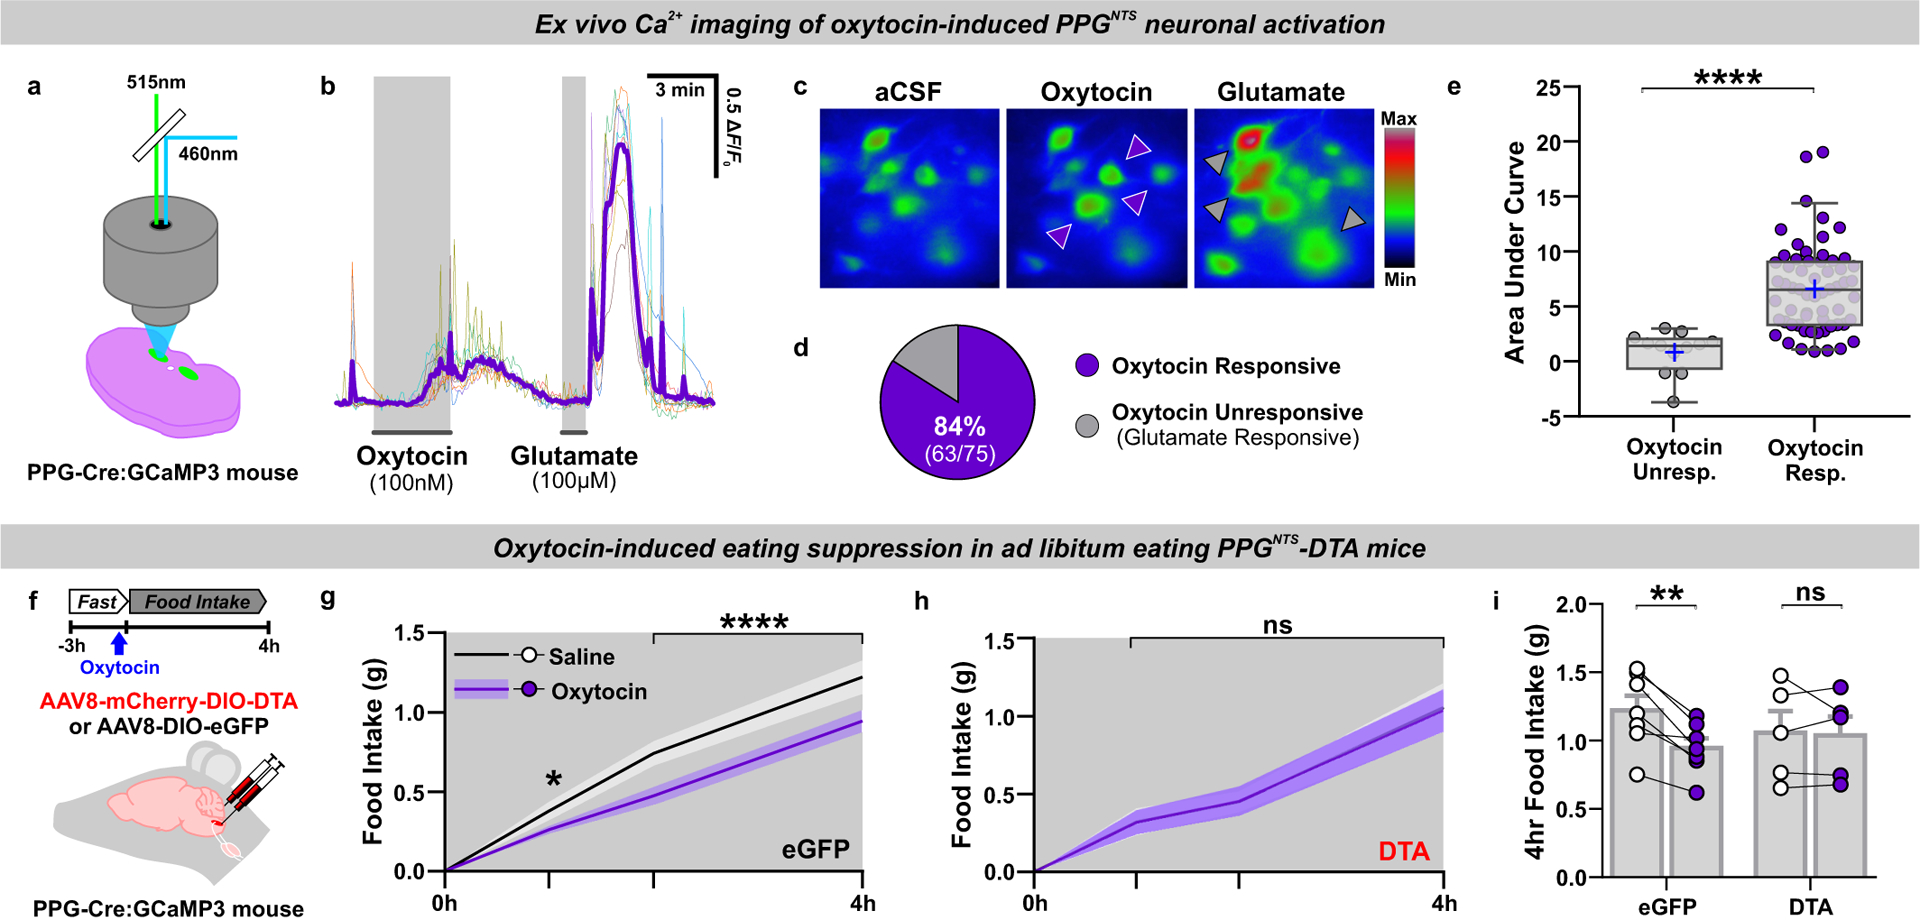
(a) Experimental model for imaging of oxytocin-induced neuronal calcium dynamics in ex vivo brainstem slices from mice expressing GCaMP3 in PPG neurons. n=75 cells from 3 animals examined over 8 independent experiments for analyses in b-e.
(b) Representative ΔF/F0 traces from individual neurons and mean response (purple line) during bath application of oxytocin and glutamate.
(c) Representative images of PPGNTS:GCaMP3 neurons pseudocolored for fluorescence intensity under baseline conditions (aCSF) and responding to oxytocin (purple arrows) and glutamate (grey arrows).
(d) Oxytocin-responsive PPGNTS:GCaMP3 neurons as a proportion of all glutamate-responsive PPGNTS neurons (i.e. healthy neurons with functional GCaMP3 expression).
(e) Median AUC during exposure to oxytocin in oxytocin unresponsive and responsive PPGNTS:GCaMP3 neurons, Mann-Whitney 2-tailed U-test: U=48, p<0.0001.
(f) Experimental model and paradigm for oxytocin-induced eating suppression in PPGNTS-DTA ablated mice or eGFP-transduced controls. n=5 (DTA) / 7 (eGFP) animals for analyses presented in g-i.
(g-h) Cumulative 4h dark phase food intake in eGFP and DTA mice administered oxytocin (0.4 mg/kg, i.p.), 2-way within-subjects ANOVA: g) Drug × Time F(2,12)=6.133, p=0.0146; h) Drug F(1,4)=0.0117, p=0.919.
(i) 4h food intake by virus, 2-way mixed-model ANOVA: Drug × Virus F(1,10)=8.472, p=0.0155.
All data presented as mean ± SEM except box plot in e, in which the box is centred on the median and bound at 25 and 75%, with whiskers at 5 and 95% and blue cross at the mean.
Peripherally administered oxytocin is reported to suppress eating in a vagal-dependent manner44,45, so we subsequently tested whether PPGNTS neurons were necessary for this effect, given their direct synaptic inputs from Oxtr VANs. While oxytocin acutely suppressed eating in ad libitum eating control mice, this effect was completely abolished in mice in which PPGNTS neurons had been virally ablated by DTA expression (Fig. 5f–i, Extended Data 5a–b), confirming these neurons as a necessary component of the gut-brain circuit recruited by peripheral oxytocin to suppress eating.
PPGNTS neurons are not a major synaptic target of area postrema Glp1r neurons
Having determined the neuroanatomical implausibility of vagal transmission of peripheral GLP-1 signals to PPGNTS neurons, we next investigated a potential route for endocrine GLP-1 signalling to these NTS neurons via Glp1r neurons in the area postrema (AP), which lacks a blood-brain barrier and has been implicated as a site where circulating GLP-1 and GLP-1RAs may act to suppress eating20,23,46,47. We therefore used brainstem tissue from the same mice used for rabies virus-mediated retrograde tracing of vagal inputs to PPGNTS neurons, to also quantify monosynaptic input from AP neurons which express Glp1r mRNA (Fig. 6a). In contrast to robust synaptic input from VANs, synaptic inputs to PPGNTS neurons from the AP were relatively sparse (Fig. 6b). Of these sparse inputs from the AP, 25% expressed Glp1r, however these represented <3% of all Glp1r AP neurons (Fig. 6c). As catecholaminergic AP neurons express GLP-1R and have been proposed to link peripheral GLP-1 signalling to central nuclei (including the NTS) involved in eating control47, we further characterized PPGNTS neuronal input from tyrosine hydroxylase immunoreactive AP neurons using the same tissue (Fig. 6d–e, Extended Data 6a–c). ~20% of the sparse AP inputs to PPGNTS neurons are catecholaminergic, consistent with a report that PPGNTS neurons are indirectly activated by noradrenaline48. However, these presynaptic AP neurons comprised only 3% of all catecholaminergic AP neurons (Fig. 6e). Therefore, PPGNTS neurons are unlikely to be a functionally relevant target for peripheral GLP-1 and/or GLP-1RAs acting via the AP to suppress eating.
Figure 6. PPGNTS neurons are not a major target of area postrema Glp1r neurons.
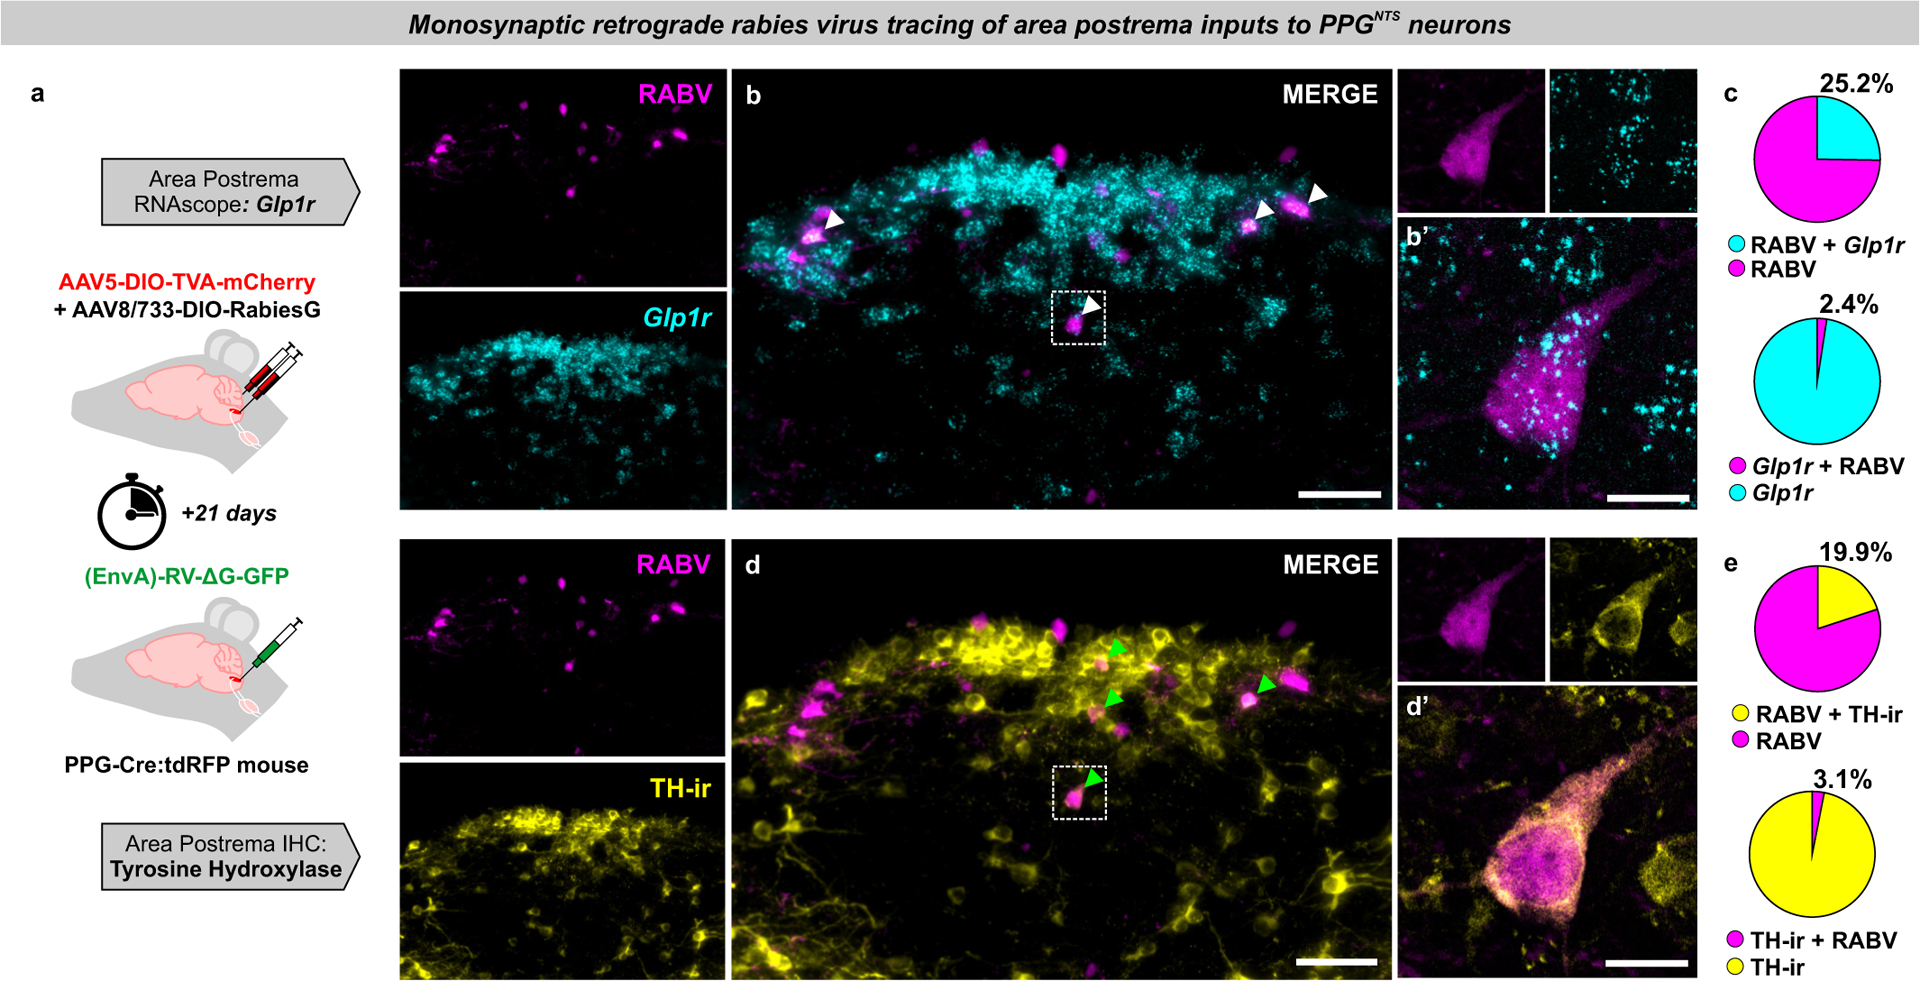
(a) Experimental model for rabies virus-mediated monosynaptic retrograde tracing of area postrema inputs to PPGNTS neurons combined with FISH for Glp1r (photomicrographs in b-d representative of independent experiments from 4 animals).
(b) Photomicrographs of coronal NTS section showing RABV expression and Glp1r FISH. RABV+Glp1r co-localization shown by white arrows. Scale=100μm (inset 20μm).
(c) RABV and Glp1r co-localization as proportions of all RABV+ cells and all Glp1r+ cells, from 53 RABV+ and 549 Glp1r+ cells.
(d) Photomicrographs of coronal NTS section showing RABV expression and TH-ir. Examples of RABV+TH-ir co-localization shown by green arrows. Scale=100μm (inset 20μm).
(e) Quantification of RABV and TH-ir co-localization as proportions of all RABV+ cells and all TH-ir cells, from a total of 53 RABV+ and 341 TH-ir cells.
All data presented as mean ± SEM.
Liraglutide and semaglutide suppress eating independently of PPGNTS neurons
Limitations to rabies virus propagation efficiency inevitably result in an underestimate of the total number of neurons (including Glp1r VANs and AP neurons) providing direct synaptic input to PPGNTS neurons. Nevertheless, it is apparent that the majority of Glp1r VANs and AP neurons are not directly presynaptic to the central GLP-1 system. However, one or both of these Glp1r populations may be polysynaptically connected to PPGNTS neurons, in which case vagal and/or endocrine peripheral GLP-1 could still provide substantial input to the central GLP-1 system. PPGNTS neurons may alternatively (or additionally) receive input from other Glp1r-expressing neuronal populations which are accessible to peripheral GLP-1/GLP-1RAs and are reportedly necessary for their hypophagic effects, such as glutamatergic neurons49 or GABAergic NTS neurons50. We therefore investigated whether PPGNTS neurons are a necessary component of any neurocircuits recruited by peripheral GLP-1RAs to suppress eating, by testing whether PPGNTS neuronal ablation attenuates the anorexigenic effects of two long-acting anti-obesity GLP-1RAs, liraglutide and semaglutide (Fig. 7a). Liraglutide robustly suppressed intake and bodyweight over 24 hours in ad libitum eating eGFP-transduced control mice, however DTA ablation of PPGNTS neurons had no effect on the magnitude of eating suppression at any timepoint, or on 24h bodyweight loss (Fig. 7b–d, Extended Data 7a–e). Semaglutide suppressed eating to an even greater extent than liraglutide, and similarly PPGNTS neuron ablation had no impact on acute or delayed eating suppression, or on bodyweight loss (Fig. 7e–g, Extended Data 7f–j).
Figure 7. Liraglutide and semaglutide suppress eating independently of PPGNTS neurons.

(a) Experimental model and paradigm for GLP-1RA-induced eating suppression in PPGNTS-DTA ablated mice or eGFP-transduced controls. n=8 (DTA) / 7 (eGFP) animals for analyses presented in b-g.
(b-d) Cumulative food intake and bodyweight change over 1 day in eGFP and DTA mice administered liraglutide (200 μg/kg, s.c.), 2-way within-subjects or mixed-model ANOVA: b) Drug × Time F(5,30)=35.35, p<0.0001; c) Drug × Time F(5,35)=74.95, p<0.000; d) Drug F(1,13)=33.17, p=0<0.0001, Virus F(1,13)=1.198, p=0.294.
(e-g) Cumulative food intake and bodyweight change over 1 day in eGFP and DTA mice administered semaglutide (60 μg/kg, s.c.), 2-way within-subjects or mixed-model ANOVA: e) Drug × Time F(5,30)=51.83, p<0.0001; f) Drug × Time F(5,35)=54.28, p<0.0001; g) Drug F(1,13)=122.6, p=0<0.0001, Virus F(1,13)=0.224, p=0.644.
(h) Photomicrographs of cFos immunoreactivity (cFos-ir) in coronal NTS sections (mm posterior to Bregma in bottom left) from PPG-YFP mice perfused 4h after vehicle (VEH) or semaglutide (SEMA; 60 μg/kg, s.c.) administration (photomicrographs representative of independent experiments from 3/4 animals). n=3 (VEH) / 4 (SEMA) animals for analyses presented in i-k, cc: central canal. Scale=100μm.
(i-j) Total cFos in NTS and AP of mice administered vehicle or semaglutide, unpaired 1-tailed t-tests: i) t(5)=4.59, p=0.0029; j) t(5)=2.66, p=0.0225.
(k) PPGNTS neurons co-localised with cFos immunoreactivity in NTS. Mann-Whitney 2-tailed U-test: U=0, p=0.0571.
All data presented as mean ± SEM.
These findings demonstrate that PPGNTS neurons are not necessary for GLP-1RA-induced suppression of eating. While access to the brain by GLP-1RAs is limited, they are able to access several circumventricular Glp1r-expressing nuclei (in addition to the AP), which may be upstream of PPGNTS neurons, or part of a subset of the downstream targets of these neurons12,20,24,51. Relevant GLP-1RA-accessible downstream Glp1r populations likely include neurons in the hypothalamic arcuate nucleus, which are at least partly necessary for liraglutide-induced suppression19. Administration of GLP-1RAs to PPGNTS neuron-ablated mice cannot differentiate between whether there are any Glp1r populations upstream of PPGNTS neurons that are functionally dispensable for eating suppression, or if GLP-1RAs only recruit circuits downstream or entirely independent of PPGNTS neurons. We therefore investigated whether the same highly anorexigenic dose of semaglutide used in the ablation experiment was able to induce neuronal activation of PPGNTS neurons, by quantifying cFos expression in the PPG-YFP mouse line51,52. Semaglutide induced robust cFos expression within the AP and throughout the rostro-caudal extent of the NTS (Fig. 7h–j), and additionally in hypothalamic and parabrachial nuclei (Extended Data 7k–t). However, consistent with a report that the GLP-1RA Exendin-4 does not increase cFos expression in PPGNTS neurons18, and that these neurons themselves do not express Glp1r13,14, we found that <3% of PPGNTS neurons were activated by semaglutide (Fig. 7k). This finding demonstrates that systemically-administered GLP-1RAs act centrally via ascending circuits parallel to, but independent of, PPGNTS neurons, and/or by partially bypassing them to activate a subset of their downstream targets.
PPGNTS neuron activation augments semaglutide-induced eating suppression
The convergent lines of neuroanatomical and functional evidence reported here suggest that, rather than comprising part of a unified GLP-1 gut-brain circuit, PPGNTS neurons suppress eating via circuits which are anatomically and functionally distinct from those recruited by peripheral endogenous GLP-1 and peripherally administered GLP-1RAs. To support the hypothesis that the circuits mediating eating suppression by peripheral GLP-1RAs and PPGNTS neurons are indeed entirely independent, or at least only converge at limited peripherally-accessible downstream population(s), it is a necessary to demonstrate that their concurrent activation suppresses eating to a greater extent than either circuit alone. We therefore tested this hypothesis by administering the same dose of semaglutide that elicited robust eating suppression and neuronal activation in earlier experiments, in combination with chemogenetic activation of PPGNTS neurons with hM3Dq, and assessed intake and bodyweight over 72 hours (Fig. 8a). As expected, either manipulation alone suppressed eating over the first 24 hours, with semaglutide eliciting the stronger effect. Crucially, their combined effect was significantly greater than that of semaglutide alone throughout the duration of acute chemogenetic activation (Fig. 8b–e). Consistent with our observation that PPGNTS neuron activation suppresses eating without compensatory rebound hyperphagia, both cumulative intake and bodyweight were reduced at 24 and 48 hours in both of the semaglutide-treated groups. The apparent floor effect on eating suppression at 24 hours confirmed that an appropriately high dose of semaglutide was used, but this likely precluded the ability to detect significantly augmented intake suppression and weight loss at these later timepoints (Fig. 8f, Extended Data 8a–d). The observed augmentation of the semaglutide effect could theoretically be explained by incomplete GLP-1R saturation by semaglutide within a peripherally-accessible subset of Glp1r-expressing nuclei downstream of PPGNTS neurons. However, as we deliberately used a high dose of semaglutide to overcome this possibility, and chemogenetic activation is itself a potent supraphysiological stimulus, this explanation is unlikely. Rather, as GLP-1RAs do not suppress eating via PPGNTS neurons, and since these neurons project to numerous central nuclei involved in eating control which are not accessible to GLP-1RAs, the most parsimonious explanation is that the observed augmentation derives from concurrent activation of distinct anorexigenic neurocircuits (summarised in Fig. 8g).
Figure 8. PPGNTS neuron activation augments semaglutide-induced eating suppression.
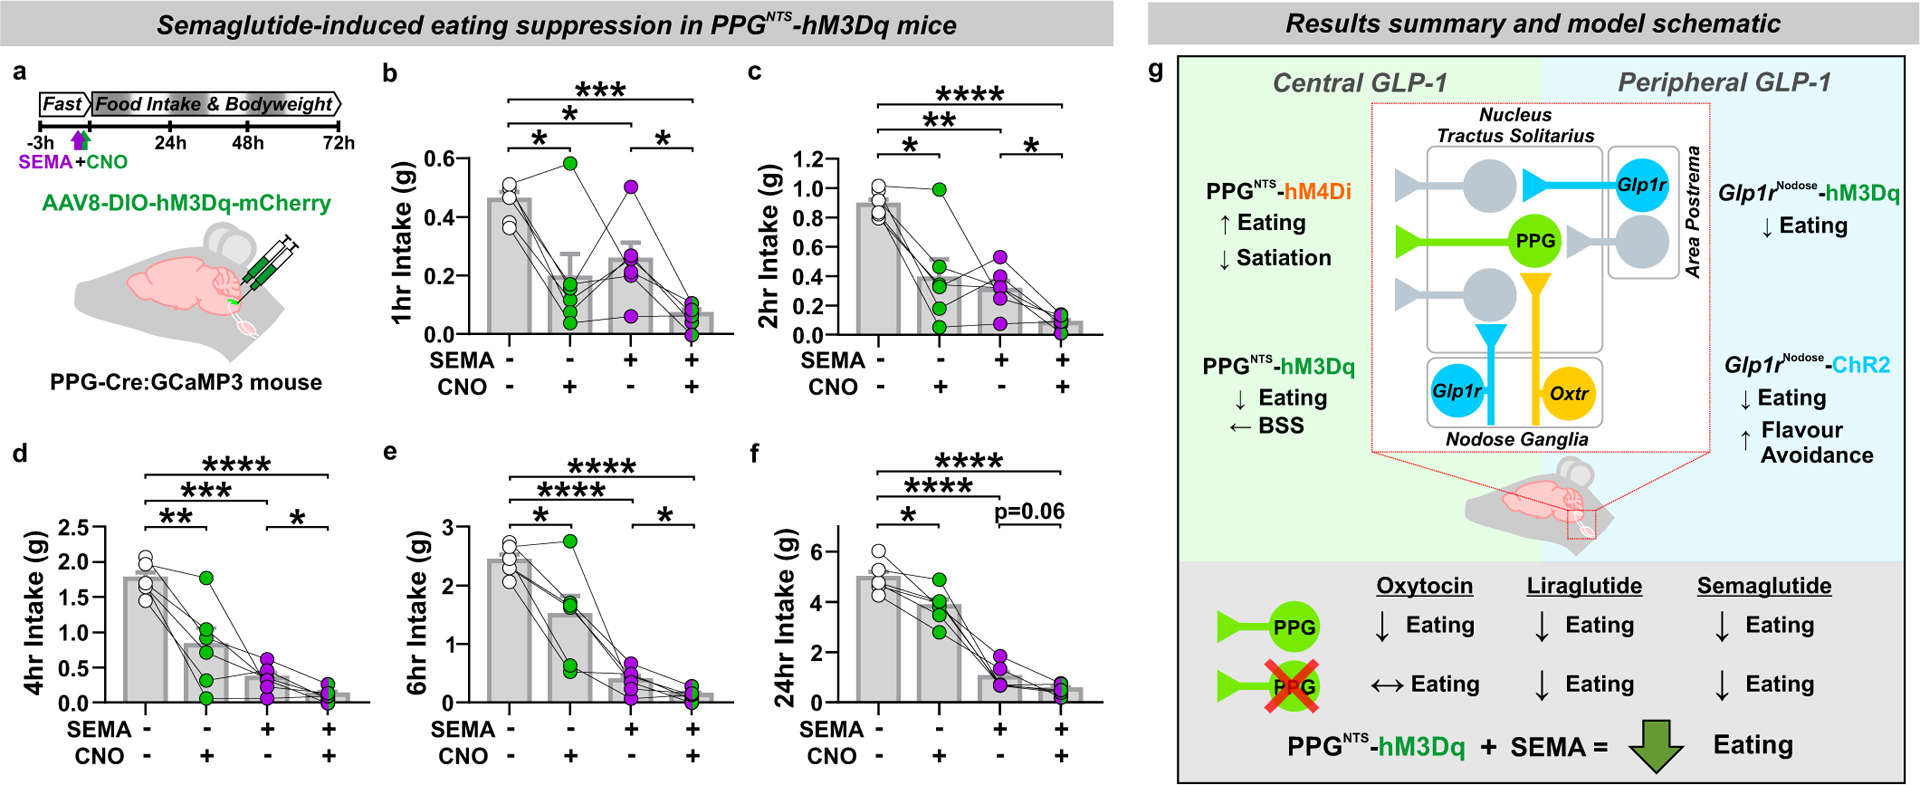
(a) Experimental model and paradigm for semaglutide-induced eating suppression in PPGNTS-hM3Dq mice and administered semaglutide (60 μg/kg, s.c.) and CNO (2 mg/kg, i.p.). n=6 animals for analyses presented in b-f.
(b-f) Cumulative food intake at 1, 2, 4, 6 and 24 hours, 1-way within-subjects ANOVA: b) Drug F(1.6,8.0)=11.94, p=0.0050; c) Drug F(1.5,7.7)=22.12, p=0.0009; d) Drug F(1.3,6.3)=35.35, p=0.0006; e) Drug F(1.2,6.0)=40.72, p=0.0005; f) Drug F(1.6,8.2)=125.8, p<0.0001.
(g) Graphical representation of the core findings of this study and proposed model of central and peripheral GLP-1 system gut-brain satiation circuit architecture in the brainstem.
All data presented as mean ± SEM.
Discussion:
Here we report that PPGNTS neurons encode satiation specifically during large meals, and have capacity for pharmacological activation to suppress eating without compensatory rebound hyperphagia or behavioural disruption. Activation of Glp1r VANs similarly suppressed intake, but did condition flavour avoidance, and complementary circuit mapping approaches demonstrated that PPGNTS neurons are not a major synaptic target of this vagal population. We report that PPGNTS neurons instead predominantly receive vagal input from Oxtr VANs, and are required for peripheral oxytocin-induced eating suppression. Similarly, PPGNTS neurons are at most a minor synaptic target of Glp1r neurons in the area postrema, suggesting that endocrine GLP-1 signalling from the periphery by this route does not require PPGNTS neurons. Consistent with this observation, PPGNTS neurons are not recruited by peripherally administered semaglutide, or required for the anorexigenic effects of liraglutide or semaglutide, and concurrent activation of PPGNTS neurons augments semaglutide-induced eating suppression. We therefore conclude that the unified peripheral to central GLP-1 satiation circuit hypothesis cannot be supported, but that the peripheral and central GLP-1 systems are rather components of functionally and anatomically independent eating control circuits. Furthermore, while pharmacokinetically-optimised GLP-1RAs may access a limited subset of Glp1r neuron populations downstream of PPGNTS neurons, such partial convergence of recruited circuits does not preclude the ability of PPGNTS neurons to augment GLP-1RA-induced eating suppression. Activation of PPGNTS neurons, either alone or in combination with GLP-1RAs, thus represents a rational strategy for obesity treatment. Given the unmet clinical need for effective and well-tolerated pharmacotherapies for obesity, an urgent research effort is warranted to identify and validate pharmacological targets for activation of PPGNTS neurons.
Methods:
Animals
We used 136 mice of both sexes (10–32 weeks old) from five previously-reported transgenic strains on C57BL/6NJ backgrounds. All experimental mice were from in-house colonies derived from breeding pairs supplied by Frank Reimann. For selective Cre-dependent viral targeting and ex vivo Ca2+ imaging of PPG neurons, we used mGlu-Cre/tdRFP53 and mGlu-Cre/GCaMP3 strains42, referred to herein as PPG-Cre:tdRFP and PPG-Cre:GCaMP3, respectively. For visualization of PPG neuron somata, axons and dendrites, we used the mGlu-YFP strain52, referred to herein as PPG-YFP. For selective Cre-dependent viral targeting of GLP-1 receptor-expressing neurons we used the Glp1r-Cre/tdRFP strain54, or a cross with the PPG-YFP strain13, referred to herein as GLP-1R-Cre:tdRFP and GLP-1R-Cre × PPG-YFP respectively. All mice were kept on a 12h light/dark cycle at 20–24°C and 45–65% relative humidity (typically 21°C and 55%). Normal rodent chow (Teklad 2018 or 7912, Envigo) and tap water were available ad libitum, and animals were group housed until surgery and/or behavioural experiments. Within-subjects design experiments were conducted using sex-balanced cohorts of appropriate genotype littermates as far as possible. Similarly, for between-subjects and mixed model design experiments, littermates were semi-randomly allocated to virus groups to ensure groups were balanced for sex and age as far as possible. All data are from biologically independent samples, i.e. technical repeats were not performed on any animals. Sample size calculations were not performed, appropriate group sizes (detailed in figure legends) were determined from pilot experiments and our previously published studies using these models and behavioural paradigms7,18,55.
Experiments conducted in the UK were performed in accordance with the U.K. Animals (Scientific Procedures) Act 1986, and experimental protocols were approved by the UCL Animal Welfare and Ethical Review Body (Bloomsbury Campus). Experiments conducted in the U.S. were performed in accordance with the U.S. Public Health Service’s Policy on the Humane Care and Use of Laboratory Animals, and experimental protocols were approved by the Institutional Animal Care and Use Committees of Florida State University and the University of Florida. Experiments conducted in Switzerland were performed in accordance with the Basel Declaration and the ethical guidelines of the Ethics Committee for Animal Experimentation of the Swiss Academy of Medical Sciences (SAMS) and the Swiss Academy of Sciences (SCNAT), and experimental protocols were approved by the Canton of Zurich’s Veterinary Office (ETH Zurich).
Stereotaxic Surgery
NTS Virus Injections
Mice were anaesthetized with intramuscular medetomidine (1 mg/ kg) + ketamine hydrochloride (50 mg/kg) or 1.5–2.5% isoflurane, and given carprofen analgesia (5mg/kg, s.c.). Core temperature was maintained using a homeothermic monitoring system, and appropriate depth of surgical anaesthesia was determined by absence of pedal reflex. The skull was restrained in a stereotaxic frame, and the head flexed downwards such that the nose and neck were at a right angle. The scalp was incised from the occipital crest to first vertebrae, and muscle layers parted to expose the atlanto-occipital membrane. The membrane was bisected horizontally with a 30G needle to expose the brainstem surface with obex used as an anatomical landmark. Viral vectors (as detailed in figures and Methods Table 1) were injected via pulled glass micropipettes at the following coordinates from obex: +0.1mm rostral, ±0.5mm lateral and −0.35mm ventral. Viruses encoding chemogenetic effectors, diptheria toxin subunit A (DTA) and control reporters were all bilaterally injected in volumes of 200–250nl. Mice were allowed to recover for a minimum of 3 weeks before behavioural experiments began. For monosynaptic retrograde tracing from PPG neurons in the caudal NTS, 300nl of a 1:1 mix of AAV5-EF1a- FLEX-TVA:mCherry and AAV8/733-CAG-FLEX-RabiesG were bilaterally injected +0.1mm rostral, ±0.4mm lateral and 0.35mm ventral to obex. 21 days later, 400nl in total of (EnvA)-RABV-ΔG-GFP was unilaterally injected at two injection sites: +0.1mm rostral, +0.25mm lateral and 0.35–0.45mm ventral to obex; and +0.1mm rostral, +0.4mm lateral and 0.35–0.45mm ventral to obex. Mice were transcardially perfused for histological processing and in situ hybridisation 7 days later.
Table 1.
Reagents and Resources
| Antibodies & Viruses | ||
| α-DsRed rabbit pAb (1:500 IF) | Takara Bio | Cat #632496, RRID:AB_10013483 |
| α-mCherry rabbit pAb (1:500 IF) | Abcam | Cat# ab167453, RRID:AB_2571870 |
| α-GFP chicken pAb (1:1000 IF) | Abcam | Cat #13970, RRID:AB_300798 |
| α-cFos (9F6) rabbit mAb (1:1000 IF / 1:10,000 IHC) | Cell Signaling Technology | Cat# 2250, RRID:AB_2247211 |
| α-cFos rabbit pAb (1:500 IF) | Millipore | Cat# ABE457, RRID:AB_2631318 |
| α-tyrosine hydroxylase rabbit pAb (1:1000 IF) | Millipore | Cat# AB152, RRID:AB_390204 |
| α-rabbit IgG biotinylated goat pAb (1:500 IHC) | Vector Laboratories | Cat# BA-1000, RRID:AB_2313606 |
| Alexa Fluor 488 goat α-chicken (1:500 IF) | Thermo Fisher Scientific | Cat# A-11039, RRID:AB_2534096 |
| Alexa Fluor 488 goat α-rabbit (1:500 IF) | Thermo Fisher Scientific | Cat# A-11008, RRID:AB_143165 |
| Alexa Fluor 568 donkey α-rabbit (1:500 IF) | Thermo Fisher Scientific | Cat# A-10042, RRID:AB_2534017 |
| Alexa Flour 647 donkey α-rabbit (1:500 IF) | Thermo Fisher Scientific | Cat# A-31573, RRID:AB_2536183 |
| AAV8-EF1a-mCherry-DIO-DTA (3.3×10¹²) | UNC Vector Core, NC | Gift from Naoshige Uchida, RRID:Addgene_5853664 |
| AAV8-hSyn1-DIO-mCherry (9.0×10¹²) | Viral Vector Facility, ETH Zurich | Cat# v116–8, Gift from Bryan Roth, RRID:Addgene_50459 |
| AAV8-hSyn1-DIO-eGFP (6.3×10¹²) | Viral Vector Facility, ETH Zurich | Cat# v115–8, Gift from Bryan Roth, RRID:Addgene_50457 |
| AAV2-hSyn1-DIO-hM4Di:mCherry (6.4×10¹²) | UNC Vector Core, NC | Lot AV4500F |
| AAV8- hSyn1-DIO-hM3Dq:mCherry (4.5×10¹²) | Viral Vector Facility, ETH Zurich | Cat# v89–8, Gift from Bryan Roth, RRID:Addgene_4436165 |
| AAV5- hSyn1-DIO-hM3Dq:mCherry (≥7×10¹²) | Addgene Viral Service | Cat# 44361-AAV5, Gift from Bryan Roth, RRID:Addgene_4436165 |
| AAV9- hSyn1-DIO-hM3Dq:mCherry (≥7×10¹²) | Addgene Viral Service | Cat# 44361-AAV9, Gift from Bryan Roth, RRID:Addgene_4436165 |
| AAV5-EF1a-DIO-hChR2(H134R):mCherry (5.7×10¹²) | UNC Vector Core, NC | Gift from Karl Deisseroth, RRID:Addgene_20297 |
| AAV9-EF1a-DIO-hChR2(H134R):eYFP (≥1×10¹³) | Addgene Viral Service | Cat# 20298-AAV9, Gift from Karl Deisseroth, RRID:Addgene_20297 |
| AAV-PHP.S-CAG-DIO-tdTomato (≥1×10¹³) | Addgene Viral Service | Cat# 28306-PHP.S, Gift from Edward Boyden, RRID:Addgene_28306 |
| AAV5-EF1a-FLEX-TVA:mCherry (5.6×10⁸) | Stanford Gene Vector and Virus Core | Cat# GVC-AAV-67, Gift from Karl Deisseroth66 |
| AAV8/733-CAG-FLEX-RabiesG (2.13×10¹²) | Stanford Gene Vector and Virus Core | Cat# GVC-AAV-5966 |
| (EnvA)-RV-ΔG-GFP (2×10⁸) | Kevin Beier, UC Irvine | 67 |
| Drugs, Chemicals & Assays | ||
| Clozapine N-Oxide (CNO) | Hello Bio | Cat# HB1807 |
| Clozapine N-Oxide (CNO) | Enzo Life Sciences | Cat# BML-NS105 |
| Oxytocin | Tocris | Cat# 1910 |
| Liraglutide | Novo Nordisk A/S | Batch GP52108, Gift from Lotte Bjerre Knudsen |
| Semaglutide | Novo Nordisk A/S | Batch GV40057, Gift from Lotte Bjerre Knudsen |
| Ensure Plus (vanilla) | Abbott | Cat# ENS100V |
| Purified dustless precision pellets (20mg) | Bio-Serv | Cat# F0071 |
| Vectastain Elite ABC-Peroxidase Kit | Vector Laboratories | Cat# PK-7100, RRID:AB_2336827 |
| RNAscope Multiplex Fluorescent Kit v2 | Advanced Cell Diagnostics | Cat# 323100 |
| RNAscope target probe for mouse Glp1r | Advanced Cell Diagnostics | Cat# 418851-C2 |
| RNAscope target probe for mouse Oxtr | Advanced Cell Diagnostics | Cat# 402651-C3 |
| RNAscope positive control probe (mouse Ubc) | Advanced Cell Diagnostics | Cat# 310771-C2/3 |
| RNAscope negative control probe (mouse DapB) | Advanced Cell Diagnostics | Cat# 310043-C2/3 |
| Mice | ||
| mGlu-Cre/tdRFP (referred to here as PPG-Cre:tdRFP) | Frank Reimann, University of Cambridge53 | |
| mGlu-Cre/GCaMP3 (referred to here as PPG-Cre:GCaMP3) | Frank Reimann, University of Cambridge42 | |
| mGlu-YFP (referred to here as PPG-YFP) | Frank Reimann, University of Cambridge52 | |
| Glp1r-Cre/tdRFP (referred to here as GLP-1R-Cre:tdRFP) | Frank Reimann, University of Cambridge54 | |
| mGlu-YFP × Glp1r-Cre/tdRFP (referred to here as GLP-1R-Cre × PPG-YFP) | Strains from Frank Reimann crossed at UCL13 | |
Nodose Ganglia Virus Injections
Mice were anaesthetized with 1.5–2.5% isoflurane and given carprofen analgesia (5mg/kg, s.c.), then the ventral surface of the neck was incised, and muscles parted to expose the trachea. The vagus nerve was separated from the carotid artery to allow access to the nodose ganglia. In each nodose ganglia, a total volume of 500nl of viral vector (AAV5 / 9 -hSyn1-DIO-hM3Dq:mCherry, AAV5-EF1a-DIO-hChR2(H134R):mCherry, AAV9-EF1a-DIO-hChR2(H134R):eYFP, or AAV-PHP.S-CAG-DIO-tdTomato, as detailed in figures and resources table) was injected into sites rostral and caudal to the laryngeal nerve branch, using a bevelled tip pulled glass micropipette and pneumatic microinjector. Viruses encoding chemogenetic and optogenetic effectors were injected bilaterally, and the virus for tdTomato-visualized projection tracing was injected unilaterally into left or right nodose ganglia. Mice were allowed to recover for a minimum of 2 weeks before behavioural experiments or transcardial perfusion.
Viral Targeting Validation
We have previously histologically and functionally validated all viral targeting and neuronal manipulation strategies used in the present study. These include those for chemogenetic activation, inhibition, ablation, and input mapping of PPGNTS neurons7,18,29, and for chemogenetic and optogenetic activation of vagal afferent neurons55. The same validated mouse lines and viruses were used in the present studies, and additional confirmatory validations of viral transduction efficiency / specificity and the functional efficacy of manipulations were performed as detailed below. Post-mortem tissue sections were processed from all mice used in behavioural studies and verified for appropriate expression of fluorescent reporters. Mice in which viral injection targeting was inaccurate, or transduction efficiency below expected levels, were omitted from analyses (<10% of mice across all experiments). Our individual results are therefore unlikely to be confounded by type 1 errors arising from non-specific manipulations of neuronal populations other than those targeted, nor by type 2 errors arising from failing to detect effects of our manipulations due to specific but inefficient transduction of our target populations. Sample sizes were derived from prior experiments using the same or similar viral targeting and manipulation strategies, and crucially the overall study was designed to provide convergent lines of anatomical, functional and behavioural data, thereby minimising the risk of type 1 or 2 errors arising from conclusions based on a single line of evidence. The strength of this approach and reliability of strategies used is demonstrated by the internal consistency of the lines of evidence presented here, and their external consistency with prior findings our experiments have replicated and extended.
PPGNTS Neuron Targeting Validation
The efficiency and specificity of viral targeting of PPGNTS neurons was validated using the PPG-Cre:GCaMP3 mouse line, by quantifying co-localisation of GFP-immunoreactivity (in GCaMP3-expressing PPGNTS neurons) and mCherry expression following NTS injection of AAV encoding hM3Dq-mCherry (Extended Data 8e–g). We have previously demonstrated that neither hM3Dq nor hM4Di chemogenetic effectors have constitutive activity in PPGs, and that the DREADD ligand CNO does not affect feeding behaviours in our hands at the doses used here. We have also confirmed the respective excitatory and inhibitory actions of these effectors on PPGNTS neurons using ex vivo patch-clamp electrophysiology and Ca2+ imaging7. Further functional validation of PPGNTS neuron activation was conducted by quantification of cFos expression in these neurons following administration of CNO to mice transduced with AAV encoding hM3Dq (Extended Data 2c–e). Specifically, PPG-Cre:tdRFP mice were bilaterally in injected in the NTS with AAV8-DIO-hM3Dq-mCherry and allowed to recover for ≥3 weeks as per standard surgical protocol for NTS viral injection. They were habituated to handling and the standard ad libitum eating protocol in which they were fasted for 3 hours and administered saline/CNO 30 mins prior to dark onset. On the test day, mice were administered saline (n=4) or 2 mg/kg CNO (n=3) and transcardially perfused 3 hours later. Tissue was subsequently processed for cFos immunofluorescence as detailed in Immunohistochemistry & In Situ Hybridization.
Glp1r Vagal Afferent Neuron Targeting Validation
The efficiency and specificity of viral targeting of Glp1r VANs was validated using the GLP-1R-Cre:tdRFP mouse line by quantifying co-localisation of RFP-immunoreactivity (in tdRFP-expressing GLP-1R vagal afferent neurons) and eYFP expression, following nodose ganglia injection of AAV encoding ChR2-eYFP (Extended Data 3g–i). cFos expression in nodose ganglia is not a reliable marker of vagal afferent neuron activation, but vagal stimulation robustly induces cFos expression in downstream NTS neurons28,55. We therefore functionally validated our strategies for chemogenetic and optogenetic activation of Glp1r VANs by quantification of cFos expression in the NTS. Specifically, GLP-1R-Cre:tdRFP × PPG-YFP mice were injected bilaterally in nodose ganglia with either AAV9-DIO-hM3Dq-mCherry, AAV9-DIO-ChR2-eYFP or control injections (dye or control virus) as per standard surgical protocol for viral transduction of vagal afferent neurons. For validation of optogenetic activation, mice were fasted for 2 hours then anesthetized with isoflurane, nodose ganglia were surgically exposed and bilaterally stimulated with blue light from a laser fib (10mW for 1 minute). Mice were euthanized by isoflurane overdose and transcardially perfused 90 minutes later. For validation of chemogenetic activation, mice were injected with saline or 2 mg/kg CNO then euthanized by isoflurane overdose and transcardially perfused 90 minutes later. Tissue from both experiments were processed for cFos immunofluorescence as detailed in Immunohistochemistry & In Situ Hybridization.
Optical Fibre Implantation
Optical fibres were implanted two weeks after bilateral injection of AAV5-EF1a-DIO-hChR2(H134R)-mCherry in nodose ganglia. Optical fibres (CFLC230–10 ceramic ferrules with FT200UMT fibre, Thorlabs) were unilaterally implanted above the right caudal NTS, 7.5mm caudal, 0.25mm lateral and 4.0mm ventral to Bregma. Skull screws, superglue and dental cement were used to secure the fibre, and mice were allowed to recover for an additional 2 weeks prior to behavioural testing.
Behavioural Studies
Drug Administration
Clozapine N-oxide (CNO; Hello Bio / Enzo) was administered intraperitoneally at 2 mg/kg in 2 ml/kg dose volume for all experiments, typically 15 minutes prior to dark onset. We have previous determined that in our hands CNO at this dose does not affect eating behaviours in control virus transduced mice, and similarly that the chemogenetic effectors used do not have any constitutive activity which affects eating behaviours7,55. To minimize animal use and maximize statistical power, all chemogenetic experiments in the present study were therefore conducted in DREADD-expressing mice using a within-subjects design. All mice received both CNO and saline vehicle in a counterbalanced manner, and hence acted as their own controls. Similarly, when assessing the effect of PPGNTS neuron ablation on the anorexigenic actions of oxytocin, liraglutide and semaglutide, we used a mixed model design, whereby mice in DTA-ablated and control cohorts all received drug and vehicle in a counterbalanced manner. Oxytocin (Tocris) was administered intraperitoneally 15 minutes prior to dark onset at 0.4 mg/kg, based on reports that this dose and route of administration elicits vagal-dependent eating suppression in mice44,45. Liraglutide and semaglutide (gift from Lotte Bjerre Knudsen, Novo Nordisk) were administered subcutaneously 30 minutes prior to dark onset at 0.2 mg/kg and 0.06 mg/kg, respectively, in 5 ml/kg dose volume, based on recommendations from LBJ and previous reports of the anorexigenic effects of these drugs in mice19,20,56.
Eating Behaviour Paradigms
Drug- or neuronal manipulation-induced changes to eating behaviour were assessed from dark onset in ad libitum eating or fasted mice. In the ad libitum eating paradigm, mice were habituated (≥5 sessions) to being fasted for the final 3 hours of the light phase and receiving saline/vehicle injections 5–30 mins prior to return of food at dark onset. This protocol minimized hypophagia from handling and injection stress, and entrained mice to eat consistently from dark onset, without needing to induce negative energy balance. All experiments using either manual or automated measurement of food intake used this protocol for assessment of ad libitum eating, except for metabolic phenotyping of PPGNTS ablated mice experiment, in which mice were not handled or injected and were already habituated to test cages. To assess the effect of chemogenetic manipulations on the behavioural satiety sequence, and large meals driven by refeeding after a prolonged fast, mice were fasted for 18 hours prior to dark onset. To assess the effect of optogenetic activation of Glp1r-expressing vagal afferent neurons on acute feeding, mice were fasted for the entire light phase and intake measured during the first 30 minutes of the dark phase. The effect of optogenetic activation was also assessed using a within-subjects design, with all mice tested for 30 minute intake under ‘laser on’ (20ms blue light pulse every 3 seconds, ~5mW intensity) and ‘laser off’ (tethered but no light pulses) conditions in a counterbalanced manner.
Food Intake Measurement
Food intake was measured manually, using open source FED pellet dispensers (Feeding Experimentation Device; Nguyen et al., 2016), or using commercially-available Phenomaster (TSE Systems) or Promethion (Sable Systems) systems. For manual measurement of intake in the ad libitum eating paradigm, mice were weighed at the start of the 3 hour fast, then a pre-weighed amount of food was returned at dark onset. Food was again weighed at 1, 2, 4, 6 (GLP-1RA experiments only), and 21 hours, at which point 24 hour bodyweight change was also determined. FED dispensers were used for all experiments involving chemogenetic manipulations of PPGNTS neurons, the Phenomaster system for chemogenetic activation of Glp1r-expressing vagal afferent neurons, and the Promethion system for metabolic phenotyping of PPGNTS ablated mice. For all food intake measurement systems and eating behaviour paradigms, mice were habituated to the test equipment and all aspects of the paradigm (including vehicle dosing where appropriate) prior to the start of testing. Mice were considered habituated after their intakes during ≥3 consecutive habituation sessions were not significantly different, and no directional trend was apparent. Meal pattern analysis was conducted on automated food intake data from experiments testing the effect of inhibition or ablation of PPGNTS neurons. A meal was defined as the sum of all bouts ≥0.02g with intra-meal intervals <10 minutes, based on the standard operating procedure of the UC Davis Mouse Metabolic Phenotyping Centre57. Food intake and metabolic data were collected from the TSE Phenomaster system using the Phenomaster software package, and from the Sable Promethion system using ExpeData and MacroInterpreter software packages. Consumption of Ensure liquid diet was measured manually, and the temporal pattern of Ensure drinking was measured by offline video coding of licking duration (blinded to drug treatment), using the BORIS open source video coding software package58.
Behavioural Satiety Sequence Analysis
Alterations to the behavioural satiety sequence (BSS) following chemogenetic activation of PPGNTS neurons were determined using the continuous monitoring BSS protocol59,60, adapted for use with mice and FED dispensers. Mice were fasted for 18 hours, FED dispensers were returned to home cages at dark onset, and behaviour recorded for 40 minutes using infrared video cameras. Behaviours were subsequently coded offline using BORIS software by trained observers (Cohen’s κ for inter-rater reliability >0.9) blinded to treatment group. Behaviours were coded as mutually-exclusive categories: eating, drinking, grooming (including scratching), inactive (resting and sleeping) and active (locomotion and rearing). In pilot experiments, the duration of water drinking was found to be extremely low and unaffected by our manipulations, hence was omitted from further analyses. The total duration mice spent exhibiting behaviours in the remaining 4 categories were calculated for 8 × 5 minute time bins. For qualitative and semi-quantitative evaluation of the stochastic sequence of satiety behaviours (eating → grooming → inactive), the mean durations of these 3 categories were plotted across all time bins separately for saline control and CNO activated conditions. To aid visualization of neuronal activation-induced acceleration of the sequence, horizontal dotted lines were added denoting the time bin during which the (probabilistic) transition from feeding to resting occurs, which is typically considered the satiation point / onset of satiety. Data were also presented and analysed to quantitatively test the effect of chemogenetic activation over time in each behaviour category.
Indirect Calorimetry
We measured respiratory exchange ratio and energy expenditure concurrently with food intake from PPGNTS ablated and Glp1rNodose-hM3Dq mice, using the indirect calorimetry functionality integrated into the Phenomaster and Promethion systems. Mice were habituated to test cages for ≥3 days before testing, and metabolic data were collected for 24 hours for between-subjects analysis (PPGNTS-DTA ablated vs PPGNTS-mCherry controls), or during two 24 hour test sessions (Glp1rNodose-hM3Dq, counterbalanced for CNO administration), separated by ≥48 hour washout periods during which mice remained in test cages. Respiratory exchange ratio (RER) was obtained from measurement of mice’s O2 consumption (ml/kg/hr) and CO2 production (ml/kg/hr), using the equation: RER = VCO2 / VO2. Energy expenditure (EE) was calculated using the Weir equation: EE = 3.941 × VO2 + 1.106 × VCO2. Raw data from both systems were used to generate standardized output files, which were imported into the CalR analysis tool61 for production and analysis of intake and metabolic data over light and dark phases and total circadian cycle. As now recommended for analysis of calorimetry data from these systems, energy expenditure was not normalized to bodyweight.
Conditioned Flavour Preference
Whether optogenetic activation of Glp1r vagal afferent neurons conditioned a preference for (or avoidance of) a flavour was assessed using a previously-validated protocol55. Experiments were conducted within sound-attenuated cubicles, using behavioural chambers equipped with two sipper tubes connected to contact-based licking detection devices, allowing high resolution measurement of licking responses (Med-PC V / Med Associates Inc.). Following recovery from surgeries for nodose ganglia virus injection and optical fibre implantation, individually-housed mice were placed on a food and water restriction regime, under which they were maintained at 90% of starting bodyweight and were limited to 6 hours of water access per day. Mice were habituated to behavioural chambers (including being tethered to fibre cables) and trained to lick for a 0.025% saccharin solution during daily 1 hour habituation sessions, conducted during the light phase. Mice were considered trained to saccharin licking once they showed <10% between-session variability in the number of licks, a criterion all mice reached within 10 sessions.
Once trained, a ‘pre’-test was conducted in which mice were given access to two novel Kool-Aid flavours (cherry or grape, both 0.05% in 0.025% saccharin solution) for 10 minutes, with sipper bottle positions switched after 5 minutes to avoid position bias. Mice then underwent 3 × 1 hour training sessions for each flavour (alternately over 6 days), in which both bottles contained the same flavour. One flavour was paired with laser stimulation (CS+), such that licking triggered blue light laser stimulation via a TTL output signal. Specifically, 10 licks triggered a 20ms light pulse of ~5mW intensity, with additional licks during the following 10 seconds having no programmed consequences. Further bouts of ≥10 licks triggered additional pulses in the same manner throughout the 1 hour session. During training sessions with the unpaired (CS-) flavour, mice were tethered but licking did not elicit laser stimulation. Upon completion of these training sessions, mice underwent a ‘post’-test identical to the ‘pre’-test, i.e. both flavours were available, and licking did not elicit laser stimulation. The number of licks for the laser-paired flavour during ‘pre’ and ‘post’ tests was used to calculate preference ratios (CS+ licks / total licks) for the flavour before and after training, to determine if optogenetic stimulation of Glp1r vagal afferent neurons increased or decreased preference for the paired flavour.
Immunohistochemistry & In Situ Hybridization
Tissue Preparation
Mice were deeply anaesthetized then transcardially perfused with ice-cold PB/PBS (0.1M, pH 7.2) then 4% formaldehyde in PB/PBS. Brains and NG (when required) were extracted and post-fixed in 4% formaldehyde at 4°C overnight (≤2 hours for NG), before being cryoprotected in 20–30% sucrose solution for ≥24 hours at 4°C. Brains were sectioned into 30–35μm coronal sections, collected free-floating and stored at 4°C until processing for immunofluorescent labelling as detailed below. NG were sectioned into 10μm sections, collected on Superfrost Plus microscope slides and stored at −20°C until processing for in situ hybridization as detailed below.
Immunofluorescent labelling
Brain sections were processed for amplification of fluorescent reporter signals by immunofluorescent labelling of tdRFP, mCherry, eYFP, eGFP and/or GCaMP3 using previously-validated protocols7. For all fluorescent protein antigens, sections were incubated free-floating with primary antibodies (see Methods Table 1 for antibody details) overnight at 4°C in PBS with 2% normal goat/donkey serum and 1% BSA, followed by 2 hours at room temperature with secondary antibodies conjugated to fluorophores appropriate for the native fluorescent reporter being amplified (i.e. Alexa Fluor 488 for eYFP/eGFP/GCaMP3 and Alexa Fluor 568 for tdRFP/mCherry; all 1:500).
RNAscope In situ Hybridization (Nodose Ganglia)
Sections from nodose ganglia of mice previously injected with viruses for monosynaptic retrograde rabies tracing were processed for in situ hybridization of Glp1r and Oxtr mRNA using a previously-optimised modification of the RNAscope assay62. Sections were cut at 10μm on a cryostat and collected on Superfrost Plus slides, then allowed air-dry at room temperature for one hour. Slides were then dipped in molecular grade ethanol and further air-dried overnight at room-temperature. RNAscope in situ hybridization was performed on these sections using the RNAscope Multiplex Fluorescent Kit v2 (Advanced Cell Diagnostics) as per the manufacturer’s instructions, with a modification to the pre-treatment procedure (Protease IV incubation conducted for 20 min at room temperature) that allows for preservation of the fluorescent reporter signal while also providing optimal signal from the target mRNAs. Probes for Glp1r, Oxtr and appropriate positive (Ubc) and negative (DapB) controls (detailed in Methods Table 1) were hybridized and after completion of the procedure slides were immediately cover slipped using Prolong Antifade medium.
RNAscope In situ Hybridization (Brainstem)
Brainstem sections containing the area postrema were pre-treated with hydrogen peroxide for 30 minutes at room temperature, slide-mounted in dH2O and air dried overnight. Sections were subsequently processed for in situ hybridization of Glp1r mRNA using the same reagents and protocol as nodose ganglia sections, followed by additional processing for immunofluorescent labelling of GFP and tyrosine hydroxylase (TH). Incubation with primary antibodies against GFP and TH (see Methods Table 1 for antibody details; both 1:1000) was performed concurrently overnight at room temperature, with the remaining protocol conducted as described above for labelling of fluorescent reporters. Sections were then dehydrated in increasing concentrations of ethanol, cleared in xylene and cover slipped using Cytoseal 60.
cFos Immunohistochemistry and Quantification
For immunohistochemical validation of chemogenetic PPGNTS neuron activation, brains from PPGNTS-hM3Dq mice were processed for immunofluorescent labelling of cFos. For validation of chemogenetic and optogenetic activation of Gl1pr VANs, 35μm free-floating sections were incubated overnight with anti-cFos rabbit primary antibody (#2250, Cell Signalling Technology; 1:1000) followed by 2 hours in donkey anti-rabbit Alexa-Flour 647 secondary antibody (1:500). For quantification of semaglutide-induced cFos expression, mice expressing eYFP in PPG neurons were habituated to handling and the standard ad libitum eating behaviour paradigm, including vehicle injection 30 minutes prior to dark onset. Food intake was manually quantified after 3 hours during habituation sessions and on the day semaglutide was administered, allowing a within-subjects quality control for the effect of semaglutide in this experiment. On the test day, mice were injected with vehicle or semaglutide (0.06 mg/kg as per behavioural studies) and transcardially perfused 4 hours later. Coronal brain sections were prepared as above, then processed for immunoperoxidase labelling of cFos with DAB-Ni followed by immunofluorescent amplification of eYFP using a previously-optimised protocol29. Free-floating sections were first pre-treated with sodium borohydride solution (0.5% w/v; 20 mins at room temperature) followed by hydrogen peroxide (0.15% v/v; 15 mins at room temperature) then incubated with anti-cFos rabbit primary antibody (#2250, Cell Signalling Technology; 1:10,000) overnight at room temperature. The following day, sections were incubated for 1 hour with biotinylated donkey α-rabbit antibody (1:500), followed by 2 hours with AB solution (ABC Peroxidase Kit, Vectastain). Sections were incubated with 2 changes of sodium acetate solution (0.1M, 5 mins) then with DAB-Ni in sodium acetate solution for 10 mins, before addition of hydrogen peroxide to allow a chromogenic reaction for ~5 minutes. Sections were subsequently processed for immunofluorescent labelling of eYFP as described above, dehydrated in increasing concentrations of ethanol, cleared in xylene, and cover slipped using Cytoseal 60.
Imaging
Brain sections labelled for fluorescent reporters and/or cFos expression were imaged using an upright epifluorescence and brightfield microscope (Leica) with a Retiga 3000 CCD camera (QImaging). For co-localization of DAB-Ni labelled cFos and PPG-eYFP neurons, brightfield and fluorescence images were sequentially captured in the same focal plane. Quantification of cFos expression and co-localization was conducted using merged native brightfield (DAB) and fluorescent (PPG-eYFP) images. For clarity of presentation, brightfield DAB images were inverted and pseudocolored prior to merging with fluorescent channels. Nodose ganglia and brainstem sections processed for in situ hybridization and/or fluorescent reporters were imaged with a Keyence BZ-x700 at 20x or 40x in 0.6μm optical sections, or a Leica TCS SP8 confocal microscope at 20x. For imaging of sections processed for in situ hybridization, sections hybridized with positive and negative control probes were used to determine exposure time and image processing parameters necessary for optimal visualization of mRNA signals and control for possible degradation. Generation of montages from individual images, brightness and contrast adjustment, and quantification of cFos expression using the Cell Counter plugin were all performed using Fiji open source biological image analysis software63.
Brain Slice Ca2+ Imaging
Imaging Data Capture
Coronal brainstem slices (200μm) were obtained from PPG-Cre:GCaMP3 mice and used to assess the effects of bath-applied oxytocin on PPGNTS neuron calcium dynamics using a previously-optimised protocol43. Oxytocin was dissolved in aCSF (3mM KCl, 118mM NaCl, 25mM NaHCO3, 5mM glucose, 1mM MgCl2, 2mM CaCl2; pH 7.4) to give a bath concentration of 100nM, based on reports that this concentration elicits robust activation of vagal afferent neurons under ex vivo conditions44. Slices were superfused with aCSF for ≥10 minutes, with the final 5 minute period prior to oxytocin application used to determine baseline fluorescence intensity. Slices were then superfused with oxytocin solution for 3–5 minutes, washed with aCSF for ≥10 minutes, then finally superfused with 100μM glutamate for 1 minute as a positive control to confirm imaged neurons were healthy and responsive to glutamatergic input. GCaMP3 fluorescence was excited at 460 ± 25 nm using an LED light source, for 250ms every 5 seconds. Imaging was conducted using a widefield microscope (Zeiss) with 40x water immersion lens and captured at 12-bit on a CCD camera (QClick, QImaging). Data were obtained from 8 experiments (i.e. recordings from single slices) from 3 mice.
Imaging Data Analysis
Time-lapse image recordings were imported into FIJI software, with the StackReg plugin used to correct for XY drift. Regions of interest (ROIs) were manually drawn around all PPGNTS somata in the field of view, with additional ROIs used to determine background intensity for each experiment. Background intensity was subtracted from ROIs and a cubic polynomial function was used to adjust for bleaching. Data are presented as ΔF/F0, where F0 is the mean fluorescence intensity over the 5 minute baseline period, and ΔF is the intensity at each timepoint with F0 subtracted. Response magnitudes were determined using the area under the curve (AUC) over 4 minutes from first application of oxytocin. To ensure artifactual fluctuations were not included in analyses, only fluorescence changes for which the magnitude was greater (or less) than 3 standard deviations of the baseline period AUC were considered to be ‘responders’. As the noise level (i.e. variability in baseline AUC) differs between slice recordings, this threshold is not absolute, hence there is some degree of overlap between the AUC of ‘non-responsive’ ROIs from noisier recordings and ‘responsive’ ROIs from less noisy recordings. As a further quality control, oxytocin-responsive ROIs were only included for analysis if they subsequently were responsive to glutamate.
Quantification and statistical methods
Data are presented as mean ± SEM, and were analysed for statistical significance as detailed in figure legends using Student’s t-test, one-way within-subjects or two-way within-subjects/mixed-model ANOVA (with the Greenhouse-Geisser correction applied where appropriate). Where data were not normally distributed, non-parametric equivalents were used as detailed. Significant one-way ANOVA tests were followed by pairwise comparisons with Tukey’s correction for multiple comparisons. For two-way ANOVA, either simple main effects were reported, or significant interactions were reported and followed by pairwise comparisons with Sidak’s correction for multiple comparisons. The threshold for statistical significance was considered <0.05, and significant comparisons are reported in all figures as: * p<0.05, ** p<0.01, *** p<0.001, **** p<0.0001. For transparency, all comparisons in which p<0.1 (but ≥0.05) are additionally reported with exact p values shown. Statistical analyses were conducted using Microsoft Excel, GraphPad Prism or IBM SPSS Statistics.
Data availability
There are no publicly available datasets for this manuscript. All data necessary to interpret, replicate and build on the methods or findings reported here are contained within the manuscript and extended data figures. Primary data from ex vivo calcium recordings, food intake, metabolic and behavioural analyses, videos for behavioural satiety sequence coding, and photomicrographs for ISH and IHC analyses are available in native format upon request from the corresponding authors. Access to stored tissue samples used for ISH and IHC is available upon request from the corresponding authors. All mouse lines, plasmids and reagents used in this study have been previously published and/or are commercially available, and are detailed in the Reporting Summary. Further information and requests for resources and reagents should be directed to and will be fulfilled by Prof. Stefan Trapp (s.trapp@ucl.ac.uk).
Extended Data
Extended Data Fig. 1. PPGNTS neurons selectively encode large meal satiation.
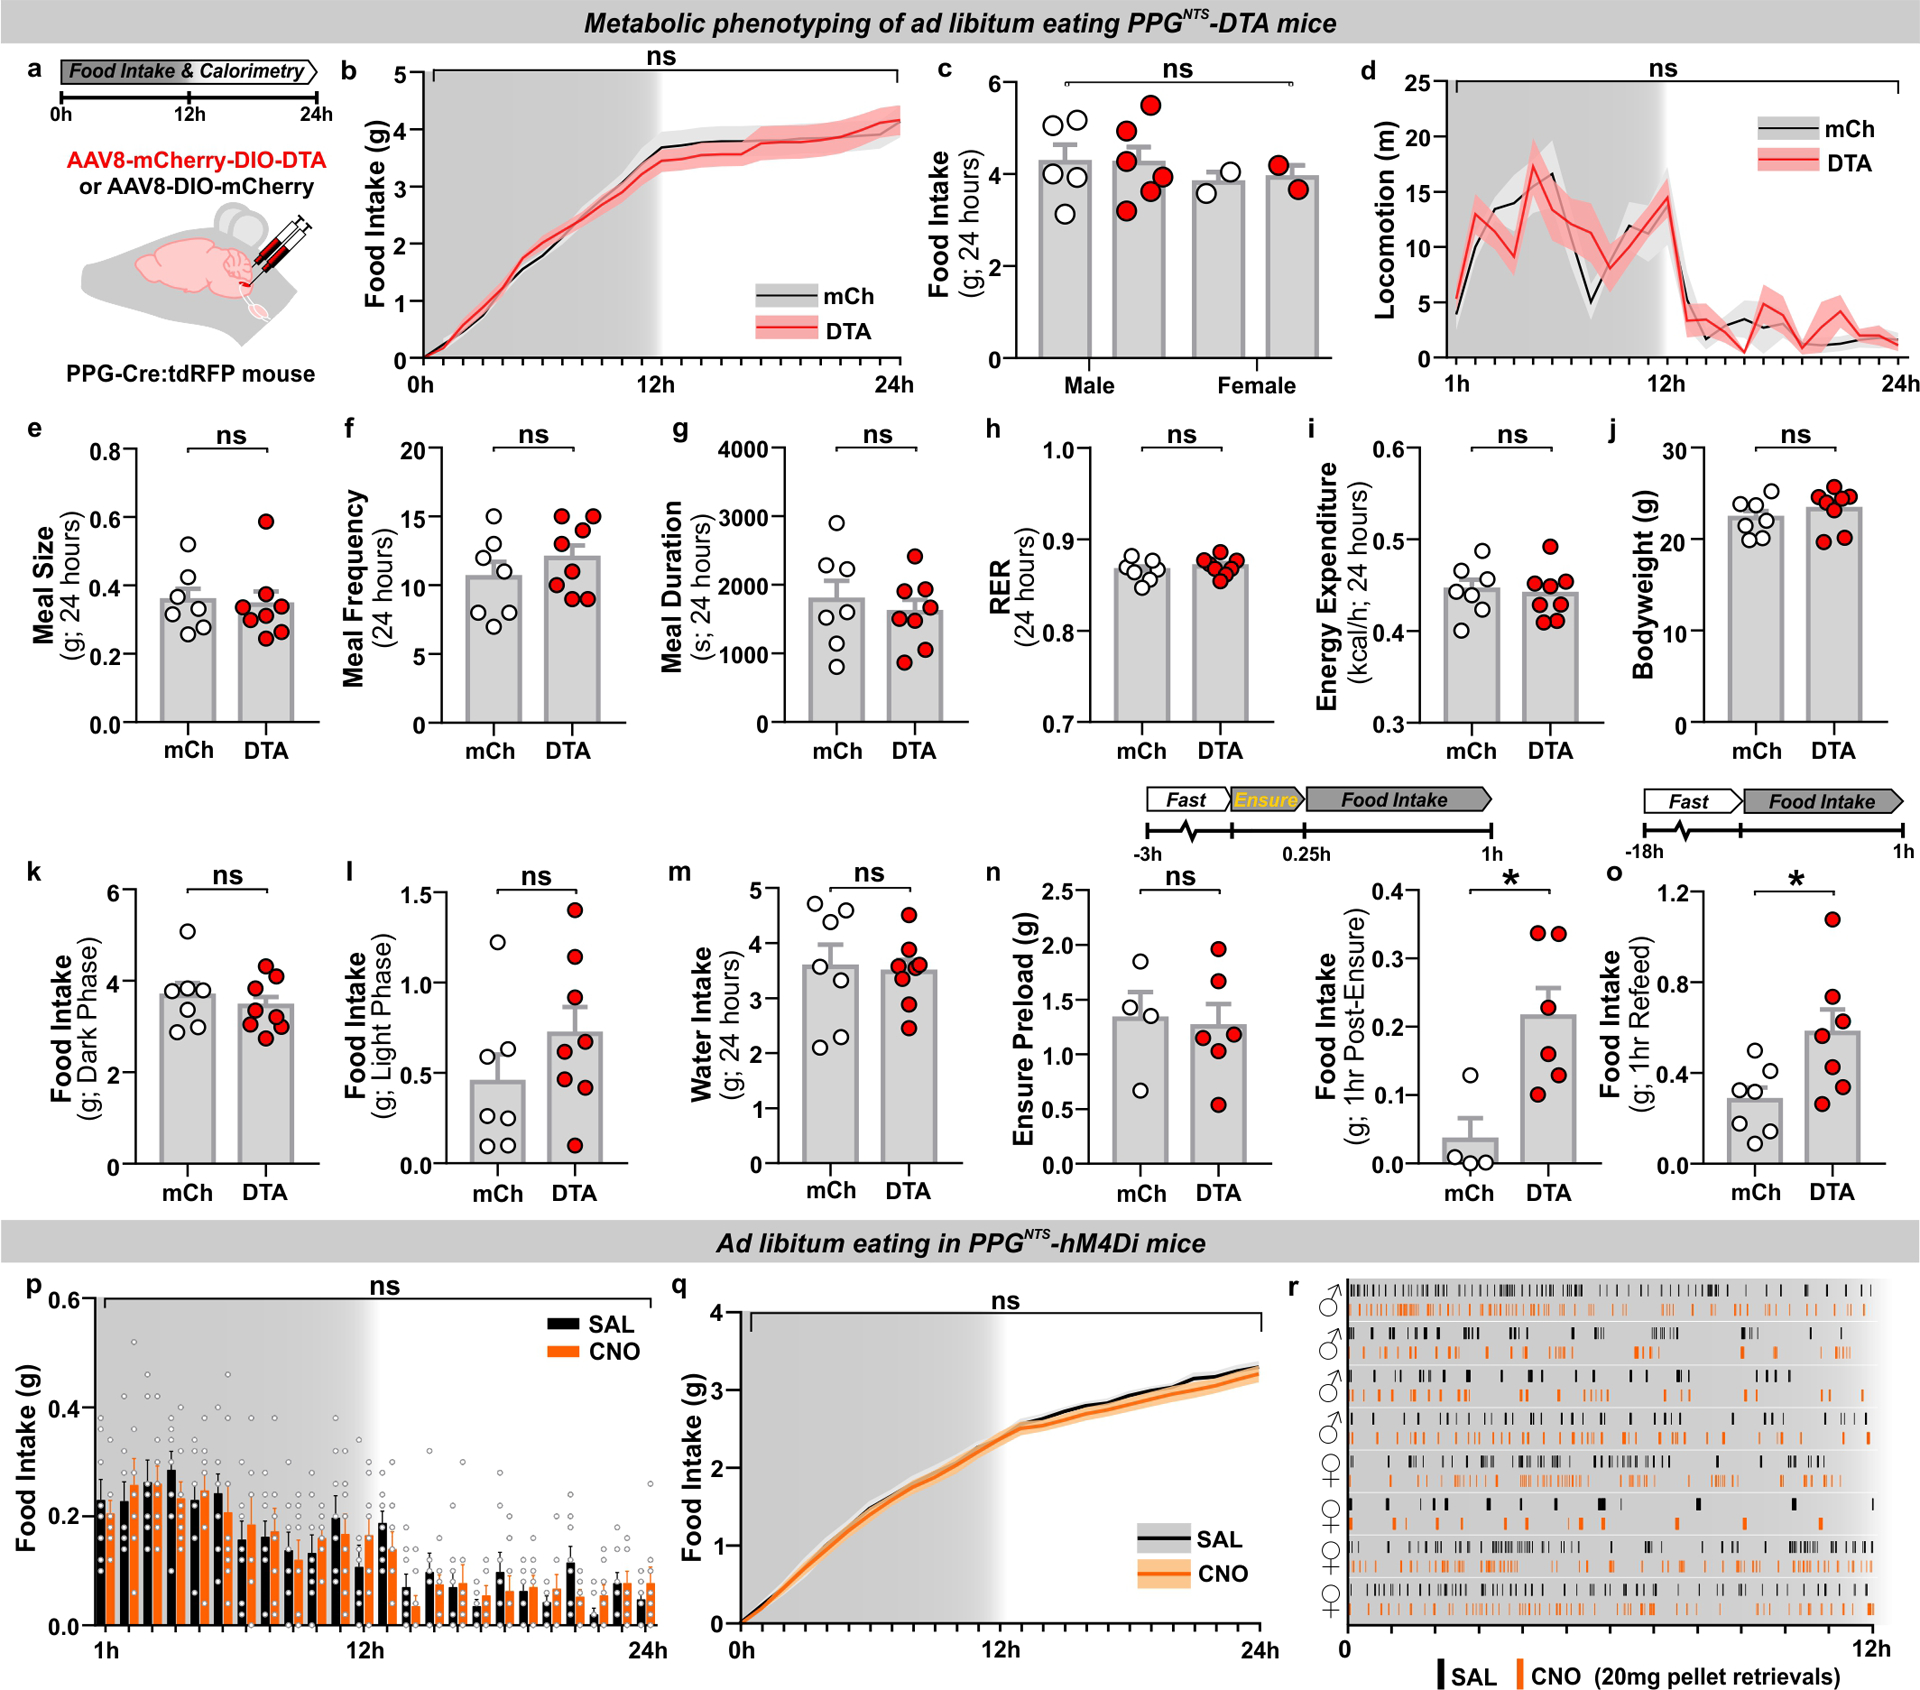
(a) Experimental model and paradigm for metabolic phenotyping of PPGNTS-DTA mice (DTA, n=8) or mCherry-transduced controls (mCh, n=7). n=8 (DTA) / 7 (mCh) animals for analyses presented in b-o.
(b) Cumulative hourly food intake over 1 day, 2-way mixed-model ANOVA: Virus F(1,13)=0.015, p=0.904.
(c) Daily food intake by sex, 2-way mixed-model ANOVA: Virus F(1,11)=0.012, p=0.914; Sex F(1,11)=0.683, p=0.426.
(d) Directed ambulatory locomotion (excluding fine movements) over 1 day, 2-way mixed-model ANOVA: Virus F(1,11)=0.493, p=0.497.
(e-i) Meal pattern and metabolic parameters over 1 day, unpaired 2-tailed t-test or Mann-Whitney U test: e) U=25, p=0.779; f) t(13)=0.997, p=0.337; g) t(13)=0.565, p=0.582; h) t(13)=0.797, p=0.440; i) t(13)=0.323, p=0.752.
(j) Mean bodyweight over the 24h test period, unpaired 2-tailed t-test: t(13)=0.883, p=0.393.
(k-l) Food intake during dark and light phases, unpaired 2-tailed t-test: k) t(13)=0.668, p=0.516; l) t(13)=1.251, p=0.233.
(m) 24h water intake, unpaired 2-tailed t-test: t(13)=0.205, p=0.841.
(n) Ensure liquid diet preload intake, unpaired 2-tailed t-test: t(8)=0.219, p=0.832; and post-Ensure chow intake, Mann-Whitney U test: U=2, p=0.038.
(o) Post-fast refeed intake, unpaired 2-tailed t-test: t(12)=2.501, p=0.028.
(p-q) Hourly and cumulative intakes over 1 day from ad libitum eating PPGNTS-hM4Di mice (n=8 animals), 2-way within-subjects ANOVA: p) Drug F(1,7)=0.241, p=0.639; q) Drug F(1,7)=0.411, p=0.542.
(r) Raster plot of chow pellet retrievals during the dark phase. Plots from the same mouse after saline and CNO injections presented adjacently.
All data presented as mean ± SEM.
Extended Data Fig. 2. PPGNTS neurons suppress eating without behavioural disruption.
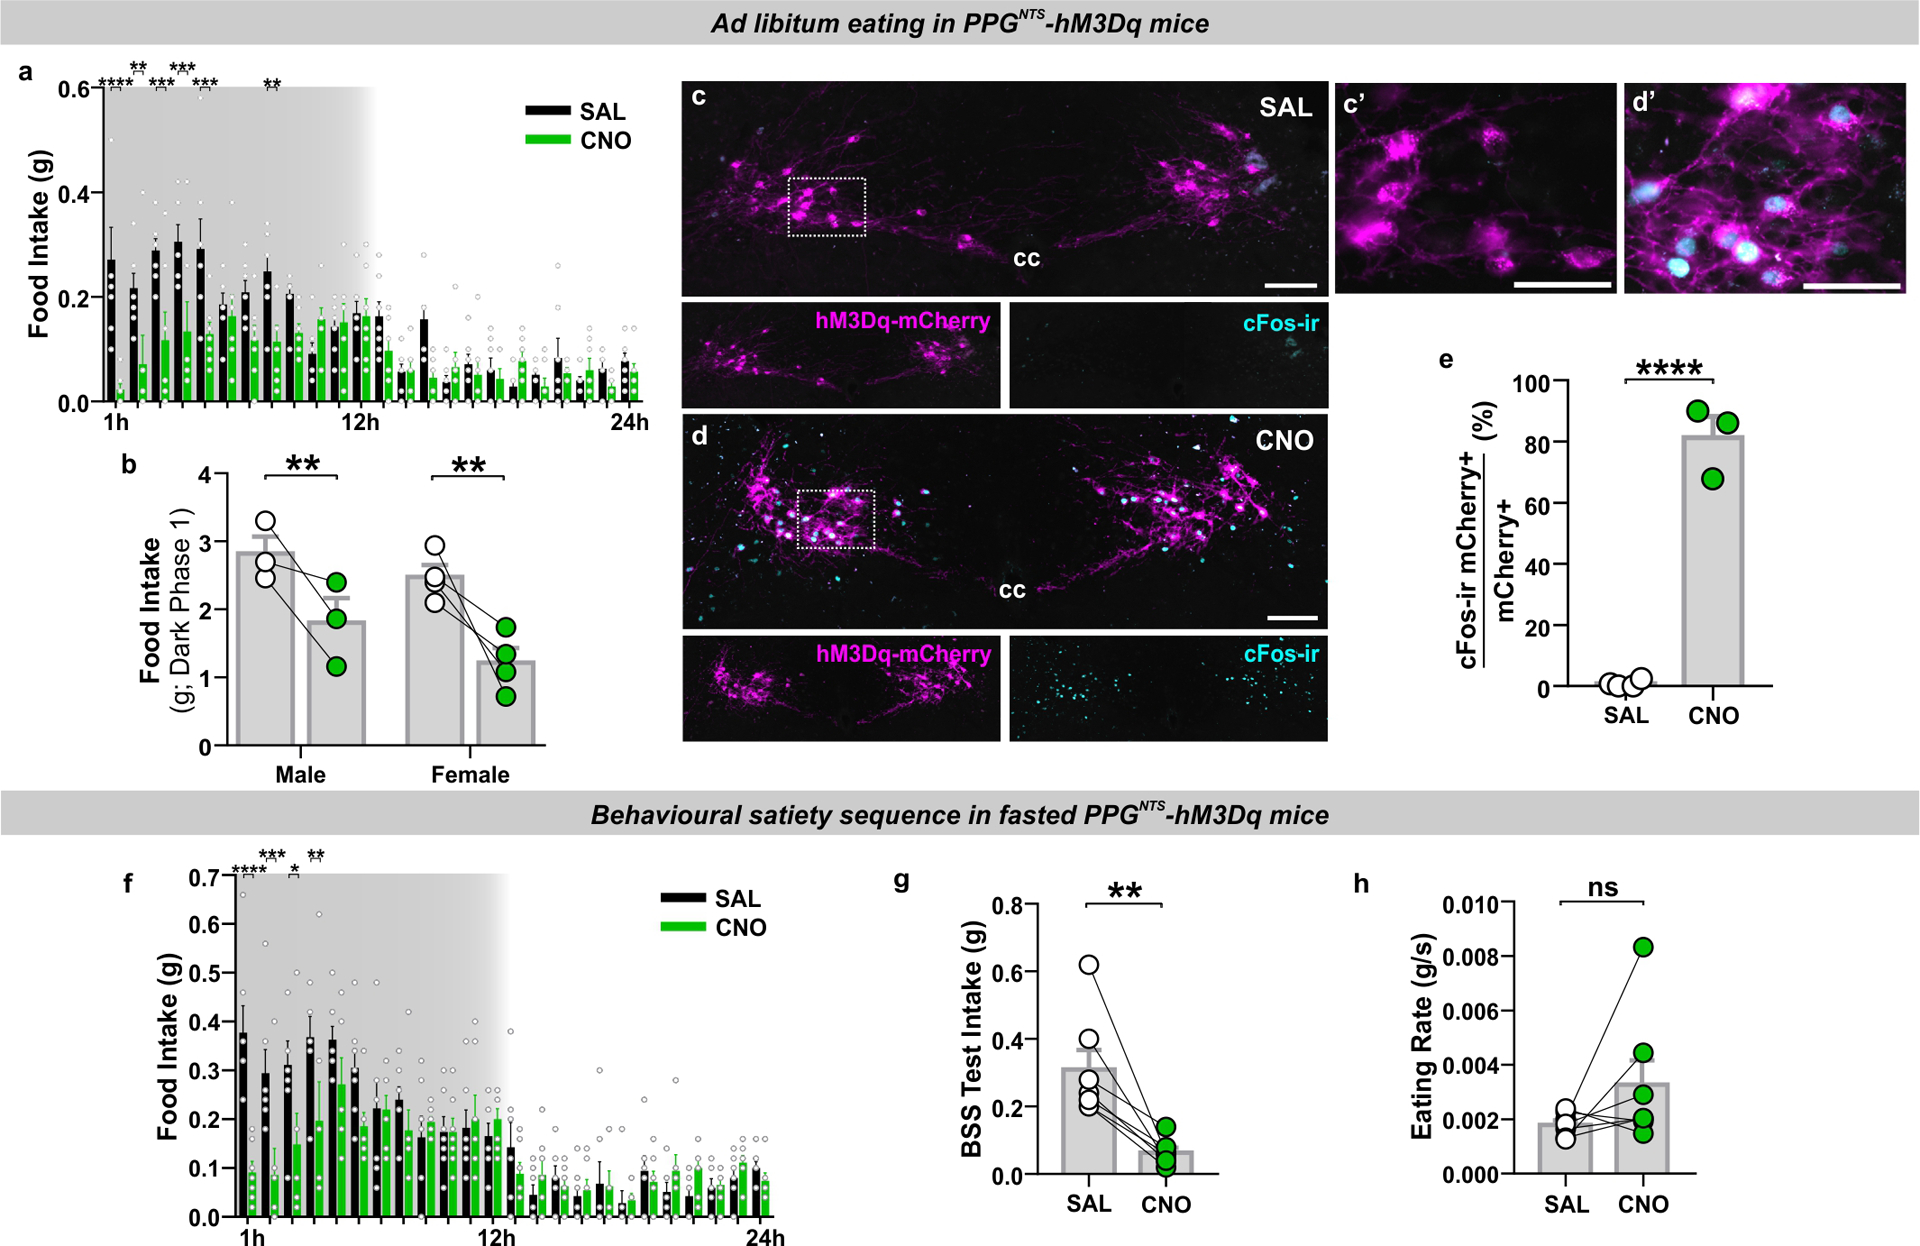
(a) Non-cumulative hourly food intake over the circadian cycle from ad libitum eating PPGNTS-hM3Dq mice (n=7 animals for analyses presented in a-b), 2-way within-subjects ANOVA: Drug × Time F(23,138)=4.599, p<0.0001.
(b) Dark phase food intake by sex, 2-way mixed-model ANOVA: Drug F(1,5)=19.97, p=0.0066; Sex F(1,5)=3.854, p=0.107.
(c-d) Photomicrographs of co-localised cFos immunoreactivity and DIO-hM3Dq-mCherry in NTS of PPG-Cre:tdRFP mice perfused 3 hours after injection of saline or CNO (photomicrographs representative of independent experiments from 4/3 animals), cc: central canal. Scale=100μm (inset 50μm).
(e) Proportion of mCherry-expressing neurons co-localised with cFos-ir in mice perfused after administration of saline or CNO (n=4 (SAL) / 3 (CNO) animals), unpaired 1-tailed t-test: t(5)=13.94, p<0.0001.
(f) Non-cumulative hourly food intake over 1 day from 18h fasted PPGNTS-hM3Dq mice (n=7 animals for analyses presented in f-h), 2-way within-subjects ANOVA: Drug × Time F(23,138)=3.745, p<0.0001. The behavioural satiety sequence (BSS) was analysed during the first 40 minutes of the dark phase.
(g-h) Food intake and eating rate over 40 minute BSS test, paired 2-tailed t-test and Wilcoxon matched pairs test: g) t(6)=4.088, p=0.0064; h) W=18, p=0.156.
All data presented as mean ± SEM.
Extended Data Fig. 3. Glp1r-expressing VANs suppress eating and condition flavour avoidance.
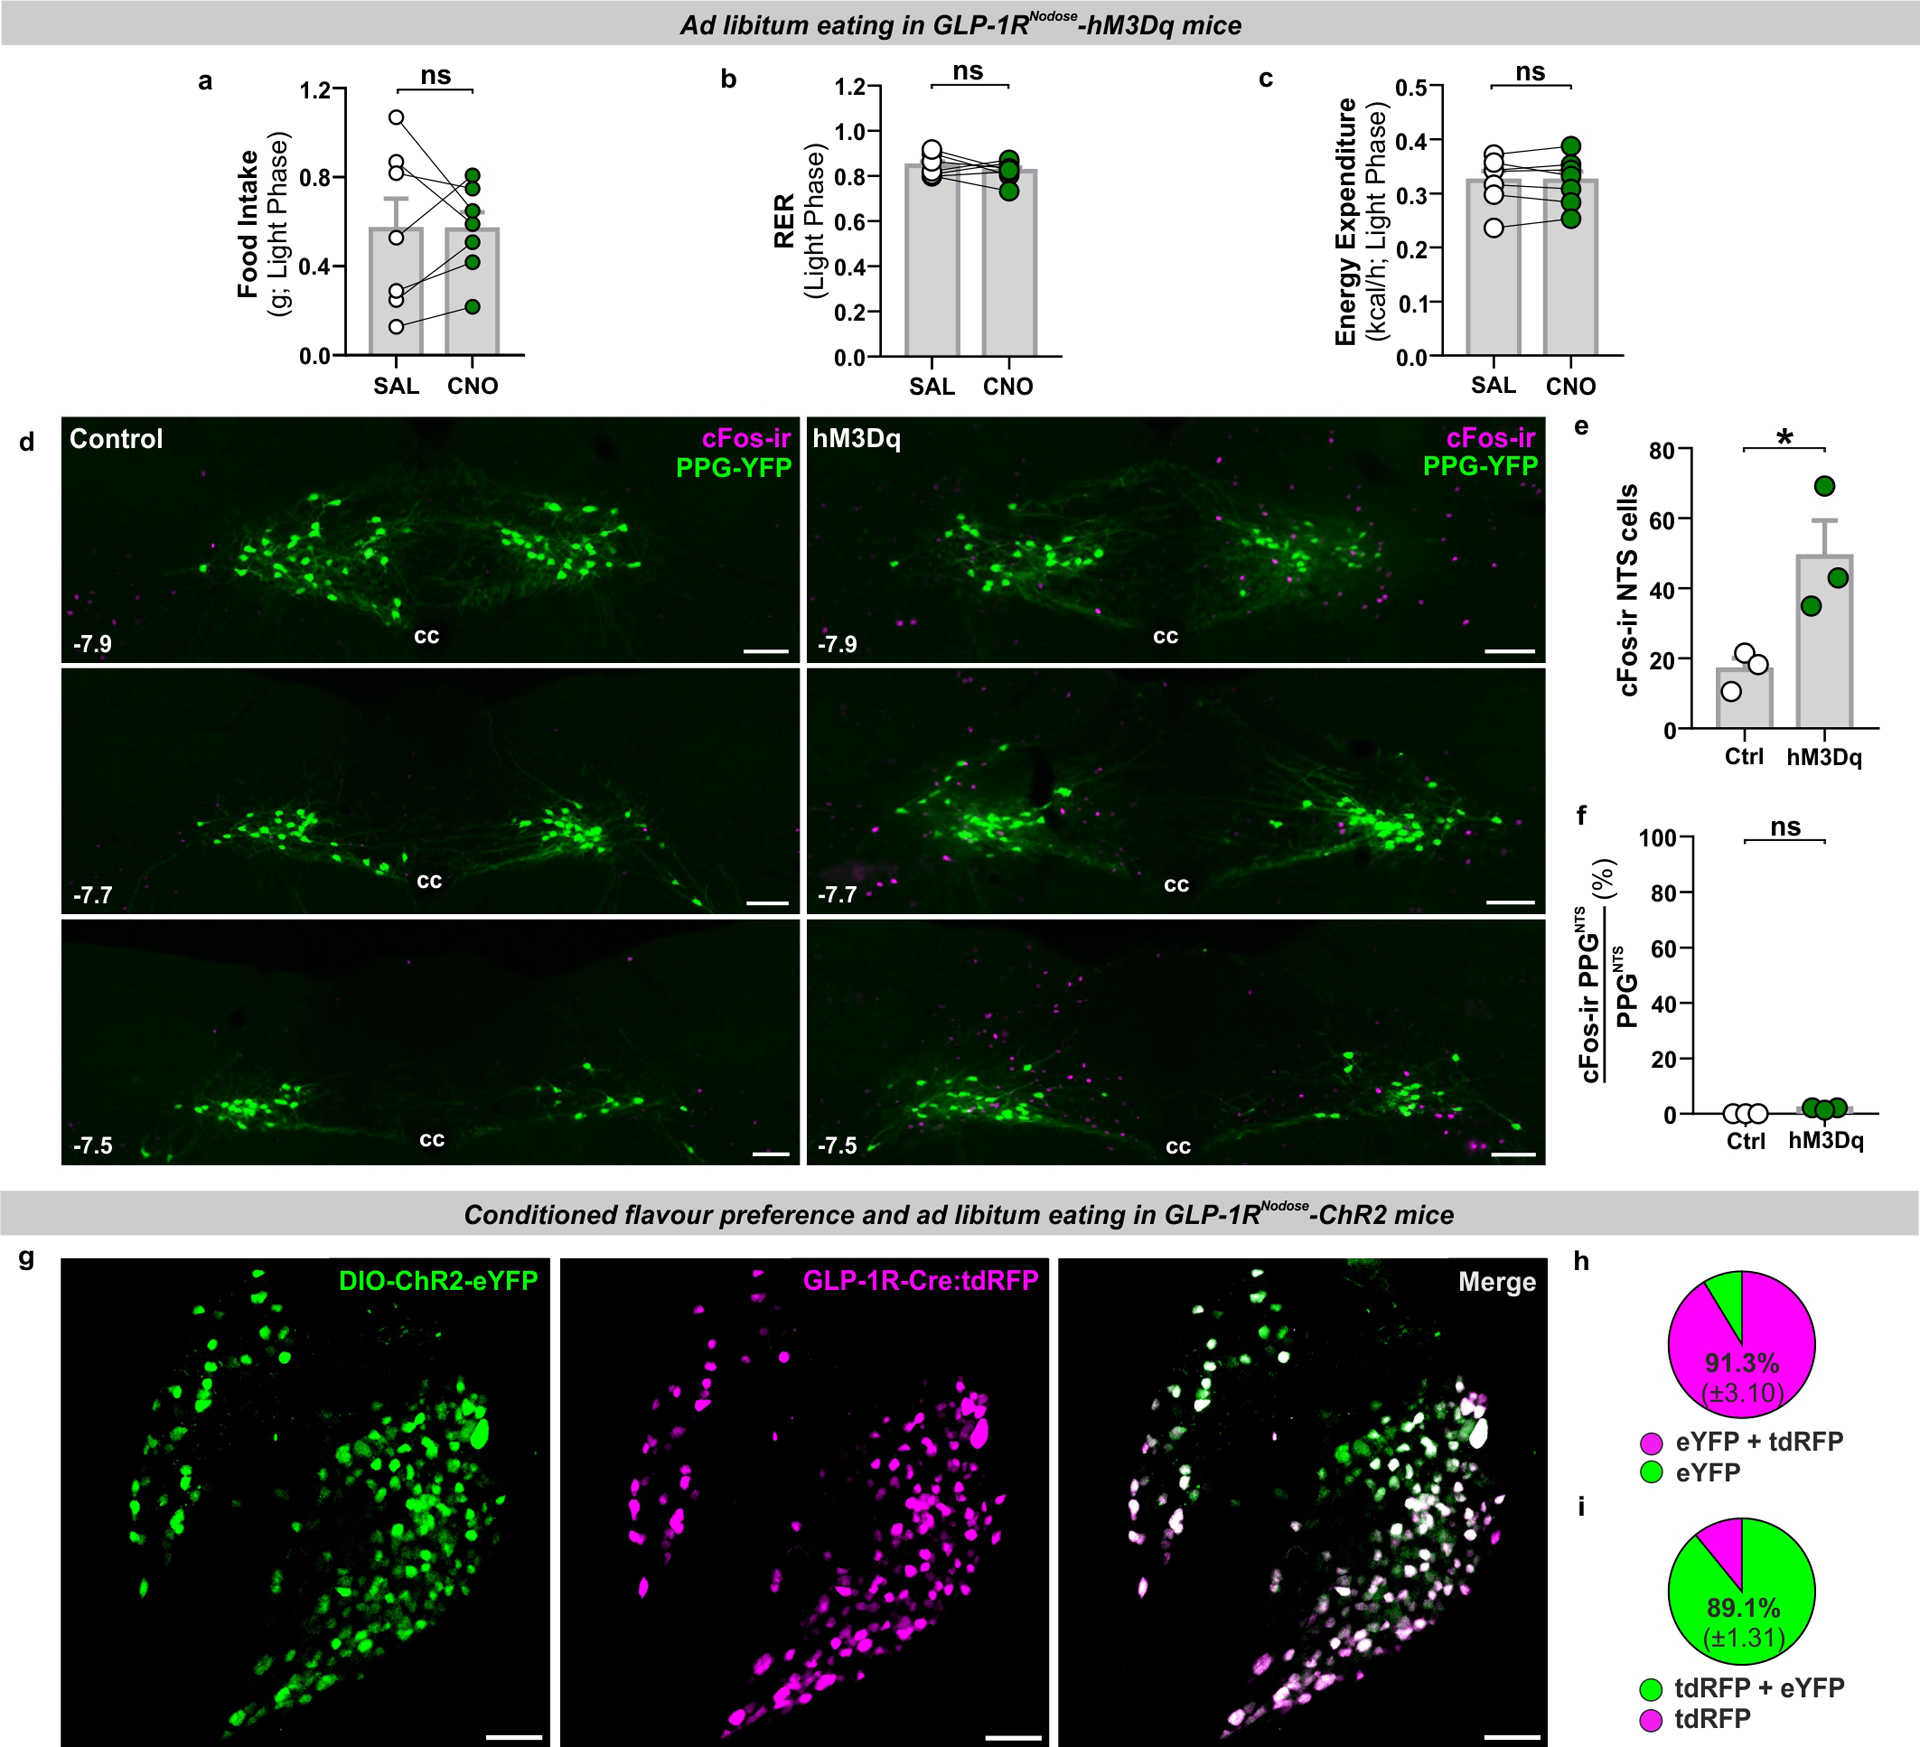
(a-c) Light phase food intake and metabolic parameters from ad libitum eating GLP-1RNodose-hM3Dq mice (n=7 animals for analyses presented in a-c), paired 2-tailed t-test: a) t(6)=0.0141, p=0.989; b) t(6)=0.952, p=0.378; c) t(6)=0.0406, p=0.969.
(d) Photomicrographs of cFos immunoreactivity (cFos-ir) in coronal NTS sections from GLP-1R-Cre × PPG-YFP mice bilaterally injected in nodose ganglia with dye (Control) or AAV9-DIO-hM3Dq-mCherry (hM3Dq) and administered saline or CNO (photomicrographs representative of independent experiments from 3/3 animals). Distance in mm posterior to Bregma in bottom left, cc: central canal. Scale=100μm.
(e) cFos immunoreactive cells in the NTS (mean per section) of control) and hM3Dq mice (n=3 animals per group for analyses in e-f), unpaired 2-tailed t-test: t(4)=2.981, p=0.0407.
(f) PPGNTS neurons co-localised with cFos immunoreactivity in the NTS. Mann-Whitney 2-tailed U-test: U=0, p=0.100.
(g) Photomicrograph of nodose ganglion section from GLP-1R-Cre:tdRFP mouse injected with AAV encoding Cre-dependent channelrhodopsin and eYFP fluorescent reporter (DIO-CHR2-eYFP), and co-localisation of the tdRFP and eYFP reporters (photomicrographs representative of independent experiments from 4 animals). Scale=100μm.
(h-i) Quantification of viral transduction specificity (h; co-localised cells as % (±SEM) of all eYFP+ cells) and efficiency (i; co-localised cells as % (±SEM) of all tdRFP+ cells), from a total of 374 tdRFP+ cells and 366 eYFP+ cells from the nodose ganglia of 3 mice.
All data presented as mean ± SEM.
Extended Data Fig. 4. Oxtr rather than Glp1r VANs are the major vagal input to PPGNTS neurons.
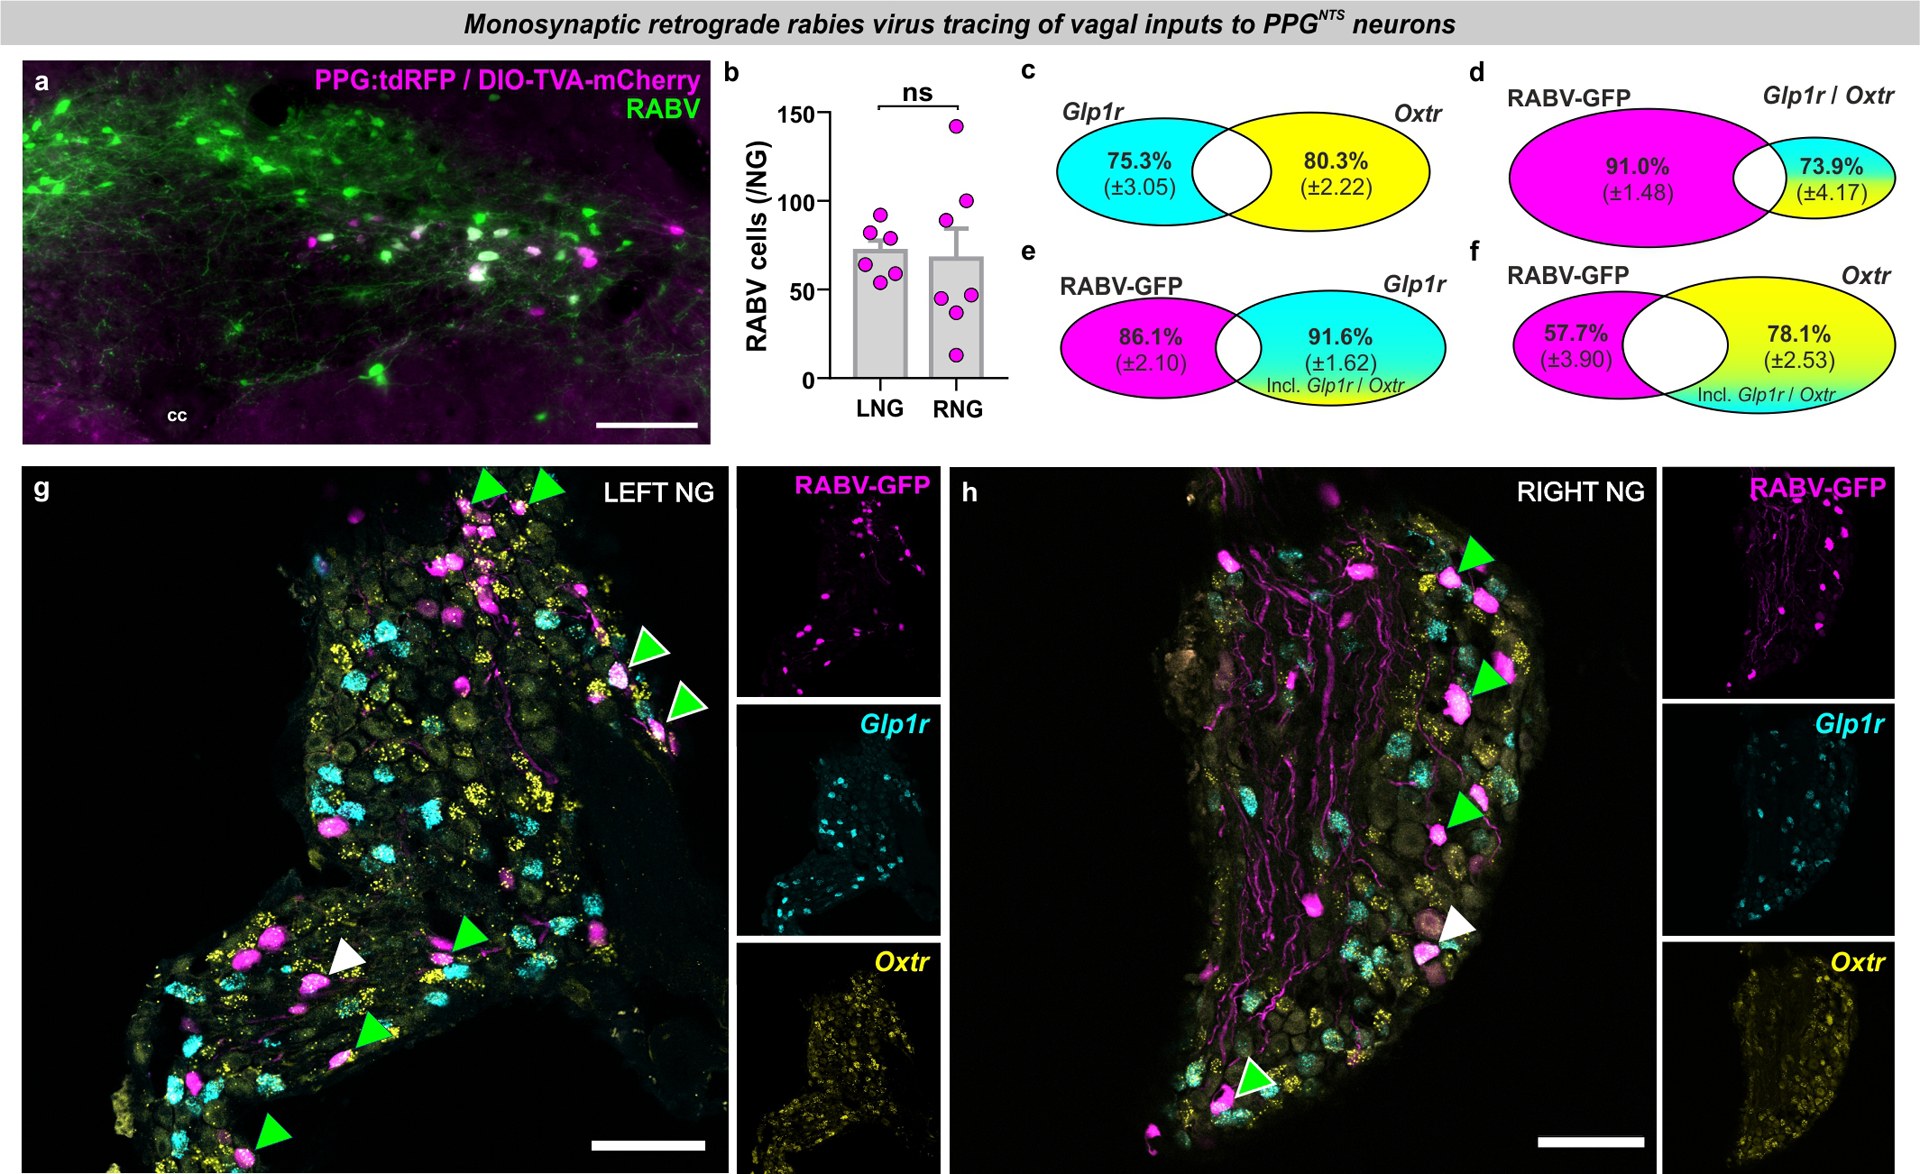
(a) Photomicrograph of coronal NTS section from PPG-Cre:tdRFP mouse transduced with DIO-TVA-mCherry + DIO-RabiesG, and subsequently with rabies virus-ΔG-GFP (RABV). Bilateral NTS injection of TVA+RabiesG and counterbalanced unilateral injection of RABV (4 mice / side) resulted in 40.5% (±5.5) of all PPGNTS neurons being successfully transduced ‘starter’ neurons, identified by co-localization of mCherry (and/or tdRFP) and GFP (photomicrographs in a-h representative of independent experiments from 8 animals). Despite unilateral RABV injection, starter neurons were observed in left and right NTS in all mice, indicating significant viral spread and bilateral transduction. Scale=100μm.
(b) Total RABV+ cells in left and right nodose ganglia (LNG / RNG; n=6 / 7 biologically independent samples), unpaired 2-tailed t-test: t(11)=0.214, p=0.834.
(c-d) Quantification of Glp1r and Oxtr co-localization in nodose ganglia (c), and proportions of dual-expressing Glp1r / Oxtr cells co-localised with RABV (d). This dual population comprises 24.7% of all Glp1r cells and 19.7% of all Oxtr cells. 9% of RABV+ vagal inputs to PPGNTS neurons express both Glp1r and Oxtr, and 26.1% of dual-expressing Glp1r / Oxtr cells are RABV+ vagal inputs to PPGNTS neurons.
(e) Quantification of RABV and Glp1r co-localization in NG as proportions of all RABV+ cells and all Glp1r+ cells, including those Glp1r cells that also express Oxtr.
(f) Quantification of RABV and Oxtr co-localization in NG as proportions of all RABV+ cells and all Oxtr+ cells, including those Oxtr cells that also express Glp1r.
(g-h) Photomicrographs of left and right nodose ganglion sections showing rabies virus GFP expression (RABV) and Glp1r and Oxtr FISH. RABV+Glp1r co-localization shown by white arrows, RABV+Oxtr by green arrows and RABV+Glp1r+Oxtr by white-edged green arrow. Scale=100μm.
All data presented as mean ± SEM.
Extended Data Fig. 5. PPGNTS neurons are necessary for oxytocin-induced eating suppression.
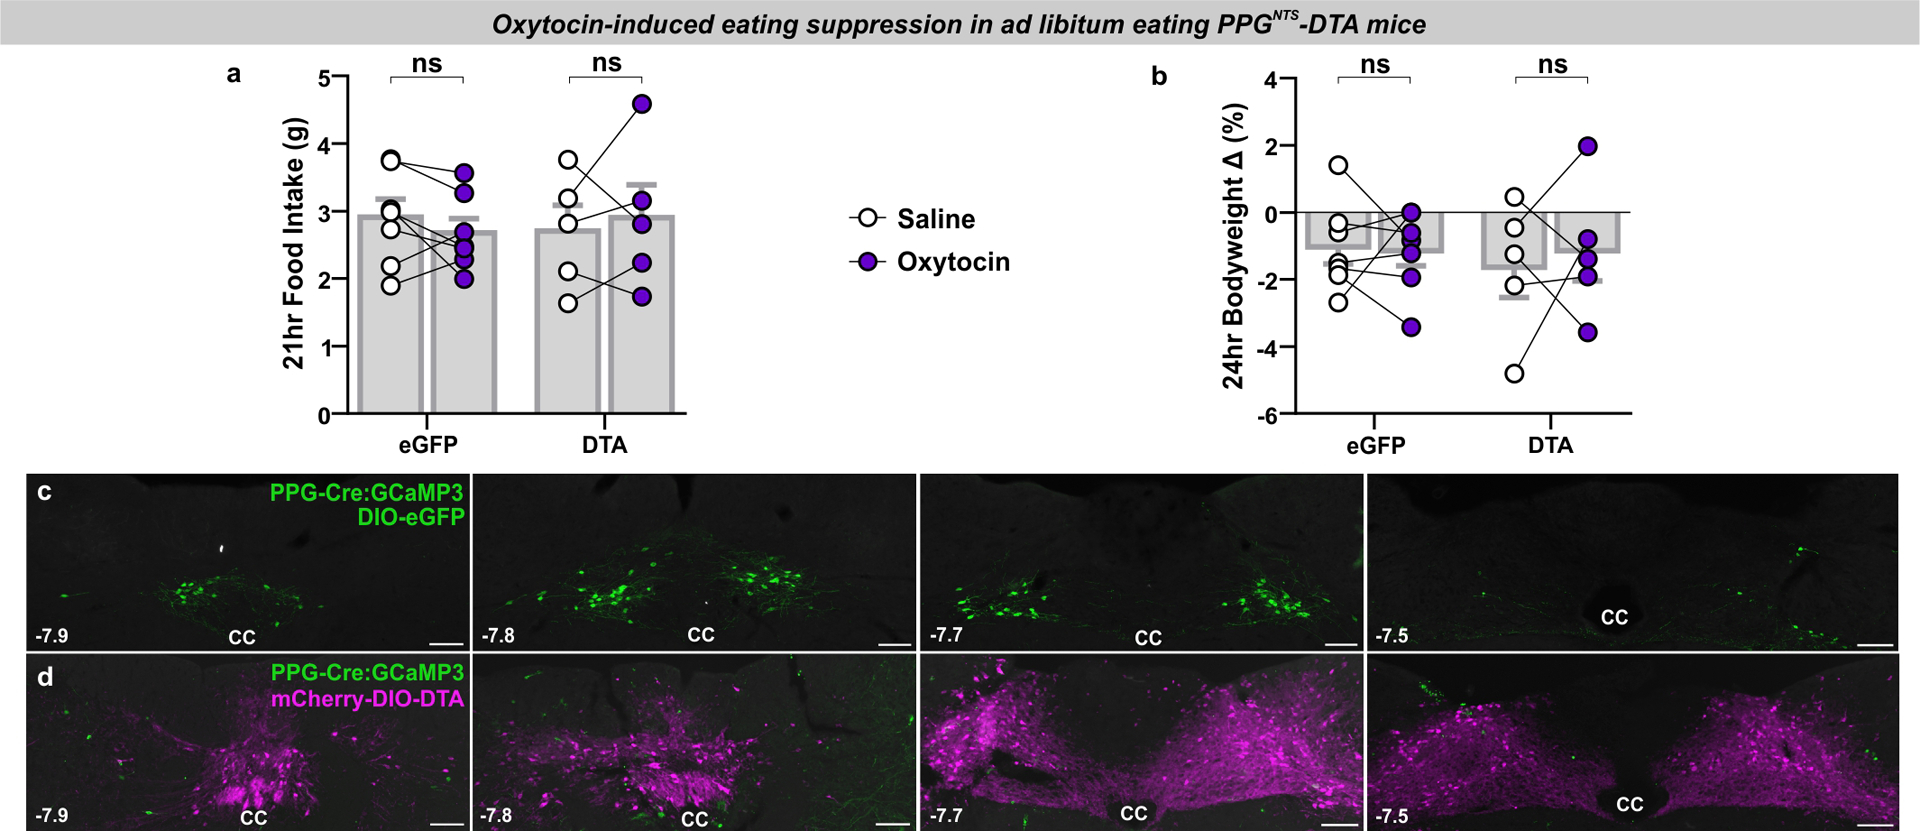
(a-b) Food intake and bodyweight change over 1 day in eGFP and DTA mice (n=5 (DTA) / 7 (eGFP) animals) administered oxytocin (0.4 mg/kg, i.p.), 2-way mixed-model ANOVA: a) Drug F(1,10)=0.00474, p=0.947; b) Drug F(1,10)=0.0989, p=0.760.
(c-d) Photomicrographs of coronal NTS sections from PPG-Cre:GCaMP3 mice injected with eGFP control virus (c) or DTA virus (d). Note the complete absence of green (GCaMP3-expressing, amplified by immunostaining against the GFP antigen) PPGNTS neurons in DTA-ablated tissue, and the extent of viral spread as demonstrated by constitutive expression of mCherry (photomicrographs representative of independent experiments from 7/5 animals). Distance in mm posterior to Bregma in bottom left, cc: central canal. Scale=100μm.
All data presented as mean ± SEM.
Extended Data Fig. 6. PPGNTS neurons are not a major synaptic target of area postrema Glp1r neurons.

(a) Photomicrographs of coronal NTS section showing RABV expression, Glp1r FISH and TH-ir. RABV+Glp1r+TH-ir co-localization shown by white-edged green arrows (photomicrographs representative of independent experiments from 4 animals). Scale=100μm (inset 20μm).
(b-c) Quantification of Glp1r and TH-ir co-localization in area postrema (b), and proportions of dual Glp1r / TH-ir cells co-localised with RABV (c). This dual population comprises 49.4% of all TH-ir cells and 31.2% of all Glp1r cells. 9.7% of RABV+ AP inputs to PPGNTS neurons express Glp1r and are TH-ir, and 2.7% of dual Glp1r / TH-ir cells are RABV+ AP inputs to PPGNTS neurons.
All data presented as mean ± SEM.
Extended Data Fig. 7. Liraglutide and semaglutide suppress eating independently of PPGNTS neurons.
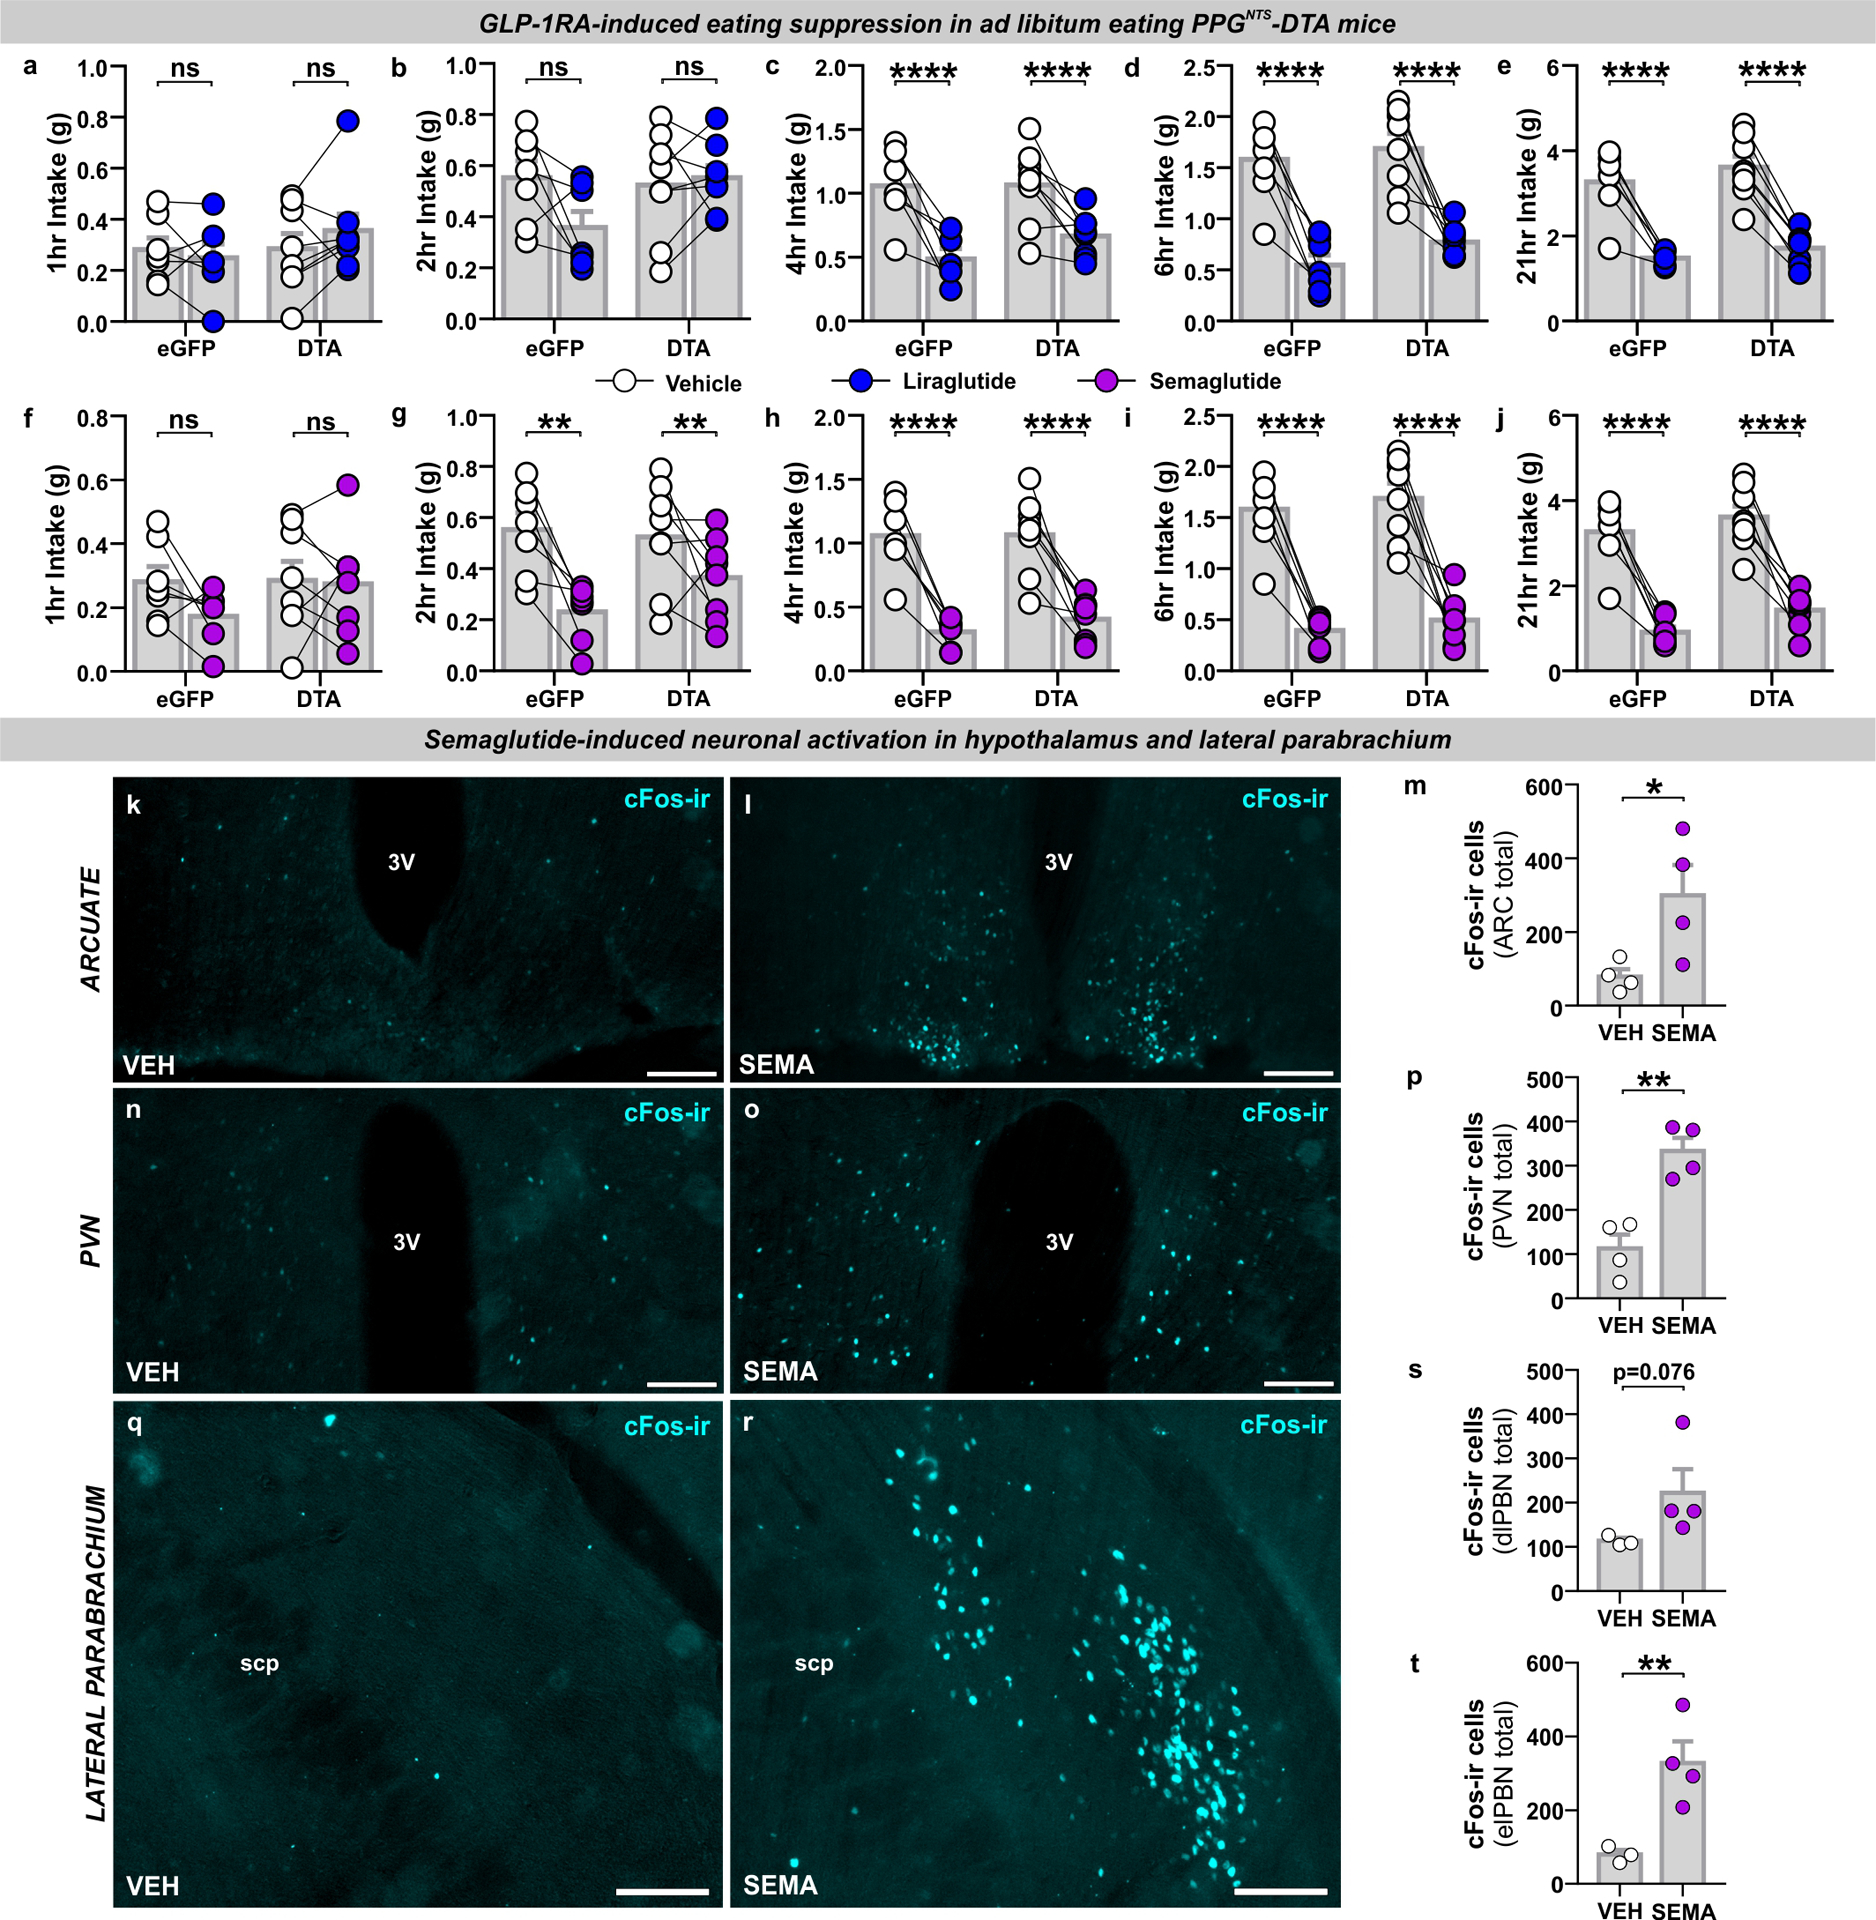
(a-e) Cumulative food intake by virus at 1,2,4,6 and 21hr in eGFP and DTA mice (n=8 (DTA) / 7 (eGFP) animals for analyses presented in a-j) administered liraglutide (200 μg/kg, s.c.), 2-way mixed-model ANOVA: a) Drug F(1,13)=0.246, p=0.628; b) Drug F(1,13)=2.108, p=0.170; c) Drug F(1,13)=37.44, p<0.0001, Virus F(1,13)=0.836, p=0.377; d) Drug F(1,13)=75.09, p<0.0001, Virus F(1,13)=1.877, p=0.194; e) Drug F(1,13)=154.9, p<0.0001, Virus F(1,13)=1.272, p=0.280.
(f-j) Cumulative food intake by virus at 1,2,4,6 and 21hr in eGFP and DTA mice administered semaglutide (60 μg/kg, s.c.), 2-way mixed-model ANOVA: f) Drug F(1,13)=1.965, p=0.184; g) Drug F(1,13)=17.1, p=0.0012; Virus F(1,13)=0.630, p=0.442; h) Drug F(1,13)=82.49, p<0.0001, Virus F(1,13)=0.332, p=0.574; i) Drug F(1,13)=98.21, p<0.0001, Virus F(1,13)=0.840, p=0.376; j) Drug F(1,13)=126.1, p<0.0001, Virus F(1,13)=3.42, p=0.0873.
(k-m) Representative photomicrographs of cFos immunoreactivity (cFos-ir) in arcuate nucleus of the hypothalamus (ARC) 4 hours after vehicle (VEH, n=4 animals) or semaglutide (SEMA, 60 μg/kg, s.c., n=4 animals) administration, and total cFos count, unpaired 1-tailed t-test: m) t(6)=2.614, p=0.020. Scale=100μm.
(n-p) Representative photomicrographs of cFos-ir in paraventricular nucleus of the hypothalamus (PVN) 4 hours after vehicle or semaglutide administration (n=4 / 4 animals), and total cFos count, unpaired 1-tailed t-test: p) t(6)=5.109, p=0.0011. Scale=100μm.
(q-t) Representative photomicrographs of cFos-ir in dorsal lateral and external lateral subdivisions of the parabrachial nucleus (dlPBN / elPBN) 4 hours after vehicle or semaglutide administration (n=3 / 4 animals), and total cFos count, unpaired 1-tailed t-tests: s) t(5)=1.693, p=0.0756; t) t(5)=3.57, p=0.0080. Semaglutide did not increase cFos-ir in the medial PBN, t(5)=0.435, p=0.341. Scale=100μm.
All data presented as mean ± SEM.
Extended Data Fig. 8. PPGNTS neuron activation augments semaglutide-induced eating suppression.
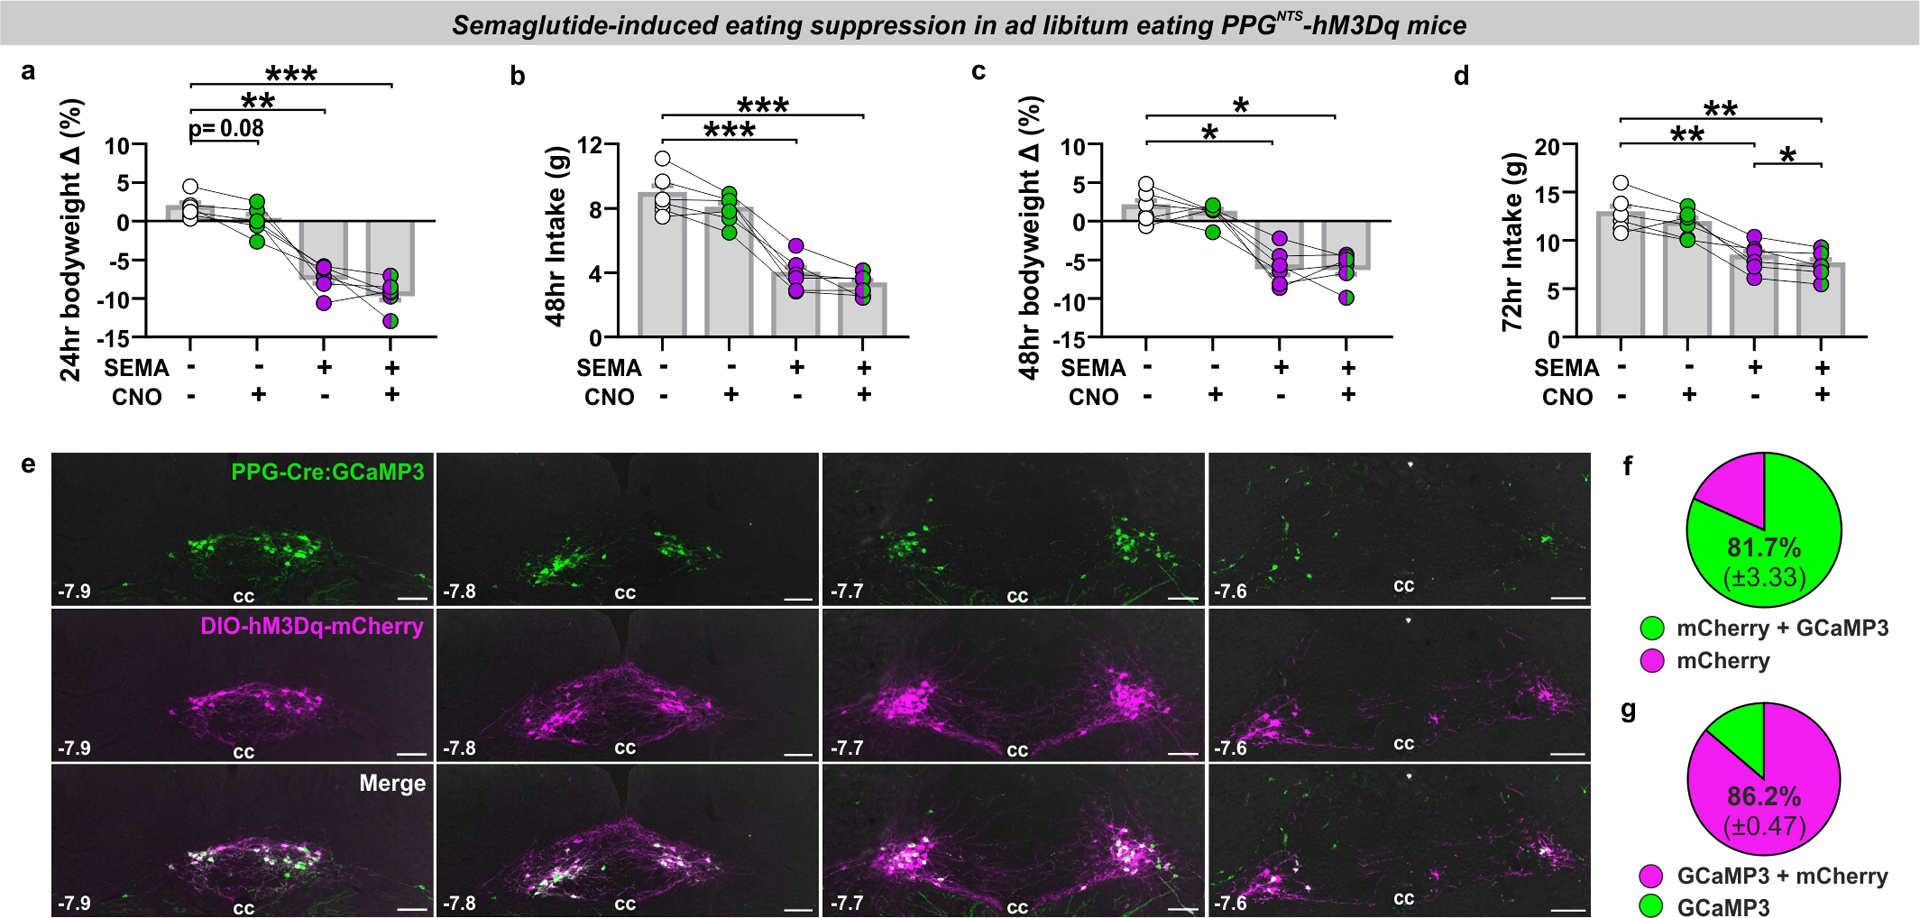
(a-d) Bodyweight change at 24 and 48 hours, and cumulative food intake at 48 and 72 hours (n=6 animals), 1-way within-subjects ANOVA: a) Drug F(2.1,10.5)=61.61, p<0.0001; b) Drug F(2.3,11.3)=102.7, p<0.0001; c) Drug F(2.1,10.6)=24.38, p<0.0001; d) Drug F(1.9,9.3)=40.35, p<0.0001. 72hr BW data not shown: Drug F(2.0,10.2)=4.22, p=0.0454, no significant pairwise comparisons.
(e) Photomicrographs of coronal NTS sections from PPG-Cre:GCaMP3 mice injected with AAV encoding Cre-dependent hM3Dq and mCherry fluorescent reporter (DIO-hM3Dq-mCherry), and co-localisation of the GCaMP3 (amplified by immunostaining against GFP antigen) and mCherry reporters (photomicrographs representative of independent experiments from 4 animals). Distance in mm from Bregma in bottom left, cc: central canal. Scale=100μm.
(f-g) Quantification of viral transduction specificity (f; co-localised cells as % (±SEM) of all mCherry+ cells) and efficiency (g; co-localised cells as % (±SEM) of all GCaMP3+ cells), from a total of 410 mCherry+ cells and 391 GCaMP3+ cells from 4 mice.
All data presented as mean ± SEM.
Acknowledgements:
We would like to thank Lotte Bjerre Knudsen at Novo Nordisk for valuable discussions and provision of liraglutide and semaglutide. We would also like to thank Myrtha Arnold at ETH Zurich and Yalun Tan at the University of Florida for their expert technical assistance, and Kevin Beier at UC Irvine for providing rabies virus for retrograde tracing. This study was supported by MRC project grant MR/N02589X/1 to ST. The initial collaboration between the Trapp, de Lartigue and Langhans labs which generated this work was made possible thanks to a UCL Global Engagement Fund award to DB, and a UCL Neuroscience ZNZ Collaboration award to ST and WL. Research in the de Lartigue lab was funded by the NIH (NIDDK grant R01 DK116004) and with institutional support from the University of Florida College of Pharmacy. Research in the Reimann/Gribble laboratories was funded by the Wellcome Trust (106262/Z/14/Z and 106263/Z/14/Z) and the MRC (MRC_MC_UU_12012/3). Research in the Rinaman laboratory was funded by the U.S. National Institutes of Health (MH059911 and DK100685).
Footnotes
Competing Interests Statement:
The FR + FMG laboratory receives funding from AstraZeneca, Eli Lilly and LGM for unrelated research and FMG consults for Kallyope (New York). All other authors have nothing to declare.
References:
- 1.Knudsen LB & Lau J The discovery and development of liraglutide and semaglutide. Front. Endocrinol. (Lausanne) 10, 155 (2019). [DOI] [PMC free article] [PubMed] [Google Scholar]
- 2.Turton MD et al. A role for glucagon-like peptide-1 in the central regulation of feeding. Nature 379, 69–72 (1996). [DOI] [PubMed] [Google Scholar]
- 3.Trapp S & Richards JE The gut hormone glucagon-like peptide-1 produced in brain: is this physiologically relevant? Curr. Opin. Pharmacol 13, 964–969 (2013). [DOI] [PMC free article] [PubMed] [Google Scholar]
- 4.Müller TD et al. Glucagon-Like Peptide 1 (GLP-1). Mol. Metab 30, 72–130 (2019). [DOI] [PMC free article] [PubMed] [Google Scholar]
- 5.Gaykema RP et al. Activation of murine pre-proglucagon–producing neurons reduces food intake and body weight. J. Clin. Invest 127, 1031–1045 (2017). [DOI] [PMC free article] [PubMed] [Google Scholar]
- 6.Liu J et al. Enhanced AMPA Receptor Trafficking Mediates the Anorexigenic Effect of Endogenous Glucagon-like Peptide-1 in the Paraventricular Hypothalamus. Neuron 96, 897–909.e5 (2017). [DOI] [PMC free article] [PubMed] [Google Scholar]
- 7.Holt MK et al. Preproglucagon neurons in the nucleus of the solitary tract are the main source of brain GLP-1, mediate stress-induced hypophagia, and limit unusually large intakes of food. Diabetes 68, 21–33 (2019). [DOI] [PMC free article] [PubMed] [Google Scholar]
- 8.Zheng H, Stornetta RL, Agassandian K & Rinaman L Glutamatergic phenotype of glucagon-like peptide 1 neurons in the caudal nucleus of the solitary tract in rats. Brain Struct. Funct 220, 3011–3022 (2015). [DOI] [PMC free article] [PubMed] [Google Scholar]
- 9.Trapp S et al. PPG neurons of the lower brain stem and their role in brain GLP-1 receptor activation. Am. J. Physiol. Regul. Integr. Comp. Physiol 309, R795–804 (2015). [DOI] [PMC free article] [PubMed] [Google Scholar]
- 10.Cheng W et al. Leptin receptor–expressing nucleus tractus solitarius neurons suppress food intake independently of GLP1 in mice. JCI Insight 5, e134359 (2020). [DOI] [PMC free article] [PubMed] [Google Scholar]
- 11.Merchenthaler I, Lane M & Shughrue P Distribution of pre-pro-glucagon and glucagon-like peptide-1 receptor messenger RNAs in the rat central nervous system. J. Comp. Neurol 403, 261–80 (1999). [DOI] [PubMed] [Google Scholar]
- 12.Cork SC et al. Distribution and characterisation of Glucagon-like peptide-1 receptor expressing cells in the mouse brain. Mol. Metab 4, 718–731 (2015). [DOI] [PMC free article] [PubMed] [Google Scholar]
- 13.Card JP et al. GLP-1 neurons form a local synaptic circuit within the rodent nucleus of the solitary tract. J. Comp. Neurol 526, 2149–2164 (2018). [DOI] [PMC free article] [PubMed] [Google Scholar]
- 14.Hisadome K, Reimann F, Gribble FM & Trapp S Leptin directly depolarizes preproglucagon neurons in the nucleus tractus solitarius: Electrical properties of glucagon-like peptide 1 neurons. Diabetes 59, 1890–1898 (2010). [DOI] [PMC free article] [PubMed] [Google Scholar]
- 15.Drucker DJ Mechanisms of Action and Therapeutic Application of Glucagon-like Peptide-1. Cell Metab. 27, 740–756 (2018). [DOI] [PubMed] [Google Scholar]
- 16.Krieger JP Intestinal glucagon-like peptide-1 effects on food intake: Physiological relevance and emerging mechanisms. Peptides 131, 170342 (2020). [DOI] [PubMed] [Google Scholar]
- 17.Grill HJ A role for GLP-1 in treating hyperphagia and obesity. Endocrinology bqaa093 (2020) doi: 10.1210/endocr/bqaa093. [DOI] [PMC free article] [PubMed] [Google Scholar]
- 18.Holt MK et al. PPG neurons in the nucleus of the solitary tract modulate heart rate but do not mediate GLP-1 receptor agonist-induced tachycardia in mice. Mol. Metab 101024 (2020) doi: 10.1016/j.molmet.2020.101024. [DOI] [PMC free article] [PubMed] [Google Scholar]
- 19.Secher A et al. The arcuate nucleus mediates GLP-1 receptor agonist liraglutide-dependent weight loss. J. Clin. Invest 124, 4473–88 (2014). [DOI] [PMC free article] [PubMed] [Google Scholar]
- 20.Gabery S et al. Semaglutide lowers body weight in rodents via distributed neural pathways. JCI Insight 5, e133429 (2020). [DOI] [PMC free article] [PubMed] [Google Scholar]
- 21.Varin EM et al. Distinct Neural Sites of GLP-1R Expression Mediate Physiological versus Pharmacological Control of Incretin Action. Cell Rep. 27, 3371–3384.e3 (2019). [DOI] [PubMed] [Google Scholar]
- 22.Kanoski SE, Fortin SM, Arnold M, Grill HJ & Hayes MR Peripheral and central GLP-1 receptor populations mediate the anorectic effects of peripherally administered GLP-1 receptor agonists, liraglutide and exendin-4. Endocrinology 152, 3103–3112 (2011). [DOI] [PMC free article] [PubMed] [Google Scholar]
- 23.Punjabi M et al. Circulating Glucagon-like Peptide-1 (GLP-1) Inhibits Eating in Male Rats by Acting in the Hindbrain and Without Inducing Avoidance. Endocrinology 155, 1690–1699 (2014). [DOI] [PubMed] [Google Scholar]
- 24.Ast J et al. Super-resolution microscopy compatible fluorescent probes reveal endogenous glucagon-like peptide-1 receptor distribution and dynamics. Nat. Commun 11, 1–18 (2020). [DOI] [PMC free article] [PubMed] [Google Scholar]
- 25.Krieger JP et al. Knockdown of GLP-1 receptors in vagal afferents affects normal food intake and glycemia. Diabetes 65, 34–43 (2016). [DOI] [PubMed] [Google Scholar]
- 26.Kim KS, Seeley RJ & Sandoval DA Signalling from the periphery to the brain that regulates energy homeostasis. Nature Reviews Neuroscience vol. 19 185–196 (2018). [DOI] [PMC free article] [PubMed] [Google Scholar]
- 27.Williams EKK et al. Sensory Neurons that Detect Stretch and Nutrients in the Digestive System. Cell 166, 209–221 (2016). [DOI] [PMC free article] [PubMed] [Google Scholar]
- 28.Bai L et al. Genetic Identification of Vagal Sensory Neurons That Control Feeding. Cell 179, 1129–1143.e23 (2019). [DOI] [PMC free article] [PubMed] [Google Scholar]
- 29.Holt MK et al. Synaptic Inputs to the Mouse Dorsal Vagal Complex and Its Resident Preproglucagon Neurons. J. Neurosci 39, 9767–9781 (2019). [DOI] [PMC free article] [PubMed] [Google Scholar]
- 30.Kreisler AD, Davis EA & Rinaman L Differential activation of chemically identified neurons in the caudal nucleus of the solitary tract in non-entrained rats after intake of satiating vs. non-satiating meals. Physiol. Behav 136, 47–54 (2014). [DOI] [PMC free article] [PubMed] [Google Scholar]
- 31.Nguyen KP, O’Neal TJ, Bolonduro OA, White E & Kravitz AV Feeding Experimentation Device (FED): A flexible open-source device for measuring feeding behavior. J. Neurosci. Methods 267, 108–114 (2016). [DOI] [PMC free article] [PubMed] [Google Scholar]
- 32.Kreisler AD & Rinaman L Hindbrain glucagon-like peptide-1 neurons track intake volume and contribute to injection stress-induced hypophagia in meal-entrained rats. Am. J. Physiol. - Regul. Integr. Comp. Physiol 310, R906–R916 (2016). [DOI] [PMC free article] [PubMed] [Google Scholar]
- 33.Terrill SJ et al. Endogenous GLP-1 in lateral septum promotes satiety and suppresses motivation for food in mice. Physiol. Behav 206, 191–199 (2019). [DOI] [PMC free article] [PubMed] [Google Scholar]
- 34.Ishii Y et al. Differential effects of the selective orexin-1 receptor antagonist SB-334867 and lithium chloride on the behavioural satiety sequence in rats. Physiol. Behav 81, 129–140 (2004). [DOI] [PubMed] [Google Scholar]
- 35.Wright FL & Rodgers RJ Behavioural profile of exendin-4/naltrexone dose combinations in male rats during tests of palatable food consumption. Psychopharmacology (Berl). 231, 3729–3744 (2014). [DOI] [PubMed] [Google Scholar]
- 36.Vrang N, Phifer CB, Corkern MM & Berthoud H-R Gastric distension induces c-Fos in medullary GLP-1/2-containing neurons. Am. J. Physiol. Integr. Comp. Physiol 285, R470–R478 (2003). [DOI] [PubMed] [Google Scholar]
- 37.Schwartz GJ & Moran TH Sub-diaphragmatic vagal afferent integration of meal-related gastrointestinal signals. Neurosci. Biobehav. Rev 20, 47–56 (1996). [DOI] [PubMed] [Google Scholar]
- 38.Al Helaili A, Park SJ & Beyak MJ Chronic high fat diet impairs glucagon like peptide-1 sensitivity in vagal afferents. Biochem. Biophys. Res. Commun 533, 110–117 (2020). [DOI] [PubMed] [Google Scholar]
- 39.Kanoski SE, Hayes MR & Skibicka KP GLP-1 and weight loss: unraveling the diverse neural circuitry. Am. J. Physiol. - Regul. Integr. Comp. Physiol 310, R885–R895 (2016). [DOI] [PMC free article] [PubMed] [Google Scholar]
- 40.Yamaguchi E, Yasoshima Y & Shimura T Systemic administration of anorexic gut peptide hormones impairs hedonic-driven sucrose consumption in mice. Physiol. Behav 171, 158–164 (2017). [DOI] [PubMed] [Google Scholar]
- 41.Hayes MR & Schmidt HD GLP-influences food and drug reward. Current Opinion in Behavioral Sciences vol. 9 66–70 (2016). [DOI] [PMC free article] [PubMed] [Google Scholar]
- 42.Anesten F et al. Preproglucagon neurons in the hindbrain have IL-6 receptor-α and show Ca2+ influx in response to IL-6. Am. J. Physiol. - Regul. Integr. Comp. Physiol 311, R115–R123 (2016). [DOI] [PMC free article] [PubMed] [Google Scholar]
- 43.Holt MK, Llewellyn-Smith IJ, Reimann F, Gribble FM & Trapp S Serotonergic modulation of the activity of GLP-1 producing neurons in the nucleus of the solitary tract in mouse. Mol. Metab 6, 909–921 (2017). [DOI] [PMC free article] [PubMed] [Google Scholar]
- 44.Iwasaki Y et al. Peripheral oxytocin activates vagal afferent neurons to suppress feeding in normal and leptin-resistant mice: a route for ameliorating hyperphagia and obesity. Am. J. Physiol. - Regul. Integr. Comp. Physiol 308, R360–R369 (2015). [DOI] [PubMed] [Google Scholar]
- 45.Iwasaki Y et al. Relay of peripheral oxytocin to central oxytocin neurons via vagal afferents for regulating feeding. Biochem. Biophys. Res. Commun 519, 553–558 (2019). [DOI] [PubMed] [Google Scholar]
- 46.Kawatani M, Yamada Y & Kawatani M Glucagon-like peptide-1 (GLP-1) action in the mouse area postrema neurons. Peptides 107, 68–74 (2018). [DOI] [PubMed] [Google Scholar]
- 47.Yamamoto H et al. Glucagon-like peptide-1-responsive catecholamine neurons in the area postrema link peripheral glucagon-like peptide-1 with central autonomic control sites. J. Neurosci 23, 2939–2946 (2003). [DOI] [PMC free article] [PubMed] [Google Scholar]
- 48.Hisadome K, Reimann F, Gribble FM & Trapp S CCK stimulation of GLP-1 neurons involves α 1-adrenoceptor- mediated increase in glutamatergic synaptic inputs. Diabetes 60, 2701–2709 (2011). [DOI] [PMC free article] [PubMed] [Google Scholar]
- 49.Adams JM et al. Liraglutide modulates appetite and body weight through glucagon-like peptide 1 receptor-expressing glutamatergic neurons. Diabetes 67, 1538–1548 (2018). [DOI] [PMC free article] [PubMed] [Google Scholar]
- 50.Fortin SM et al. GABA neurons in the nucleus tractus solitarius express GLP-1 receptors and mediate anorectic effects of liraglutide in rats. Sci. Transl. Med 12, eaay8071 (2020). [DOI] [PMC free article] [PubMed] [Google Scholar]
- 51.Llewellyn-Smith IJ, Reimann F, Gribble FM & Trapp S Preproglucagon neurons project widely to autonomic control areas in the mouse brain. Neuroscience 180, 111–121 (2011). [DOI] [PMC free article] [PubMed] [Google Scholar]
- 52.Reimann F et al. Glucose Sensing in L Cells: A Primary Cell Study. Cell Metab. 8, 532–539 (2008). [DOI] [PMC free article] [PubMed] [Google Scholar]
- 53.Parker HE et al. Predominant role of active versus facilitative glucose transport for glucagon-like peptide-1 secretion. Diabetologia 55, 2445–2455 (2012). [DOI] [PMC free article] [PubMed] [Google Scholar]
- 54.Richards P et al. Identification and characterization of GLP-1 receptor-expressing cells using a new transgenic mouse model. Diabetes 63, 1224–33 (2014). [DOI] [PMC free article] [PubMed] [Google Scholar]
- 55.Han W et al. A Neural Circuit for Gut-Induced Reward. Cell 175, 665–678 (2018). [DOI] [PMC free article] [PubMed] [Google Scholar]
- 56.Rakipovski G et al. The GLP-1 Analogs Liraglutide and Semaglutide Reduce Atherosclerosis in ApoE −/− and LDLr −/− Mice by a Mechanism That Includes Inflammatory Pathways. JACC Basic to Transl. Sci 3, 844–857 (2018). [DOI] [PMC free article] [PubMed] [Google Scholar]
- 57.de Lartigue G, Ronveaux CC & Raybould HE Deletion of leptin signaling in vagal afferent neurons results in hyperphagia and obesity. Mol. Metab 3, 595–607 (2014). [DOI] [PMC free article] [PubMed] [Google Scholar]
- 58.Friard O & Gamba M BORIS: a free, versatile open-source event-logging software for video/audio coding and live observations. Methods Ecol. Evol 7, 1325–1330 (2016). [Google Scholar]
- 59.Halford JC, Wanninayake SC & Blundell JE Behavioral satiety sequence (BSS) for the diagnosis of drug action on food intake. Pharmacol. Biochem. Behav 61, 159–68 (1998). [DOI] [PubMed] [Google Scholar]
- 60.Rodgers RJ, Holch P & Tallett AJ Behavioural satiety sequence (BSS): separating wheat from chaff in the behavioural pharmacology of appetite. Pharmacol. Biochem. Behav 97, 3–14 (2010). [DOI] [PubMed] [Google Scholar]
- 61.Mina AI et al. CalR: A Web-Based Analysis Tool for Indirect Calorimetry Experiments. Cell Metab. 28, 656–666.e1 (2018). [DOI] [PMC free article] [PubMed] [Google Scholar]
- 62.de Kloet AD et al. Reporter mouse strain provides a novel look at angiotensin type-2 receptor distribution in the central nervous system. Brain Struct. Funct 221, 891–912 (2016). [DOI] [PMC free article] [PubMed] [Google Scholar]
- 63.Schindelin J et al. Fiji: An open-source platform for biological-image analysis. Nature Methods vol. 9 676–682 (2012). [DOI] [PMC free article] [PubMed] [Google Scholar]
- 64.Wu Z, Autry AE, Bergan JF, Watabe-Uchida M & Dulac CG Galanin neurons in the medial preoptic area govern parental behaviour. Nature 509, 325–30 (2014). [DOI] [PMC free article] [PubMed] [Google Scholar]
- 65.Krashes MJ et al. Rapid, reversible activation of AgRP neurons drives feeding behavior in mice. J. Clin. Invest 121, 1424–8 (2011). [DOI] [PMC free article] [PubMed] [Google Scholar]
- 66.Watabe-Uchida M, Zhu L, Ogawa SK, Vamanrao A & Uchida N Whole-Brain Mapping of Direct Inputs to Midbrain Dopamine Neurons. Neuron 74, 858–873 (2012). [DOI] [PubMed] [Google Scholar]
- 67.Wickersham IR et al. Monosynaptic Restriction of Transsynaptic Tracing from Single, Genetically Targeted Neurons. Neuron 53, 639–647 (2007). [DOI] [PMC free article] [PubMed] [Google Scholar]
Associated Data
This section collects any data citations, data availability statements, or supplementary materials included in this article.
Data Availability Statement
There are no publicly available datasets for this manuscript. All data necessary to interpret, replicate and build on the methods or findings reported here are contained within the manuscript and extended data figures. Primary data from ex vivo calcium recordings, food intake, metabolic and behavioural analyses, videos for behavioural satiety sequence coding, and photomicrographs for ISH and IHC analyses are available in native format upon request from the corresponding authors. Access to stored tissue samples used for ISH and IHC is available upon request from the corresponding authors. All mouse lines, plasmids and reagents used in this study have been previously published and/or are commercially available, and are detailed in the Reporting Summary. Further information and requests for resources and reagents should be directed to and will be fulfilled by Prof. Stefan Trapp (s.trapp@ucl.ac.uk).