Abstract
The naïve epiblast and embryonic stem cells (ESCs) give rise to all cells of the adult. Such developmental plasticity is associated with genome hypomethylation. Here we show that LIF/Stat3 signaling induces genomic hypomethylation via metabolic reconfiguration. Stat3-/- ESCs show decreased alpha-ketoglutarate production from glutamine, leading to increased Dnmt3a/b expression and DNA methylation. Notably, genome methylation is dynamically controlled by modulating alpha-ketoglutarate availability or Stat3 activation in mitochondria. Alpha-ketoglutarate links metabolism to the epigenome, by reducing the expression of Otx2 and its targets Dnmt3a/b. Genetic inactivation of Otx2 or Dnmt3a/b results in genomic hypomethylation even in the absence of active LIF/Stat3. Stat3-/- ESCs show increased methylation at Imprinting Control Regions and altered expression of cognate transcripts. Single-cell analysis of Stat3-/- embryos confirmed the dysregulated expression of Otx2, Dnmt3a/b and imprinted genes. Several cancers display Stat3-overactivation and abnormal DNA methylation, therefore the molecular module we described might be exploited under pathological conditions.
Introduction
After fertilization, the zygotic genome is demethylated in order to establish a blank canvas for embryonic development. DNA methylation occurs on carbon 5 of cytosine (5mC) and is catalyzed by DNA methyltransferases (Dnmts). Ten-eleven translocation (Tet) proteins promote oxidation of 5mC to hydroxymethylcytosine (h5mC1,2). Additional oxidation steps mediated by Tets lead to the conversion of h5mC into unmodified cytosine. Dnmts and Tets are dynamically expressed during early development, leading to a local minimum of 5mC at the preimplantation blastocyst stage at E3.53–5. Imprinted genes, expressed monoallelically in a parent-of-origin fashion, resist this wave of DNA demethylation. Such monoallelic expression allows tight control of their dosage and is essential for the proper embryonic development6. How is the expression of Dnmts and Tets controlled in the early embryo? In the embryo, the Jak/Stat pathway is active from E2.5 and E3.5, as shown by phosphorylation of Stat3 and transcriptional activation of its targets Socs3 and Tfcp2l1 7–11. Thus, Stat3 represents a good candidate as a regulator of Dnmt and Tet expression.
Mouse naïve ESCs cells are derived from preimplantation blastocysts12 and show genomic hypomethylation, only when cultured in the presence of LIF, a ligand of the Jak/Stat pathway, in combination with two inhibitors of kinases GSK3 and MEK (2iLIF conditions13–17). Conversely, ESCs cultured in fetal bovine serum-based medium with LIF (Serum LIF conditions18), display higher levels of DNA methylation. Such findings indicate that LIF is not sufficient to induce genomic hypomethylation in presence of serum, but the requirement of Stat3 to induce hypomethylation in 2iLIF conditions has never been formally tested.
Stat3 represents an ideal regulator of the epigenome, as it both regulates gene expression in the nucleus and cellular metabolism in mitochondria by promoting oxidative phosphorylation (OXPHOS,19–21). Several metabolites are known regulators or cofactors of enzymes catalyzing epigenetic modifications22. For all these reasons, we genetically tested the role of Stat3 on genome methylation of naïve pluripotent cells.
Results
LIF/Stat3 induces hypomethylation in ESCs via Dnmt3a/b regulation in 2i
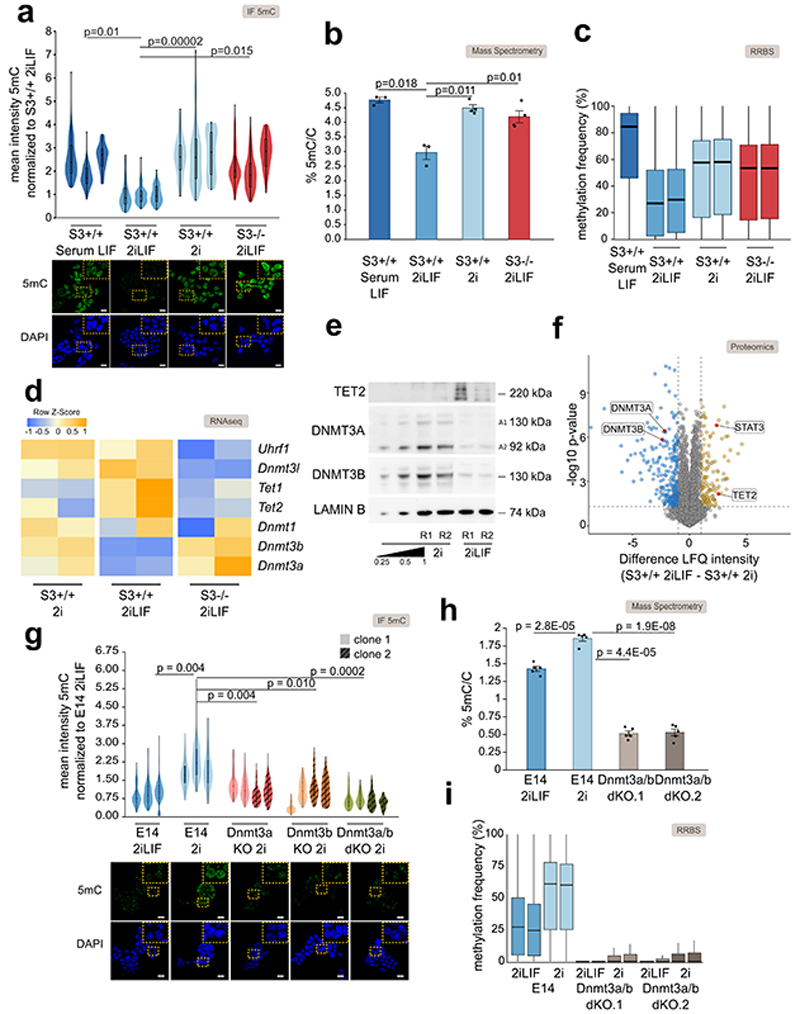
We measured the levels of 5mC by quantitative immunostaining in ESCs and observed a strong decrease in signal intensity in 2iLIF compared to Serum LIF (Fig. 1a), as previously reported14–17. Surprisingly, wild-type (S3+/+) ESCs stably expanded in 2i without LIF, or Stat3-/- (S3-/-) cells in 2iLIF showed significantly higher levels of 5mC than S3+/+ in 2iLIF, comparable to those of S3+/+ cells in Serum LIF (Fig. 1a). We performed mass spectrometry in order to unequivocally identify global 5mC and unmethylated cytosine and confirmed that only S3+/+ cells in 2iLIF showed a reduced fraction of methylated cytosine (Fig. 1b). Reduced representation bisulfite sequencing (RRBS, Fig. 1c and Extended Data Fig. 1a) further confirmed our findings. We conclude that active LIF/Stat3 signaling is required, in combination with 2i, to induce genomic hypomethylation.
Fig. 1. LIF/Stat3 induces hypomethylation in ESCs via Dnmt3a/b regulation.
a, Anti-5mC immunofluorescence on S3+/+ cells in Serum LIF, 2i or 2iLIF and S3-/- cells in 2iLIF. Representative images and violin plots showing the distribution of fluorescence intensity of an average of 63 nuclei per sample. n = 3 experiments shown as individual violins. Two-tailed unpaired t-test was performed on median intensity values of each sample.
b, Percentage of 5mC quantified by mass spectrometry. Mean and s.e.m. of n = 3 for S3+/+ Serum LIF and 2iLIF and n = 4 for S3+/+ 2i and 2iLIF biological replicates shown as dots.
c, DNA methylation at CpG islands measured by RRBS.
d, Heatmap of transcriptomic data; n= 2 biological replicates. Z-score of scaled expression values.
e, Western blot of S3+/+ cells in 2i or 2iLIF. Two biological replicates (R1/2). Two isoforms of Dnmt3a were detected72. Lamin B: loading control. Representative images of n = 2 independent experiment.
f, Proteomic data from S3+/+ cells in 2iLIF or 2i. Yellow and blue dots indicate proteins that are less or more abundant (difference > 1 or < -1, P value < 0.05) in 2iLIF relative to 2i. n = 5 biological replicates. See Supplementary Table 3.
g, Anti-5mC immunofluorescence of E14 cells in 2iLIF and 2i, and Dnmt3a KO, Dnmt3b KO, and Dnmt3a/b dKO in 2i. Violin plots of an average of 82 nuclei per sample. Independent experiments shown as violins.
h, Percentage of 5mC of E14 cells cultured in 2iLIF and 2i, and two Dnmt3a/b dKO clones. Mean and s.e.m. of 5 biological replicates shown as dots.
i, RRBS on the indicated samples. n = 2 biological replicates.
All violin and boxplots indicate the 1st, 2nd and 3rd quartiles, with whiskers indicating minimum and maximum value. All P values calculated by two-tailed unpaired t-test. Scale bars: 20 μm.
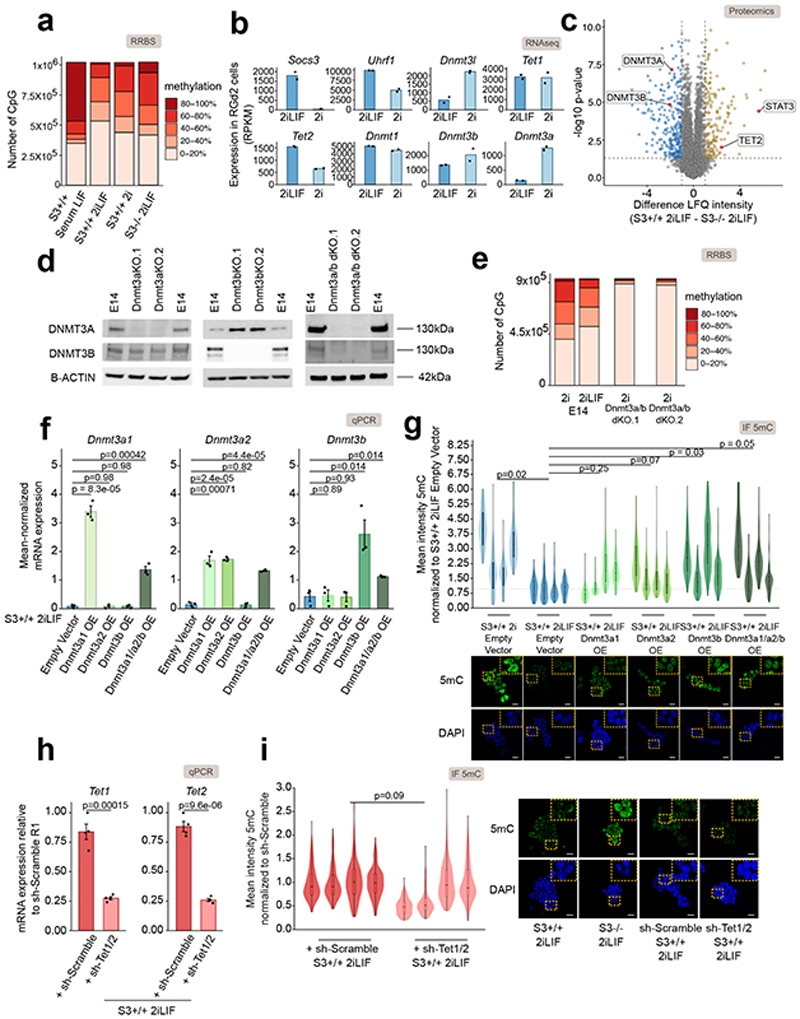
How does LIF/Stat3 regulate the levels of 5mC? We measured the expression levels of factors involved in 5mC deposition, maintenance and oxidation and observed that S3+/+ cells in 2iLIF showed reduced expression only of de novo methyltransferases Dnmt3a and Dnmt3b and increased expression of Tet2 compared to S3+/+ cells in 2i or to S3-/- cells (Fig. 1d and Extended Data Fig. 1b). Such changes were confirmed at the protein level by western blot and mass spectrometry (Fig. 1e-f, Extended Data Fig. 1c and Source Data Fig. 1).
We then asked whether the hypomethylation observed in 2iLIF was dependent on Dnmt3a/b. We generated two independent mutant clones for each genotype of Dnmt3a KO, Dnmt3b KO, and Dnmt3a/b double KO (dKO) ESCs (Extended Data Fig. 1d and Source Data Extended Data Fig. 1). Wild-type ESCs (E14) cultured in 2i without LIF were hypermethylated, while Dnmt3a KO and Dnmt3b KO cells displayed a partial reduction of 5mC relative to wild-type cells in 2i, and Dnmt3a/b dKO cells cultivated in 2i were hypomethylated (Fig. 1g). Mass spectrometry (Fig. 1h) and RRBS (Fig. 1i and Extended Data Fig. 1e) further confirmed hypomethylation of Dnmt3a/b dKO cells in 2i. Furthermore, overexpression of Dnmt3a and Dnmt3b in S3+/+ cells in 2iLIF led to increased 5mC levels (Extended Data Fig. 1f-g). We conclude that the levels of Dnmt3a/b dictate the DNA methylation status of naïve ESCs in 2i.
We also tested whether Tets could have a role in the hypomethylation observed in 2iLIF. Tet1 and Tet2 are both robustly expressed in ESCs in 2iLIF (Supplementary Table 1) and have redundant functions23. Therefore, we knocked down Tet1 and Tet2 simultaneously in S3+/+ 2iLIF and observed, however, no significant changes of 5mC (Extended Data Fig. 1h-i) in agreement with previous reports23,24.
Impact of Stat3 on DNA methylation and transcription
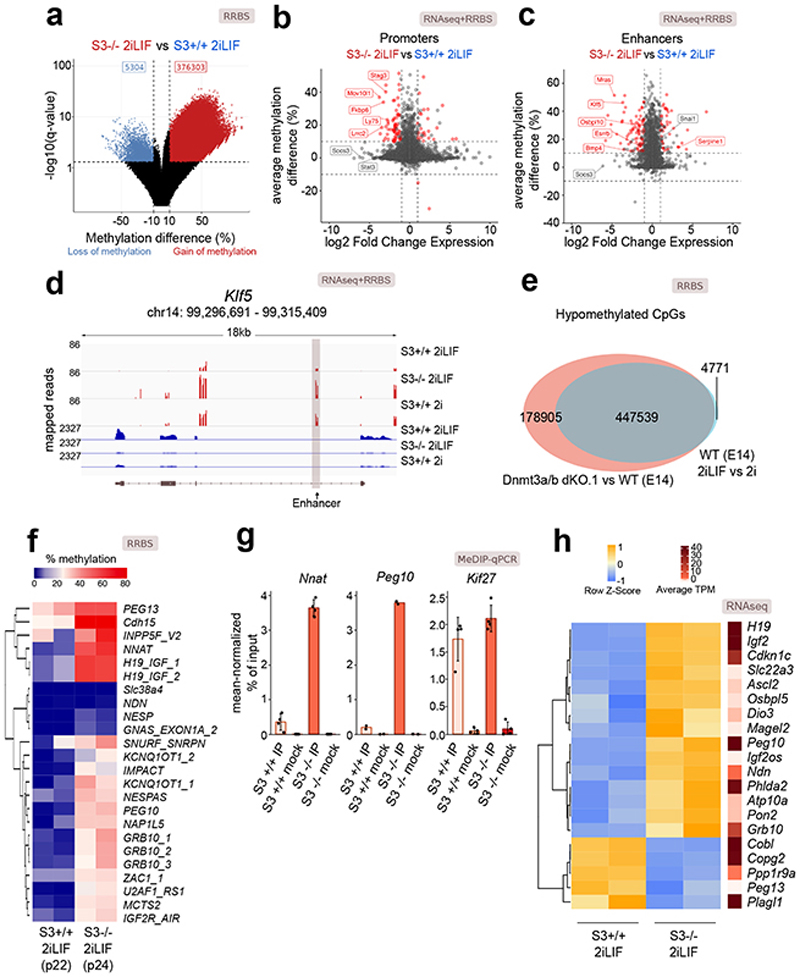
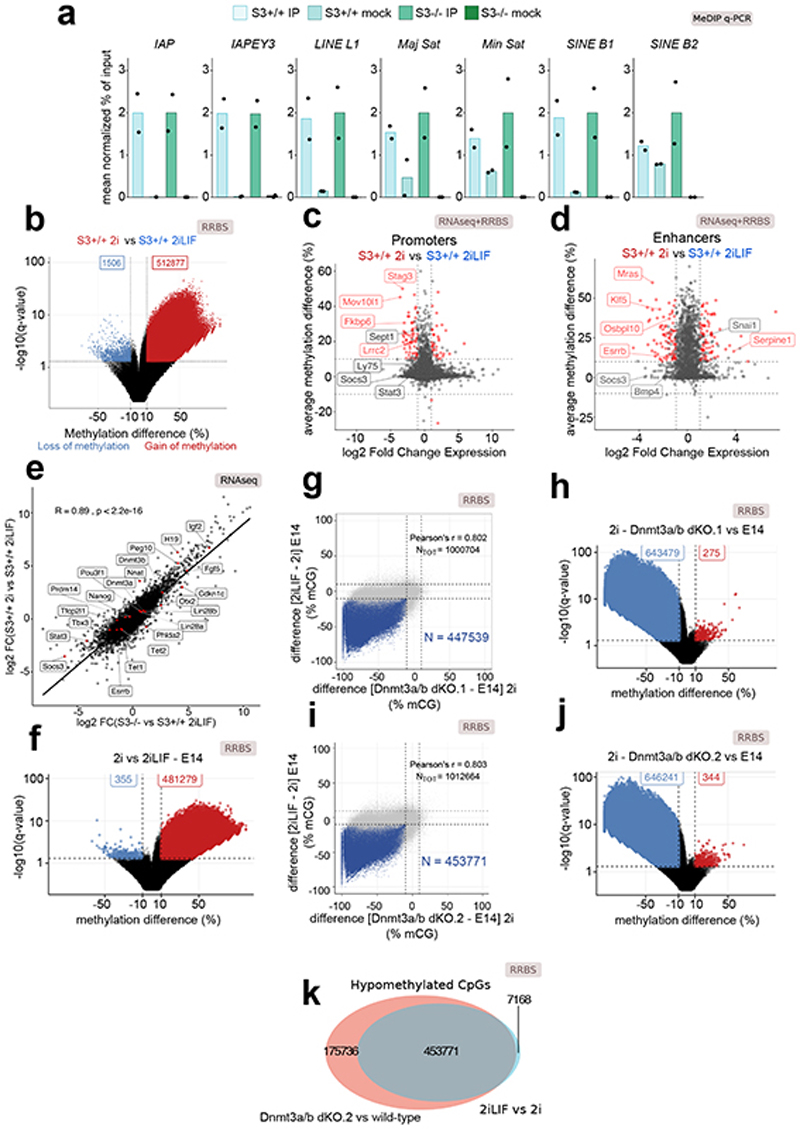
We then asked which genomic regions showed a DNA methylation profile dependent on Stat3. RRBS analysis for S3+/+ and S3-/- cells in 2iLIF identified 381,607 differentially methylated sites, with 98.7% of them displaying gain of methylation in S3-/- cells (Fig. 2a) while DNA methylation at repetitive elements, was unchanged (Extended Data Fig. 2a). We used H3K4me3 and H3K27ac ChIP-seq profiles to identify promoters and enhancers in ESCs. We observed increased DNA methylation in S3-/- cells in 3.6% (323/8,782) of promoters and 36.5% (621/1,701) of enhancers (Fig. 2b-c and Supplementary Table 2), while only 2 out of 8,782 promoters and 1 out of 1,701 enhancers showed decreased DNA methylation. We intersected transcriptome data, comparing S3+/+ and S3-/- cells, and asked whether the gene associated with each promoter or enhancer was differentially expressed. The gain of DNA methylation at promoters was associated with downregulation of cognate genes in 20.7% (67/323) of the cases and with upregulation in 8% (26/323) of cases (Fig. 2b). For enhancers, 13.8% (86/621) and 6.7% (42/621) of cognate genes were significantly downregulated or upregulated, respectively (Fig. 2c). Among them we noticed the pluripotency factors Klf5 and Esrrb 25,26 (Fig. 2d). We repeated the same analyses comparing S3+/+ in 2i and in 2iLIF (Fig. 2d and Extended Data Fig. 2b-f) and obtained highly comparable results, demonstrating that absence of LIF or Stat3 had overlapping effects on the transcriptome and 5mC profile of ESCs.
Fig. 2. Impact of Stat3 on DNA methylation and transcription.
a, Volcano plot showing the significant differentially methylated CpG sites (q-value < 0.01, difference > 10% or < -10%) between S3-/- and S3+/+ cells.
b and c, Scatter plot showing changes in expression and DNA methylation at active promoters (b) or enhancers (c) between S3+/+ and S3-/- cells. Red dots: genes for which both changes were statistically significant (q-value < 0.01). See Supplementary Table 2.
d, Gene tracks showing RRBS and RNA-seq data for S3+/+ 2iLIF, S3+/+ 2i and S3-/- 2iLIF cells over the Klf5 genomic region. One representative biological replicate out of two is shown.
e, Venn diagram of CpG sites whose methylation status is dependent on either LIF (light blue) or on Dnmt3a/b (red) or on both (gray intersection).
f, Percentage of DNA methylation at imprinted DMRs. n = 2 biological replicates for each sample. See Supplementary Table 2.
g, MeDIP-qPCR of DMRs and a control region (Kif27). Mock immunoprecipitations with a non-specific IgG antibody served as negative controls. Mean ±S.D. of n = 4 (Nnat, Kif27) or mean of n = 2 (Peg10) experiments, shown as dots.
h, Heatmap showing relative and absolute expression of imprinted genes associated to known DMRs (Fig. 2f) and differentially expressed between S3-/- and S3+/+ cells. Relative expression shown as z-scores of scaled values; absolute expression indicated on the right as average transcripts per million (TPM) values. n = 2 biological replicates for each sample.
All P values calculated by two-tailed unpaired t-test.
Given that Dnmt3a/b appeared functionally relevant for the regulation of 5mC levels downstream of LIF (Fig. 1g-i), we expected similar changes in DNA methylation in response to LIF stimulation or upon Dnmt3a/b inactivation. Strikingly, 98.9% of regions hypomethylated in 2iLIF were also hypomethylated in Dnmt3a/b dKO cells (Fig. 2e and Extended Data Fig. 2g-k), further indicating that Dnmt3a/b are epistatic to LIF/Stat3 for DNA methylation control.
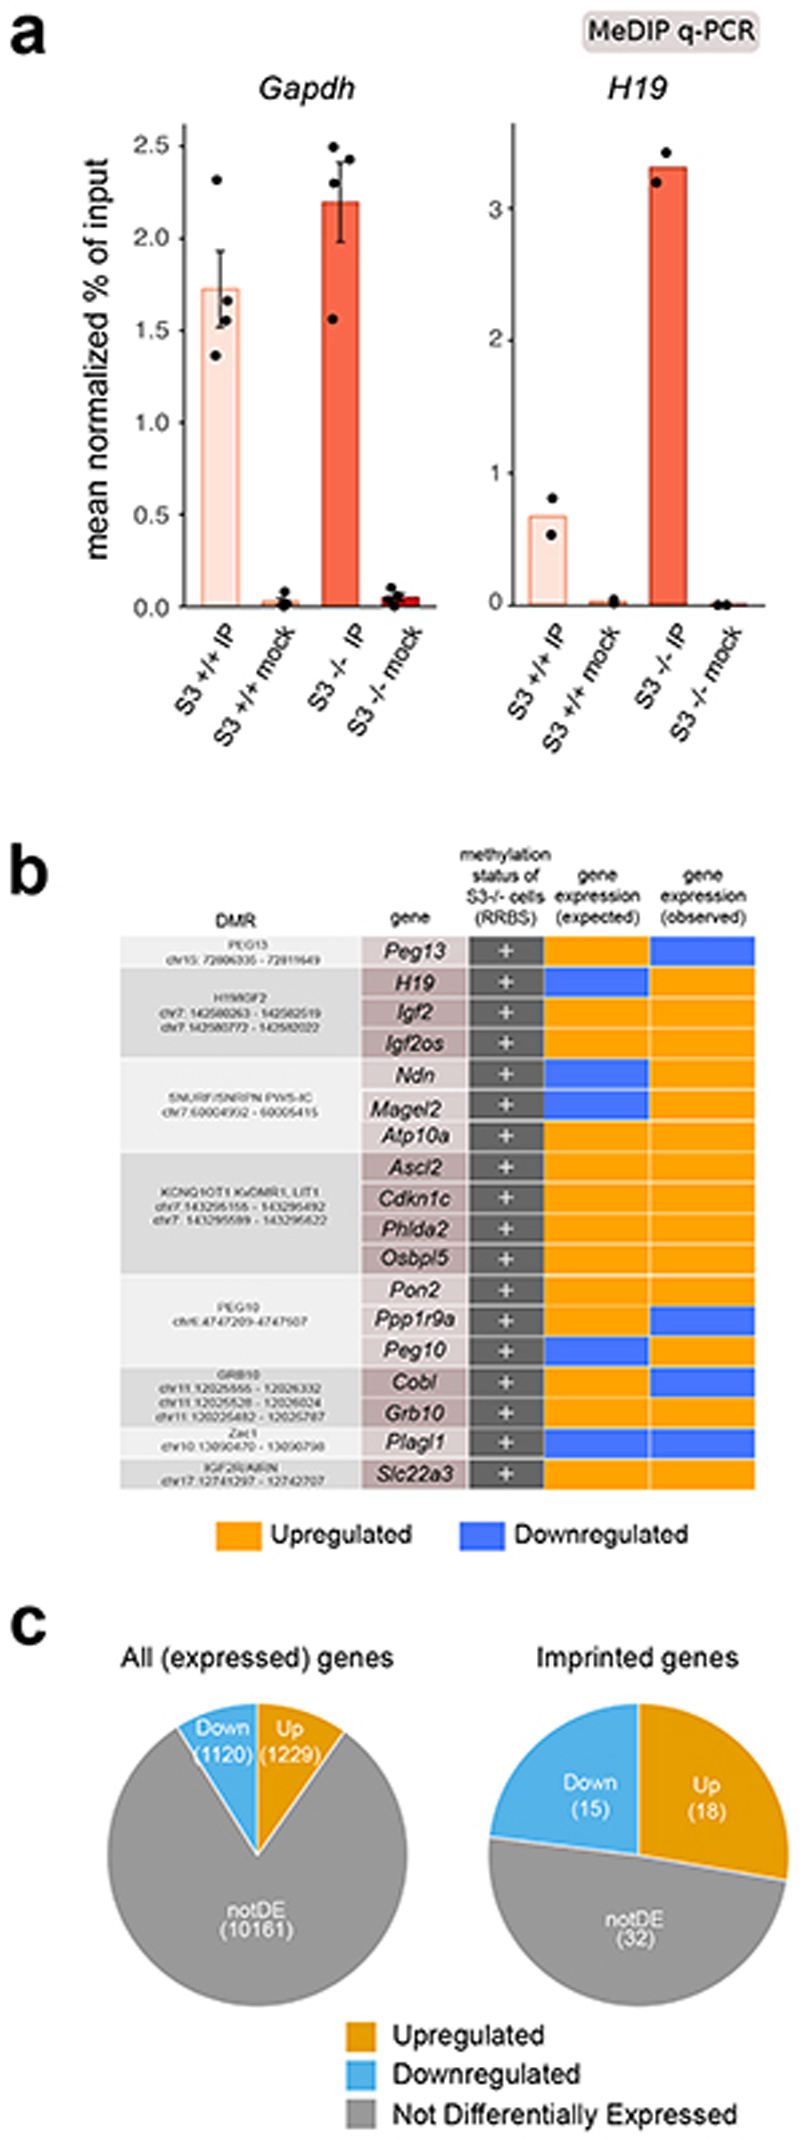
Imprinted genes are organized in clusters, under the control of Differentially Methylated Regions (DMRs)27,28. S3+/+ cells cultured long term in 2iLIF showed reduced levels of DNA methylation at imprinted DMRs, as reported14,29, while S3-/- cells retained higher levels of DNA methylation at 83.3% (20/24) of DMRs analyzed (Fig. 2f). These findings were confirmed by methylated DNA immunoprecipitation followed by quantitative PCR (MeDIP-qPCR, Fig. 2g and Extended Data Fig. 3a).
We checked the expression of transcripts associated to DMRs and found that 37% (20/54) of them were differentially expressed in S3-/- cells (Fig. 2h and Extended Data Fig. 3b). Considering all expressed imprinted genes, without taking into account DNA methylation information, 50.77% (33/65) were affected by Stat3 inactivation, while only 18.77% (2,349/12,510) of all expressed genes were differentially expressed, indicating that imprinted genes are preferentially regulated by Stat3 (Extended Data Fig. 3c, P value = 5.67 × 10⁻⁹, hypergeometric test).
We conclude that Stat3 regulates DNA methylation at promoters, enhancers and imprinted DMRs, with a concomitant change in expression of a fraction of their associated transcripts.
Stat3 controls DNA methylation via metabolic regulation
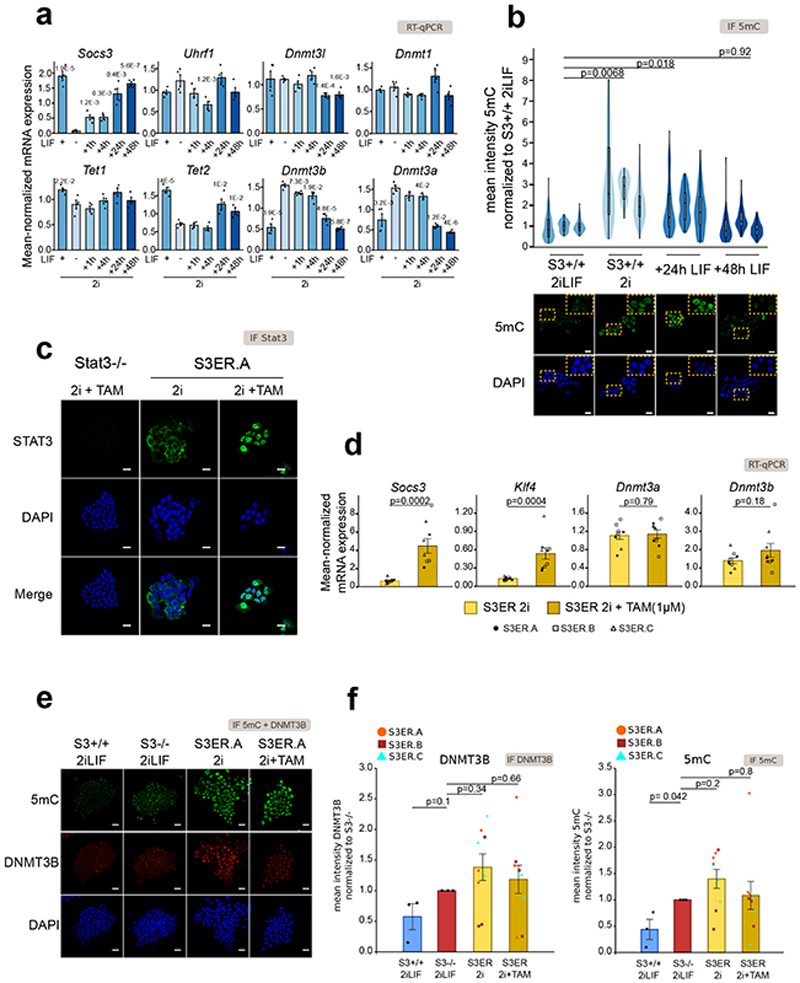
Next, we wanted to study the dynamics of LIF-induced effects on Dnmt3a/b and 5mC. We performed quantitative reverse-transcriptase PCR (RT-qPCR) on S3+/+ cells stably cultured in 2i (Fig. 3a) or acutely stimulated with LIF for 1, 4, 24 or 48 hours, starting from 2i. The addition of LIF resulted in repression of Dnmt3a/b, only after 24 hours. Consistently, we observed a mild decrease in 5mC levels after 24 hours, while at 48 hours the levels of 5mC were as low as those of cells stably cultured in 2iLIF (Fig. 3b).
Fig. 3. Nuclear Stat3 does not regulate Dnmt3a/b and 5mC.
a, Gene expression analysis of S3+/+ cells stably cultured in 2iLIF, in 2i or acutely stimulated with LIF or for 1 h, 4 h, 24 h or 48 h. Bars: mean ±s.e.m. of 4 experiments, shown as dots. P values relative to 2i are shown only when <0.05.
b, Anti-5mC immunofluorescence of S3+/+ cells cultured stably in 2iLIF or in 2i, and after LIF addition for 24 or 48 hours. Violin plots show the distribution of fluorescence intensity of an average of 86 nuclei per sample. Boxplots show 1st, 2nd and 3rd quartile. Whiskers indicate minimum and maximum values. n = 3 experiments. P values calculated on median values.
c, Anti-Stat3 immunofluorescence of S3-/- cells in 2i+TAM and one representative clone of S3ER cells in 2i or 2i+TAM. Representatives images of n = 3 independent experiments.
d, Gene expression analysis of three S3ER clones grown in 2i with or without Tamoxifen. Bars: mean ±s.e.m. of 3 experiments, shown as dots, squares or triangles.
e, Representative confocal images of n = 3 independent experiments are shown for S3+/+ and S3-/- cells in 2iLIF and one representative clone of S3ER cells cultured either in 2i or 2i+TAM, stained with anti-5mC and anti-Dnmt3b antibodies.
f, Quantification of anti-Dnmt3b (left) and anti-5mC (right) immunofluorescence of S3+/+ 2iLIF, S3-/- 2iLIF, and three S3ER clones in 2i with or without Tamoxifen. Bars: mean ±s.e.m. of n = 3 experiments for each S3ER clone, shown as dots, squares or triangles.
Scale bars: 20 μm. All P values calculated by two-tailed unpaired t-test.
The slow kinetics observed could indicate that Stat3 does not directly repress the transcription of Dnmt3a/b. We interrogated available Stat3 ChIP-seq data and could not detect binding at enhancers or promoters of Dnmt3a/b 30. Further, we expressed in S3-/- cells a Stat3 construct fused to an estrogen receptor domain (S3ER)31, which localizes to the nucleus and activates direct Stat3 targets Socs3 and Klf4 upon tamoxifen (TAM) treatment (31,32 and Fig. 3c-d). Neither Dnmt3a/b mRNA and protein levels, nor 5mC levels were changed (Fig. 3d-f), indicating the nuclear Stat3 does not regulate DNA methylation in ESCs.
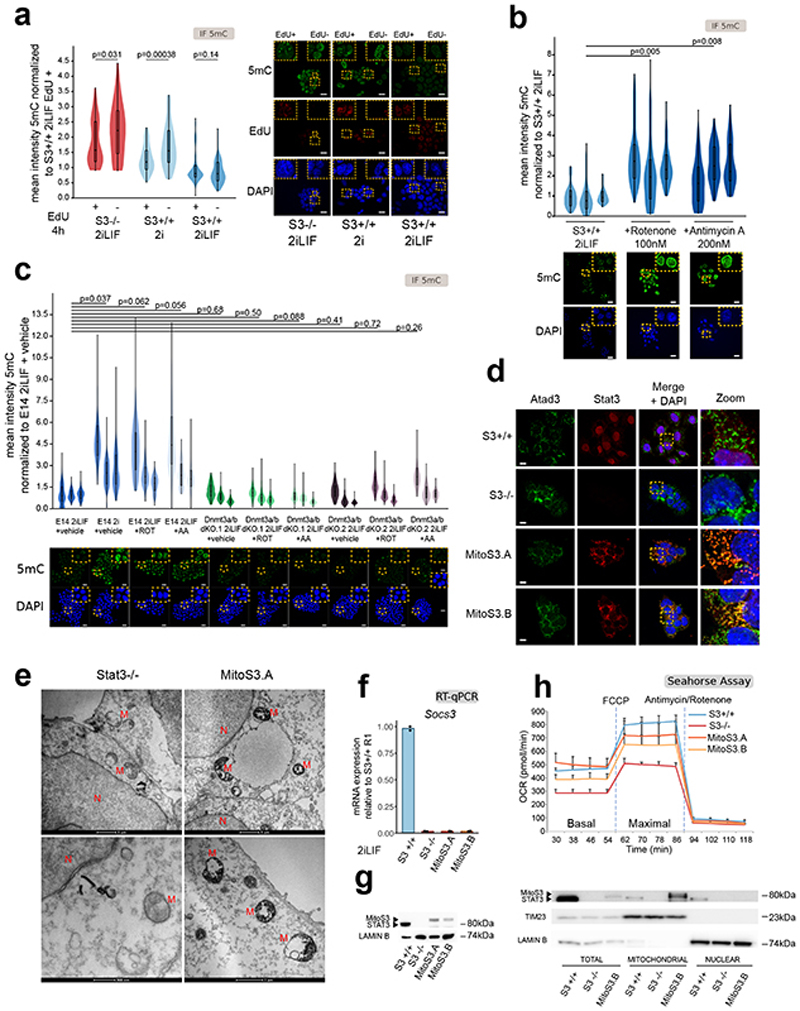
Given that Stat3 did not regulate Dnmt3a/b expression by a direct transcriptional mechanism, we sought for alternative mechanisms. Global 5mC levels could be affected by passive dilution occurring during genome replication. The LIF/Stat3 axis promotes ESCs proliferation19, thus reduced 5mC in S3+/+ cells in 2iLIF could be due to enhanced genome replication associated to proliferation. We tested this hypothesis by performing the EdU incorporation assay combined with 5mC immunostaining. For S3-/- cells in 2iLIF or S3+/+ cells in 2i, we observed that EdU positive cells that underwent genome replication within the last 4 hours showed an expected decrease in 5mC compared to EdU negative cells (Extended Data Fig. 4a), which never reached the levels of S3+/+ in 2iLIF. Moreover, 5mC levels in S3+/+ cells in 2iLIF were not affected by the EdU status, indicating that differences in cell proliferation can account only in part for the decrease in 5mC induced by LIF/Stat3.
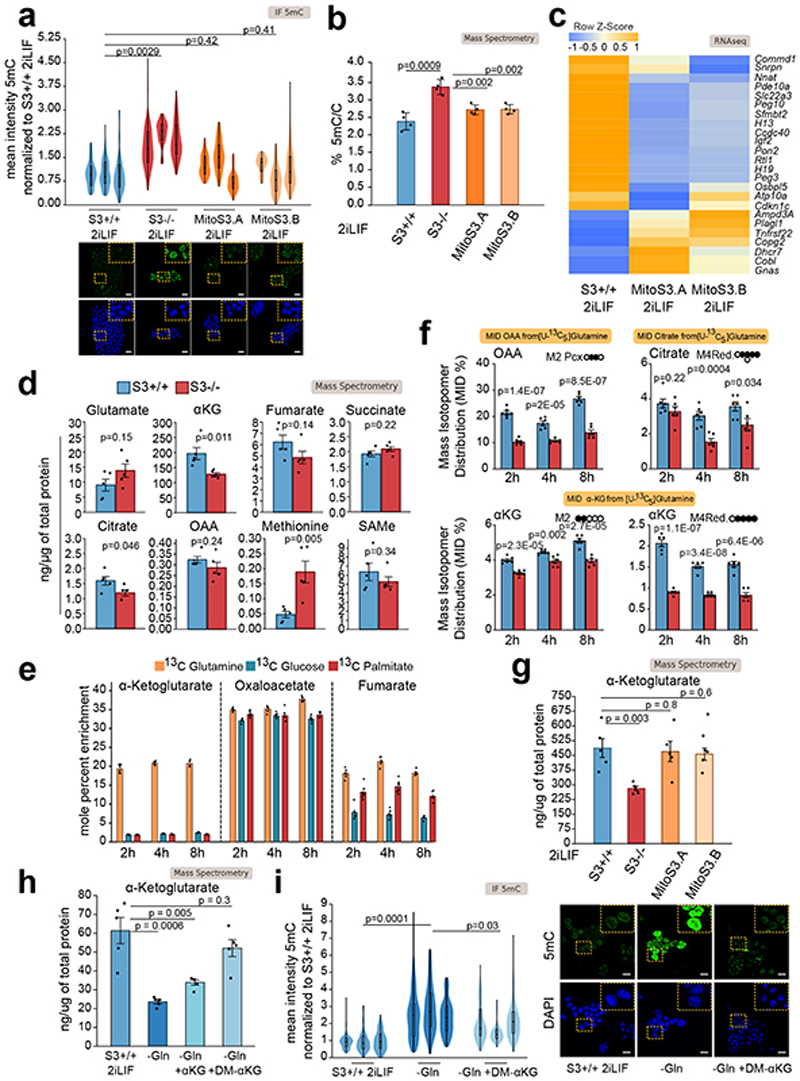
We then hypothesized that LIF/Stat3 might control 5mC levels via regulation of mitochondrial activity, given that it has previously been reported that S3-/- cells display reduced mitochondrial OXPHOS19,20. First, we treated S3+/+ cells with inhibitors of complexes I and III of the respiratory chain at concentrations that reduce OXPHOS in ESCs19 and observed a strong increase in 5mC signal (Extended Data Fig. 4b). Importantly, Dnmt3a/b dKO cells did not show any significant increase in 5mC upon inhibition of the respiratory chain (Extended Data Fig. 4c), further indicating that changes in 5mC are dependent on Dnmt3a/b in ESCs. Second, we expressed at endogenous levels a Stat3 construct targeted to mitochondria in S3-/- cells (Extended Data Fig. 4d-g and Source Data Extended Data Fig. 4)19,33. The two clonal lines, called MitoS3.A and MitoS3.B, showed increased OXPHOS (Extended Data Fig. 4h) and reduced 5mC (Fig. 4a-b) compared to parental S3-/- cells.
Fig. 4. Stat3 controls DNA methylation via metabolic regulation.
a, Anti-5mC immunofluorescence on S3+/+, S3-/- cells and MitoS3.A/B clones (see Extended Data Fig. 4d-h). Violin plots of an average of 55 nuclei per sample. n = 3 experiments.
b, Percentages of 5mC in the DNA of S3+/+, S3-/- cells and MitoS3.A/B clones in 2iLIF. Bars: mean ±S.D. of n = 4 biological replicates, shown as dots.
c, Imprinted transcripts differentially expressed (q-value < 0.1) between S3-/- cells and both MitoS3.A/B clones. Mean of 2 biological replicates were scaled and represented as z-score.
d, Quantification of metabolite abundance by LC-MS/MS; bars: mean ±s.e.m. of n = 5 biological replicates, shown as dots.
e, Metabolic tracing analysis of αKG, oxaloacetate (OAA) and fumarate. Barplots represent the percentage of marked carbon after provision of 13C glucose, glutamine or palmitate for 2 h, 4 h and 8 h. Bars: mean ±s.e.m. of 6 biological replicates.
f, Metabolic tracing analysis of OAA, citrate and αKG. Barplots show the percentage of labeled isotopomer 2 h, 4 h and 8 h after exposure to [U-13C5]-glutamine. Black circles 13C5-labeled carbons. Bars: mean ±s.e.m. of 6 biological replicates.
g-h, Quantification of αKG abundance measured by mass spectrometry; bars: mean ±s.e.m. of 5 biological replicates, shown as dots. In h S3+/+ cells cultured in 2iLIF with glutamine, without glutamine or without glutamine and supplemented with 2 mM αKG or 2 mM DM-αKG 2 mM for 9 days.
i, Anti-5mC immunofluorescence of S3+/+ cells cultured with glutamine, without glutamine or without glutamine and supplemented with 2 mM DM-αKG for 9 days. Violin plots of fluorescence intensity of an average of 96 nuclei per sample. n = 3 experiments.
All violin and boxplots indicate the 1st, 2nd and 3rd quartiles, with whiskers indicating minimum and maximum value. All P values calculated by two-tailed unpaired t-test. Scale bars: 20 μm.
Given that expression of imprinted transcripts is linked to 5mC levels on imprinted DMRs, we measured their expression in S3-/- and MitoS3 cells and found that 25 were differentially expressed (Fig. 4c). We conclude that the hypomethylation observed in 2iLIF is linked to robust OXPHOS of ESCs.
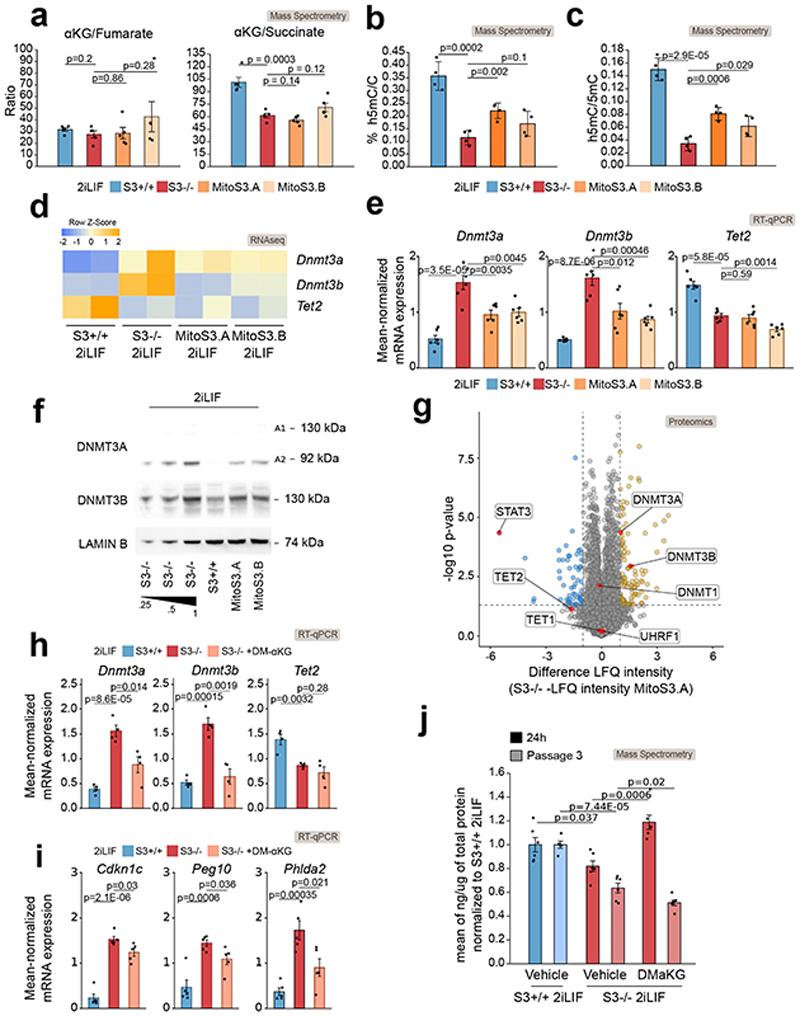
Mitochondrial activity affects the methylation profile of the nuclear genome, which implies that the two organelles communicate. We initially hypothesized that intracellular signaling molecules, such as calcium ions or reactive oxygen species (ROS) could be implicated, but we did not observe differences in their abundance between S3+/+ and S3-/- cells. We then reasoned that mitochondrial activity could influence the abundance of metabolites serving as donors, acceptors or cofactors of DNA methylation and oxidation22. Analysis of steady-state levels of metabolites revealed a decrease in alpha-ketoglutarate (αKG) in S3-/- cells (Fig. 4d). We also noticed a strong increment in methionine levels in S3-/- cells, however, nor S-adenosyl methionine (SAMe), the actual donor of methyl groups to DNA and histones, neither the enzymes involved in methionine/SAMe metabolism, such as MAT2A, MAT2B, AHCY and MTR were changed between S3+/+ and -/- (Supplementary Table 3), indicating that methionine/SAMe metabolism might not be involved in DNA methylation regulation downstream of Stat3.
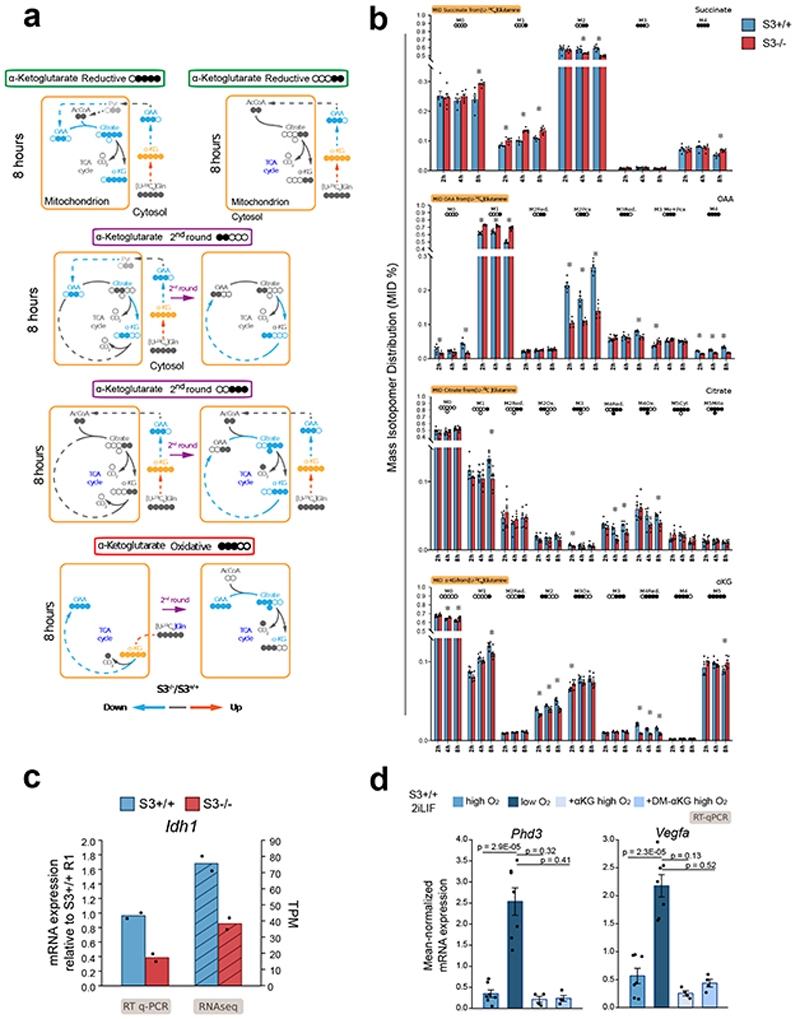
We then asked what carbon source was preferentially used by ESCs to produce αKG and performed metabolic flux analysis with 13C-labeled glucose, glutamine or palmitate (see Methods). As reported34, glutamine represented the main source for production (Fig. 4e). Glutamine is directly converted into glutamate and αKG, which in turn enters the tricarboxylic acid cycle (TCA) for energy production via oxidative metabolism. Analysis of specific isotopomers revealed a decrease in the oxidative glutamine pathway and TCA activity in S3-/- cells (Extended Data Fig. 5a-b, oxaloacetate, OAA M4 and citrate M4), in line with impaired OXPHOS (Extended Data Fig. 4h). Additionally, in the reductive glutamine pathway, glutamine is converted in the cytosol into TCA intermediates and acetyl-CoA, which is diverted to fatty acid biosynthesis. OAA obtained from cytosolic citrate cleavage is converted to aspartate or malate and then pyruvate, which feeds the TCA either directly or via conversion into OAA by pyruvate carboxylase. S3-/- cells showed impaired glutamine reductive pathway. Specifically, we detected a strong decrease of cytosolic OAA M3 and mitochondrial OAA M2 Pcx, citrate M2 and M4, αKG M2 and M4 (Fig. 4f and Extended Data Fig. 5a-b). In agreement with such observations, we found decreased expression of cytoplasmic isocitrate dehydrogenase 1 (IDH1, Extended Data Fig. 5c). These data indicate that reduced αKG levels detected in S3-/- cells are due to decreased flux of carbon from glutamine reductive metabolism re-entering the TCA cycle.
We hypothesized that robust αKG production from glutamine is required for genome hypomethylation. We measured αKG levels in cells expressing Stat3 only in mitochondria. Both MitoS3.A and MitoS3.B clones showed elevated αKG levels, not significantly different from S3+/+ cells (Fig. 4g). Both clones also showed reduced 5mC (Fig. 4a-b), further indicating that elevated αKG levels correlate with reduced DNA methylation.
To functionally test our hypothesis, we cultured S3+/+ cells in 2iLIF in the absence of glutamine. We first measured the endogenous levels of αKG in cells cultured in the absence of glutamine and found it strongly reduced (Fig. 4h) and observed a robust increase in 5mC (Fig. 4i). Next, we asked whether restoring endogenous αKG levels could result in reduced 5mC. We added back a cell-permeable form of αKG (DM-αKG) and we were able to reduce 5mC levels (Fig. 4h-i). Of note, DM-αKG has been reported to stabilize hypoxia-inducible factor 1-alpha (Hif1a) by inducing a pseudohypoxic state35, but this was not the case in ESCs (Extended Data Fig. 5d). In sum, our results indicate that efficient αKG production from glutamine induces low methylation levels of the nuclear genome.
αKG regulates Dnmt3a/b expression via the transcription factor Otx2
Next, we asked how αKG reduces 5mC levels in ESCs. Alpha-ketoglutarate functions as a cofactor for Tet oxidases22,36,37, thus S3-/- cells might display increased 5mC due to reduced Tet activity. In addition, it has been recently reported that the abundance of αKG inversely correlates with Dnmt3a/b expression levels38. Thus, S3-/- cells might show increased Dnmt3a/b expression and 5mC levels, because of reduced αKG levels. To investigate the relative contribution of these two possible mechanisms, we took advantage of our MitoS3 cells, where αKG levels were rescued to endogenous levels (Fig. 4g) and 5mC were decreased (Fig. 4a-b), without potentially confounding effects from nuclear Stat3.
Elevated αKG levels or, more precisely, high αKG/succinate and αKG/fumarate ratios are associated with increased Tet activity34,39–41. We found no significant differences in the αKG/fumarate ratio, while αKG/succinate ratio appeared equally low in S3-/- and MitoS3 cells relative to S3+/+ cells (Fig. 5a). We then measured h5mC and 5mC and used their ratio as a direct readout of Tets activity, which appeared low both in S3-/- and MitoS3.A/B compared to S3+/+ cells (Figs. 5b-c). Such results indicate that in S3-/- and MitoS3 cells Tets activity is similarly low, therefore it could hardly explain the differences in 5mC between S3-/- and MitoS3 cells (Fig. 4a-b). Such conclusions are in line with the lack of effect on 5mC observed upon Tet1/2 knockdown (Extended Data Fig. 1h-i).
Fig. 5. Alpha-ketoglutarate regulates 5mC mainly via control of Dnmt3a/b levels.
a-g, S3+/+, S3-/- cells and two MitoS3.A/B clones, cultured in 2iLIF, were analyzed.
a, αKG/fumarate and αKG/succinate ratios measured by mass spectrometry. Bars: mean ±s.e.m. of 5 biological replicates, shown as dots.
b, Percentages of h5mC. Bars: mean ±s.e.m. of 4 biological replicates, shown as dots.
c, h5mC/5mC ratio. Bars: mean ±s.e.m. of 5 biological replicates, shown as dots.
d-e, Expression analysis of enzymes controlling DNA methylation by RNA-seq (d) and qPCR (e).
d, Heatmap shows z-scores from scaled RNA-seq expression values. n= 2 biological replicates.
e, Bars: mean ±s.e.m. of n = 6 experiments, shown as dots.
f, Western blot for Dnmt3a, Dnmt3b and Lamin B, used as a loading control. Representative images of n = 2 independent experiments.
g, Proteomic analysis. Yellow and blue dots indicate proteins that are more or less abundant (difference > 1 or < -1 respectively, P value < 0.05) in S3-/- relative to MitoS3.A cells. n = 5 biological replicates. Source data in Supplementary Table 3.
h-i, Gene expression analysis of epigenetic modifiers (h) and imprinted genes (i) in S3+/+, S3-/- and S3-/- cells cultured in 2iLIF and treated with 2 mM DM-αKG for 4 passages. Bars: mean ±s.e.m. of n = 4 experiments, shown as dots.
j, Quantification of intracellular αKG abundance in S3+/+ cells and in S3-/- cells treated with vehicle or 2 mM DM- αKG for 24 h (dark bars) or for 3 passages (light bars). Bars: mean ±s.e.m. of n = 6 biological replicates, shown as dots.
All P values calculated using two-tailed unpaired t-test.
Next, we measured mRNA and protein levels of Dnmt3a/b by RNA-seq, RT-qPCR, western blot and proteomic analysis and found that both Dnmt3a/b mRNA and protein levels were reduced in MitoS3.A and MitoS3.B cells compared to S3-/- cells (Figs. 5d-g and Source Data Fig. 5), indicating that αKG could repress Dnmt3a/b expression.
We tested whether αKG negatively regulates Dnmt3a/b expression, by treating S3-/- cells with DM-αKG and observed a partial reduction of Dnmt3a/b expression (Fig. 5h) and of imprinted genes (Fig. 5i). Such partial effects are likely due to the inability of DM-αKG to stably rescue endogenous αKG levels in S3-/- cells (Fig. 5j).
We conclude that αKG decreases 5mC levels via reduction of Dnmt3a/b expression, in agreement with genetic perturbations showing that Dnmt3a/b levels dictate 5mC abundance (Fig. 1g-i and Extended Data Fig. 1f-g).
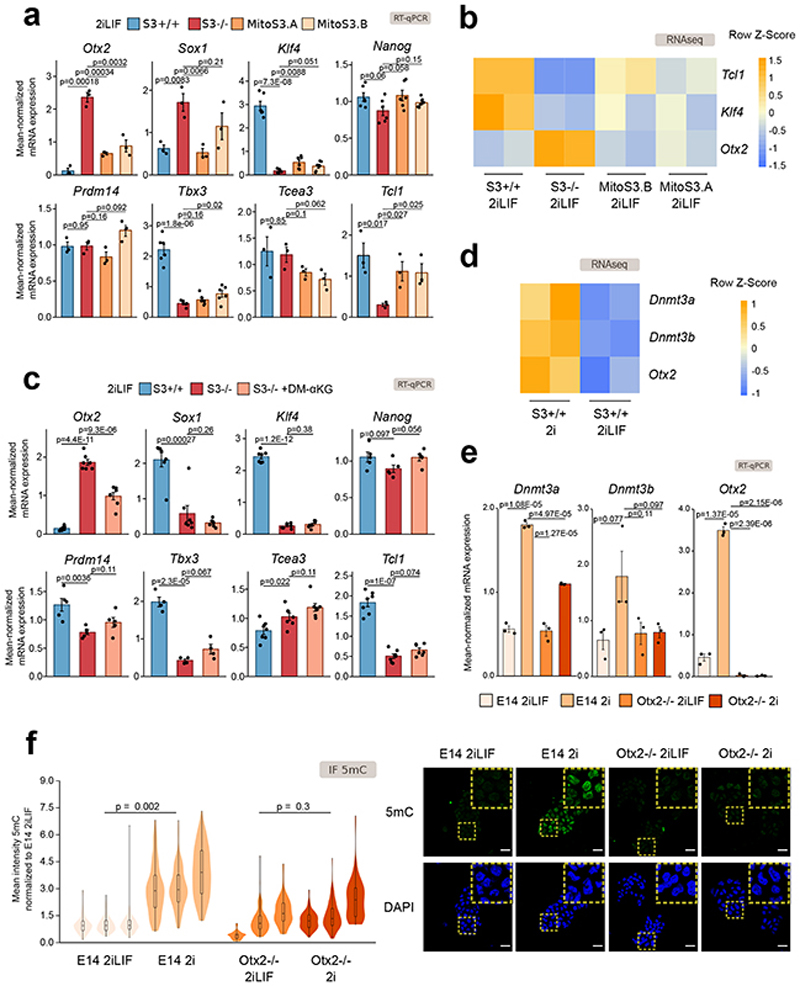
To clarify the molecular mechanism of how αKG controls the expression of Dnmt3a/b we explored literature and we analyzed a transcriptomic database42–44 of a large number of mouse ESC lines, in which single transcriptional regulators were either induced or repressed. From this survey, we identified two activators (Otx2, Sox1 45,46) and 6 repressors (Klf4, Nanog, Prdm14, Tbx3, Tcea3, Tcl1 47–51) of Dnmt3a/b.
We thus checked the expression levels of our candidate regulators in S3+/+ and S3-/- cells and observed that the activators Otx2 and Sox1 were upregulated in S3-/- cells, while the repressors Klf4, Tbx3 and Tcl1 were downregulated in S3-/- cells (Fig. 6a). Given that mitochondrial Stat3 expression increased endogenous αKG levels, and reduced Dnmt3a/b expression (Fig. 5d-e), we measured the expression of Dnmt3a/b potential regulators in MitoS3 cells and observed that only Otx2, Klf4 and Tcl1 expression was significantly affected by mitochondrial Stat3 (Fig. 6a-b). Finally, we treated S3-/- cells with DM-αKG and only Otx2 expression was significantly changed (Fig. 6c).
Fig. 6. Otx2 links α KG to Dnmt3a/b expression.
a-b, Expression analysis of S3+/+, S3-/-and MitoS3.A/B clones cultured in 2iLIF for potential Dnmt3a/b regulators.
a, RT-qPCR. Bars: mean ±s.e.m. of n = 3 for Otx2, Sox1, Prdm14, Tcea3, Tcl1; n = 6 for Klf4, Nanog, Tbx3 experiments, shown as dots.
b, Heatmap of RNA-seq data; n = 2 biological replicates. Z-scores of scaled expression values.
c, RT–qPCR of S3+/+, S3-/- and S3-/- cells cultured in 2iLIF and treated with 2 mM DM-αKG for 3 passages. Bars: mean ±s.e.m. of n = 7 for Otx2, Sox1, Klf4, Tcea3, Tcl1; n = 5 for Nanog, Prdm14; n = 4 for Tbx3 experiments, shown as dots.
d, Heatmap reporting expression of Dnmt3a, Dnmt3b and Otx2 in S3+/+ cultured in 2i with or without LIF; n = 2 biological replicates. Expression levels were scaled and represented as z-score.
e, RT–qPCR of E14 and Otx2-/- cells stably cultured in 2iLIF or 2i. Bars: mean ±s.e.m. of n = 3 experiments, shown as dots.
f, Anti-5mC immunofluorescence on E14 and Otx2-/- cells stably cultured in 2iLIF or 2i. Representative images and violin plots of fluorescence intensity of an average of 111 nuclei per sample. Boxplots show 1st, 2nd and 3rd quartile; Whiskers indicate minimum and maximum values. n = 3 experiments.
All P values calculated using two-tailed unpaired t-test. Scale bar: 20 μm.
Is Otx2 functionally required for Dnmt3a/b regulation downstream of LIF/Stat3? Wild-type ESCs in 2i showed a strong increase in Otx2 and Dnmt3a/b expression (Figs. 6d-e), relative to 2iLIF. This was accompanied by increased 5mC (Fig. 6f). If Otx2 is in fact crucial for Dnmt3a/b regulation, its genetic inactivation should render cells unable to upregulate Dnmt3a/b in the absence of LIF. We cultured Otx2-/- ESCs52 in 2i or 2iLIF and observed that Dnmt3a/b expression, as well as 5mC levels, were unchanged.
We conclude that Otx2 is regulated by the LIF/Stat3/αKG axis and that Otx2 is genetically required to boost Dnmt3a/b and 5mC levels in ESCs.
Mitochondrial Stat3 regulates ESC differentiation
Mitochondrial Stat3 reduces the levels of Otx2, Dnmt3a/b and 5mC, which are all molecular markers of early phases of ESC differentiation4,23,37,53–58. Therefore, we hypothesized that mitochondrial Stat3 might stabilize pluripotency and/or slow down differentiation.
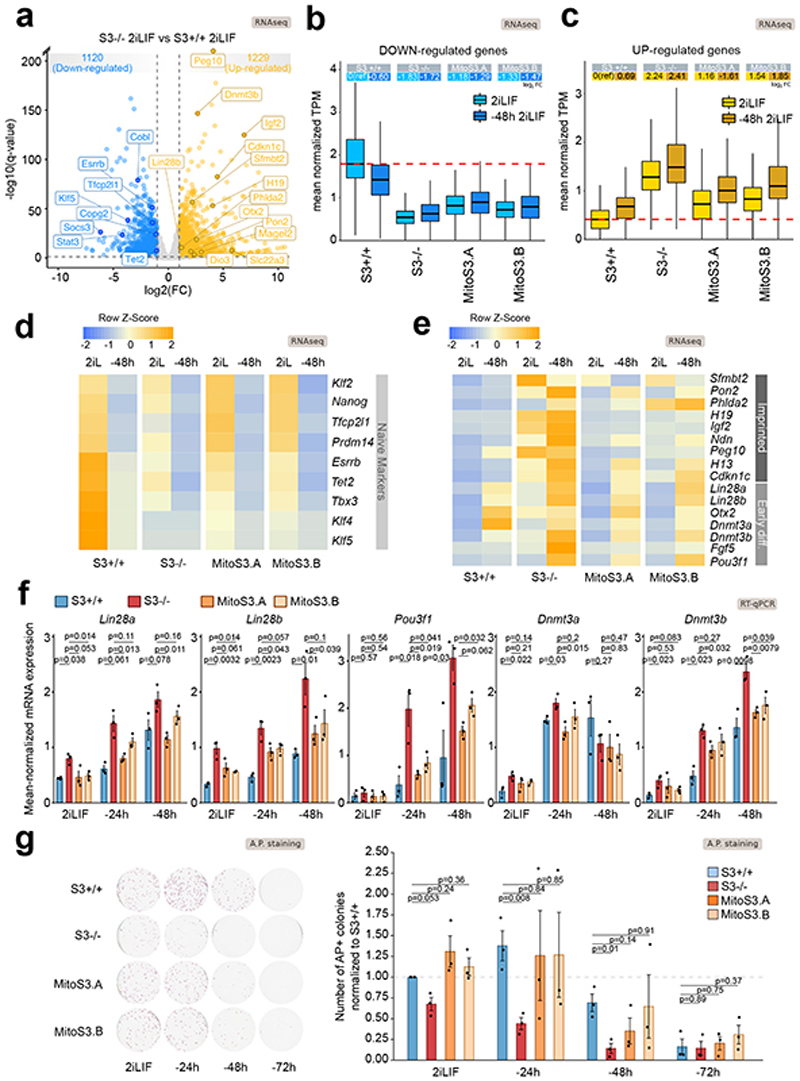
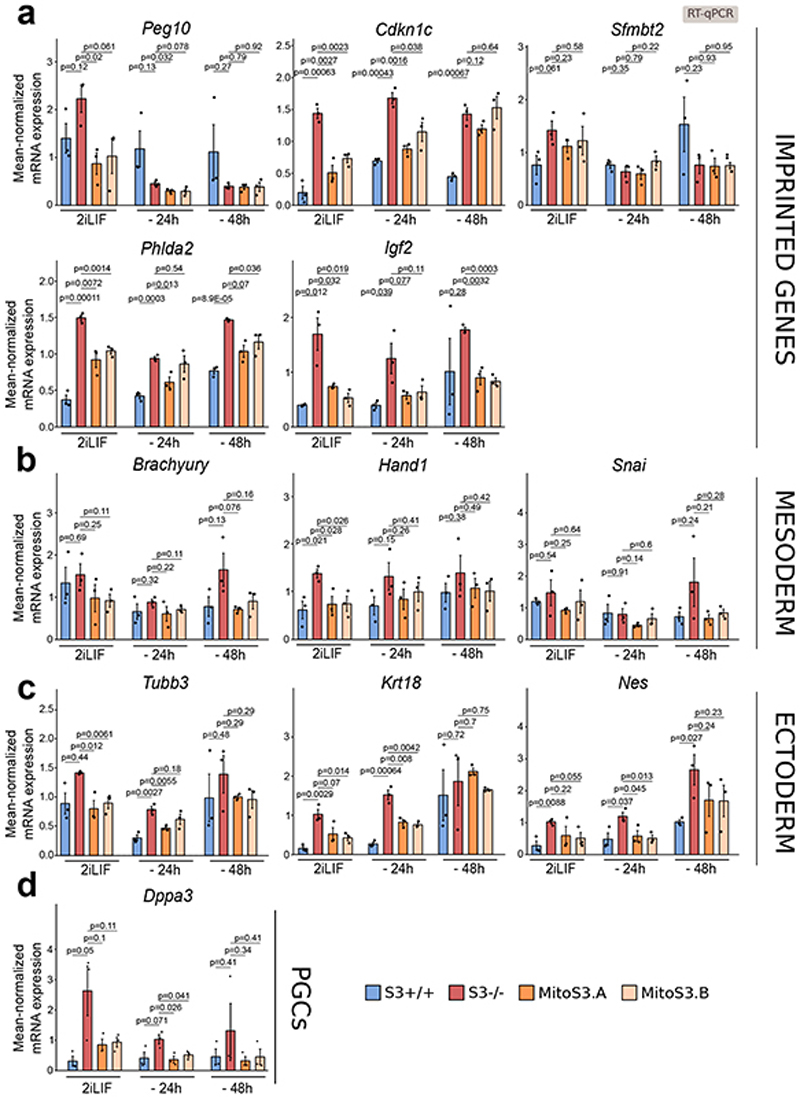
We generated transcriptomic data of cells either in 2iLIF or undergoing differentiation for 48 hours in the N2B27 basal medium. Genes significantly downregulated in S3-/- cells relative to S3+/+ (Fig. 7a, blue) were also downregulated during differentiation of S3+/+ cells (Fig. 7b). Several naïve pluripotency markers belong to this category (Fig. 7d). Similarly, genes found upregulated in S3-/- cells relative to S3+/+ (Fig. 7a, orange) were found upregulated in S3+/+ cells during differentiation (Fig. 7c), including several early differentiation markers and imprinted genes (Fig. 7e). Notably, S3-/- cells display a much faster upregulation of early differentiation and imprinted genes after 48 hours in N2B27 (Fig. 7e-f and Extended Data Fig. 6a-d). Furthermore, we performed a clonal assay of cells undergoing differentiation for up to 72 hours. In 2iLIF, the number of alkaline phosphatase positive (AP+) pluripotent colonies formed by S3-/- cells was mildly reduced relative to S3+/+ (Fig. 7g). However, after 24 and 48 hours of 2iLIF withdrawal, S3-/- cells formed dramatically fewer AP+ colonies than S3+/+ cells. Eventually, after 72 hours of 2iLIF withdrawal, both cell lines lost clonogenicity. Based on the faster transcriptional changes and the faster loss AP+ colonies we conclude that S3-/- cells exit more rapidly from the naïve pluripotent state.
Fig. 7. Mitochondrial Stat3 regulates ESC differentiation.
a, Volcano plot showing differentially expressed genes (log2 FC > 1 or < -1, q-value < 0.01, Benjamini-Hochberg adjustment) between S3+/+ and S3-/- cells. n = 2 biological replicates.
b-c, Boxplot reporting expression levels of downregulated (b) or upregulated (c) genes in S3-/- cells relative to S3+/+ cells. Each boxplot shows 1st, 2nd and 3rd quartile. Whiskers show minimum and maximum values. Cells were either analyzed in 2iLIF (light blue) and after 48 h of 2iLIF withdrawal (”-48h“). Upper table shows mean log2 FC relative to S3+/+ 2iLIF.
d-e, Heatmap of makers of naive pluripotency, early differentiation and imprinted genes. Expression levels were scaled and represented as z-score. n = 2 biological replicates.
f, Gene expression analysis by RT–qPCR of S3+/+ (blue), S3-/- (red) and two MitoS3.A/B (orange) clones cultured in 2iLIF or without 2iLIF for 24 h or 48 h (“-24h “ or “-48h “). Bars: mean ±s.e.m. of n = 3 experiments, shown as dots. P values calculated using two-tailed unpaired t-test relative to S3-/-. See Extended Data Figure 6.
g, Alkaline phosphatase (AP) staining in S3+/+, S3-/- and MitoS3.A/B clones cultured with 2iLIF or without 2iLIF for 24 h, 48 h or 72 h. Representative images and quantification of AP-positive colonies, relative to S3+/+ cells in 2iLIF. Mean ±s.e.m. of n = 3 experiments is shown. P values calculated using two-tailed unpaired t-test.
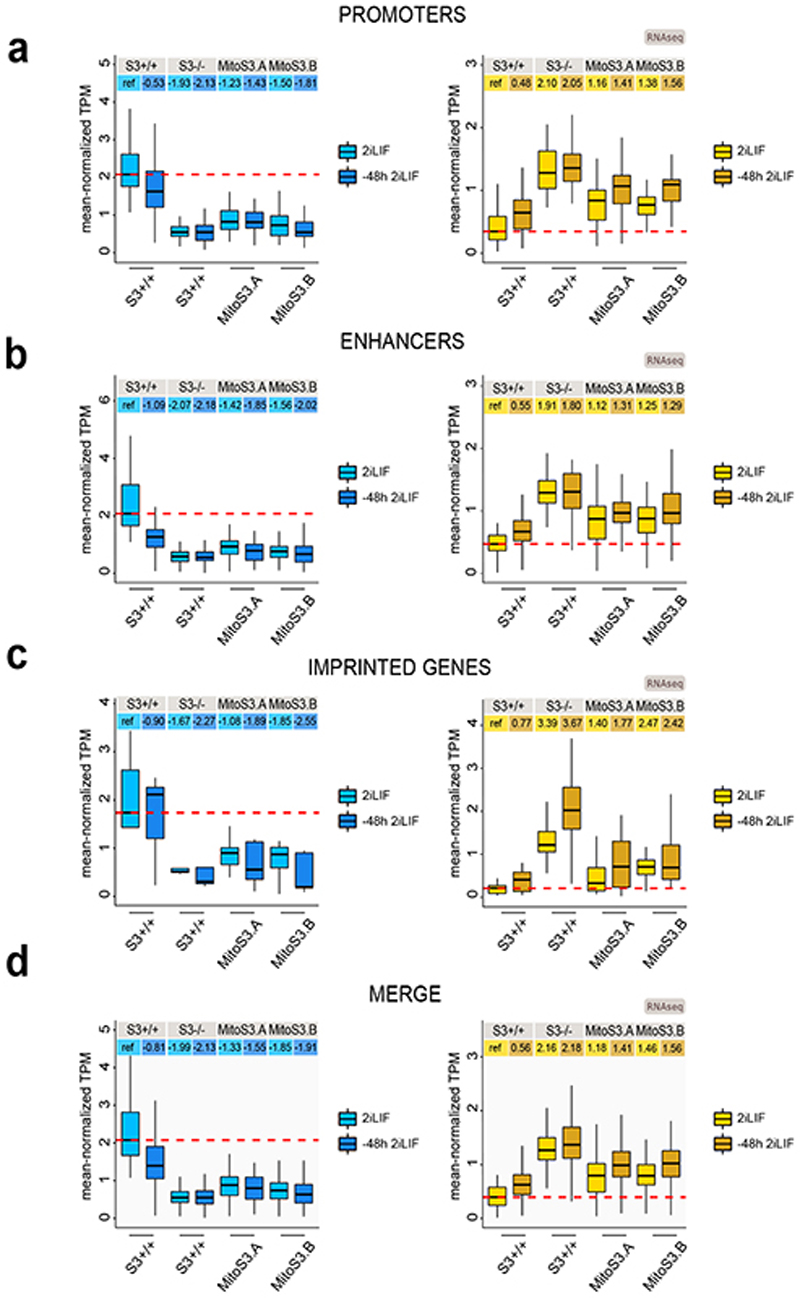
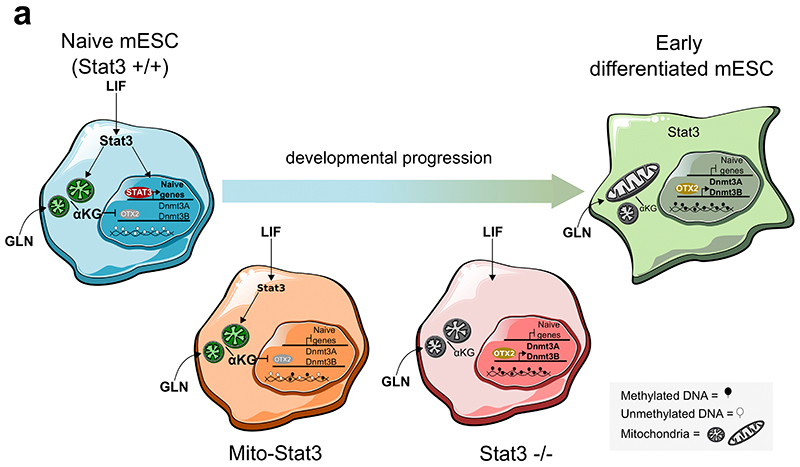
Such results could be explained by the canonical role of LIF and nuclear Stat3 as a transcriptional inducer of naïve pluripotency described by several laboratories9,11,59,60, rather than by mitochondrial Stat3. Thus, we asked whether the expression of Stat3 only in mitochondria would affect ESC differentiation. Transcriptionally, we observed that genes downregulated in S3-/- cells were only mildly affected by mitochondrial Stat3 (Fig. 7b, d). Conversely, early differentiation marker and imprinted genes were strongly reduced in MitoS3.A/B cells (Fig. 7c, e-f, Extended Data Fig. 7a-d). In clonal assays, mitochondrial Stat3 delayed the exit from naïve pluripotency (Fig. 7g). In conclusion, mitochondrial Stat3 represses early differentiation markers and delays differentiation of ESCs.
Stat3 regulates Dnmts and imprinted transcripts in early mouse blastocysts
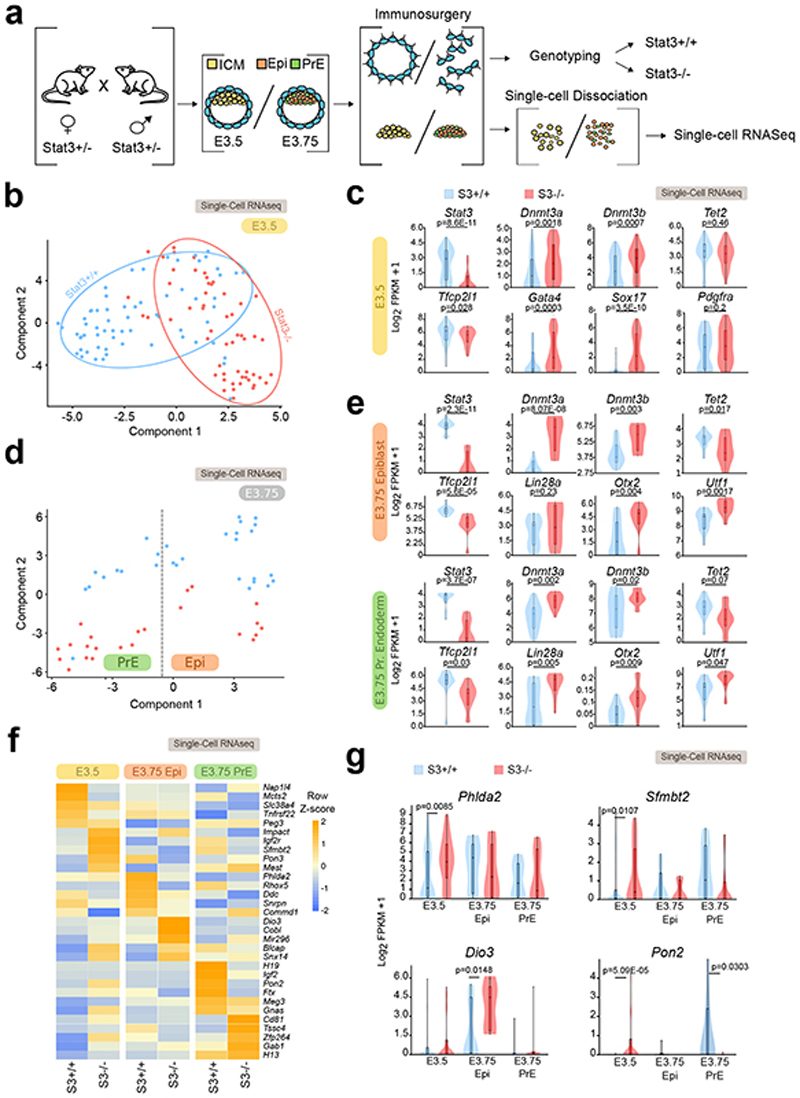
Next, we test the function of Stat3 in the early mouse embryo. We focused our attention on the early blastocysts at E3.5, because at this stage Stat3 is active7,8,10 and the genome is hypomethylated4,5 in naïve pluripotent cells of the inner cell mass (ICM). At E3.75, ICM cells are specified into pluripotent epiblast cells (Epi) or into extraembryonic primitive endoderm cells (PrE). Stat3 heterozygous mice were crossed and blastocysts at E3.5 and E3.75 were collected. Trophectoderm cells were removed by immunosurgery and used to genotype individual embryos. Single ICM, Epi and PrE cells were analyzed by RNA-seq (Fig. 8a).
Fig. 8. Stat3 regulates Dnmts and imprinted transcripts in early mouse blastocysts.
a, Outline of the strategy for isolation and profiling of single pluripotent cells. A total of 171 cells from 18 embryos were analyzed. See Supplementary Table 4.
b, t-SNE based on whole transcriptome of wild-type (S3+/+) and mutant (S3-/-) ICM cells collected at E3.5; each dot represents a single cell.
c, Violin plots showing the distribution of expression levels for selected markers.
d, t-SNE based on genome-wide expression of S3+/+ and S3-/- mouse cells collected at embryonic day E3.75; each dot represents a single cell.
e, Violin plots showing the distribution of gene expression levels of the indicated markers.
f, Heatmap reporting average expression levels of imprinted transcripts in three different embryonic populations (E3.5 ICM, E3.75 Epi, E3.5 PrE) from S3+/+ and S3-/- embryos. Expression values were scaled and represented as z-score. Only expressed imprinted genes (average FPKM >1) were analyzed.
g, Violin plots showing the distribution of expression of imprinted genes.
In all violin plots the boxplots show 1st, 2nd and 3rd quartile, while whiskers indicate minimum and maximum values. P values calculated with two-tailed unpaired t-test.
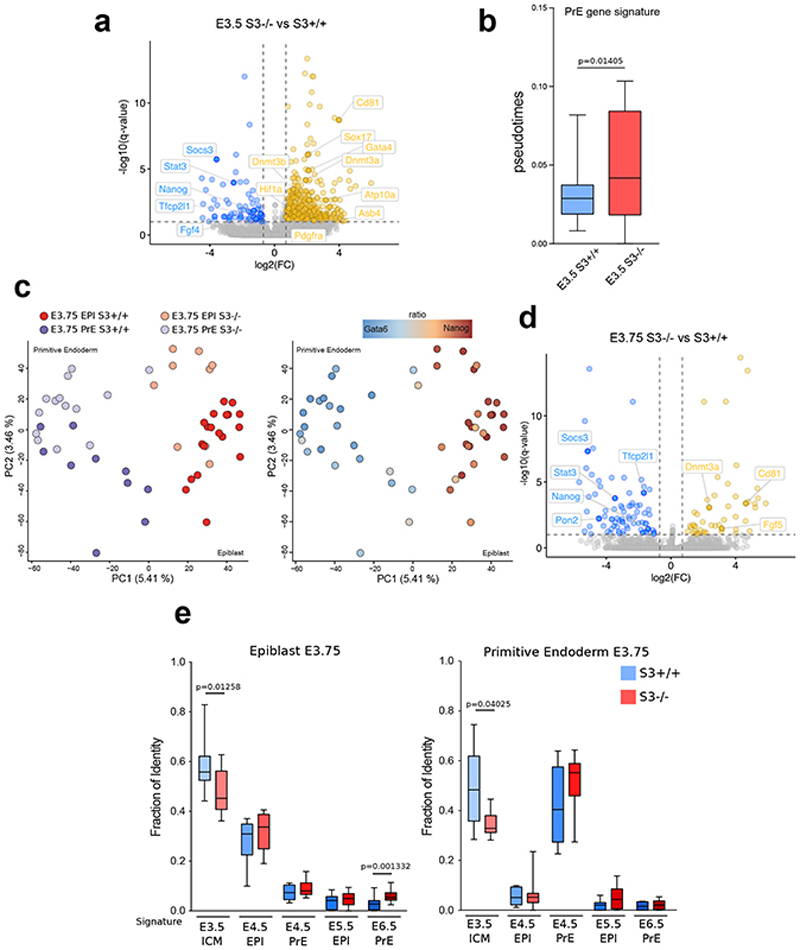
At E3.5, global analysis by t-distributed stochastic neighbor embedding (t-SNE) revealed that the transcriptomes of S3+/+ and S3-/- ICM cells were divergent (Fig. 8b). Differential expression analysis revealed that Stat3 and its targets Socs3 and Tfcp2l1 were downregulated in S3-/- cells (Fig. 8c and Extended Data Fig. 8a and Supplementary Table 4). Notably, Dnmt3a and Dnmt3b were upregulated in S3-/- ICM cells. Moreover, genes specifically expressed in PrE, such as Sox17, Gata4 and Pdgfra were precociously activate in S3-/- ICM cells (Fig. 8c Extended Data Fig. 8a-b).
Cells from E3.75 embryos could be classified as Epi or PrE according to specific markers (Fig. 8d and Extended Data Fig. 8c). In S3-/- embryos, Socs3 and Tfcp2l1 were significantly reduced in Epi cells at E3.75 (Fig. 8e and Extended Data Fig. 8d). Interestingly, markers of post-implantation epiblast, such as Utf1, Otx2 7,61and Dnmt3a/b were also upregulated in S3-/- cells, while genes associated with E3.5 ICM were downregulated (Fig. 8e and Extended Data Fig. 8e), further indicating accelerated developmental progression. Finally, we analyzed all imprinted transcripts expressed at E3.5 or E3.75 and observed global deregulation (Fig. 8f-g).
These results indicate that Stat3 regulates expression of Otx2 and its target genes Dnmt3a/b, and imprinted transcripts in the preimplantation blastocyst, indicating an altered pace of developmental progression.
Discussion
Mouse ESCs cultured in 2iLIF display low levels of 5mC and Dnmt3a/b, similarly to naïve pluripotent cells of the pre-implantation blastocyst-stage embryo. The hypomethylation observed in 2iLIF was previously attributed to the MEK inhibitor, which represses Dnmt3a/b expression14,15 via upregulation of Prdm14 17,42,43.
Our results indicate that mitochondrial Stat3 is also necessary for Dnmt3a/b downregulation in 2iLIF, given that Stat3-null cells in 2iLIF displayed high Dnmt3a/b levels, despite the presence of the MEK inhibitor, and expression of a mitochondrial Stat3 is sufficient to reduce Dnmt3a/b and 5mC levels. Prdm14 expression was not affected by Stat3 (Fig. 6a), overall indicating that Stat3 and Prdm14 are two independent negative regulators of Dnmt3a/b in 2iLIF.
Previous studies linked the hypomethylation of naïve ESCs in 2iLIF to reduced de novo DNA methylation activity14,15,17,48,49,62, in agreement with our genetic perturbation data. In contrast, the maintenance DNA methyltransferase Dnmt1 shows similar mRNA levels, protein levels and activity both in 2iLIF and Serum LIF14,15,17, indicating that the hypomethylation in 2iLIF is not due to reduced Dnmt1 activity. However, a recent study found that 2iLIF reduces protein levels of the Dnmt1 cofactor Uhrf1 and its locus-specific recruitment, leading to reduced DNA methylation maintenance on specific H3K9me2-enriched loci24.
Our results demonstrate that, in addition to reduced Dnmt1 activity, mitochondrial Stat3-dependent reduction of Dnmt3a/b is also crucial to induce genomic hypomethylation in 2iLIF.
In the embryo, Otx2 and Dnmt3a/b are expressed robustly only after implantation at E5.57, while Stat3 is active only in the pre-implantation blastocyst7. Genetic inactivation of Stat3 led to precocious expression of Otx2 and Dnmt3a/b, suggesting that Stat3 is needed to temporally restrict the expression of the post-implantation transcriptional program. Stat3-null embryos fail soon after implantation63. It would be interesting to test whether such embryonic lethality is due to accelerated development of Stat3-null embryos relative to maternal tissues.
Stat3 regulates imprinted gene expression in ESCs and in the early embryo. Several imprinted genes (e.g. Ddc, Gab1, Commd1, Cobl, Cd81) have been shown to regulate ESC differentiation64, suggesting that a balanced expression of imprinted genes could be critical for correct developmental progression.
Stat3 has been shown to act in different cellular compartments, as the nucleus, mitochondria and the endoplasmic reticulum20,21,65 and Stat3 has been implicated in the control of epigenetic modifications during somatic cell reprogramming31,66. It will be interesting to test from what organelle Stat3 regulates such processes.
Efficient conversion of αKG into glutamine in mouse ESCs has been attributed to 2i34. Moreover, αKG production from glutamine via Psat1 has been reported to decrease during ESC differentiation67. Our results complement and expand such studies, showing that glutamine is a major source of αKG production and that Stat3 predominantly regulates the reductive glutamine pathway, overall indicating that multiple metabolic pathways allow interconversion of αKG and glutamine, in line with the critical roles of both metabolites in fundamental processes such as proliferation, epigenetic regulations and differentiation34,38,68.
Of note, S3-/- cells show impaired mitochondrial respiration, a condition associated with enhanced reductive glutamine metabolism in cancer cells69, suggesting that aberrant activation of Stat3, or its upstream kinases JAKs, observed in several types of cancers might have an impact on glutamine metabolism under pathological conditions.
Long-term culture of female mouse ESCs in 2iLIF has been associated with decreased methylation at imprinted DMRs15,16,70,71 and reduction of MEK inhibitor concentration allowed to maintain robust methylation at DMRs over extensive culture. Similarly, we showed that in the absence of Stat3 ESCs maintain high methylation levels at DMRs after over 20 passages in 2iLIF, suggesting that tuning LIF/Stat3 activation might be important for the generation and long-term expansion of pluripotent cells with intact imprinting information.
Naïve ESCs are characterized by bivalent metabolism, a hypomethylated genome and high expression of specific transcription factors and epigenetic modifiers. Upon differentiation, OXPHOS is decreased, genome methylation is increased, naïve specific genes are downregulated and early markers of differentiation are upregulated, including Otx2 and Dnmt3a/b. We propose a model (Extended Data Fig. 9) whereby all these molecular processes are elegantly under the control of a single molecule, Stat3. While nuclear Stat3 directly induces and maintains the expression of naïve pluripotency factors, mitochondrial Stat3 promotes OXPHOS and αKG production, genome hypomethylation and inhibition of early differentiation markers. Such model explains previous observations, such as the inability of MitoS3 by itself to maintain long-term self-renewal19 and will be useful to test the role of LIF/Stat3 in pluripotent cells of other species and during induction of pluripotency.
Methods
Cell lines and culture routine
Wild type or Stat3 KO (described previously in13,19,63 and provided by A. Smith’s laboratory) mouse ESC lines were routinely cultured without feeders on gelatin-coated plates (0.2% gelatin, Sigma-Aldrich, cat. G1890). Media were changed every 2 days and cells were passaged when approaching confluency (every 2-3 days); to passage, cells were replated at required density following dissociation with either accutase (Thermo-Fisher, cat. A11105-01) or trypsin (Thermo-Fisher, cat. 15090-046). All cells were maintained at 37°C in humidified incubators with 5% CO2.
Media and supplements
Cells were grown under two different culture conditions, prepared as follows:
2i/2iLIF: serum-free KSR (knockout serum replacement) 10% (Life Technologies, cat. 10828-028) - based medium in GMEM (Sigma-Aldrich, cat. G5154) supplemented with 1% FBS (Sigma-Aldrich, cat. F7524), 100 mM 2- mercaptoethanol (Sigma-Aldrich, cat. M7522), 1× MEM non-essential amino acids (Invitrogen, cat. 1140-036), 2 mM L-glutamine, 1 mM sodium pyruvate (both from Invitrogen), and with small-molecule inhibitors PD (1 μM, PD0325901), CH (3 mM, CHIR99021) from Axon (cat. 1386 and 1408) and LIF (100 units/ml, produced in-house).
Serum LIF: GMEM (Sigma-Aldrich, cat. G5154) supplemented with 10% FBS (Sigma-Aldrich, cat. F7524), 100 mM 2-mercaptoethanol (Sigma-Aldrich, cat. M7522), 1× MEM non-essential amino acids (Invitrogen, cat. 1140-036), 2 mM L-glutamine, 1 mM sodium pyruvate (both from Invitrogen), and 100 units/ml LIF.
LIF induction
For LIF induction experiments, ESCs cultured in 2i without LIF for at least 4 passages were plated in 2i. Twenty-four hours after plating, LIF was added for the indicated amount of time (24 or 48 hours), cells were then fixed for immunofluorescence (described previously in19).
Treatments
For inhibition of the respiratory chain, cells were treated acutely with 100 nM complex I inhibitor rotenone (Sigma-Aldrich, cat. R8875) and 200 nM complex III inhibitor antimycin (Sigma-Aldrich, cat. A8674), as described previously in19.
For studies on glutaminolysis, cells were cultured in KSR-based medium prepared as described above, but without the addition of glutamine. Exogenous DM-αKG (dimethyl 2-oxoglutarate) used for treatments was added to culture medium at the indicated concentration and absorbed by cells as it is membrane-permeable (Sigma-Aldrich, cat. 349631-5G).
Clonal assay
The ability of single ESCs to form pluripotent colonies was assessed through a clonal assay. Cells were harvested by trypsinization and plated at clonal density; to do this, they were counted and diluted to obtain a final number of 600 cells/well. Cells were grown for 4-5 days before they were fixed and stained for alkaline phosphatase.
Differentiation assay
Cells were cultured with or without 2iLIF for 24, 48 and 72 hours. After 72 hours cells were detached and replated at clonal density in 2iLIF. Surplus cells were conserved for gene expression analysis. Finally, cells were stained for alkaline phosphatase after 5 days to evaluate the number of pluripotent cells. For AP staining, cells were fixed with a citrate-acetone-formaldehyde solution and stained using the alkaline phosphatase kit (Sigma-Aldrich, cat. 86R-1KT). Plates were scanned using a Nikon scanner and scored manually.
Immunofluorescence and stainings
For 5mC staining, cells were fixed in 4% formaldehyde (Sigma-Aldrich, cat. F8775) for 10 minutes, then washed in PBS and treated for 15 minutes with NH4Cl. Next, cells were permeabilized with 1 h PBST 0.5% treatment (PBS, 0.5% Triton X-100, Sigma-Aldrich, cat. 93443) and 2 N HCl was added for 45 minutes to denature the DNA. Cells were blocked for 1 hour in 5% horse serum (HS) with 0.3% PBST (Thermo-Fisher, cat. 16060122) and then incubated overnight at 4°C with anti-5mC primary antibody (Eurogentec, cat. BI-MECY-0500, Supplementary Table 5) diluted in 2% HS with 0.3% PBST. After washing with PBST 0.1%, cells were incubated with secondary antibody (Alexa Fluor 488 1:500, ThermoFisher, A-21202, donkey anti-mouse IgG) for 45 minutes at room temperature (RT). Nuclei were stained with mounting medium Fluoroshied containing 4′,6-diamidino-2-phenylindole (DAPI, Sigma-Aldrich, cat. F6057).
For EdU staining, cells were exposed to an EdU (5-ethynyl-2’-deoxyuridine: nucleoside analogue of thymidine incorporated into DNA during active DNA synthesis) pulse of 4 hours before fixation in 4% formaldehyde for 10 minutes; samples were then processed according to manufacturer’s instructions (Life Technologies).
For Atad3 and Stat3 colocalization staining, cells were fixed for 10 minutes in 4% formaldehyde, washed in PBS and blocked and permeabilized for 1 hour in 5% horse serum (HS) with 0.3% PBST. Cells were incubated overnight at 4°C with primary antibodies (Supplementary Table 5). After washing with 0.1% PBST, cells were incubated with secondary antibodies (Alexa Fluor 568 1:500, ThermoFisher, A-11036, donkey anti-mouse IgG and Alexa Fluor 488 1:500, ThermoFisher, A-21206, goat anti-rabbit IgG) for 30 minutes at RT. Nuclei were stained with mounting medium Fluoroshied containing DAPI.
Images were acquired with a Leica SP5 or a Zeiss LSM 700 confocal microscope equipped with a CCD camera. Fluorescence intensity was quantified using the freely available software Fiji (http://fiji.sc/Fiji).
RNA-seq
Total RNA was isolated using Total RNA Purification kit (Norgen Biotek, cat. 37500) and sequenced using an Illumina HiSeq4000, in 150-bp, paired-end format.
Reads were aligned to mouse transcriptome (Mus musculus transcriptome generated by rsem-prepare-reference with ENSEMBL93 GTF) and mouse genome (GRCm38.p6) using HISAT2 (v. 2.1.0).
Gene expression levels were quantified with RSEM (v. 1.3.1) using transcriptome alignments. Genome alignment was used to create bigWig files using deeptools (v. 3.2.1).
Genes were sorted based on average expression calculated in a total of 18 samples, and final expression matrix was generated excluding genes that had an average expression lower than 22.88 raw counts; after applying this filter, we obtained expression of 12,510 genes.
All RNA-seq analyses were carried out in R environment (v. 3.5.3) with Bioconductor (v. 3.7)
We computed differential expression analysis using the DESeq2 R package (v. 1.24.0,73); DESeq2 performs the estimation of size factors, the estimation of dispersion for each gene, and fits a generalized linear model. Transcripts with absolute value of log2-fold change > 1 and with an q-value (Padj) < 0.01 (Benjamini-Hochberg adjustment) were considered significant and defined as differentially expressed (differentially expressed genes = DEG) for the comparison in the analysis.
Heatmaps were made using TPM values with the pheatmap function from pheatmap R package (v.1.0.12, distance = ‘correlation’, scale = ‘row’) on DEGs or selected markers.
Volcano plots were computed with log2 fold change and −log10Padj from DESeq2 differential analysis output using ggscatter function from ggpubr R package (v. 0.2).
See also Supplementary Table 1.
Metabolites analysis by mass spectrometry
Cells were grown in 6-well plates, harvested in ice-cold PBS and centrifuged at 500 g for 3 minutes at 4°C. Pellets were then resuspended in 250 μl methanol/acetonitrile 1:1 containing [U-13C6]-glucose and [U-13C5]-glutamine each at 1 ng/μl (internal standards, Sigma-Aldrich, cat. 389374) and centrifuged at 20,000 g for 5 minutes at 4°C. Supernatants were then passed through a regenerated cellulose filter, dried and resuspended in 100 μl of methanol for subsequent analysis.
Metabolomic data analyses were performed on an API-4000 triple quadrupole mass spectrometer (Sciex) coupled with a HPLC system (Agilent) and CTC PAL HTS autosampler (PAL System) and on API3500 (Sciex). All the methods have been arranged by setting multiple ion monitoring (MRM) with pure commercial standards in order to confirm the identity of all metabolites.
Quantification of different metabolites was performed with a liquid chromatography/tandem mass spectrometry (LC-MS/MS) method using a C18 column (Biocrates) for amino acids and SAMe and cyano-phase LUNA column (50 mm × 4.6 mm, 5 μm; Phenomenex). Methanolic samples were analyzed by a 10 minutes run in positive (amino acids and SAME) and 5 minutes run in negative (all other metabolites) ion mode with specific multiple reaction monitoring (MRM) transitions. Amino acid quantification was performed through the previous derivatization. Briefly, 50 μl of 5% phenyl isothiocyanate (PITC) in 31.5% ethanol and 31.5% pyridine in water were added to 10 μl of each sample. Mixtures were then incubated with PITC solution for 20 min at RT, dried under N2 flow and suspended in 100 μl of 5 mM ammonium acetate in methanol/H2O 1:1. The mobile phases for positive ion mode analysis (amino acids and SAMe) were phase A: 0.2% formic acid in water and phase B: 0.2% formic acid in acetonitrile. The mobile phase for negative ion mode analysis (all other metabolites) was phase A: water and B: 2 mM ammonium acetate in methanol. The gradient was 90% B for all the analysis with a flow rate of 500 μl/min. MultiQuantTM software (version 3.0.2) was used for data analysis and peak review of chromatograms. Quantitative evaluation of all metabolites was performed based on calibration curves with pure standards, then the data were normalized on total protein content.
Metabolic flux analysis
For metabolic tracing analyses, cells were exposed for 24 h to [U-13C6]-glucose 1 mM (Sigma-Aldrich, 389374) or [U-13C5]-glutamine 2 mM (Sigma-Aldrich, cat. 605166) or [U-13C16]-palmitate 100 μM (Sigma-Aldrich, cat. 605573). Cells were harvested in ice-cold PBS and centrifuged at 500 g for 3 minutes at 4°C. Pellets were then resuspended in 250 μl methanol/acetonitrile 1:1 and spun at 20,000 g for 5 min at 4°C. Supernatant were then passed through a regenerated cellulose filter, dried under N2 flow and resuspended in 100 μl of methanol for subsequent analysis. Metabolomic data analyses were performed on an API-4000 triple quadrupole mass spectrometer (Sciex) coupled with a HPLC system (Agilent) and CTC-PAL HTS autosampler (PAL System). The identity of all metabolites was confirmed using pure standards. Quantification of different metabolites was performed with a liquid chromatography/tandem mass spectrometry (LC-MS/MS) method using a cyano-phase LUNA column (50 mm × 4.6 mm, 5 μm; Phenomenex) Methanolic samples were analyzed by a 5 min run in negative (Metabolites) ion mode. The mobile phases for negative ion mode analysis were phase A: 2 mM ammonium acetate in methanol and phase B: water. The gradient was 90%A for all the analysis with a flow rate of 500 μl/min. MultiQuantTM software (version 3.0.2) was used for data analysis and peak review of chromatograms. Samples were analyzed after 8 hours of 13C-labeling to ensure that isotopic equilibrium was reached, as previously shown in ESCs cultured in 2iLIF by Carey and colleagues34. All detected 13C-labeled metabolites were corrected for natural isotope abundances.
Reduced representation bisulfite sequencing (RRBS)
RRBS was performed as previously described in74. Briefly, 500 ng of DNA was digested at 37°C with 200 U of MspI restriction endonuclease (NEB). Digested DNA was than end repaired, dA-tailed, and ligated to methylated adapters, using the Illumina TruSeq DNA Sample Prep Kit, following manufacturer’s instructions. Adapter-ligated DNA was loaded on 2% agarose gel and a fraction from 200 to 400 bp was recovered. Purified DNA was then subjected to bisulfite conversion using the EpiTect Bisulfite Kit (Qiagen). Bisulfite-converted DNA was finally enriched by 15 cycles of PCR using Kapa HiFi HotStart Uracil (Roche).
RRBS data processing and analysis
After quality controls, sequencing reads were mapped to mouse genome reference (mm10/GRC.m38.p6) with BSMAP (v2.89)75 using RRBS mode (parameters: -s 12 -D C-CGG -v 0.01 –n 1). CpG methylation levels were extracted from aligned reads as the ratio of the number of Cs over the total number of Cs and Ts using the methratio.py script. CpG methylation ratios from both strands were combined (parameters: –g). For downstream analysis, the CpG sites that were commonly covered in at least one technical replicate of each sample with a minimum sequencing depth of 10× were retained. All samples were processed identically.
Statistical analyses were conducted within the R software environment. Differential methylation analysis at single nucleotide resolution was performed for each comparison (i.e. S3+/+ 2iLIF vs S3 -/- 2iLIF; S3+/+ 2i vs S3 +/+ 2iLIF; Dnmt3a/b dKO.1 and dKO.2 2i vs E14 2i; 2iLIF vs 2i E14) using the methylKit R/Bioconductor package76, exploiting the logistic regression approach for testing replicates (calculateDiffMeth function with default parameters). CpG sites with absolute methylation difference > 10% and q-value ≤ 0.01 were considered as differentially methylated. Correlation analysis between the effect of LIF and Dnmt3a/b on CpG methylation was performed on the methylation difference of each condition with respect to 2i-cultured wild type cells using the cor.test R function.
For the study of DNA methylation levels on regulatory elements, ChIP-seq data of histone marks (H3K27ac and H3K4me3) generated in E14 ESCs were retrieved from ENCODE (https://www.encodeproject.org/). Active promoters and enhancers were defined from processed peaks data as following:
Promoters: H3K4me3 peaks in a 2-kb window centered in the TSS of annotated genes (GENCODE release M20);
Enhancers: distal H3K27ac peaks (more than 1-kb up/downstream the nearest TSS).
Differential methylation analysis (calculateDiffMeth function, q-value ≤ 0.05, methylation difference > 10%) was performed on these regions (i.e., testing all the covered CpGs overlapping with the ChIP-seq peaks, with 200 bp of flanking region) for the comparisons: S3+/+ 2iLIF vs S3 -/- 2iLIF and S3+/+ 2i vs S3 +/+ 2iLIF. These results were then integrated with RNA-seq data. After performing differential expression analysis, the fold-change in gene expression levels was visualized against the average changes in DNA methylation levels of promoters/enhancers. Similar analyses were conducted on a manually curated list of imprinted DMRs. (See also Supplementary Table 2).
Single-cell RNA-seq analysis of Stat3-/- and +/+ embryos
Immunosurgery and single-cell dissociation was performed as described in7. The method for single-cell RNA-seq and library preparation was previously described in77. A total of 171 cells from 18 embryos were analyzed.
Experiments were performed in accordance with EU guidelines for the care and use of laboratory animals, and under authority of UK governmental legislation. Use of animals in this project was approved by the ethical review committee for the University of Cambridge, and relevant Home Office licenses are in place.
Mus musculus GRCm38.87 gene annotation and mm10 genome sequence were downloaded from Ensembl (https://www.ensembl.org/index.html). All reads were aligned using Spliced Transcripts Alignment to a Reference (STAR, v. 2.5.2b)77. Alignments to gene loci were quantified with htseq-count (v. 0.11.0)78 based on annotation from Ensembl 87. PCA outliers were computed and removed. Mouse embryo data for E4.5, E5.5 and E6.5 stages were compiled from earlier studies10,79.
Principal component analysis was based on log2 FPKM values computed with the Bioconductor package DESeq (v. 1.42.0)80, custom scripts and FactoRmineR package (v. 2.3)81. t-SNE clustering was computed with monocle package (v. 2.18.0). Differential expression analysis was performed with DESeq2 package (v. 1.24.0) following pre-processing of raw counts with zinbwave package (v. 1.12.0), which allows to extract low-dimensional signal from zero-inflated data, as described in82, that fits individual error models for assessment of differential expression between groups of cells. Fractional identity between E3.5/E3.75 S3 +/+ and S3 -/- cells and embryo stages (E4.5 Epi, E5.5 Epi and E6.5 Epi) was computed using R package DeconRNASeq (v. 1.32.0)83 which makes use of quadratic programming to estimate the proportion of distinctive types of tissue. The average expression of the embryo stages was used as “signature “ dataset. (See also Supplementary Table 4).
Proteomics
All the experiments have been performed in a labeling-free setting. For each sample, 50 mg of total cellular protein extract were precipitated overnight at 4°C in acetone, then reduced and alkylated in a solution of 6 M guanidine-HCl, 5 mM TCEP, and 55 mM chloroacetamide. Peptides were obtained digesting proteins with LysC (WAKO) for 3 h at 37°C and with the endopeptidase sequencing-grade trypsin (Promega) overnight at 37°C. Collected peptide mixtures were concentrated and desalted using the Stop and Go Extraction (STAGE) technique84.
Instruments for LC-MS/MS analysis consisted of a NanoLC 1200 coupled via a nano-electrospray ionization source to the quadrupole-based Q Exactive HF benchtop mass spectrometer85. Peptide separation was carried out according to their hydrophobicity on a PicoFrit column, 75 mm ID, 8Um tip, 250 mm bed packed with Reprosil-PUR, C18-AQ, 1.9-mm particle size, 120-Å pore size (New Objective, Inc., cat. PF7508-250H363), using a binary buffer system consisting of solution A: 0.1% formic acid and B: 80% acetonitrile, 0.1% formic acid. Runs of 120 min, after loading, were used for proteome samples, with a constant flow rate of 300 nl/min. After sample loading, run start at 5% buffer B for 5 min, followed by a series of linear gradients, from 5% to 30% B in 90 min, then a 10 min step to reach 50% and a 5 min step to reach 95%. This last step was maintained for 10 min.
Q Exactive HF settings: MS spectra were acquired using 3E6 as an AGC target, a maximal injection time of 20ms and a 120,000 resolution at 200 m/z.
The mass spectrometer operated in a data-dependent Top20 mode with subsequent acquisition of higher-energy collisional dissociation (HCD) fragmentation MS/MS spectra of the top 20 most intense peaks. Resolution, for MS/MS spectra, was set to 15,000 at 200 m/z, AGC target to 1E5, max injection time to 20 ms and the isolation window to 1.6 Th. The intensity threshold was set at 2.0 E4 and Dynamic exclusion at 30 seconds.
All acquired RAW files were processed using MaxQuant (1.6.2.10) and the implemented Andromeda search engine. For protein assignment, spectra were correlated with the UniProt mouse database (v. 2019) including a list of common contaminants. Searches were performed with tryptic specifications and default settings for mass tolerances for MS and MS/MS spectra. Carbamidomethyl at cysteine residues was set as a fixed modification, while oxidations at methionine, acetylation at the N-terminus were defined as variable modifications. The minimal peptide length was set to seven amino acids, and the false discovery rate for proteins and peptide-spectrum matches to 1%. For label free quantification (LFQ), minimum ratio count was set as 1. The match-between-run feature with a time window of 1 min was used. For further analysis, the Perseus software (1.6.2.3) was used and first filtered for contaminants and reverse entries as well as proteins that were only identified by a modified peptide. The LFQ Ratios were logarithmized, grouped and filtered for min. valid number (min. 4 in at least one group). Missing values have been replaced by random numbers that are drawn from a normal distribution. Two-sample t-test was performed using FDR = 0.05. P values < 0.05 were considered statistically significant. The mass spectrometry proteomics data have been deposited to the ProteomeXchange Consortium via the PRIDE partner repository with the dataset identifier PXD020385. (See also Supplementary Table 3).
Statistics and reproducibility
For each dataset, sample size n refers to independent experiments or biological replicates, as stated in the figure legends. Biological replicates indicate when a cell line is exposed to a given treatment multiple times, samples are harvested, processed and analyzed all at once, as in the case of RNA-seq or proteomics experiments. Independent experiments indicate when one or more cell lines are treated, harvested and analyzed multiple independent times, as in the case of Immunofluorescence and qPCR assays. All P values were calculated using the unpaired two-tailed t-test and indicated as their numerical values in each plot, unless stated otherwise; P values were not calculated for datasets with n < 3. For both bulk and single-cell RNA-seq, P values were calculated with Wald test. For RRBS we used the Chi squared test and for proteomics we used t-test. Adjusted P values (q-values) were calculated in the case of multiple testing. For RNA-seq data we used the Benjamini-Hochberg adjustment, for RRBS we used the SLIM method and for proteomics we used FDR. Either Excel or R software were used for statistical analysis. Error bars indicate the standard error of the mean (s.e.m.) or the standard deviation (SD), as stated in the figure legends.
Extended Data
Extended Data Fig. 1. Dnmt3a/b controls 5mC levels downstream of LIF/Stat3.
a, Distribution of DNA methylation levels at CpG islands in S3+/+ cells cultured in Serum LIF, 2i or 2iLIF and S3-/- cells in 2iLIF.
b, Gene expression analysis in RGd2 cells in 2i with or without LIF. Socs3 was used as a control of LIF/Stat3 activation. Bars: mean of n=2 biological replicates.
c, Proteomics data from S3+/+ and S3-/- cells in 2iLIF. Yellow and blue dots indicate respectively proteins that are more or less abundant (difference > 1 or < -1, p-value < 0.05) in S3+/+ relative to S3-/-. n=5 biological replicates.
d, Western blot of E14 mES cells and of Dnmt3a KO, Dnmt3b KO, and Dnmt3a/b double KO cells (two clones for each mutant genotype) in Serum LIF. Two E14 samples are loaded on the right and left for each KO cell line. B-ACTIN used as a loading control. Representative images of n=2 independent experiments.
e, Distribution of DNA methylation levels at CpG islands in E14 mES cells in 2i or 2iLIF and two clones of Dnmt3a/b double KO mES cells in 2i.
f, Gene expression analysis of S3+/+ cells cultured in 2iLIF transiently expressing an Empty Vector, Dnmt3a (two isoforms, Dnmt3a1 and Dnmt3a2 – as previously identified in72), Dnmt3b, or the three genes simultaneously (Dnmt3a1/a2/b OE). Bars: mean ± s.e.m. of n=3 independent experiments, shown as dots.
g, Anti-5mC immunofluorescence on S3+/+ in 2i and 2iLIF, and Dnmt3a1 OE, Dnmt3a2 OE, Dnmt3b OE, and Dnmt3a1/a2/b triple OE cells in 2iLIF. Violin plots of an average of 89 nuclei per sample. n=4 experiments.
h, Gene expression analysis of S3+/+ cells in 2iLIF stably expressing shRNA to knock-down Tet1 and Tet2 simultaneously or a scrambled control shRNA. Bars: mean ±s.e.m. of n=4 experiments.
i, Anti-5mC immunofluorescence on S3+/+ in 2iLIF transiently expressing a scrambled control shRNA and shRNA against Tet1/Tet2. Violin plots of an average of 78 nuclei per sample. n=4 experiments.
All violin and boxplots indicate the 1st, 2nd and 3rd quartiles, with whiskers indicating minimum and maximum value. All p-values calculated by two-tailed unpaired T-test. Scale bars: 20μm.
Extended Data Fig. 2. Impact of LIF/Stat3 and Dnmt3a/b on genome methylation.
a, MeDIP-qPCR of repetitive elements in S3+/+ and S3-/- cells. Mock immunoprecipitations with a non-specific IgG antibody served as negative controls. Mean of 2 experiments, shown as dots.
b, Volcano plot showing the significant differentially methylated CpG sites (q-value < 0.01, difference > 10% or < 10%) between S3+/+ 2i and S3+/+ 2iLIF cells, out of 1,327,475 detected sites.
c, d Scatter plot showing the mutual changes in expression and DNA methylation at active promoters (c) and enhancers (d) between S3+/+ 2i and S3+/+ 2iLIF cells. Red dots: genes for which both changes were statistically significant (q-value < 0.01).
e, Scatter plot comparing effects on transcription of the absence of LIF (S3+/+ 2i) and the absence of Stat3 (S3-/- 2iLIF). Pearson’s correlation coefficient (R) and corresponding p-value are indicated in the panel.
f, Volcano plot showing the significant differentially methylated CpG sites (q-value < 0.01, difference > 10% or < -10%) between E14 2i and E14 2iLIF cells, out of 1,084,350 detected sites.
g, CpG methylation changes caused by LIF addition (y axis) or by Dnmt3a/b deletion (x axis, Dnmt3a/b dKO.1). Dots indicate all CpG sites covered (sequencing depth >10x) in at least one technical replicate of each sample; blue dots: hypomethylated sites (q-value < 0.01, difference < -10 %).
h, Volcano plot showing the significant differentially methylated CpG sites between Dnmt3a/b dKO.1 and E14 cells cultivated in 2i.
i, CpG methylation changes caused by LIF (y axis) or by Dnmt3a/b deletion (x axis, Dnmt3a/b dKO.2), as described in panel g.
j, Volcano plot showing the significant differentially methylated CpG sites between Dnmt3a/b dKO.2 and E14 cells cultivated in 2i.
k, Venn diagram of CpG sites whose methylation status is dependent on either LIF (light blue) or Dnmt3a/b (red) or on both (grey intersection), for an independent mutant Dnmt3a/b dKO clone (Dnmt3a/b dKO.2).
Extended Data Fig. 3. Effect of Stat3 inactivation on imprinted transcripts.
a, MeDIP-qPCR of two control regions for DNA methylation change (Gapdh as negative and H19 as positive control). Mock immunoprecipitations with a non-specific IgG antibody served as negative controls. Mean ±s..e.m of 4 experiments for Gapdh and mean of 2 experiments for H19, shown as dots.
b, Differentially Methylated Regions and associated imprinted genes. Table reports Differentially Methylated Regions (DMRs) analyzed by RRBS with associated coordinates (reference genome: mm10); information about these DMRs in mouse genome was collected from three different databases (WAMIDEX https://atlas.genetics.kcl.ac.uk/; MouseBook - Imprinting Locihttps://www.mousebook.org/; Geneimprint http://geneimprint.com/site/genes-by-species.
Imprinted genes whose expression is controlled by the same DMR are grouped accordingly and indicated in the second column of the table. For each imprinted gene, fourth column reports the expected effect on gene expression - either upregulation or downregulation - caused by methylation deposition at the associated DMR (data from literature). The last column of the table shows observed expression levels (RNAseq data) of each imprinted gene in S3-/- cells, were hypermethylation was detected at the corresponding DMR (see Fig. 2f).
c, Pie charts showing the number of up- and down-regulated genes (q-value < 0.01, Benjamini-Hochberg adjustment and log2 FC > 1 or < -1) in S3-/- cells with respect to S3+/+ cells among all expressed genes (left), or among all expressed imprinted genes (right).
Extended Data Fig. 4. Modulating mitochondrial activity affects 5mC levels.
a, Anti-5mC immunofluorescence on S3+/+ cells in 2i or 2iLIF and S3-/- cells in 2iLIF treated with EdU for 4 h. Violin plots show the distribution of an average of 67 nuclei per sample; one representative experiment is shown for each condition.
b, Anti-5mC immunofluorescence on S3+/+ cells treated with Rotenone or Antimycin A. Violin plots show the distribution of an average of 74 nuclei per sample. 3 independent experiments shown as individual violins.
c, Anti-5mC immunofluorescence on E14 in 2iLIF and 2i, and on Dnmt3a/b double KO cells in 2iLIF, treated with Vehicle, Rotenone or Antimycin A. Violin plots show the distribution of an average of 183 nuclei per sample. 3 experiments shown as individual violins.
d, Confocal images of S3+/+, S3-/- cells and MitoS3.A/B clones stained with anti-Stat3 and anti-Atad3 antibodies. Representative images of 3 independent experiments.
e, Electron Microscopy images of STAT3 protein stained by Diaminobenzidine photooxidation method, in S3-/- and MitoS3.A cells. Representative images of 2 experiments. M, mitochondria; N, nucleus.
f, Expression analysis of Socs3 in S3+/+, S3-/- cells and MitoS3.A/B clones in 2iLIF. Bars: mean of n=2 experiments, shown as dots.
g, (Left) Western blot of S3+/+, S3-/- cells and MitoS3.A and MitoS3.B clones in 2iLIF. LAMIN B: loading control. (Right) Western blot of total lysates or mitochondrial and nuclear fractions. The nuclear protein LAMIN B and mitochondrial marker TIM23 confirmed successful nuclear and mitochondrial isolation. Representative images of 2 independent experiment.
h, Oxygen consumption rate measured by Seahorse extracellular flux assay of S3+/+, S3-/- and MitoS3.A/B clones cultured in 2iLIF. Mean and S.D. of n=5 biological replicates is shown.
All violin and boxplots indicate the 1st, 2nd and 3rd quartiles, with whiskers indicating minimum and maximum value. All p-values calculated by two-tailed unpaired T-test. Scale bars: 20μm.
Extended Data Fig. 5. Metabolic reconfiguration following Stat3 deletion.
a, Diagram representing mass isotopomer distribution (MID) of OAA, Citrate and αKG in both oxidative and reductive Glutamine pathways; MID was analysed following 8h of metabolic tracing with [U-13C5]-Glutamine. Orange box: mitochondrion. Full circles: 13C-labeled carbons. Color scale outlines the comparison between MID profile in S3-/- relative to S3+/+ for n=6 biological replicates; blue: isotopomers (or biochemical pathways) under-represented is S3-/- cells; red: isotopomers or pathways over-represented in S3-/- cells. Each isotopomer is corrected for natural isotope abundances.
b, Metabolic tracing analysis of different isotopomers of TCA cycle intermediates (Succinate, Oxaloacetate, Citrate and αKG) using [U-13C5]-Glutamine. Barplot represents mass isotopomer distribution (MID %) at 3 different time points (2h, 4h, 8h). Black circles: 13C‐labeled carbons. Bars: mean ±s.e.m of n=6 biological replicates. * p-value<0.05, two-tailed unpaired T-test. Each isotopomer is corrected for natural isotope abundances.
c, Expression of IDH1, measured by RT q-PCR and RNAseq in S3+/+ and S3-/- cells. Bars: mean of n=2 biological replicates.
d, Gene expression analysis of two Hif1a targets in S3+/+ cells cultured in 2iLIF in normoxia (high O2 – 21%), in hypoxia (low O2, 21%), or in normoxia with the addition of αKG or DM-αKG. Bars: indicate mean ±s.e.m. of n=7 experiments for high O2 and low O2, and n=4 for treatments with αKG and DM-αKG, shown as dots.
Extended Data Fig. 6. Mitochondrial Stat3 slows down ESC differentiation.
Gene expression analysis by RT–qPCR of S3+/+, S3-/- and MitoS3.A/B clones cultured with 2iLIF or without 2iLIF for 24h or 48h. Data show expression of Imprinted genes a, Mesoderm b, Ectoderm c, and PGCs d, markers that are more readily induced in S3-/- and MitoS3.A/B clones rescues this effect. Beta-actin served as an internal control. Bars indicate mean ±s.e.m. of n=3 independent experiments, shown as dots. Two-tailed unpaired T-test relative to S3-/- for each time point.
Extended Data Fig. 7. Stat3 regulates transcripts associated to differentially methylated genomic features.
a, Left: boxplot reporting expression levels of genes down-regulated in S3-/- cells relative to S3+/+ cells (Fig. 7a, blue dots) and differentially methylated at promoter regions (Fig. 2b). Right: boxplot reporting expression levels of genes up-regulated in S3-/- cells with respect to S3+/+ cells (Fig. 7a, yellow dots) and with differential methylation at promoter regions (Fig. 2b). Each boxplot shows 1st, 2nd and 3rd quartile. Whiskers shows minimum and maximum values. Y axis represents mean-normalized TPM values for S3+/+, S3-/- and MitoS3.A and MitoS3.B) in two different conditions: following stable culturing of cells in 2iLIF (light color) and after 48h of 2iLIF withdrawal from culture medium (dark color).
b, Boxplot reporting expression levels of genes down-regulated (left) or up-regulated (right) in S3-/- cells relative to S3+/+ cells and differentially methylated at enhancer regions (Fig. 2c), as described above.
c, Boxplot reporting expression levels of genes down-regulated (left) or up-regulated (right) in S3-/- cells relative to S3+/+ cells and differentially methylated at the associated DMR (Fig. 2f), as described above.
d, Merge of genes contained in boxplots shown in Extended Data Fig. 7a,b,c.
Extended Data Fig. 8. Accelerated progression of Stat3 null embryos.
a, Volcano plot of genes differentially expressed between S3-/- and S3+/+ cells at E3.5. Red and blue dots indicate respectively transcripts that are upregulated or downregulated (log2 FC > 0.7 or FC < -0.7 respectively, q-value < 0.1) in S3-/- cells relative to S3+/+ cells.
b, Diffusion pseudotime of E3.5 cells and the PrE gene signature computed with R package “destiny “ (http://bioinformatics.oxfordjournals.org/content/32/8/1241) using all the expressed genes as input list. P-value calculated with two-tailed Mann-Whitney test.
c, PCA plot computed with all the expressed genes. Colors represent different lineages/genotypes (left panel) or ratio between Gata6 and Nanog expression (right panel).
d, Volcano plot of genes differentially expressed between S3-/- and S3+/+ cells at E3.75. Red and blue dots indicate respectively transcripts that are upregulated or downregulated (log2 FC > 0.7 or FC < - 0.7 respectively, q-value < 0.1) in S3-/- cells relative to S3+/+ cells.
e, Fraction of identity between E3.75 EPI(left panel)/PrE(right panel) and E3.5 ICM, E4.5 EPI, E4.5 PrE, E5.5 EPI and E6.5 EPI stages computed with all the expressed genes. P-value calculated with two-tailed Mann-Whitney test.
All boxplot shows 1st, 2nd and 3rd quartile. Whiskers show minimum and maximum values.
Extended Data Fig. 9. Diagram summarizing how mitochondrial Stat3 affects nuclear transcription.
Supplementary Material
Acknowledgements
The authors thank H. Leitch for critical reading of the manuscript, and M. Montagner, S. Dupont and the Martello laboratory for discussions and suggestions. We thank P. Martini for help with next-generation sequencing data analyses and D. De Stefani for technical help with mitochondrial assays. We thank A. Simeone (Institute of Genetics and Biophysics, CNR, Naples, Italy) for the Otx2 null ESCs. We thank F. Caicci and A. Dinarello for electron microscopy acquisition and technical support. J.N. laboratory is supported by BBSRC grant RG77233. G.M. laboratory is supported by grants from the Giovanni Armenise–Harvard Foundation, the Telethon Foundation (TCP13013) and an ERC Starting Grant (MetEpiStem). S.O. laboratory is supported by grants from Associazione Italiana Ricerca sul Cancro (AIRC -IG 2017 Id. 20240, the Telethon Foundation (GGP19201A) and by PRIN 2017). N.M. laboratory is supported by grants from the Giovanni Armenise–Harvard Foundation, Intramural Transition grant from Università degli Studi di Milano, European Foundation for the Study of Diabetes/Lilly Programme 2015, Associazione Italiana Ricerca sul Cancro (AIRC -IG 2019 Id. 23127), MIUR Progetto Eccellenza to Department of Pharmacological and Biomolecular Sciences (DiSFeB), University of Milan, Italy.
Footnotes
Author contributions
G.M., N.M. and S.O. designed the study; R.M.B. and L.D. performed ESC culture, molecular characterization and functional assays and visualization; V.P. and L.D. performed MeDIP qPCR; R.M.B., V.P. and S.R. performed RRBS; R.M.B. and S.R. performed western blots; A.L. and D.I. performed RRBS integrated analysis; M.A. and L.D. performed RNA-seq analysis; R.M.B., S.P. and M.A. performed metabolomic analyses; R.M.B., V.P., V.G. and D.T. performed nucleotide mass spectrometry; P.G. performed proteomics; M.E.S. and G.R. performed mitochondrial and nuclear fractionations; L.D. and G.G.S. performed single-cell RNA-seq analysis; T.L., T.B. and J.N. performed embryo dissection and single-cell RNA-seq library preparation; G.M. wrote the manuscript with inputs from all authors; G.M., N.M. and S.O. supervised the study.
Competing interests statement
The authors declare no competing interests.
Data availability Statement
Bulk and single-cell RNA sequencing data and RRBS data generated during the current study are available via the Gene Expression Omnibus (GEO) repository under the accession numbers GSE133926 and GSE134450. All RNA-seq and RRBS process data, used in Figures 1d, 1i, 2a-e, 2h, 4c, 5d, 6b, 6d, 7a-e, 8a-g, and Extended Data Figures 1a-b, 1e, 2b-k, 3b-c, 5c, 7a-d, 8a-f are reported in Supplementary Tables 1, 2 and 4. RNA-seq data of Rex1-GFPd2 cells can be found at GEO under accession number GSE111694. Mass spectrometry proteomic data of following samples: S3+/+ cells in 2i; S3+/+, S3-/-, MitoS3.A and MitoS3.B cells in 2iLIF; used in Figure 1f, 5g, and Extended Data Fig. 1c are reported in Supplementary Table 3 and on ProteomeXchange Consortium via the PRIDE partner repository with the dataset identifier PXD020385. Primers and oligonucleotide sequences are present in Supplementary Tables 6-7-8. Additional data that support the findings of this study, such as mass spectrometry measurements, analysis pipelines and reagents are available from the corresponding authors upon reasonable request.
Source data are provided with this paper.
Code availability
All software and bioinformatic tools used in the present study are publicly available.
References
- 1.Ito S, et al. Role of Tet proteins in 5mC to 5hmC conversion, ES-cell self-renewal and inner cell mass specification. Nature. 2010;466:1129–1133. doi: 10.1038/nature09303. [DOI] [PMC free article] [PubMed] [Google Scholar]
- 2.Ito S, et al. Tet proteins can convert 5-methylcytosine to 5-formylcytosine and 5-carboxylcytosine. Science. 2011;333:1300–1303. doi: 10.1126/science.1210597. [DOI] [PMC free article] [PubMed] [Google Scholar]
- 3.Messerschmidt DM, Knowles BB, Solter D. DNA methylation dynamics during epigenetic reprogramming in the germline and preimplantation embryos. Genes Dev. 2014;28:812–828. doi: 10.1101/gad.234294.113. [DOI] [PMC free article] [PubMed] [Google Scholar]
- 4.Monk M, Boubelik M, Lehnert S. Temporal and regional changes in DNA methylation in the embryonic, extraembryonic and germ cell lineages during mouse embryo development. Dev Camb Engl. 1987;99:371–382. doi: 10.1242/dev.99.3.371. [DOI] [PubMed] [Google Scholar]
- 5.Smith ZD, et al. A unique regulatory phase of DNA methylation in the early mammalian embryo. Nature. 2012;484:339–344. doi: 10.1038/nature10960. [DOI] [PMC free article] [PubMed] [Google Scholar]
- 6.Ishida M, Moore GE. The role of imprinted genes in humans. Mol Aspects Med. 2013;34:826–840. doi: 10.1016/j.mam.2012.06.009. [DOI] [PubMed] [Google Scholar]
- 7.Boroviak T, et al. Lineage-Specific Profiling Delineates the Emergence and Progression of Naive Pluripotency in Mammalian Embryogenesis. Dev Cell. 2015;35:366–382. doi: 10.1016/j.devcel.2015.10.011. [DOI] [PMC free article] [PubMed] [Google Scholar]
- 8.Do DV, et al. A genetic and developmental pathway from STAT3 to the OCT4-NANOG circuit is essential for maintenance of ICM lineages in vivo. Genes Dev. 2013;27:1378–1390. doi: 10.1101/gad.221176.113. [DOI] [PMC free article] [PubMed] [Google Scholar]
- 9.Martello G, Bertone P, Smith A. Identification of the missing pluripotency mediator downstream of leukaemia inhibitory factor. EMBO J. 2013;32:2561–2574. doi: 10.1038/emboj.2013.177. [DOI] [PMC free article] [PubMed] [Google Scholar]
- 10.Mohammed H, et al. Single-Cell Landscape of Transcriptional Heterogeneity and Cell Fate Decisions during Mouse Early Gastrulation. Cell Rep. 2017;20:1215–1228. doi: 10.1016/j.celrep.2017.07.009. [DOI] [PMC free article] [PubMed] [Google Scholar]
- 11.Ye S, Li P, Tong C, Ying QL. Embryonic stem cell self-renewal pathways converge on the transcription factor Tfcp2l1. EMBO J. 2013;32:2548–2560. doi: 10.1038/emboj.2013.175. [DOI] [PMC free article] [PubMed] [Google Scholar]
- 12.Boroviak T, Nichols J. Primate embryogenesis predicts the hallmarks of human naïve pluripotency. Development. 2017;144:175–186. doi: 10.1242/dev.145177. [DOI] [PMC free article] [PubMed] [Google Scholar]
- 13.Ying Q-L, et al. The ground state of embryonic stem cell self-renewal. Nature. 2008;453:519–523. doi: 10.1038/nature06968. [DOI] [PMC free article] [PubMed] [Google Scholar]
- 14.Ficz G, et al. FGF signaling inhibition in ESCs drives rapid genome-wide demethylation to the epigenetic ground state of pluripotency. Cell Stem Cell. 2013;13:351–359. doi: 10.1016/j.stem.2013.06.004. [DOI] [PMC free article] [PubMed] [Google Scholar]
- 15.Habibi E, et al. Whole-genome bisulfite sequencing of two distinct interconvertible DNA methylomes of mouse embryonic stem cells. Cell Stem Cell. 2013;13:360–369. doi: 10.1016/j.stem.2013.06.002. [DOI] [PubMed] [Google Scholar]
- 16.Hackett JA, et al. Synergistic mechanisms of DNA demethylation during transition to ground-state pluripotency. Stem Cell Rep. 2013 doi: 10.1016/j.stemcr.2013.11.010. [DOI] [PMC free article] [PubMed] [Google Scholar]
- 17.Leitch HG, et al. Naive pluripotency is associated with global DNA hypomethylation. Nat Struct Mol Biol. 2013;20:311–316. doi: 10.1038/nsmb.2510. [DOI] [PMC free article] [PubMed] [Google Scholar]
- 18.Smith AG, et al. Inhibition of pluripotential embryonic stem cell differentiation by purified polypeptides. Nature. 1988;336:688–690. doi: 10.1038/336688a0. [DOI] [PubMed] [Google Scholar]
- 19.Carbognin E, Betto RM, Soriano ME, Smith AG, Martello G. Stat3 promotes mitochondrial transcription and oxidative respiration during maintenance and induction of naive pluripotency. EMBO J. 2016;35:618–634. doi: 10.15252/embj.201592629. [DOI] [PMC free article] [PubMed] [Google Scholar]
- 20.Gough DJ, et al. Mitochondrial STAT3 supports Ras-dependent oncogenic transformation. Science. 2009;324:1713–1716. doi: 10.1126/science.1171721. [DOI] [PMC free article] [PubMed] [Google Scholar]
- 21.Wegrzyn J, et al. Function of mitochondrial Stat3 in cellular respiration. Science. 2009;323:793–797. doi: 10.1126/science.1164551. [DOI] [PMC free article] [PubMed] [Google Scholar]
- 22.Lu C, Thompson CB. Metabolic regulation of epigenetics. Cell Metab. 2012;16:9–17. doi: 10.1016/j.cmet.2012.06.001. [DOI] [PMC free article] [PubMed] [Google Scholar]
- 23.Dawlaty MM, et al. Loss of Tet Enzymes Compromises Proper Differentiation of Embryonic Stem Cells. Dev Cell. 2014;29:102–111. doi: 10.1016/j.devcel.2014.03.003. [DOI] [PMC free article] [PubMed] [Google Scholar]
- 24.von Meyenn F, et al. Impairment of DNA Methylation Maintenance Is the Main Cause of Global Demethylation in Naive Embryonic Stem Cells. Mol Cell. 2016;62:848–861. doi: 10.1016/j.molcel.2016.04.025. [DOI] [PMC free article] [PubMed] [Google Scholar]
- 25.Martello G, et al. Esrrb is a pivotal target of the Gsk3/Tcf3 axis regulating embryonic stem cell self-renewal. Cell Stem Cell. 2012;11:491–504. doi: 10.1016/j.stem.2012.06.008. [DOI] [PMC free article] [PubMed] [Google Scholar]
- 26.Yamane M, Ohtsuka S, Matsuura K, Nakamura A, Niwa H. Overlapping functions of Krüppel-like factor family members: targeting multiple transcription factors to maintain the naïve pluripotency of mouse embryonic stem cells. Development. 2018;145 doi: 10.1242/dev.162404. [DOI] [PubMed] [Google Scholar]
- 27.Elhamamsy AR. Role of DNA methylation in imprinting disorders: an updated review. J Assist Reprod Genet. 2017;34:549–562. doi: 10.1007/s10815-017-0895-5. [DOI] [PMC free article] [PubMed] [Google Scholar]
- 28.Ferguson-Smith AC. Genomic imprinting: the emergence of an epigenetic paradigm. Nat Rev Genet. 2011;12:565–575. doi: 10.1038/nrg3032. [DOI] [PubMed] [Google Scholar]
- 29.Hackett JA, Kobayashi T, Dietmann S, Surani MA. Activation of Lineage Regulators and Transposable Elements across a Pluripotent Spectrum. Stem Cell Rep. 2017;8:1645–1658. doi: 10.1016/j.stemcr.2017.05.014. [DOI] [PMC free article] [PubMed] [Google Scholar]
- 30.Sánchez-Castillo M, et al. CODEX: a next-generation sequencing experiment database for the haematopoietic and embryonic stem cell communities. Nucleic Acids Res. 2015;43:D1117–23. doi: 10.1093/nar/gku895. [DOI] [PMC free article] [PubMed] [Google Scholar]
- 31.Matsuda T, et al. STAT3 activation is sufficient to maintain an undifferentiated state of mouse embryonic stem cells. EMBO J. 1999;18:4261–4269. doi: 10.1093/emboj/18.15.4261. [DOI] [PMC free article] [PubMed] [Google Scholar]
- 32.Tang Y, et al. Jak/Stat3 signaling promotes somatic cell reprogramming by epigenetic regulation. Stem Cells. 2012;30:2645–2656. doi: 10.1002/stem.1225. [DOI] [PubMed] [Google Scholar]
- 33.Peron M, et al. Mitochondrial STAT3 regulates proliferation of tissue stem cells. bioRxiv. 2020 doi: 10.1101/2020.07.17.208264. 2020.07.17.208264. [DOI] [Google Scholar]
- 34.Carey BW, Finley LWS, Cross JR, Allis CD, Thompson CB. Intracellular α-ketoglutarate maintains the pluripotency of embryonic stem cells. Nature. 2015;518:413–416. doi: 10.1038/nature13981. [DOI] [PMC free article] [PubMed] [Google Scholar]
- 35.Hou P, et al. Intermediary Metabolite Precursor Dimethyl-2-Ketoglutarate Stabilizes Hypoxia-Inducible Factor-1α by Inhibiting Prolyl-4-Hydroxylase PHD2. PLOS ONE. 2014;9:e113865. doi: 10.1371/journal.pone.0113865. [DOI] [PMC free article] [PubMed] [Google Scholar]
- 36.Xu Y, et al. Genome-wide Regulation of 5hmC, 5mC, and Gene Expression by Tet1 Hydroxylase in Mouse Embryonic Stem Cells. Mol Cell. 2011;42:451–464. doi: 10.1016/j.molcel.2011.04.005. [DOI] [PMC free article] [PubMed] [Google Scholar]
- 37.Chen T, Ueda Y, Dodge JE, Wang Z, Li E. Establishment and Maintenance of Genomic Methylation Patterns in Mouse Embryonic Stem Cells by Dnmt3a and Dnmt3b. Mol Cell Biol. 2003;23:5594–5605. doi: 10.1128/MCB.23.16.5594-5605.2003. [DOI] [PMC free article] [PubMed] [Google Scholar]
- 38.Tischler J, et al. Metabolic regulation of pluripotency and germ cell fate through α-ketoglutarate. EMBO J. 2018:e99518. doi: 10.15252/embj.201899518. [DOI] [PMC free article] [PubMed] [Google Scholar]
- 39.Laukka T, et al. Fumarate and Succinate Regulate Expression of Hypoxia-inducible Genes via TET Enzymes. J Biol Chem. 2016;291:4256–4265. doi: 10.1074/jbc.M115.688762. [DOI] [PMC free article] [PubMed] [Google Scholar]
- 40.Xiao M, et al. Inhibition of α-KG-dependent histone and DNA demethylases by fumarate and succinate that are accumulated in mutations of FH and SDH tumor suppressors. Genes Dev. 2012;26:1326–1338. doi: 10.1101/gad.191056.112. [DOI] [PMC free article] [PubMed] [Google Scholar]
- 41.Teslaa T, Teitell MA. Pluripotent stem cell energy metabolism: an update. EMBO J. 2015;34:138–153. doi: 10.15252/embj.201490446. [DOI] [PMC free article] [PubMed] [Google Scholar]
- 42.Nishiyama A, et al. Systematic repression of transcription factors reveals limited patterns of gene expression changes in ES cells. Sci Rep. 2013;3:5–10. doi: 10.1038/srep01390. [DOI] [PMC free article] [PubMed] [Google Scholar]
- 43.Correa-Cerro LS, et al. Generation of mouse ES cell lines engineered for the forced induction of transcription factors. Sci Rep. 2011;1:1–6. doi: 10.1038/srep00167. [DOI] [PMC free article] [PubMed] [Google Scholar]
- 44.Nishiyama A, et al. Uncovering Early Response of Gene Regulatory Networks in ESCs by Systematic Induction of Transcription Factors. Cell Stem Cell. 2009;5:420–433. doi: 10.1016/j.stem.2009.07.012. [DOI] [PMC free article] [PubMed] [Google Scholar]
- 45.Buecker C, et al. Reorganization of enhancer patterns in transition from naive to primed pluripotency. Cell Stem Cell. 2014;14:838–853. doi: 10.1016/j.stem.2014.04.003. [DOI] [PMC free article] [PubMed] [Google Scholar]
- 46.Yang S-H, et al. Otx2 and Oct4 Drive Early Enhancer Activation during Embryonic Stem Cell Transition from Naive Pluripotency. Cell Rep. 2014;7:1968–1981. doi: 10.1016/j.celrep.2014.05.037. [DOI] [PMC free article] [PubMed] [Google Scholar]
- 47.Pawlak M, Jaenisch R. De novo DNA methylation by Dnmt3a and Dnmt3b is dispensable for nuclear reprogramming of somatic cells to a pluripotent state. Genes Dev. 2011;25:1035–1040. doi: 10.1101/gad.2039011. [DOI] [PMC free article] [PubMed] [Google Scholar]
- 48.Grabole N, et al. Prdm14 promotes germline fate and naive pluripotency by repressing FGF signalling and DNA methylation. EMBO Rep. 2013;14:629–637. doi: 10.1038/embor.2013.67. [DOI] [PMC free article] [PubMed] [Google Scholar]
- 49.Yamaji M, et al. PRDM14 Ensures Naive Pluripotency through Dual Regulation of Signaling and Epigenetic Pathways in Mouse Embryonic Stem Cells. Cell Stem Cell. 2013;12:368–382. doi: 10.1016/j.stem.2012.12.012. [DOI] [PubMed] [Google Scholar]
- 50.Dan J, et al. Roles for Tbx3 in regulation of two-cell state and telomere elongation in mouse ES cells. Sci Rep. 2013;3:3492. doi: 10.1038/srep03492. [DOI] [PMC free article] [PubMed] [Google Scholar]
- 51.Palamarchuk A, et al. Tcl1 protein functions as an inhibitor of de novo DNA methylation in B-cell chronic lymphocytic leukemia (CLL) Proc Natl Acad Sci U S A. 2012;109:2555–2560. doi: 10.1073/pnas.1200003109. [DOI] [PMC free article] [PubMed] [Google Scholar]
- 52.Acampora D, Giovannantonio LGD, Simeone A. Otx2 is an intrinsic determinant of the embryonic stem cell state and is required for transition to a stable epiblast stem cell condition. Development. 2013;140:43–55. doi: 10.1242/dev.085290. [DOI] [PubMed] [Google Scholar]
- 53.Kalkan T, et al. Tracking the embryonic stem cell transition from ground state pluripotency. Dev Camb Engl. 2017;144:1221–1234. doi: 10.1242/dev.142711. [DOI] [PMC free article] [PubMed] [Google Scholar]
- 54.Koh KP, et al. Tet1 and Tet2 regulate 5-hydroxymethylcytosine production and cell lineage specification in mouse embryonic stem cells. Cell Stem Cell. 2011;8:200–213. doi: 10.1016/j.stem.2011.01.008. [DOI] [PMC free article] [PubMed] [Google Scholar]
- 55.Meissner A, et al. Genome-scale DNA methylation maps of pluripotent and differentiated cells. Nature. 2008;454:766–770. doi: 10.1038/nature07107. [DOI] [PMC free article] [PubMed] [Google Scholar]
- 56.Tahiliani M, et al. Conversion of 5-Methylcytosine to 5-Hydroxymethylcytosine in Mammalian DNA by MLL Partner TET1. Science. 2009;324:930–935. doi: 10.1126/science.1170116. [DOI] [PMC free article] [PubMed] [Google Scholar]
- 57.Tsumura A, et al. Maintenance of self-renewal ability of mouse embryonic stem cells in the absence of DNA methyltransferases Dnmt1, Dnmt3a and Dnmt3b. Genes Cells. 2006;11:805–814. doi: 10.1111/j.1365-2443.2006.00984.x. [DOI] [PubMed] [Google Scholar]
- 58.Zhou W, et al. HIF1α induced switch from bivalent to exclusively glycolytic metabolism during ESC-to-EpiSC/hESC transition. EMBO J. 2012;31:2103–2116. doi: 10.1038/emboj.2012.71. [DOI] [PMC free article] [PubMed] [Google Scholar]
- 59.Bourillot PY, et al. Novel STAT3 target genes exert distinct roles in the inhibition of mesoderm and endoderm differentiation in cooperation with Nanog. Stem Cells. 2009;27:1760–1771. doi: 10.1002/stem.110. [DOI] [PubMed] [Google Scholar]
- 60.Niwa H, Ogawa K, Shimosato D, Adachi K. A parallel circuit of LIF signalling pathways maintains pluripotency of mouse ES cells. Nature. 2009;460:118–122. doi: 10.1038/nature08113. [DOI] [PubMed] [Google Scholar]
- 61.Boroviak T, Loos R, Bertone P, Smith A, Nichols J. The ability of inner-cell-mass cells to self-renew as embryonic stem cells is acquired following epiblast specification. Nat Cell Biol. 2014;16:516–528. doi: 10.1038/ncb2965. [DOI] [PMC free article] [PubMed] [Google Scholar]
- 62.McLaughlin K, et al. DNA Methylation Directs Polycomb-Dependent 3D Genome Re-organization in Naive Pluripotency. Cell Rep. 2019;29:1974–1985.e6. doi: 10.1016/j.celrep.2019.10.031. [DOI] [PMC free article] [PubMed] [Google Scholar]
- 63.Takeda K, et al. Targeted disruption of the mouse Stat3 gene leads to early embryonic lethality. Proc Natl Acad Sci. 1997;94:3801–3804. doi: 10.1073/pnas.94.8.3801. [DOI] [PMC free article] [PubMed] [Google Scholar]
- 64.Leeb M, Dietmann S, Paramor M, Niwa H, Smith A. Genetic exploration of the exit from self-renewal using haploid embryonic stem cells. Cell Stem Cell. 2014;14:385–393. doi: 10.1016/j.stem.2013.12.008. [DOI] [PMC free article] [PubMed] [Google Scholar]
- 65.Avalle L, et al. STAT3 localizes to the ER, acting as a gatekeeper for ER-mitochondrion Ca2+ fluxes and apoptotic responses. Cell Death Differ. 2019;26:932–942. doi: 10.1038/s41418-018-0171-y. [DOI] [PMC free article] [PubMed] [Google Scholar]
- 66.Wang L, et al. JAK/STAT3 regulated global gene expression dynamics during late-stage reprogramming process. BMC Genomics. 2018;19:183. doi: 10.1186/s12864-018-4507-2. [DOI] [PMC free article] [PubMed] [Google Scholar]
- 67.Hwang I-Y, et al. Psat1-Dependent Fluctuations in α-Ketoglutarate Affect the Timing of ESC Differentiation. Cell Metab. 2016;24:494–501. doi: 10.1016/j.cmet.2016.06.014. [DOI] [PubMed] [Google Scholar]
- 68.Zhang J, et al. LIN28 Regulates Stem Cell Metabolism and Conversion to Primed Pluripotency. Cell Stem Cell. 2016;19:66–80. doi: 10.1016/j.stem.2016.05.009. [DOI] [PubMed] [Google Scholar]
- 69.Mullen AR, et al. Reductive carboxylation supports growth in tumour cells with defective mitochondria. Nature. 2012;481:385–388. doi: 10.1038/nature10642. [DOI] [PMC free article] [PubMed] [Google Scholar]
- 70.Choi J, et al. Prolonged Mek1/2 suppression impairs the developmental potential of embryonic stem cells. Nature. 2017;548:219–223. doi: 10.1038/nature23274. [DOI] [PMC free article] [PubMed] [Google Scholar]
- 71.Yagi M, et al. Derivation of ground-state female ES cells maintaining gamete-derived DNA methylation. Nature. 2017;548:224–227. doi: 10.1038/nature23286. [DOI] [PubMed] [Google Scholar]
- 72.Chen T, Ueda Y, Xie S, Li E. A Novel Dnmt3a Isoform Produced from an Alternative Promoter Localizes to Euchromatin and Its Expression Correlates with Activede Novo Methylation. J Biol Chem. 2002;277:38746–38754. doi: 10.1074/jbc.M205312200. [DOI] [PubMed] [Google Scholar]
- 73.Love MI, Huber W, Anders S. Moderated estimation of fold change and dispersion for RNA-seq data with DESeq2. Genome Biol. 2014;15 doi: 10.1186/s13059-014-0550-8. [DOI] [PMC free article] [PubMed] [Google Scholar]
- 74.Neri F, Incarnato D, Krepelova A, Parlato C, Oliviero S. Methylation-assisted bisulfite sequencing to simultaneously map 5fC and 5caC on a genome-wide scale for DNA demethylation analysis. Nat Protoc. 2016;11:1191–1205. doi: 10.1038/nprot.2016.063. [DOI] [PubMed] [Google Scholar]
- 75.Xi Y, Li W. BSMAP: whole genome bisulfite sequence MAPping program. BMC Bioinformatics. 2009;10:232. doi: 10.1186/1471-2105-10-232. [DOI] [PMC free article] [PubMed] [Google Scholar]
- 76.Akalin A, et al. methylKit: a comprehensive R package for the analysis of genome-wide DNA methylation profiles. Genome Biol. 2012;13:R87. doi: 10.1186/gb-2012-13-10-r87. [DOI] [PMC free article] [PubMed] [Google Scholar]
- 77.Boroviak T, et al. Single cell transcriptome analysis of human, marmoset and mouse embryos reveals common and divergent features of preimplantation development. Dev Camb Engl. 2018;145 doi: 10.1242/dev.167833. [DOI] [PMC free article] [PubMed] [Google Scholar]
- 78.Dobin A, et al. STAR: ultrafast universal RNA-seq aligner. Bioinformatics. 2013;29:15–21. doi: 10.1093/bioinformatics/bts635. [DOI] [PMC free article] [PubMed] [Google Scholar]
- 79.Anders S, Pyl PT, Huber W. HTSeq—a Python framework to work with high-throughput sequencing data. Bioinformatics. 2015;31:166–169. doi: 10.1093/bioinformatics/btu638. [DOI] [PMC free article] [PubMed] [Google Scholar]
- 80.Anders S, Huber W. Differential expression analysis for sequence count data. Genome Biol. 2010;11:R106. doi: 10.1186/gb-2010-11-10-r106. [DOI] [PMC free article] [PubMed] [Google Scholar]
- 81.Lê S, Josse J, Husson F. FactoMineR: An R Package for Multivariate Analysis. J Stat Softw. 2008;25:1–18. [Google Scholar]
- 82.Risso D, Perraudeau F, Gribkova S, Dudoit S, Vert J-P. A general and flexible method for signal extraction from single-cell RNA-seq data. Nat Commun. 2018;9:284. doi: 10.1038/s41467-017-02554-5. [DOI] [PMC free article] [PubMed] [Google Scholar]
- 83.Gong T, Szustakowski JD. DeconRNASeq: a statistical framework for deconvolution of heterogeneous tissue samples based on mRNA-Seq data. Bioinformatics. 2013;29:1083–1085. doi: 10.1093/bioinformatics/btt090. [DOI] [PubMed] [Google Scholar]
- 84.Rappsilber J, Ishihama Y, Mann M. Stop and Go Extraction Tips for Matrix-Assisted Laser Desorption/Ionization, Nanoelectrospray, and LC/MS Sample Pretreatment in Proteomics. Anal Chem. 2003;75:663–670. doi: 10.1021/ac026117i. [DOI] [PubMed] [Google Scholar]
- 85.Michalski A, et al. Mass Spectrometry-based Proteomics Using Q Exactive, a High-performance Benchtop Quadrupole Orbitrap Mass Spectrometer. Mol Cell Proteomics. 2011;10 doi: 10.1074/mcp.M111.011015. [DOI] [PMC free article] [PubMed] [Google Scholar]
Associated Data
This section collects any data citations, data availability statements, or supplementary materials included in this article.
Supplementary Materials
Data Availability Statement
Bulk and single-cell RNA sequencing data and RRBS data generated during the current study are available via the Gene Expression Omnibus (GEO) repository under the accession numbers GSE133926 and GSE134450. All RNA-seq and RRBS process data, used in Figures 1d, 1i, 2a-e, 2h, 4c, 5d, 6b, 6d, 7a-e, 8a-g, and Extended Data Figures 1a-b, 1e, 2b-k, 3b-c, 5c, 7a-d, 8a-f are reported in Supplementary Tables 1, 2 and 4. RNA-seq data of Rex1-GFPd2 cells can be found at GEO under accession number GSE111694. Mass spectrometry proteomic data of following samples: S3+/+ cells in 2i; S3+/+, S3-/-, MitoS3.A and MitoS3.B cells in 2iLIF; used in Figure 1f, 5g, and Extended Data Fig. 1c are reported in Supplementary Table 3 and on ProteomeXchange Consortium via the PRIDE partner repository with the dataset identifier PXD020385. Primers and oligonucleotide sequences are present in Supplementary Tables 6-7-8. Additional data that support the findings of this study, such as mass spectrometry measurements, analysis pipelines and reagents are available from the corresponding authors upon reasonable request.
Source data are provided with this paper.
All software and bioinformatic tools used in the present study are publicly available.


