Abstract
Suramin has been a primary early-stage treatment for African trypanosomiasis for nearly one hundred years. Recent studies revealed that trypanosome strains that express the Variant Surface Glycoprotein VSGsur possess heightened resistance to suramin. We show here that VSGsur binds tightly to suramin but other VSGs do not. By solving high-resolution crystal structures of VSGsur and VSG13, we also demonstrate that these VSGs define a structurally divergent subgroup of the coat proteins. The co-crystal structure of VSGsur with suramin reveals that the chemically symmetric drug binds within a large cavity in the VSG homodimer asymmetrically, primarily through contacts of its central benzene rings. Structure-based, loss-of-contact mutations in VSGsur significantly decrease the affinity to suramin and lead to a loss of the resistance phenotype. Altogether, these data show that the resistance phenotype is dependent on the binding of suramin to VSGsur, establishing that the VSG proteins can possess functionality beyond their role in antigenic variation.
Introduction
Multiple species of the genus Trypanosoma cause Sleeping Sickness in humans and related diseases in animals1–3. A remarkable feature characterizing all such infections is the ability of the trypanosomes to thrive in the blood and tissue spaces of infected mammals despite complete exposure to the immune system of the host4. This is achieved largely through a dedicated machinery in the organism to alter its surface coat and continuously evade immune system recognition and clearance5. The trypanosome surface is densely carpeted with approximately 10 million copies of the Variant Surface Glycoprotein (VSG), a GPI-anchored and glycosylated polypeptide to which the immune system mounts a very effective response6,7. The VSGs are long, rod-shaped homodimeric proteins of around 60kDa with two subdomains: a larger, N-terminal domain (NTD) of around 350-400 amino acids and a smaller 80-120 residue C-terminal domain (CTD) to which the GPI anchor is attached (Supplementary Data Fig. 1)8. The top lobe (facing away from the parasite) is hypothesized to harbor the majority of immune epitopes, presenting the “antigenic face” of the VSG, although little epitope mapping and no antibody-VSG co-crystal structures have been published to date8–10.
While the host immune system develops rapid and effective responses to the VSGs, the trypanosomes access a genetic repository of over 2000 VSG genes and pseudo-VSG genes with distinct antigenic properties, switching coat proteins and thereby rendering the host response naïve to the new coat before the parasites can be cleared. This process of recognition, partial clearance, coat switching, and pathogen escape is termed antigenic variation. Because of this ability to thwart immune clearance, African trypanosomiasis is usually fatal unless treated chemotherapeutically4.
Synthesized as early as 1917, the compound suramin (originally Bayer 205 and later sold as Germanin) was first used therapeutically to treat African trypanosomiasis in the 1920s11–13. It is one of only a few drugs (including pentamidine, melarsoprol, eflornithine, nifirtimox, and fexinidazole)12,13 available to counter the disease and is only effective in the early stages of infection, before the parasite has entered the central nervous system (as suramin cannot effectively penetrate the blood-brain barrier14). It has also been used prophylactically15 and is on the World Health Organization’s List of Essential Medicines16. Recently, suramin has demonstrated potent antineoplastic properties17. It is part of a larger family of benzopurpurine dyes and naphthalene ureas that show trypanocidal activity12. Resistance to suramin has gradually spread through the animal-infective trypanosomal populations, but has yet to reach those species causing disease in humans18.
The specific mechanism behind the trypanolytic activity of suramin remains unresolved, although studies have implicated effects on the glycosome and impairment of cytokinesis19,20. A model for the internalization of suramin has been proposed in which the drug enters through receptor-mediated endocytosis involving two distinct pathways: (1) low-density lipoproteins (LDLs) with possible involvement of other serum proteins and (2) the invariant surface glycoprotein 75 (ISG75) receptor of the pathogen21–23. However, to date no direct binding of suramin to any trypanosomal protein has been reported.
Recently, in vitro selection in the presence of suramin generated trypanosome strains that were over ninety-fold resistant to the drug18. All these resistant strains were shown to express a specific VSG, termed VSGsur, that itself was sufficient to convey the resistant phenotype in trypanosomes genetically engineered to express it23. However, it has remained unclear how VSGsur is involved in this resistance phenotype, whether directly or indirectly. Hypotheses include a model in which VSGsur causes suramin resistance by decreasing specific, receptor‐mediated endocytosis pathways critical to the uptake of the drug23.
Results
Structures of VSGsur and VSG13 reveal a divergent subfamily of VSGs
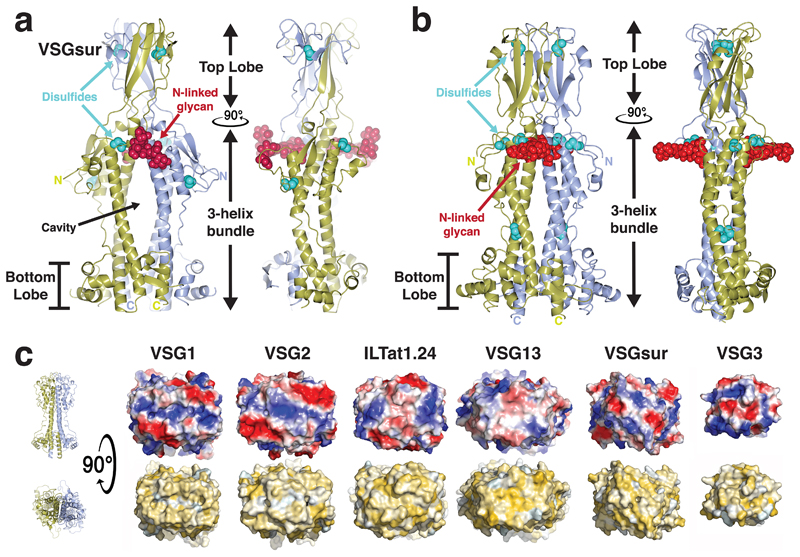
We sought insight into the function of VSGsur through structural studies of the protein (clone from T. brucei rhodesiense, Genbank ATI14856), determining the crystal structure of the NTD to 1.2Å resolution (residues 30-408, Fig. 1a, Methods, Supplementary Data Fig. 2 and Supplementary Data Table 1). VSGsur differs markedly from previous VSG structures determined (VSG1, VSG2, VSG3, and ILTat1.24)24–27. While the core 3-helix bundle scaffolding of the VSG family is present, VSGsur possesses several divergent features. The most striking is observed in the “upper lobe” of the molecule. The insertion between the helices at the top of VSGsur folds into a bona fide structural subdomain (residues ~140-260) consisting of five β-strands and an elongated loop between 174-208 that travels half the length of the VSG molecule before returning to the upper lobe (Extended Data Fig. 1a). This subdomain forms an intermolecular β-sandwich with the pairing monomer in the homodimer to create a tightly interwoven quaternary fold with a significant hydrophobic core. Perched on top of the 3-helix bundle, this “head” is strikingly different than the more flattened polypeptide arrangements of the other VSG top lobes that do not organize into any typified fold.
Fig. 1. Overall Structure of VSGsur.
(a) VSGsur is shown as a ribbon diagram in two orientations related by a 90 degree rotation, the monomers in the homodimer colored gold and light blue. The N-linked glycans of the two VSG monomers are displayed as red space-filling atoms, disulfide bonds are shown in cyan, and several key features are labeled. “N” and “C” indicate the N- and C- termini of each monomer. (b) The crystal structure of VSG13 in two orientations is depicted similarly to that of VSGsur as in (a). (c) Molecular surfaces of published VSG structures to date. The VSGs are oriented looking “down” on the top lobe of the protein, the orientation rotated 90 degrees about a horizontal axis in comparison to upper panels. The upper row of surfaces is colored by relative electrostatic potential (blue is basic/positively charged, red is acidic/negatively charged, and white is neutral) and on the lower row by the Eisenberg hydrophobicity scale51 (yellow indicates hydrophobic, white polar). Arrows underneath the surfaces illustrate the two broad superfamilies of different VSGs identified by sequence threading as implemented by PHYRE252. Note that the NTD of VSG3 is monomer in solution and the crystal structure, and in the absence of any structural data of a NTD dimer, we have chosen to show only the monomeric surface. Structures and molecular surfaces illustrated with CCP4mg53 and MacPyMOL54.
Also remarkable is the location of an N-linked sugar nearly two-thirds of the distance up the NTD from the bottom lobe and directly under the β-sandwich top lobe. Most VSGs possess N-linked carbohydrates, but in all studied to date they are located in the bottom lobe and have been hypothesized to function there in VSG-membrane dynamics28. Further distinguishing VSGsur from previous structures, the multiple disulfide bonds stabilizing most VSG proteins (three pairs in VSGsur) are not clustered in the upper lobe, but extend into the 3-helix bundle. Finally, there is a large cavity in the homodimeric interface in VSGsur not found in other published VSG structures, located just beneath the unusually placed N-linked glycan. Altogether, VSGsur is a significant departure from previously studied VSGs while still maintaining the core scaffolding of this family.
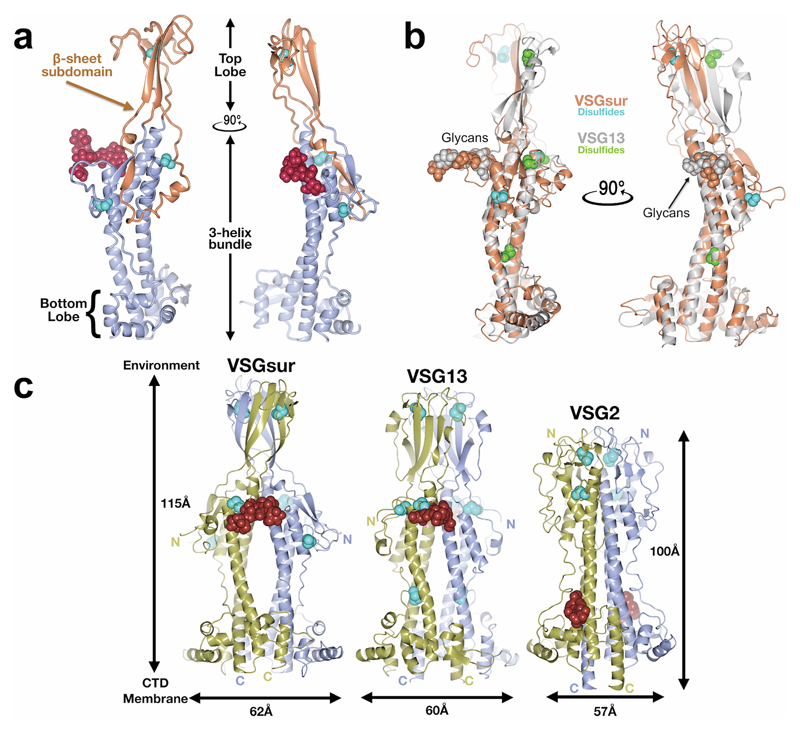
Our additional studies show that VSGsur is not a unique fold but is in fact likely a member of a subfamily of VSGs. The 1.4Å resolution crystal structure of VSG13 (also named MITat1.13) reveals a second VSG protein with a top “head” consisting of a large β-sheet subdomain (residues 130-260) that forms an intermolecular β-sandwich in the homodimer (Fig. 1b, Methods, Extended Data Fig. 1 and Table 2). Even more striking than VSGsur, the cysteine disulfide bonds of VSG13 (four in this case) are spread throughout the length of the VSG and not clustered in the top lobe, in fact reaching down near the bottom lobe of the NTD. As with VSGsur, VSG13 harbors an N-linked glycan approaching the top of the molecule, positioned just under the β-sheet head and not in the bottom lobe. VSG13 also possesses an internal cavity between monomers in the homodimer. While smaller than that observed in VSGsur, it is still large enough to allow solvent into the cavity from the crystallization reagents. A protein structural alignment of the VSGsur and VSG13 monomers (Extended Data Fig. 1b) shows that the core 3-helix bundle aligns well and the N-linked sugars superpose very closely, whereas the β-sheet head in the upper lobes align poorly, evincing significant divergence. Comparing VSGsur and VSG13 with the “canonical” VSG2 structure shows that the β-sandwich subdomain gives more height to the NTDs of this subfamily than the other VSGs previously studied (Extended Data Fig. 1c), which could have significance for membrane dynamics and receptor-mediated endocytosis28.
Although VSG13 and VSGsur present marked divergences from previously reported VSG structures, the variability in these two Variant Surface Glycoproteins is housed within more generally conserved features that make them clear members of a protein superfamily. Most obvious is the core 3-helix bundle scaffolding that undergirds all the VSGs and VSG-related proteins such as Serum Resistance-Associated protein (SRA)29 and the haptoglobin–hemoglobin receptor30. The divergent structures in the top and bottom lobes of the VSGs are basically different insertions between the loops connecting the central helices of the core of these rod-like molecules. Secondly, the proteins all evince a shared functionality in antigenic variation by presenting distinct molecular surfaces to the extracellular environment with extensive variation in amino acid sequence, charge and hydrophobic distributions, and topography (Fig. 1c).
Resistance studies with suramin
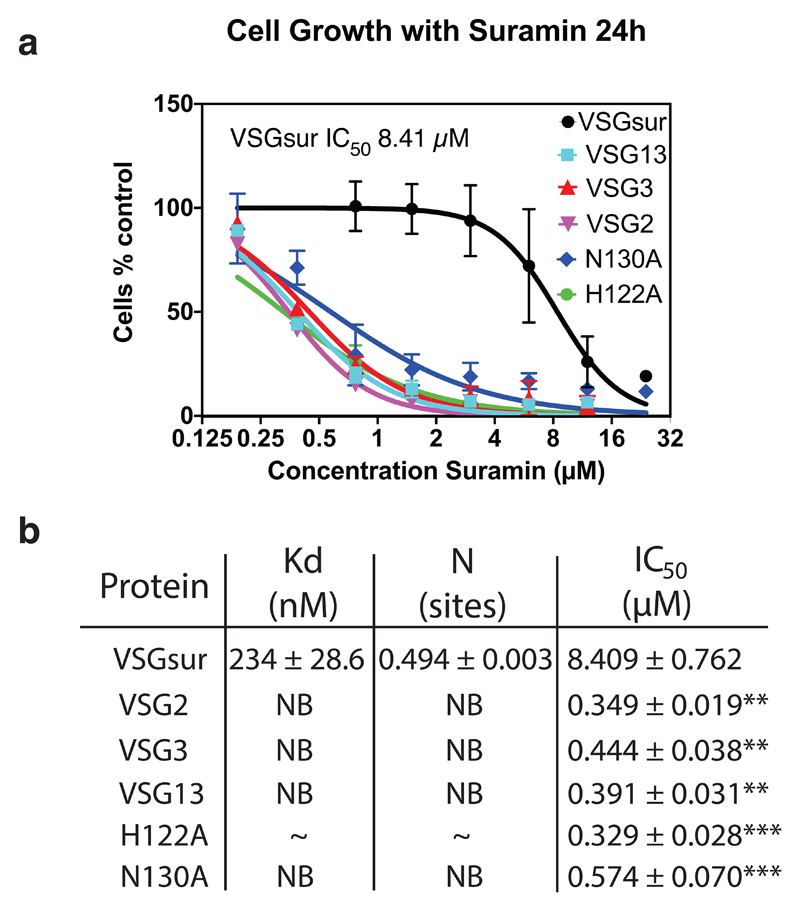
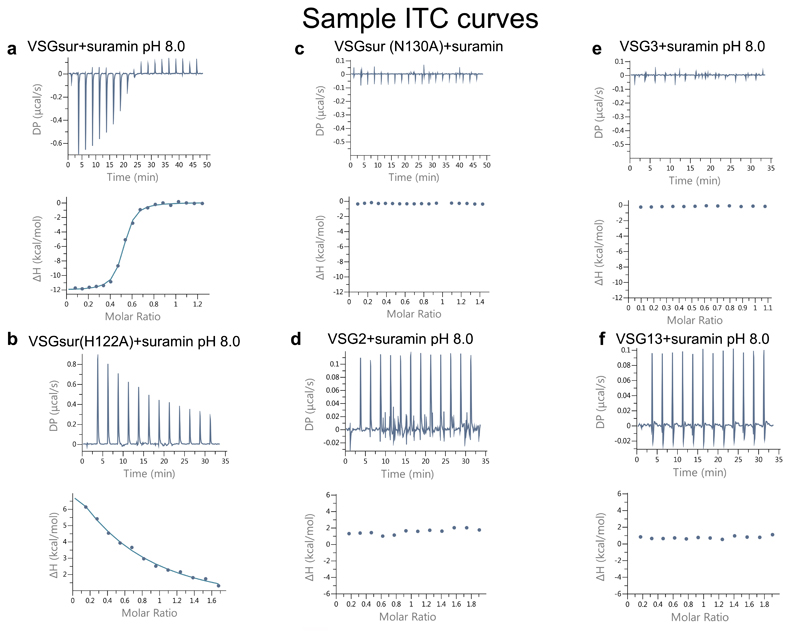
To examine whether the resistance mechanism associated with the expression of VSGsur involved direct protein-to-drug binding, we tested T. brucei rhodesiense VSGsur (expressed in T. brucei brucei) and a panel of other VSGs from T. brucei brucei Lister 427 (including VSG13) for their effect on suramin susceptibility and suramin binding (Fig. 2). Toxicity experiments demonstrated that, similarly to what has been shown for several VSGs from T. brucei rhodesiense and T. brucei brucei strain BS22118,23, suramin killed all VSG expressing Lister 427 strains we examined (VSG2, VSG3, and VSG13), whereas those expressing VSGsur were resistant to over 20 times higher concentrations of the drug (Fig. 2, a and b). In more detail, VSGsur evinced half maximal inhibitory concentration (IC50) of 8.41±0.76 μM, whereas VSG2, VSG3, and VSG13 had IC50 values below 0.45 μM (Fig. 2, a and b). At a concentration of 0.7 μM suramin (slightly above the IC50 values of the other VSGs), VSGsur shows no significant differences in growth compared to untreated (Extended Data Fig 4). Isothermal titration calorimetry (ITC) showed that while suramin did not bind to VSG2, VSG3, or VSG13, it bound with nanomolar affinity to VSGsur (Fig. 2b and Extended Data Fig. 3).
Fig. 2. Suramin Binds only VSGsur and is more toxic to all other VSGs examined.
(a) Growth curves of different VSGsur expressing strains at different suramin concentrations. The IC50 value was calculated for each curve (with independent experiments numbering three for VSG13, VSG3, and VSG2, four for VSGsur, and five for VSGsur mutants H122A and N130A) using a least squares, non-linear fit (Graphpad Prism, inhibitor concentration vs. normalized response with variable slope and the error bars showing the standard deviation of the mean). P < .0001 with the null hypothesis that there is no significant difference between any of the IC50 values, indicating extremely significant differences (alpha = 0.05, F(DFn, DFd = 169.3 (5, 129)). (b) Isothermal calorimetric results of suramin binding to different VSGs. “NB” indicates no binding. “~” for the VSGsur H122A mutant indicates evidence of weak binding, but a satisfactory fit to the curve could not be made (Extended Data Fig. 3). The binding for H122A is expected to be in the high μM range. ITC runs were performed with aliquots from the same samples run several times, independently. Details on the ITC measurements are in Extended Data Fig 5. For the IC50 values listed in the third column of the table, significance tests were made between VSGsur and the other VSGs using an unpaired two-tailed t-test (**P<.01 and ***P<.001; VSGsur vs. VSG13, P value=0.0044, VSGsur vs. VSG2, P value=0.0043, VSGsur vs. VSG3, P value=0.0046, VSGsur vs H122A, P value=0.0003, VSGsur vs. N130A, P value=0.0004). The error measurement for the IC50 values is the standard deviation of the mean.
Co-crystal structure of VSGsur with suramin
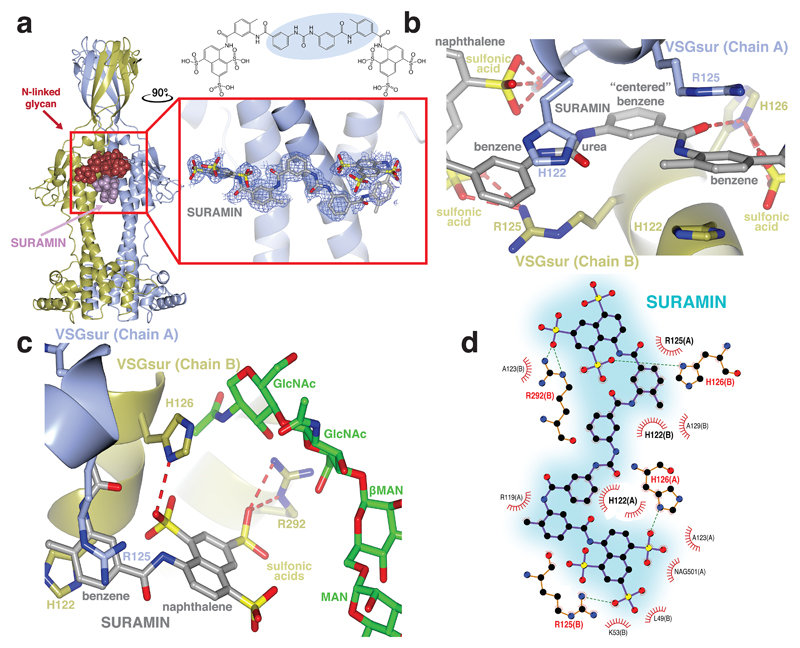
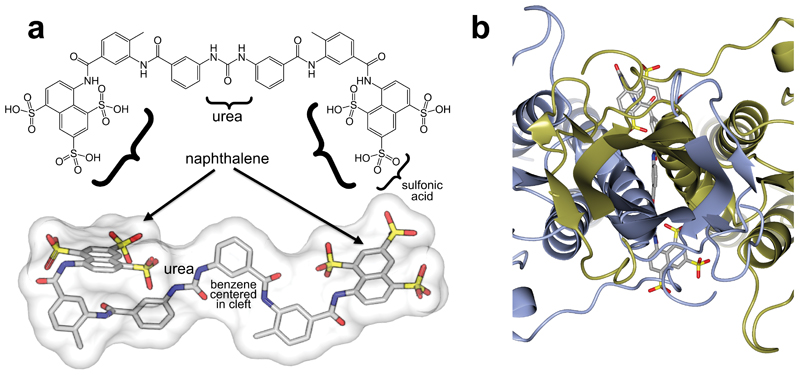
The above data motivated efforts to co-crystallize suramin together with VSGsur. Soaking native crystals in high concentrations of suramin led to well-diffracting crystals although the binding of suramin changed the space group, resulting in a dimer in the asymmetric unit into which the drug could be modeled (Methods, Supplementary Table 1 and Supplementary Methods). Interestingly, the chemically symmetric drug suramin bound at the dimerization interface asymmetrically (Fig. 3a). Suramin binds tightly in the large cavity between the two monomers of VSGsur, burying a surface area of approximately 700Å2 with more than one hundred atomic contacts characterized by both hydrogen bonding and non-bonding interactions. Suramin (C51H40N6O23S6) is a symmetric, polysulphonated naphthylurea (Extended Data Fig. 4a). The compound is centered on the urea functional group (NH–CO–NH). Extending from the urea moiety in each direction are a pair of benzene rings (thus a total of four in the molecule), each connected by an amide and finally linking to a terminal naphthalene decorated with three sulfonic acid groups (therefore, two naphthalenes and six sulfonic acids in total, Extended Data Fig. 4a). The rotation axis of the VSGsur dimer passes through one of the benzene rings connected to the urea group (Fig. 3a and Extended Data Fig. 4b). Thus, the central urea group of suramin binds just “off center” with respect to the dimer rotation axis. Three of the four benzene groups in the center of the suramin molecule bind in the middle of the dimer interface. These are well-ordered in the structure, with clear electron density and B-factors lower than the average of the overall structure (protein, ligands, and solvent). The naphthalene rings, however, show weaker electron density and high B-factors, characteristic of more disorder or conformational flexibility. Their extension outside the cavity results in fewer contacts from VSGsur to stabilize their conformation.
Fig. 3. Suramin binds in the cavity between the VSGsur monomers.
(a) On the left is the overall structure of the VSGsur-suramin co-crystal structure in ribbon diagram form similar to that depicted in Fig. 1. Suramin is shown in purple as a space-filling representation. The red box around the drug is expanded in the boxed image on the right (rotated 90 degrees counterclockwise about a vertical axis), showing a ball-and-stick rendering of the compound with a blue wire-cage of the 1σ contour of the 1.9Å 2Fo-Fc electron density map of the refined molecule drawn around it. Suramin is shown as a ball-and-stick chemical representation with oxygen atoms are shown in red, nitrogen in blue, and carbon gray. (b) VSGsur is depicted as in Fig. 1 and suramin as in panel (a). Side-chains from VSGsur are shown in ball-and-stick representation and colored according to the chain to which they belong (blue and gold). Hydrogen bonds are shown as red-dashed lines. (c) Contacts between the N-linked glycan (with carbon atoms colored green, oxygen red, and nitrogen blue) and VSGsur, shown and colored as in (b). GlcNAc indicates N-Acetylglucosamine, MAN indicates mannose, and βMAN indicates β-mannose. (d) Schematic illustrating the contacts of VSGsur to suramin, focused on the ligand (generated by PDBsum55 using LigPlot56). Structures were illustrated with CCP4mg48.
Four amino acids from each monomer in the dimer contribute the bulk of protein contacts to the drug: H122, R125, H126, and R292 (Fig. 3, b and c). These positively charged residues are centered in the cavity of the dimer interface, burying the majority of surface area upon drug binding. These major contacts are buttressed with a set of minor interactions from residues L49, R119, A123, and A129, as well as from the N-linked glycan, several of these moieties only making contact from one protein monomer to some of the more distally positioned elements of suramin (such as the more poorly ordered sulfonic acids connected to the naphthalene rings, Fig. 3, c and d). The side chain nitrogen atoms from two arginine residues, R125 and R292, both make hydrogen-bonds with the sulfate oxygens of the most distal naphthalene moieties of suramin, as does H126. Other residues such as L49, R119, A123, and A129 primarily make close-approach, non-bonding contacts (Fig. 3d).
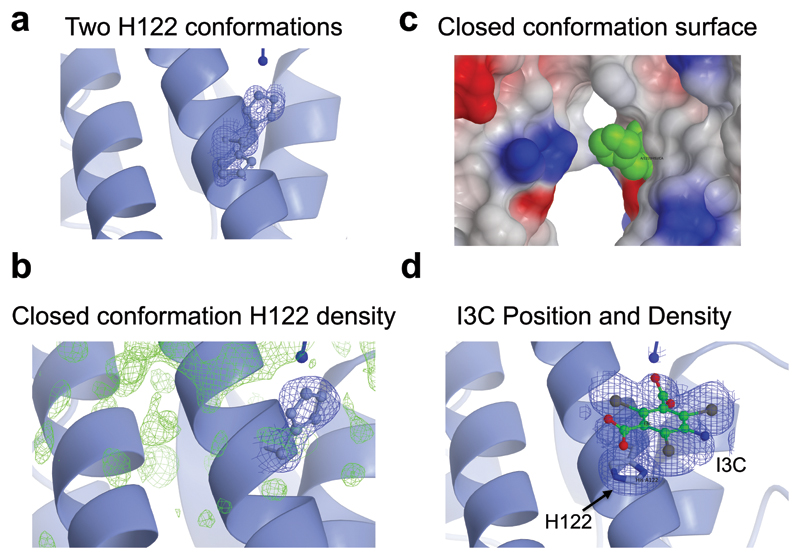
The interface centers on the imidazole rings of H122. In both monomers these residues make extensive contacts, stacking with two of the benzene rings of suramin (Fig. 3b). In the native protein structure, H122 has two different, partially occupied conformations in the monomer of VSGsur (Extended Data Fig. 5, a-c). One is very similar to the conformation seen in the suramin bound co-crystal structure whereas the other is a different rotamer, flipped away from this position. The presence of the drug locks the histidines in the stacking interaction with the suramin benzene rings, abolishing any evidence of the other possible conformation. The suramin benzene ring between the two rings contacted by H122, and which is centered in the dimer interface, interacts with VSGsur via backbone and sidechain contacts from R125 and H126. Interestingly, the benzene group of the compound used to phase the structure (5-amino-2,4,6-triiodoisophthalic acid, I3C or “Magic Triangle”, Methods), occupies the same position as the suramin benzene groups, stacking similarly with H122 (Extended Data Fig. 5d, Supplementary Table 1).
The N-linked sugar groups (the N-acetylglucosamine (GlcNAc) rings, the β-mannose, and another mannose residue in the carbohydrate chain) make contacts to the sulfonic acids decorating the naphthalene rings (Fig. 3c). These contacts only occur for the sugar chain of one molecule, as the asymmetric positioning of suramin in the cavity leads the other naphthalene group to protrude too far from the carbohydrate to make effective contacts.
Mutations in the suramin binding site abolish drug resistance
Altogether, the ITC and structural results show that unlike other VSGs, even the related VSG13, VSGsur binds suramin specifically and with high affinity. To examine whether the resistance phenotype of cells expressing VSGsur is tied to this binding, we created mutants (Extended Data Fig. 6, Methods) that should not disrupt the fold of VSGsur. One mutant was a direct loss-of-contact alteration, changing H122 to alanine (H122A), thereby removing the stacking of the two histidine rings to the benzene groups in the most ordered binding mode of the ligand. The second was indirect, mutating N130 to alanine (N130A), thereby preventing the N-linked glycosylation from occurring and removing the sugar-to-drug interactions.
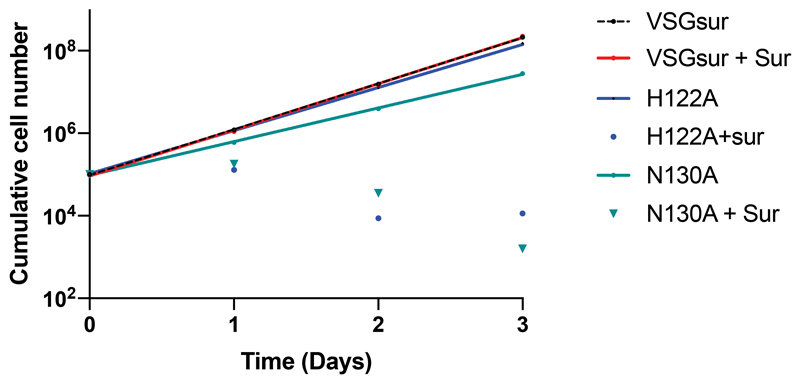
Fig. 2 summarizes these results. Both mutants were viable and grew in the absence of the drug with doubling times of 8.9h ± 0.73 (N130A) and 6.9h ± 0.18 (H122A) as compared to 6.5h ± 0.35 for the wild type (values showing the standard deviation, n=6, see also Extended Data Fig. 2). The mutant VSGs behaved similarly to the wild type protein during purification, suggesting that the changes did not destabilize or otherwise compromise the proteins. However, they both lacked the heightened resistance to suramin of the wild type protein (Fig. 2a). This loss is correlated with a loss in binding to the drug (Fig. 2b), directly linking the suramin-VSGsur interaction to the resistance phenotype.
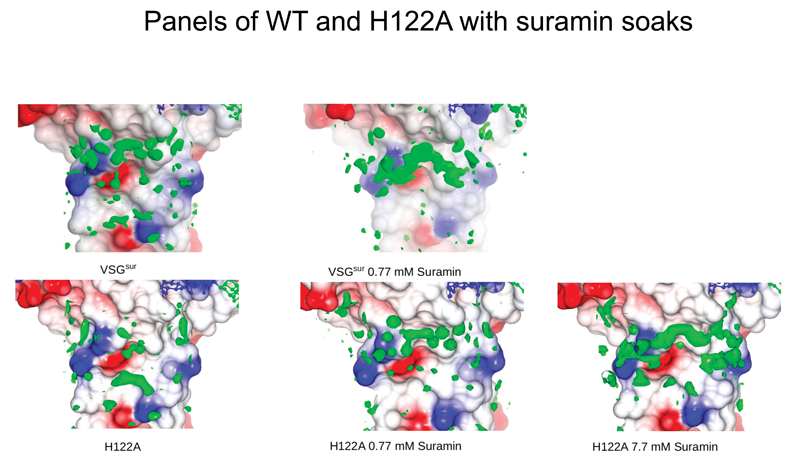
To verify that the mutations did not perturb the fold of VSGsur, we solved the crystal structure of the VSGsur mutant H122A (Supplementary Table 3), showing a nearly identical structure to wild type VSGsur. We were unable to obtain well-diffracting crystals of the mutant N130A, likely as the sugar is significantly involved in crystal packing contacts. High concentration, long-duration soaks of suramin into the H122A mutant (Methods, Supplementary Table 3), however, revealed the presence of significant difference density in the pocket, but the density was poorly ordered and we were unable to confidently model suramin (Extended Data Fig. 7).
Distal alterations to the suramin binding pocket are associated with increased resistance to suramin
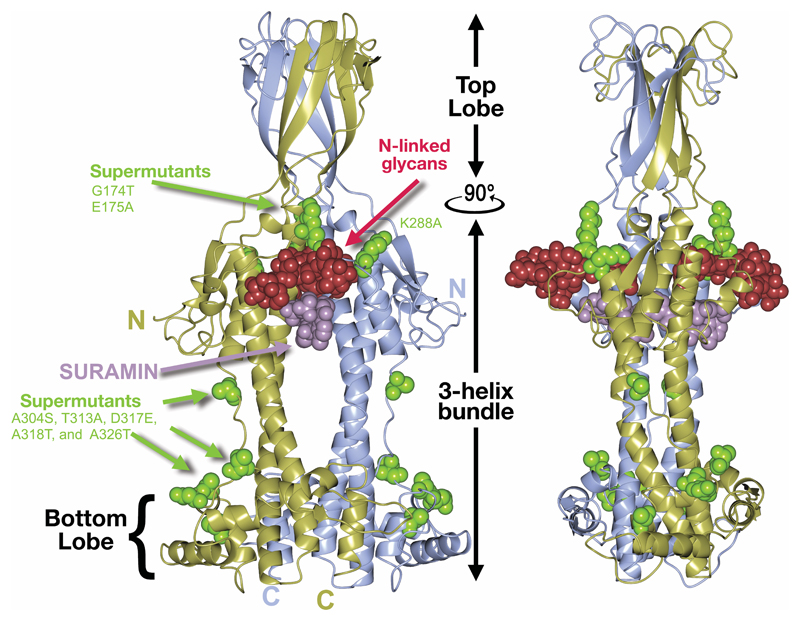
We further subjected T. b. rhodesiense STIB900_sur18, which expresses VSGsur and is about 100-fold more resistant to suramin than other strains (IC50 of 1.1±0.13 μM), to increasing suramin pressure in vitro (up to 18 μM over one year). This produced mutants that tolerated higher levels of the drug (IC50 of 11±1.2 μM). Analysis of the expressed VSG of a highly resistant clone showed that it was VSGsur with 14 mutations in the nucleotide sequence, producing eight amino acid substitutions in the protein sequence. These mutations clustered in the structure in two locations (Extended Data Fig. 8). G174T, E175A, and K288A are located around the N-linked glycan with several contacts to the sugar. They do not, however, contact the drug but could conceivably modulate contacts to suramin indirectly through its interactions with the carbohydrate. A304S, T313A, D317E, A318T, and A326T cluster on one face of the bottom lobe, distal from the drug binding site, creating a patch of surface of exposed residues. This distance from the binding pocket makes it very likely that these mutations do not affect drug binding and thus could represent a functional region of VSGsur that interacts with other factors critical to generating resistance.
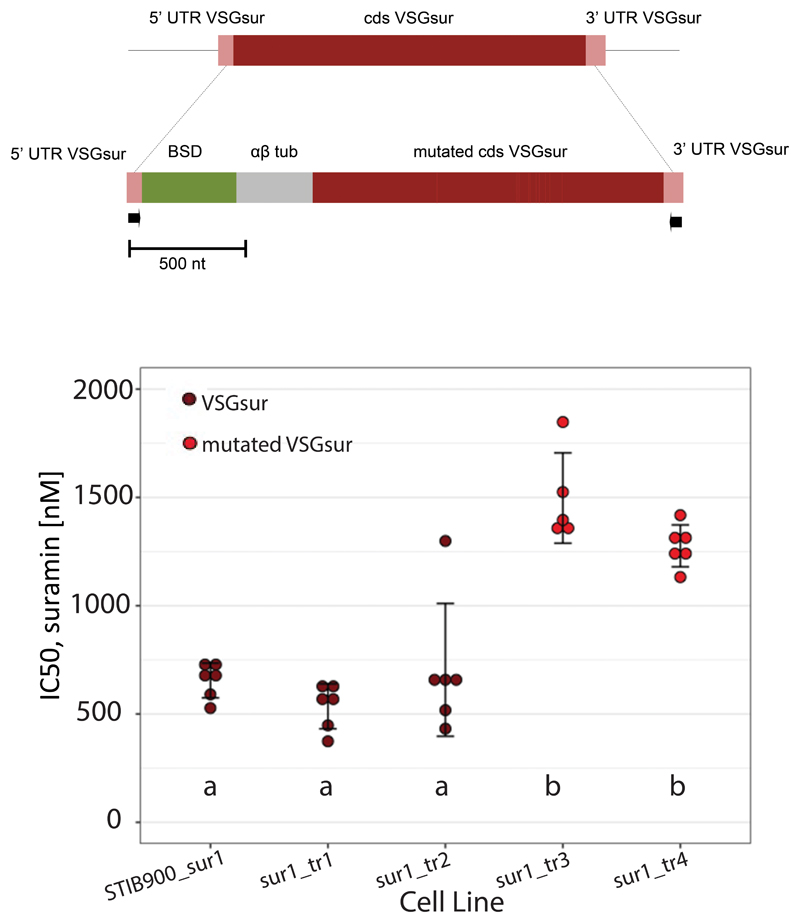
A construct of the mutant VSGsur was targeted into the active VSG expression site of T. b. rhodesiense STIB900_sur1 (Extended Data Fig 11a). Of four transfected clones, two had replaced VSGsur with the mutant version and two had retained the original VSGsur, as verified by PCR. The clones with the original VSGsur sequence showed equivalent resistance to previously characterized strains expressing VSGsur, whereas the two clones that expressed the mutant version of VSGsur showed an increase in their IC50 to suramin (Extended Data Fig. 11b), suggesting that these mutations indeed further enhance suramin resistance. However, this increased resistance was only slightly more than 2-fold higher than that mediated by wild type VSGsur, indicating that there are likely other mutations in the selected mutant strains that synergize with the VSGsur mutations to produce the full 11-fold increase in IC50.
Alterations in endocytic trafficking are not coupled to resistance
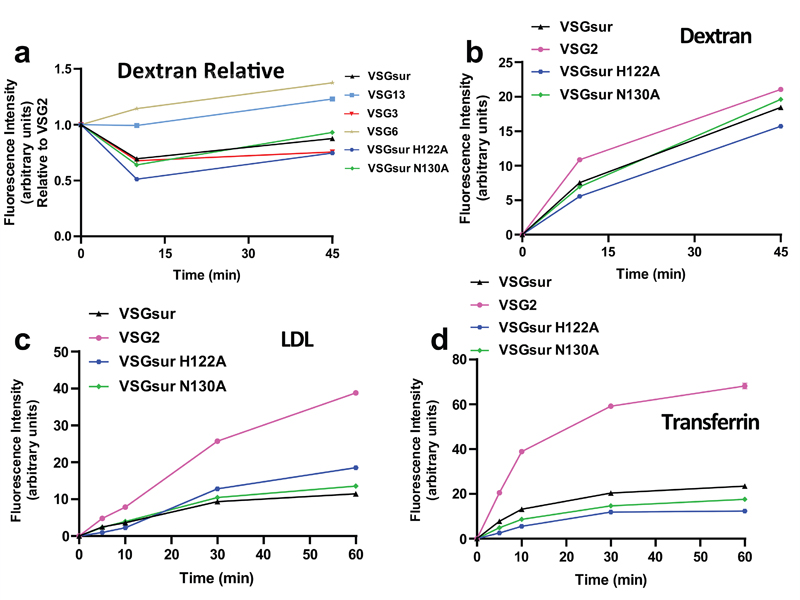
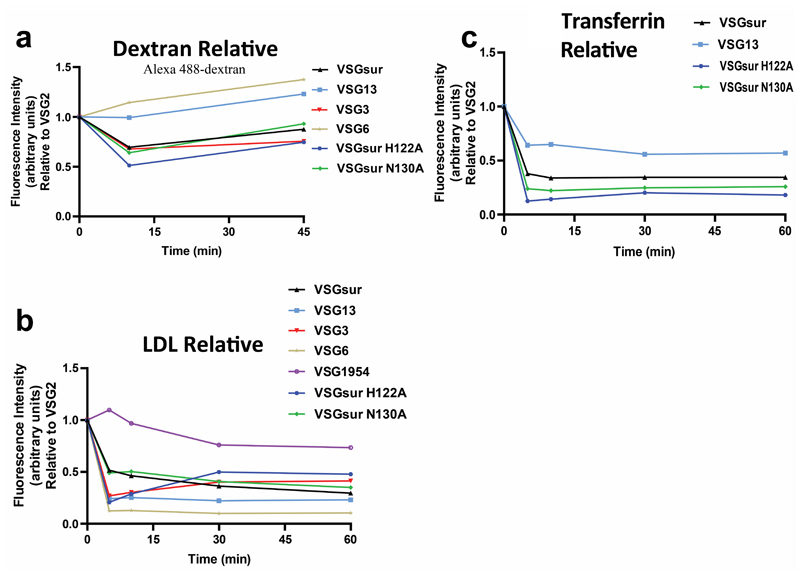
Wiedemar et al. had shown that VSGsur expressing strains have reduced levels of endocytic trafficking relative to VSG2 (also called VSG221), and, in particular, a reduced internalization of LDL, a factor hypothesized to be involved in suramin uptake into the cell21–23. Therefore, VSGsur might enhance resistance to the drug by decreasing suramin uptake through reducing endocytosis via the LDL receptor. However, as VSGsur likely comprises over 99% of the surface protein on the parasite and binds suramin with nanomolar affinity at blood pH, understanding suramin uptake in these strains is complicated by the potential for a massive influx of the drug as the VSG is internalized and then recycled back to the membrane31. To interrogate this model, we performed endocytosis experiments with blue dextran and bodipy-labeled LDL (Fig. 4, Methods, Supplementary Data). Our data show that, consistent with previous results23, there does not appear to be a VSGsur-specific defect in fluid phase endocytosis. Also consistent with previous results23, we do observe that VSGsur cells have a significant decrease in LDL uptake compared to VSG2 (although there is substantial variance among different VSGs, Extended Data Fig. 12). However, loss-of-binding suramin mutants show no significant alteration in these kinetics (Fig. 4c). Similar results are seen with uptake via the transferrin receptor (Fig. 4d). As these mutants also lose resistance to suramin, it seems that the dynamics of LDL uptake (and thus, presumably, suramin via this pathway) are not strongly coupled to the resistance phenotype in VSGsur. In contrast, the key determinant appears to be the binding of the drug to VSGsur.
Fig. 4. VSGsur and the loss of contact mutants have indistinguishable endocytic kinetics.
(a) Alexa 488-dextran endocytosis by T. b. brucei 2T1 cells expressing a variety of different VSG genes. Due to technical limitations, each cell line could not be analyzed simultaneously within each experiment for each ligand. Therefore, VSG2 was used as a control in all experiments, allowing the calculation of the relative uptake rate for each cell line rate as compared to the uptake rate of each ligand observed by VSG2 expressing cells within each separate experiment. Each of these graphs therefore represent the combined experimental results from 2 separate experiments. Cell lines with a relative fluorescence intensity below 1 at a given time point have less efficient endocytic rates compared to VSG2 expressing cells, and vice versa. All graphs share the same Y axis. Error bars when present denote the range (two individual experimental replicates for each cell line at every time point). (b)-(d) Alexa 488-dextran (b), bodipy-LDL (c), and Alexa 488-transferrin (d) endocytosis by T. b. brucei 2T1 cells expressing VSGsur (black triangles), VSG2 (pink circles), VSGsur H122A (blue hexagons), or VSGsur N130A (green diamonds). All graphs depict arbitrary fluorescence units, determined by flow cytometry, on the Y axis. Each graph represents one of multiple biological replicates of each experiment, with n=2 individual experimental replicates for each time point.
Discussion
Despite the wide genetic variance in the VSGs, only a handful of the membrane distal, antigenically distinct NTD domains have been characterized at the atomic level24–27. With the structures of VSGsur and VSG13 presented here, we show that the “antigenic space” of the VSGs is much broader than anticipated. Moreover, the co-crystal structure of VSGsur with the trypanocidal compound suramin directly links the binding of the drug to the resistance phenotype displayed by strains of T. brucei expressing VSGsur.
This binding of suramin establishes that the VSGs can have a function beyond that of antigenic variation. This idea is buttressed by recent results that show that VSG2 is able to bind a ligand as well (the divalent metal calcium, manuscript in preparation). Also consistent with this, the recently determined crystal structure of the T. congolense haptoglobin–hemoglobin receptor30 shows that this protein adopts a fold very similar and clearly related to the VSGs, packing functionally with all possible VSGs on the surface as it is required for parasite survival in the host to scavenge iron. These observations raise the possibility of other functions for the VSGs in binding small molecules or even proteins, and to therefore function for the benefit of the pathogen in manners more diverse than mere immune evasion.
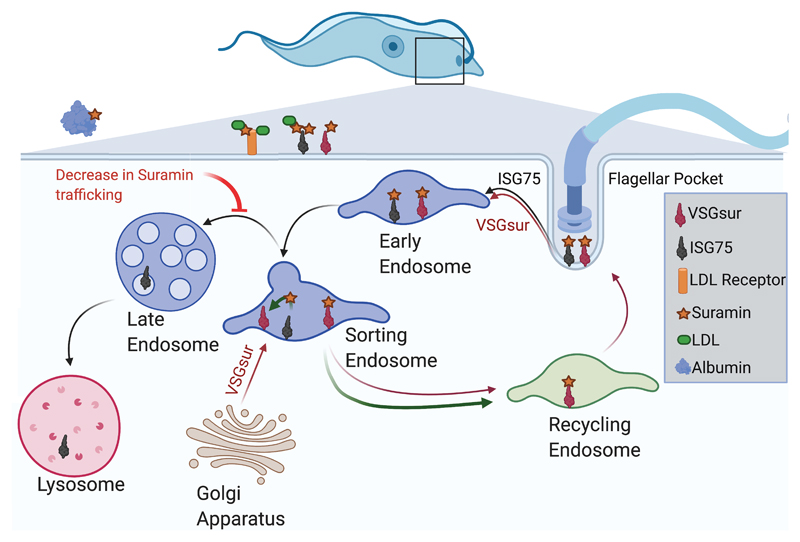
A parsimonious model to explain VSGsur-mediated resistance involves the VSG redirecting the trafficking of the drug, shunting it to some kind of disposal pathway and thereby reducing the effective concentration in the cell (Fig. 5). VSGsur is continuously produced at high levels in the trypanosome and exported toward the cell surface from the Golgi through the vesicular trafficking pathways. Therefore, suramin that is internalized through other pathways (e.g., via the LDL receptor or ISG75) could comingle with VSGsur in specific endocytic compartments, the newly synthesized VSG binding the drug and preventing it from trafficking further (see also additional discussion in Supplementary Data). Such a model is in harmony with the known parameters of VSG production and suramin uptake. For example, cells expressing VSG2 treated with a 200 nM dose of suramin accumulate an intracellular concentration of 1.8 μM suramin within 15 minutes, finally plateauing at a concentration 2-3 fold higher32. The production rate of newly-synthesized VSG has been estimated as equivalent to between 20,00033 and 80,00034 VSG monomers per minute. Therefore, with an estimated cell volume of ~30 cubic microns35, we calculate that there is approximately a 5-20 fold excess of newly synthesized VSGsur available to export receptor-internalized suramin at an extracellular drug concentration of 200 nM (Supplementary Methods). Other considerations aside, this would allow for the cell to clear suramin in a range of extracellular concentrations from 1 μM to 4 μM, very near our measured IC50 of 8.4 μM. Such “other considerations” include issues such as the growing contribution of fluid phase import at higher suramin concentrations, the actual toxic levels of suramin in the cell (and, more critically, in what compartments), the binding of suramin to serum proteins, as well as other unknowns. Nevertheless, this simple model of newly-produced VSGsur serving to bind the imported suramin and shunt it out of the endocytic lysosomal pathway matches well with what we know about suramin import and VSG dynamics.
Fig. 5. Model for possible mechanism of VSGsur-mediated resistance to suramin.
A schematic illustration of how VSGsur could shuttle suramin away from toxic endocytic internalization pathways. A single trypanosome cell is depicted in blue at the top of the diagram, the boxed region magnified showing the vesicular transport compartments. Critical players like ISG75, the LDL receptor, blood proteins, and VSGsur are shown as defined in the key. In this model, unbound, newly-synthesized VSGsur is trafficked for export to the cell surface, binds internalized suramin in endocytic compartments, and removes it from the endocytic pathway. This decreases the effective concentration of the drug, thereby rendering the cell more resistant to the drug.
The higher-resistance VSGsur mutants could offer a tantalizing clue toward investigating some of the unknowns and uncovering the mechanism of suramin toxicity. While one subset of the mutations clusters around the carbohydrate and could conceivably alter binding to the drug, another set clusters in a surface patch on the bottom lobe of the protein. This patch is suggestive of a binding site and may point the way toward future studies of the macromolecular interactions involved in suramin resistance.
Methods
Cloning and Production of T. brucei strains
A VSG13 expressing T. brucei clone was produced as described36 and was kindly provided by the group of Luisa Figueiredo (Universidade de Lisboa). VSGSur from T. brucei rhodesiense (GenBank: MF093647.1) was codon-optimized and synthesized as a pUC19 clone (BioCat, Germany), and introduced into T. brucei strain Lister427 as described in Supplementary Methods. VSGsur mutants N130A and H122A were generated by site-directed mutagenesis using the QuikChange Lightening kit (Agilent Technologies) according to the manufacturer’s protocol. Transfections were performed into a T. brucei brucei cell line expressing VSG2, termed 2T137. 5-10 micrograms of purified plasmids were mixed with 100 μl 3 x 10⁷ cells in Tb-BSF buffer38 (90 mM Phosphate buffer, pH 7.3, 5 mM KCl, 50 mM HEPES, pH 7.3, 0.15 mM CaCl2) and electroporated using a Lonza Nucleofector 2b, program Z-001 or X-001. After 8 hours of incubation hygromycin B was added to a concentration of 5-25 μg ml-1. Single cell clones were obtained by serial dilutions in 24 well plates in standard culture medium and screened by FACS for VSG2-antibody binding. VSG2-antibody negative clones (positive transfectants were identified by lack of binding) were sequenced: RNA was isolated using the RNeasy Mini Kit including an on-column DNase treatment (Qiagen). Complementary DNA was synthesized with SuperScript IV Reverse Transcriptase (Invitrogen) according to the manufacturer’s protocol. Amplification was performed with a forward primer binding the spliced leader sequence and a reverse primer binding in the VSG 3′UTR using Phusion high fidelity DNA polymerase. PCR products were purified by gel extraction from a 1% agarose gel, followed by the NucleoSpin Gel and PCR clean up kit (Macherey-Nagel) and sent to Eurofins (Ebersberg) for sequencing using the same primers as for the PCR.
Purification of VSGs
T. b. brucei expressing VSG2, VSG3, VSG13, VSGsur, VSGsur-N130A, and VSGsur-H122A mutants were cultivated in vitro in HMI-9 media (formulated as described by PAN Biotech without FBS, L-cysteine, or ß-mercaptoethanol), supplemented with 10% fetal calf serum (Gibco), L-cysteine, and ß-mercaptoethanol. Cells were cultured at 37°C and 5% CO2. VSGs were purified according to established protocols40. Briefly, cells were pelleted and then lysed in 0.4 mM ZnCl2. The lysis mixture was centrifuged and the pellet containing the membrane material was resuspended in pre-warmed (40 °C) 10 mM phosphate buffer, pH 8. Following a second centrifugation, supernatant containing VSG protein was loaded onto an anion-exchange column (Q-Sepharose Fast-Flow, GE Healthcare), which had been equilibrated with 10 mM phosphate buffer, pH 8. The flow-through containing highly pure VSG was concentrated in an Amicon Stirred Cell and optionally shock frozen in liquid nitrogen and stored at -80°C.
For crystallization of VSG13, the C-terminal domain was removed by digestion with Endoproteinase LysC (NEB) at a 1:800 LysC:substrate ratio by mass for 1-2h at 37°C. VSG13 N-terminal domain was purified by gel filtration on a HiLoad 16/600 Superdex 200pg column (GE Healthcare) in 50 mM HEPES, pH 7.6, 150 mM NaCl. Lysine residues were methylated (as per41), using Dimethyl-amine-borane complex (Sigma) and Formaldehyde (Thermo, Methanol-free). The methylated VSG13 N-terminal domain was purified by gel filtration on a Superdex 200 Increase 10/300 GL (GE Healthcare) in 10 mM Tris.Cl, pH 8.0. Fractions from the gel filtration runs were subjected to SDS–PAGE analysis for visual inspection.
For crystallization of VSGsur and VSGsur mutants, the C-terminal domain was removed by limited proteolysis with trypsin at a 1:100 trypsin:substrate ratio by mass for 1h on ice. The VSGsur N-terminal domain was purified by gel filtration on a HiLoad 16/600 Superdex 200pg column (GE Healthcare) in 10 mM Tris.Cl, pH 8.0. The peak fractions were pooled and concentrated to 4 mg/ml.
Structural Determination of VSG13
Purified methylated VSG13 N-terminal domain was concentrated to 2.5 mg ml−1 in 10 mM Tris.Cl pH 8.0. Crystals were grown at 23°C by vapour diffusion using hanging drops formed from mixing a 1:1 volume ratio of the protein with an equilibration buffer consisting of 1.8-2.0 M (NH4)2SO4, 100 mM Tris.Cl pH 8.5. For cryoprotection, crystals were transferred into the same buffer including 20% glycerol and flash-cooled immediately afterward to 100 K (−173.15 °C). For phase determination, crystals were soaked for 30s in a buffer containing 0.5 M sodium bromine and 20% glycerol before flash-freezing.
Native data were collected at the European Synchrotron Radiation Facility (ESRF) at a wavelength of 1Å on beamline ID29 and bromine soaks at the Diamond Light Source at 0.9198Å on beamline i03 (Supplementary Table 2). The data were phased by single-wavelength anomalous diffraction (SAD) from 33 bromine sites that were identified using the SHELX suite42. Several models were manually combined from automated model building by PHENIX43 and CRANK of CCP444 into maps produced from the SHELX sites and improved by several cycles of manual building, auto-building (PHENIX), and refinement (PHENIX) into the native dataset (Supplementary Table 2).
Structural Determination of VSGsur and VSGsur mutants
Crystals were grown at 4°C by vapour diffusion using hanging drops by mixing 2 μl of the protein solution (4mg/ml) with 2 μl of the equilibration buffer (19-24 % PEG 400, 100 mM TEA/HCl pH=7.5 and 10 % (v/v) isopropanol). The crystals were transferred to a cryobuffer (40% PEG400 and 100 mM TEA/HCl) and flash-cooled in liquid nitrogen. Native datasets were collected at a wavelength of 0.9184 Å at the Helmholtz-Zentrum Berlin at Beamline MX 14.1. For phasing the crystals were soaked overnight in 50 mM 5-amino-2,4,6-triiodoisophthalic acid (I3C)/LiOH (Magic Triangle, Jena Biosciences)45 in cryobuffer. The I3C-soaked crystals were collected at a wavelength of 2.066 Å at the Helmholtz-Zentrum Berlin at Beamline MX 14.2. The structure was solved by SAD from the anomalous signal from two I3C molecules bound per VSGsur monomer using the SHELX42 and the HKL300046 suite. Arp/wARP47 was used for automated building of the initial model. PHENIX43 and COOT48 were used for several cycles of model building and refinement.
Suramin complexes were obtained by either soaking VSGsur crystals in the drug or by pre-mixing and growing crystals de novo. Complexes were produced by soaking the crystals between 1 hour and 6 days in cryobuffer supplemented with 0.77 - 7.7 mM Suramin before cryo-cooling. Co-crystals were obtained at 4°C using 3 mg/ml VSGsur, 0.7 mM Suramin and an equilibration buffer containing 16-20% PEG 3350, 200 mM NaCL and 100 mM Hepes/NaOH pH=7.5. Prior to cryo-cooling these crystals were transferred to 16 % PEG 3350, 200 mM NaCl, 100 mM Hepes/NaOH pH=7.5, 0.7 mM Suramin and 25 % PEG 400. The VSGsur-suramin datasets were collected at the Helmhotz-Zentrum Berlin, the Paul Scherrer Institut Villingen, and Diamond Light Source. The structures were solved by molecular replacement with PHENIX using the native structure of VSGsur as the search model (Supplementary Table 1; see also Supplementary Methods for additional information).
Uptake Assays
The LDL and transferrin uptake assays were performed as described23 with slight modifications while the dextran assays were performed similarly. Cells were cultured to a density of approximately 1 x 10⁶ cells per mL of HMI-9. For LDL and transferrin, the cells were pelleted and washed in serum-free medium containing 1% BSA before being returned to 37°C for 15 minutes to remove any surface-bound ligand. Approximately 100,000 cells were aliquoted into assay tubes in duplicate and kept at 37°C. Pre-warmed bodipy-labeled LDL (Invitrogen; ThermoFisher catalog number I34359) suspended in serum-free medium containing 1% BSA was added to the tubes at the indicated time points such that the final volume of the assay was 150 μL and the concentration of LDL was 15 μg/mL. Being at a much higher concentration as a stock, 2 μL of transferrin (Invitrogen; ThermoFisher catalog number T13342) was added to the assay tubes to a final volume of 200 μL and a final concentration of 50 μg/mL. The assays were conducted such that all conditions reached the end point of the assay simultaneously. At time zero, all vials were placed on ice and 1 mL of ice-cold serum-free medium containing 1% BSA was added to the tubes. The cells were washed twice by centrifugation at 2000 x G for 5 minutes and resuspended in ice cold serum-free medium containing 1% BSA. The vials were then kept on ice until being analyzed on a Becton Dickinson FACSCalibur. Fluorescence intensity was quantified by analysis in FlowJo after gating on cells determined by forward and side scatter. The geometric mean of fluorescence was then calculated for between 7000 and 10,000 cells per replicate per time point for each cell line assayed. To control for differences in intrinsic auto-fluorescence, each cell line was individually normalized to its own “time 0” point, which was collected from cells that had been exposed to ice cold ligand and immediately placed on ice. These “time 0” points were generally within only 1-2 fluorescence units of each other. For dextran, approximately 100,000 cells were aliquoted into assay tubes and pelleted. The cells were suspended in 50 μL of 0.5 mg/mL Alexa 488-dextran diluted in HMI-9 and kept at 37°C until reaching the expiry of the incubation. Once reaching those time points, the cells were immediately placed on ice and 1 mL of ice cold HMI-9 was added to the tubes. The cells were washed three times by centrifugation at 2000 x G for 5 minutes and resuspended in ice cold HMI-9. The vials were then kept on ice until being analyzed on a Becton Dickinson FACSCalibur and fluorescence was quantified as above.
Production of higher-resistance strains
Bloodstream-forms of T. b. rhodesiense_sur1 were further selected in vitro by stepwise increases of the suramin concentration from 1 μM to 18 μM over the course of one year. The expressed VSG gene was amplified from cDNA by PCR with primers binding to the 5′ spliced leader and a conserved sequence (gatatattttaaca) on the 3′ untranslated region of VSGs49,50. For transfection, a construct was used containing the blasticidin resistance gene and the coding sequence of mutant VSGsur separated by a αβ tubulin splice site, and framed with the 5′ and 3′ UTRs of VSGsur (Extended Data Fig. 9). Transfected clones were generated by limiting dilution as described18.
Determination of growth rates and drug sensitivity assays
Cumulative growth curves for different VSG-expressing T. brucei strains were determined by dilution of the cells to 105 ml-1 in 25 cm2 cell culture flasks in duplicate. After incubation with 0.7μM suramin for 24 h the cell densities were determined by cell counting using a Neubauer hemocytometer. This procedure was repeated for 3-4 days in a row. Analysis was performed with GraphPad Prism, using a nonlinear regression model for curve fitting (Exponential growth with log).
For the drug sensitivity assays, serial dilutions of suramin (Sigma, dissolved in water and stored in aliquots at -20°C) as well as blank cultures without suramin, were prepared in 24 well plates (at least 3 technical replicates). Cells were added to a density of 10^5 ml-1. After 24 h the cell densities were determined with a Neubauer hemocytometer. Suramin sensitivity of T. b. rhodesiense was determined as described (ref 18, Wiedemar Mol Microbiol 2018). The 50% Inhibitory concentrations (IC50) were calculated with GraphPad Prism, using the non-linear regression model to fit the dose-response curve (variable slope; four parameters).
Isothermal Titration Calorimetry (ITC)
ITC experiments were performed using a PEAQ ITC (Malvern) at 20°C. Titration buffers contained 10mM NaPi (pH 8.00) and 150mM NaCl. Proteins were transferred into the titration buffer by gel filtration chromatography, followed by concentration in 10k disposable ultrafiltration centrifugal devices. Protein concentrations were measured by UV absorbance at 280 nm. In each experiment, the protein concentration in the cell varied between 40-55μM. Suramin was injected at concentrations between 300 and 600 μM, and all samples were degassed prior to each experiment. All VSG protein-suramin experiments were performed at least in duplicate to check the reproducibility of the data. The data were baseline corrected, integrated, and analyzed with the PEAQ ITC Analysis software (Malvern), fitted using a single-site binding model.
Extended Data
Extended Data Fig. 1. Comparison of the VSG NTDs.
(a) A single monomer of the VSGsur NTD is shown as a ribbon diagram. The β-sheet subdomain that forms the top lobe is colored in orange and the rest of the structure in beige. The N-linked glycan is shown as red space-filling spheres, the cysteine disulfide atoms as space-filling cyan spheres. (b) Structural alignment of monomers of VSGsur (orange) and VSG13 (gray) with corresponding glycans and disulfides shown in space filling representation and colored the same as the protein to which they are linked. The alignment produces an overall root-mean-square deviation of 1Å for the conserved portions of the structure (calculated over 220 Cα positions that primarily encompass the three-helix bundle and elements of the bottom lobe). (c) Comparison of the structures of VSGsur, VSG13, and VSG2. The N-linked glycans are displayed as red space-filling atoms and the disulfide bonds are shown in cyan. Approximate dimensions of the molecules are noted, as well as the directions toward the external environment and toward the C-terminal domain (CTD) and plasma membrane of the trypanosome.
Extended Data Fig. 2. Growth curves of VSGsur and VSG mutants.
Strains expressing VSGsur and VSGsur mutants were grown with and without suramin (incubation of 0.7μM suramin for 24 h, Methods). The cell densities were determined by cell counting using a Neubauer hemocytometer. This procedure was repeated for 3-4 days in a row. Analysis was performed with GraphPad Prism, using a nonlinear regression model for curve fitting (Exponential growth with log). For statistical comparisons, we tested whether the slopes and intercepts of the best fit curves were significantly different. For VSGsur and VSGsur + 0.7μM suramin, the differences between the slopes is not significant (P value = 0.7720). For H122A and N130A (without suramin) compared to VSGsur the differences are significant (P<.0113 and P<.0001, respectively). Two independent experiments with different cultures were made for each data point.
Extended Data Fig. 3. Sample ITC results.
ITC data for suramin binding to each VSG protein. The upper panels contain the baseline corrected raw data, and the lower panel contains the peak-integrated, concentration normalized data for the heat of reaction vs. molar ratio of suramin per VSG protein. (a) VSGSur was measured 3 times, independently: 300μM suramin was titrated into 46μM VSGsur, the curve fitted with a single binding site model to calculate a Kd of 234+/- 28 nM and N of 0.49 +/- 0.03 (b) VSGSur H122A was measured 3 times, independently: 450μM suramin was titrated into 51.1μM VSGSur H122A. A Kd could not be fit to the data, although it is clear that the mutation negatively affected the binding affinity. (c) VSGSur N130A was measured 2 times, independently: 300μM suramin was titrated into 40μM VSGSur N130A. No binding was detected. (d) VSG2 was measured 2 times, independently: 200μM Suramin was titrated into 20μM VSG2 protein. No binding was detected. (e) VSG3 was measured 2 times, independently: 300μM suramin was titrated into 53.1μM VSG3. No binding was detected. (f) VSG13 was measured 2 times, independently: 200μM Suramin was titrated into 20μM VSG132 protein. No binding was detected.
Extended Data Fig. 4. Two-fold axis of dimer symmetry for VSGsur-suramin complex.
(a) The top drawing illustrates the chemical structure of suramin with several of its functional groups denoted, whereas the bottom renders the drug as found in the protein structure with a transparent molecular surface shown. Oxygen atoms are shown in red, nitrogen in blue, and carbon gray. (b) Ribbon diagram of VSGsur (one monomer blue and the other gold) looking down the two-fold axis of symmrtry for the dimer. Suramin is shown as a ball-and-stick chemical representation as in (a). In the center of the rotational axis for the dimer, one of the suramin benzene rings is visible.
Extended Data Fig. 5. H122 “open” and “closed” conformations.
(a) Two H122 conformations in the native crystals structure of VSGsur with corresponding electron density (b) Closed conformation electron density of H122 (c) Closed conformation surface of VSGsur (d) Position of H122 and the I3C group used in phasing the crystal structure with corresponding electron density.
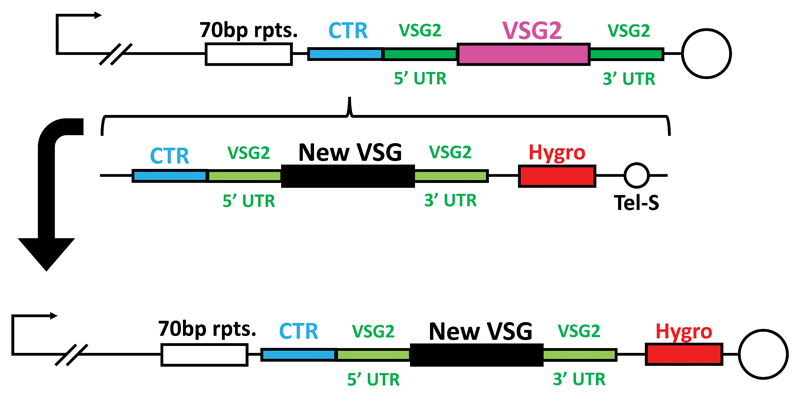
Extended Data Fig. 6. Creation of VSGsur and VSGsur mutant expressing strains.
The same construct was used multiple times to generate different VSG-expressing cell lines. The top schematic shows the endogenous sub-telomeric expression site in 2T1 cells, which express VSG2 (pink) with its endogenous UTRs (dark green). The vector used to integrate new VSGs was adapted from Pinger et al.2, wherein the homology directed integration of a novel VSG ORF (black) flanked by the UTRs of VSG2 is mediated by 3′ telomere seeds (Tel-S) and 5′ homology to the upstream co-transposed region (CTR – teal). Transfected cells are identified by screening for the integration of a hygromycin selection cassette (red) that is expressed via read-through transcription driven by the subtelomeric promoter.
Extended Data Fig. 7. Panels of WT and H122A with suramin soaks.
Molecular surface of one monomer in the VSGsur dimer shown colored by electrostatic potential (white is neutral, blue is positive/basic, and red is acidic/negatively charged). Electron density in the suramin binding site is shown in green.
Extended Data Fig. 8. Resistance enhancing mutations mapped to VSGsur.
Ribbon diagrams of VSGsur/suramin co-crystal structure in two orientations. Mutations discovered in “supersur” VSGsur mutants with heightened resistance to suramin are shown as green space filling atoms. Suramin and the N-linked glycan of VSGsur are depicted as space filling atoms in purple and crimson respectively.
Extended Data Fig. 9. Replacement of VSGsur with “supermutant” VSGsur at the active expression site of T. b. rhodesiense STIB900_sur1.
(a) Construct for gene replacement; mutations in the VSGsur coding sequence (dark red) are shown in light red, arrows indicate primer binding sites. BSD, blasticidin resistance gene; αβ tub, αβ tubulin splice site. (b) 50% inhibitory concentrations of the transfected clones and the parent (sur1) as measured with Alamar Blue assays. The clones sur1_tr1 and sur1_tr2 still expressed VSGsur, while the clones sur1_tr3 and sur1_tr4 expressed the mutant version. The scatter plots represent independent drug assays, each carried out in duplicate. Error bars represent mean ± standard deviation. Small letters indicate significance groups as determined by one-way ANOVA (Df = 4, F-value = 31.02, p-value = 3.6×10⁻⁹), followed by Tukey’s multiple pairwise comparisons test (p-values <0.001) as calculated with R 3.6.2. n = 6 for STIB900_sur1, sur1_tr1, sur1_tr2, and sur1_tr4; n = 5 for sur1_tr3.
Extended Data Fig. 10. Endocytosis rates by different VSGs relative to VSG2.
Alexa 488-dextran (a), bodipy-LDL (b), and Alexa 488-transferrin (c) endocytosis by T. b. brucei 2T1 cells expressing a variety of different VSG genes. Due to technical limitations, each cell line could not be analyzed simultaneously within each experiment for each ligand. Therefore, VSG2 was used as a control in all experiments, allowing the calculation of each cell line’s relative uptake rate of each ligand as compared to the uptake rate of each ligand observed by VSG2 expressing cells within each separate experiment. Each of these graphs therefore represent the combined experimental results from 2 separate experiments. Cell lines with a relative fluorescence intensity below 1 at a given time point have less efficient endocytic rates compared to VSG2 expressing cells, and vice versa. All graphs share the same Y axis.
Supplementary Material
Acknowledgements
We acknowledge time at the European Synchrotron Radiation Facility (ESRF, beamline ID29, proposal MX1975, Gianluca Santoni and colleagues), the Diamond Light Source (DLS, beamline i03, proposal number mx18989-1, Neil Paterson and colleagues), the Helmholtz Zentrum Berlin (BESSY, beamline 14.1 and 14.2, proposal number MX-191-00036 and MX-192-00114, staff member Manfred Weiss and colleagues, specially Christian Feiler for the help with processing and solving the I3C SAD dataset), and the Paul Scherrer Institut, Villingen, Switzerland (SLS, beamline X06DA, proposal number 20182345, 20191097 and 20191895, Vincent Olieric and colleagues). We thank Luisa Figueiredo for supplying us with the VSG13 expressing T. brucei strain, and Monica Cal, Romina Rocchetti and Marcel Kaiser for help with drug sensitivity testing. NW, SH and PM were supported by the Swiss National Science Foundation (grant 310030_185163). The work was supported by funds and resources from the German Cancer Research Center (DKFZ).
Footnotes
Author Information
H.H. cloned VSGsur and M.vS. produced VSGsur mutants. S.H., N.W., and P.M. produced high-resistance VSGsur mutants and associated assays. M.vS. and J.Z. purified all VSGs. M.sV. crystallized VSG13. M.vS. and J.Z. crystallized wild type and mutant VSGsur proteins. C.E.S. phased and produced the first model of VSG13 and A.H. built and refined the structures of VSG13 native and the sodium bromide soak. J.Z. solved all crystal structures of VSGsur. P.J. worked with J.Z. on the refinement of VSGsur bound to suramin. M.vS. performed the suramin growth and toxicity assays. K.P. conducted ITC experiments. J.V. conducted endocytosis assays.
Competing Interests Statement
The authors declare no competing interests.
Unique Biological Materials
All trypanosome strains are available from the authors upon request.
Data Availability
Coordinates and structure factors have been uploaded to the RCSB PDB (www.rcsb.org): VSGsur I3C (PDB ID 6Z79), VSGsur WT native (PDB ID 6Z7A), VSGsur + Suramin (PDB ID 6Z7B), VSGsur H122A (PDB ID 6Z7C), VSGsur H122A 0.77mM Suramin (PDB ID 6Z7D), VSGsur H122A 7.7 mM (PDB ID 6Z7E), VSG13 NaBr (PDB ID 6Z8G), and VSG13 native (PDB ID 6Z8H). Other data supporting the findings of this study are available from the authors upon request.
References
- 1.Ponte-Sucre A. An Overview of Trypanosoma brucei Infections: An Intense Host–Parasite Interaction. Front Microbiol. 2016;7 doi: 10.3389/fmicb.2016.02126. [DOI] [PMC free article] [PubMed] [Google Scholar]
- 2.Keating J, Yukich JO, Sutherland CS, Woods G, Tediosi F. Human African trypanosomiasis prevention, treatment and control costs: A systematic review. Acta Trop. 2015;150:4–13. doi: 10.1016/j.actatropica.2015.06.003. [DOI] [PubMed] [Google Scholar]
- 3.Radwanska M, Vereecke N, Deleeuw V, Pinto J, Magez S. Salivarian Trypanosomosis: A Review of Parasites Involved, Their Global Distribution and Their Interaction With the Innate and Adaptive Mammalian Host Immune System. Front Immunol. 2018;9:2253. doi: 10.3389/fimmu.2018.02253. [DOI] [PMC free article] [PubMed] [Google Scholar]
- 4.Matthews KR, McCulloch R, Morrison LJ. The within-host dynamics of African trypanosome infections. Philos Trans R Soc Lond B Biol Sci. 2015;370 doi: 10.1098/rstb.2014.0288. [DOI] [PMC free article] [PubMed] [Google Scholar]
- 5.Mugnier MR, Stebbins CE, Papavasiliou FN. Masters of Disguise: Antigenic Variation and the VSG Coat in Trypanosoma brucei. PLoS Pathog. 2016;12:e1005784. doi: 10.1371/journal.ppat.1005784. [DOI] [PMC free article] [PubMed] [Google Scholar]
- 6.Cross GA. Identification, purification and properties of clone-specific glycoprotein antigens constituting the surface coat of Trypanosoma brucei. Parasitology. 1975;71:393–417. doi: 10.1017/s003118200004717x. [DOI] [PubMed] [Google Scholar]
- 7.Overath P, Engstler M. Endocytosis, membrane recycling and sorting of GPI-anchored proteins: Trypanosoma brucei as a model system. Mol Microbiol. 2004;53:735–44. doi: 10.1111/j.1365-2958.2004.04224.x. [DOI] [PubMed] [Google Scholar]
- 8.Aresta-Branco F, Erben E, Papavasiliou FN, Stebbins CE. Mechanistic Similarities between Antigenic Variation and Antibody Diversification during Trypanosoma brucei Infection. Trends Parasitol. 2019;35:302–315. doi: 10.1016/j.pt.2019.01.011. [DOI] [PubMed] [Google Scholar]
- 9.Bangs JD. Evolution of Antigenic Variation in African Trypanosomes: Variant Surface Glycoprotein Expression, Structure, and Function. BioEssays. 2018;40 doi: 10.1002/bies.201800181. 1800181. [DOI] [PMC free article] [PubMed] [Google Scholar]
- 10.Carrington M, Higgins MK. O-h what a surprise. Nat Microbiol. 2018;3:856–857. doi: 10.1038/s41564-018-0211-x. [DOI] [PubMed] [Google Scholar]
- 11.Schnitzer RJ, Hawking F. Experimental Chemotherapy. Elsevier; 2013. [Google Scholar]
- 12.Steverding D. The development of drugs for treatment of sleeping sickness: a historical review. Parasit Vectors. 2010;3:15. doi: 10.1186/1756-3305-3-15. [DOI] [PMC free article] [PubMed] [Google Scholar]
- 13.Lindner AK, et al. New WHO guidelines for treatment of gambiense human African trypanosomiasis including fexinidazole: substantial changes for clinical practice. Lancet Infect Dis. 2020;20:e38–e46. doi: 10.1016/S1473-3099(19)30612-7. [DOI] [PubMed] [Google Scholar]
- 14.Sanderson L, Khan A, Thomas S. Distribution of Suramin, an Antitrypanosomal Drug, across the Blood-Brain and Blood-Cerebrospinal Fluid Interfaces in Wild-Type and P-Glycoprotein Transporter-Deficient Mice. Antimicrob Agents Chemother. 2007;51:3136–3146. doi: 10.1128/AAC.00372-07. [DOI] [PMC free article] [PubMed] [Google Scholar]
- 15.Gill BS, Malhotra MN. Prophylactic Activity of Suramin Complexes in ‘Surra’ (Trypanosoma evansi) Nature. 1963;200:285–286. doi: 10.1038/200285a0. [DOI] [PubMed] [Google Scholar]
- 16.WHO. WHO Model Lists of Essential Medicines. WHO; http://www.who.int/medicines/publications/essentialmedicines/en/ [Google Scholar]
- 17.Stein CA. Suramin: a novel antineoplastic agent with multiple potential mechanisms of action. Cancer Res. 1993;53:2239–2248. [PubMed] [Google Scholar]
- 18.Wiedemar N, et al. Beyond immune escape: a variant surface glycoprotein causes suramin resistance in Trypanosoma brucei: Suramin resistance in T. brucei Mol Microbiol. 2018;107:57–67. doi: 10.1111/mmi.13854. [DOI] [PubMed] [Google Scholar]
- 19.Babokhov P, Sanyaolu AO, Oyibo WA, Fagbenro-Beyioku AF, Iriemenam NC. A current analysis of chemotherapy strategies for the treatment of human African trypanosomiasis. Pathog Glob Health. 2013;107:242–252. doi: 10.1179/2047773213Y.0000000105. [DOI] [PMC free article] [PubMed] [Google Scholar]
- 20.Thomas JA, et al. Insights into antitrypanosomal drug mode-of-action from cytology-based profiling. PLoS Negl Trop Dis. 2018;12:e0006980. doi: 10.1371/journal.pntd.0006980. [DOI] [PMC free article] [PubMed] [Google Scholar]
- 21.Alsford S, et al. High-throughput decoding of antitrypanosomal drug efficacy and resistance. Nature. 2012;482:232–236. doi: 10.1038/nature10771. [DOI] [PMC free article] [PubMed] [Google Scholar]
- 22.The uptake of the trypanocidal drug suramin in combination with low-density lipoproteins by Trypanosoma brucei and its possible mode of action. PubMed - NCBI. doi: 10.1016/0001-706x(93)90096-t. https://www.ncbi.nlm.nih.gov/pubmed/7902661. [DOI] [PubMed] [Google Scholar]
- 23.Wiedemar N, et al. Expression of a specific variant surface glycoprotein has a major impact on suramin sensitivity and endocytosis in Trypanosoma brucei. FASEB Bio Advances. 2019;1:595–608. doi: 10.1096/fba.2019-00033. [DOI] [PMC free article] [PubMed] [Google Scholar]
- 24.Bartossek T, et al. Structural basis for the shielding function of the dynamic trypanosome variant surface glycoprotein coat. Nat Microbiol. 2017;2:1523–1532. doi: 10.1038/s41564-017-0013-6. [DOI] [PubMed] [Google Scholar]
- 25.Pinger J, et al. African trypanosomes evade immune clearance by O-glycosylation of the VSG surface coat. Nat Microbiol. 2018;3:932–938. doi: 10.1038/s41564-018-0187-6. [DOI] [PMC free article] [PubMed] [Google Scholar]
- 26.Freymann D, et al. 2.9 A resolution structure of the N-terminal domain of a variant surface glycoprotein from Trypanosoma brucei. J Mol Biol. 1990;216:141–160. doi: 10.1016/S0022-2836(05)80066-X. [DOI] [PubMed] [Google Scholar]
- 27.Metcalf P, Blum M, Freymann D, Turner M, Wiley DC. Two variant surface glycoproteins of Trypanosoma brucei of different sequence classes have similar 6 A resolution X-ray structures. Nature. 1987;325:84–6. doi: 10.1038/325084a0. [DOI] [PubMed] [Google Scholar]
- 28.Hartel AJ, et al. N-glycosylation enables high lateral mobility of GPI-anchored proteins at a molecular crowding threshold. Nat Commun. 2016;7:12870. doi: 10.1038/ncomms12870. [DOI] [PMC free article] [PubMed] [Google Scholar]
- 29.The structure of serum resistance-associated protein and its implications for human African trypanosomiasis. Nature Microbiology. doi: 10.1038/s41564-017-0085-3. https://www.nature.com/articles/s41564-017-0085-3?WT.mc_id=COM_NMicro_1801_Higgins. [DOI] [PubMed] [Google Scholar]
- 30.Higgins MK, et al. Structure of the trypanosome haptoglobin–hemoglobin receptor and implications for nutrient uptake and innate immunity. Proc Natl Acad Sci. 2013;110:1905–1910. doi: 10.1073/pnas.1214943110. [DOI] [PMC free article] [PubMed] [Google Scholar]
- 31.Engstler M, et al. Kinetics of endocytosis and recycling of the GPI-anchored variant surface glycoprotein in Trypanosoma brucei. J Cell Sci. 2004;117:1105–15. doi: 10.1242/jcs.00938. [DOI] [PubMed] [Google Scholar]
- 32.Zoltner M, et al. Suramin exposure alters cellular metabolism and mitochondrial energy production in African trypanosomes. J Biol Chem. 2020;295:8331–8347. doi: 10.1074/jbc.RA120.012355. [DOI] [PMC free article] [PubMed] [Google Scholar]
- 33.Warren G. Transport through the Golgi in Trypanosoma brucei. Histochem Cell Biol. 2013;140:235–238. doi: 10.1007/s00418-013-1112-y. [DOI] [PubMed] [Google Scholar]
- 34.Manna PT, Boehm C, Leung KF, Natesan SK, Field MC. Life and times: synthesis, trafficking, and evolution of VSG. Trends Parasitol. 2014;30:251–258. doi: 10.1016/j.pt.2014.03.004. [DOI] [PMC free article] [PubMed] [Google Scholar]
- 35.Rotureau B, Subota I, Bastin P. Molecular bases of cytoskeleton plasticity during the Trypanosoma brucei parasite cycle. Cell Microbiol. 2011;13:705–716. doi: 10.1111/j.1462-5822.2010.01566.x. [DOI] [PubMed] [Google Scholar]
- 36.Figueiredo LM, Janzen CJ, Cross GAM. A Histone Methyltransferase Modulates Antigenic Variation in African Trypanosomes. PLOS Biol. 2008;6:e161. doi: 10.1371/journal.pbio.0060161. [DOI] [PMC free article] [PubMed] [Google Scholar]
- 37.Alsford S, Horn D. Single-locus targeting constructs for reliable regulated RNAi and transgene expression in Trypanosoma brucei. Mol Biochem Parasitol. 2008;161 doi: 10.1016/j.molbiopara.2008.05.006. [DOI] [PMC free article] [PubMed] [Google Scholar]
- 38.Schumann Burkard G, Jutzi P, Roditi I. Genome-wide RNAi screens in bloodstream form trypanosomes identify drug transporters. Mol Biochem Parasitol. 2011;175:91–94. doi: 10.1016/j.molbiopara.2010.09.002. [DOI] [PubMed] [Google Scholar]
- 39.Hirumi H, Hirumi K. Continuous cultivation of Trypanosoma brucei blood stream forms in a medium containing a low concentration of serum protein without feeder cell layers. J Parasitol. 1989;75:985–9. [PubMed] [Google Scholar]
- 40.Cross GA. Release and purification of Trypanosoma brucei variant surface glycoprotein. J Cell Biochem. 1984;24:79–90. doi: 10.1002/jcb.240240107. [DOI] [PubMed] [Google Scholar]
- 41.Rypniewski WR, Holden HM, Rayment I. Structural consequences of reductive methylation of lysine residues in hen egg white lysozyme: An x-ray analysis at 1.8-.ANG. resolution. Biochemistry. 1993;32:9851–9858. doi: 10.1021/bi00088a041. [DOI] [PubMed] [Google Scholar]
- 42.Sheldrick GM. A short history of SHELX. Acta Crystallogr A. 2008;64:112–22. doi: 10.1107/S0108767307043930. [DOI] [PubMed] [Google Scholar]
- 43.Adams PD, et al. PHENIX: a comprehensive Python-based system for macromolecular structure solution. Acta Crystallogr Biol Crystallogr. 2010;66:213–21. doi: 10.1107/S0907444909052925. [DOI] [PMC free article] [PubMed] [Google Scholar]
- 44.Winn MD, et al. Overview of the CCP4 suite and current developments. Acta Crystallogr D Biol Crystallogr. 2011;67:235–242. doi: 10.1107/S0907444910045749. [DOI] [PMC free article] [PubMed] [Google Scholar]
- 45.Beck T, Krasauskas A, Gruene T, Sheldrick GM. A magic triangle for experimental phasing of macromolecules. Acta Crystallogr D Biol Crystallogr. 2008;64:1179–1182. doi: 10.1107/S0907444908030266. [DOI] [PubMed] [Google Scholar]
- 46.Minor W, Cymborowski M, Otwinowski Z, Chruszcz M. HKL-3000: the integration of data reduction and structure solution – from diffraction images to an initial model in minutes. Acta Crystallogr D Biol Crystallogr. 2006;62:859–866. doi: 10.1107/S0907444906019949. [DOI] [PubMed] [Google Scholar]
- 47.Langer G, Cohen SX, Lamzin VS, Perrakis A. Automated macromolecular model building for X-ray crystallography using ARP/wARP version 7. Nat Protoc. 2008;3:1171–9. doi: 10.1038/nprot.2008.91. [DOI] [PMC free article] [PubMed] [Google Scholar]
- 48.Emsley P, Lohkamp B, Scott WG, Cowtan K. Features and development of Coot. Acta Crystallogr D Biol Crystallogr. 2010;66:486–501. doi: 10.1107/S0907444910007493. [DOI] [PMC free article] [PubMed] [Google Scholar]
- 49.Aline R, et al. (TAA)n within sequences flanking several intrachromosomal variant surface glycoprotein genes in Trypanosoma brucei. Nucleic Acids Res. 1985;13:3161–3177. doi: 10.1093/nar/13.9.3161. [DOI] [PMC free article] [PubMed] [Google Scholar]
- 50.Cross GAM, Kim H-S, Wickstead B. Capturing the variant surface glycoprotein repertoire (the VSGnome) of Trypanosoma brucei Lister 427. Mol Biochem Parasitol. 2014;195:59–73. doi: 10.1016/j.molbiopara.2014.06.004. [DOI] [PubMed] [Google Scholar]
- 51.Eisenberg D, Schwarz E, Komaromy M, Wall R. Analysis of membrane and surface protein sequences with the hydrophobic moment plot. J Mol Biol. 1984;179:125–142. doi: 10.1016/0022-2836(84)90309-7. [DOI] [PubMed] [Google Scholar]
- 52.Kelley LA, Mezulis S, Yates CM, Wass MN, Sternberg MJ. The Phyre2 web portal for protein modeling, prediction and analysis. Nat Protoc. 2015;10:845–58. doi: 10.1038/nprot.2015.053. [DOI] [PMC free article] [PubMed] [Google Scholar]
- 53.McNicholas S, Potterton E, Wilson KS, Noble MEM. Presenting your structures: the CCP4mg molecular-graphics software. Acta Crystallogr D Biol Crystallogr. 2011;67:386–394. doi: 10.1107/S0907444911007281. [DOI] [PMC free article] [PubMed] [Google Scholar]
- 54.Schrodinger. The PyMOL Molecular Graphics System. 2015 Version 1.8. [Google Scholar]
- 55.de Beer TAP, Berka K, Thornton JM, Laskowski RA. PDBsum additions. Nucleic Acids Res. 2014;42:D292–D296. doi: 10.1093/nar/gkt940. [DOI] [PMC free article] [PubMed] [Google Scholar]
- 56.LigPlot+: Multiple Ligand–Protein Interaction Diagrams for Drug Discovery. Journal of Chemical Information and Modeling. doi: 10.1021/ci200227u. https://pubs.acs.org/doi/10.1021/ci200227u. [DOI] [PubMed] [Google Scholar]
Associated Data
This section collects any data citations, data availability statements, or supplementary materials included in this article.
Supplementary Materials
Data Availability Statement
Coordinates and structure factors have been uploaded to the RCSB PDB (www.rcsb.org): VSGsur I3C (PDB ID 6Z79), VSGsur WT native (PDB ID 6Z7A), VSGsur + Suramin (PDB ID 6Z7B), VSGsur H122A (PDB ID 6Z7C), VSGsur H122A 0.77mM Suramin (PDB ID 6Z7D), VSGsur H122A 7.7 mM (PDB ID 6Z7E), VSG13 NaBr (PDB ID 6Z8G), and VSG13 native (PDB ID 6Z8H). Other data supporting the findings of this study are available from the authors upon request.


