Abstract
Type 2 innate lymphoid cells (ILC2) contribute to immune homeostasis, protective immunity and tissue repair. Here we demonstrate that functional ILC2 can arise in the embryonic thymus, from shared T cell precursors, preceding the emergence of CD4+CD8+ (double-positive) T cells. Thymic ILC2 migrated to mucosal tissues with colonization of the intestinal lamina propria. RORα expression repressed T cell development, while promoting ILC2 in the thymus. From RNA-seq, ATAC-seq and ChIP-seq data we propose a revised transcriptional circuit to explain the co-development of T cells and ILC2 from common progenitors in the thymus. When Notch signaling is present, Bcl11b dampens Nfil3/Id2 expression, permitting E protein-directed T cell commitment. However, concomitant expression of RORα overrides the Nfil3/Id2 repression, allowing Id2 to repress E proteins and promote ILC2 differentiation. Thus, we demonstrate that RORα expression represents a critical checkpoint at the bifurcation of the T cell and ILC2 lineages in the embryonic thymus.
Introduction
ILC2 help maintain immune homeostasis, play key roles in reparative type-2 innate immune reactions to infection and tissue damage1,2, and also potentiate T helper 2 (TH2) cell-mediated adaptive immunity3,4. The discovery of ILCs has raised new questions about how they develop alongside B cells and T cells in the bone marrow and thymus, respectively. Lymphocytes develop from common lymphoid progenitors (CLPs) in the bone marrow, and early T cell precursors (ETPs) in the thymus. Specific lineage commitment is dependent on the interplay of discrete stromal microenvironments providing intercellular signals via cell contact and cytokines, and the induction of lineage-restricted transcription factors (TFs).
T cell differentiation in the thymus is well characterized, progressing from the CD4−CD8− double-negative (DN) CD117(cKit)hi DN1/ETP stage, through DN2a and DN2b, to the recombination of the T cell antigen receptor (TCR) during DN3 and DN4, before cells become double-positive (DP) for CD4+CD8+, prior to differentiating into functional single-positive (CD4+ or CD8+) T cells5. The DN1 cells are a heterogeneous mixture of prothymocytes that have been further sub-divided based on their expression of the cell surface receptors CD24 and CD117 to give five subsets (DN1a to DN1e)6. Only the DN1a (CD117hiCD24−) and DN1b (CD117hiCD24+) cell subsets were found to be highly proliferative and give rise to T cells with high efficiency6.
Although the thymus provides a specialized environment to promote T cell differentiation, T cell progenitors in adult thymus retain ILC2 potential until the DN2 stage7 and also produce NK cells8. The presence of ILC2-like cells has been observed in adult and embryonic thymus9,10, but the development of ILC2 from ETP in vivo remains to be demonstrated, as do the critical factors that discriminate T cell and ILC2 fate. Both T cell and ILC2 differentiation are co-dependent on Notch and interleukin-7 (IL-7) receptor signaling, and share transcription factors including GATA-3, Bcl11b and TCF-1 (refs.1,7,11,12). T cell differentiation is favored at low concentrations of IL-7, while ILC2 development requires higher IL-7 concentrations13. T cells additionally require strong and sustained Notch signals while ILC2 are favored by short and intermediate stimulation13. The antagonizing activities of E protein and Id2 transcription factors also critically define T cell and ILC commitment. E proteins orchestrate T cell fate and suppress ILC development, while Id2 binds to E proteins and prevents their ability to interact with DNA, thus supporting ILC differentiation14.
Furthermore, Bcl11b expression has been defined as the pivotal factor that marks commitment to the T cell lineage at the DN2a to DN2b transition15 and prevents NK cell differentiation16,17,18. Bcl11b orchestrates T cell commitment by blocking expression of Id2 (that would otherwise inhibit T cell-inducing E proteins, E2A) and Nfil3 that is required for ILC development19,20. However, this raises an interesting conundrum, because Bcl11b is also critical for ILC2 differentiation, during which both Id2 and Nfil3 are expressed21. A recent report has indicated that this is achieved, at least in part, by Bcl11b regulating a distinct set of genes in T cells versus ILC2 (ref.22). However, the regulatory circuit controlling the divergence of gene expression at the T cell:ILC2 differentiation checkpoint, remains unclear. We have shown previously that RORα is necessary for ILC2 lineage commitment7, but its role in the lymphocyte development and differentiation circuit has remained enigmatic. We now report how RORα expression acts as a critical checkpoint in the divergence of ILC2 and T cell development.
Results
scRNA-seq identifies ILCs in the embryonic thymus
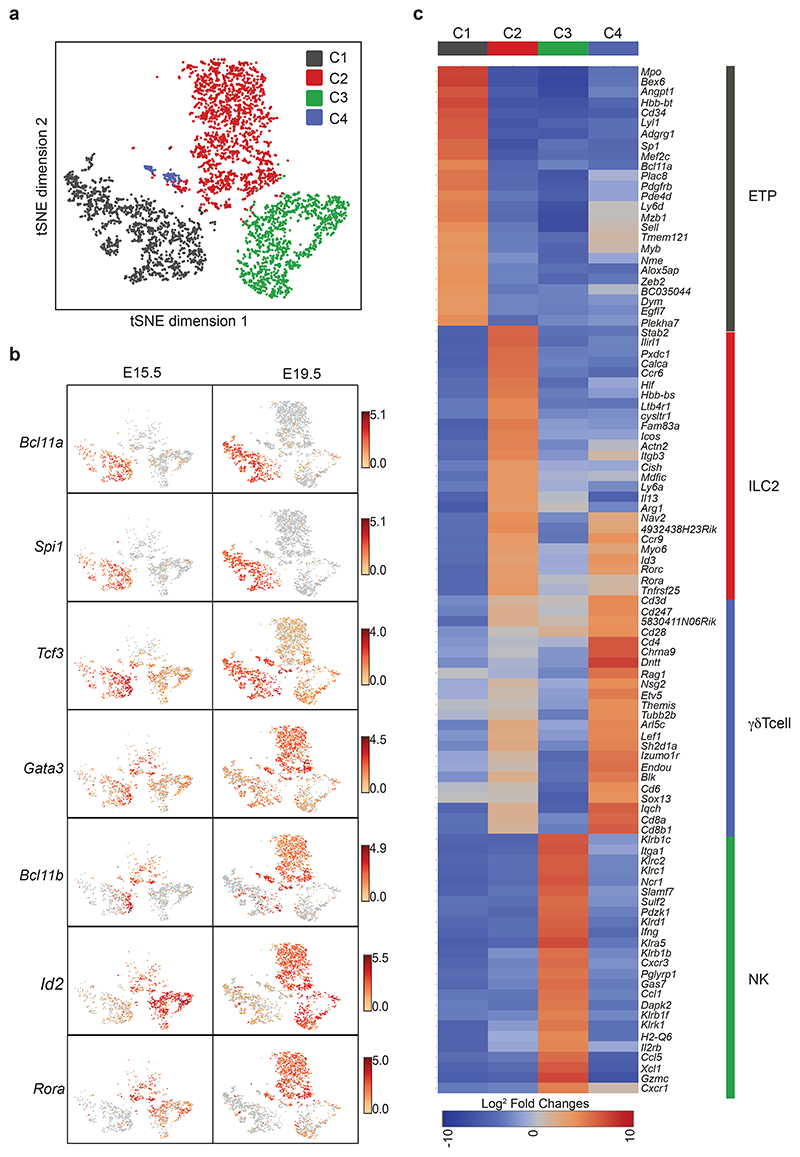
Lymphocyte progenitors in the embryonic thymus reside within a CD4−CD8−CD25−CD44hi cell population (DN1)6,11,12 that distinguishes early precursors from the more committed T cell progenitors, but fails to discriminate the greater complexity of lymphocyte progenitor subpopulations. To investigate ILC developmental states we purified DN1 cells (with a small number of CD4−CD8−CD25hiCD44hi (DN2) cells for comparison) from E15.5 and E19.5 thymi and performed single-cell RNA-sequencing (scRNA-seq). t-distributed stochastic neighbor embedding (tSNE) identified four discrete cell clusters (C1-C4) (Fig. 1a). C1 was characterized by the expression of genes stereotypical of ETPs including Bcl11a, Spi1, Myb, Ly6d, Kit and Tcf3 (Fig. 1b,c and Supplementary Table 1). C2, which increased markedly in frequency between E15.5 and E19.5, expressed genes of the ILC2 lineage, including Il1rl1 (the IL-33 receptor ST2), Icos, Il13, Rora and Arg1 (Fig. 1b,c and Supplementary Table 1). C3 was characterized by NK/ILC1-associated genes including Ncr1, Klrs, Xcl1 and Ifng (Fig. 1c and Supplementary Table 1). C4, which appeared at E19.5, expressed Sox13, characteristic of γδ T cells (Fig. 1c and Supplementary Table 1). The DN2 cells did not form a distinct cluster and probably constitute the Bcl11b-high cells clustered together with ETPs in C1 (Fig. 1b). Therefore, the E15.5 DN1 thymocyte population harbors ETP (C1), ILC2p (C2), and ILC1/NK cell progenitors (C3) distinguished by their differential expression of discrete combinations of Bcl11b, Id2, Gata3 and Rora transcripts.
Figure 1. scRNA-seq identifies ILCs in the embryonic thymus.
(a) tSNE plot of single-cell gene expression analysis of DN1 population (Lin−CD4−CD8−CD44+CD25−) from E15.5 and E19.5 thymus (8,000 individual cells) purified from 5xpolychromILC mice. A small number (300 cells) of DN2 cells (Lin−CD4−CD8−CD44+CD25+) from E15.5 and E19.5 thymus was also sampled for comparison.
(b) tSNE plot with expression level (log2 expression) of indicated genes per individual cell.
(c) Heatmap of the top 25 genes differentially expressed in clusters defined in (a).
ILCs precede CD4/CD8+ T cells in the embryonic thymus
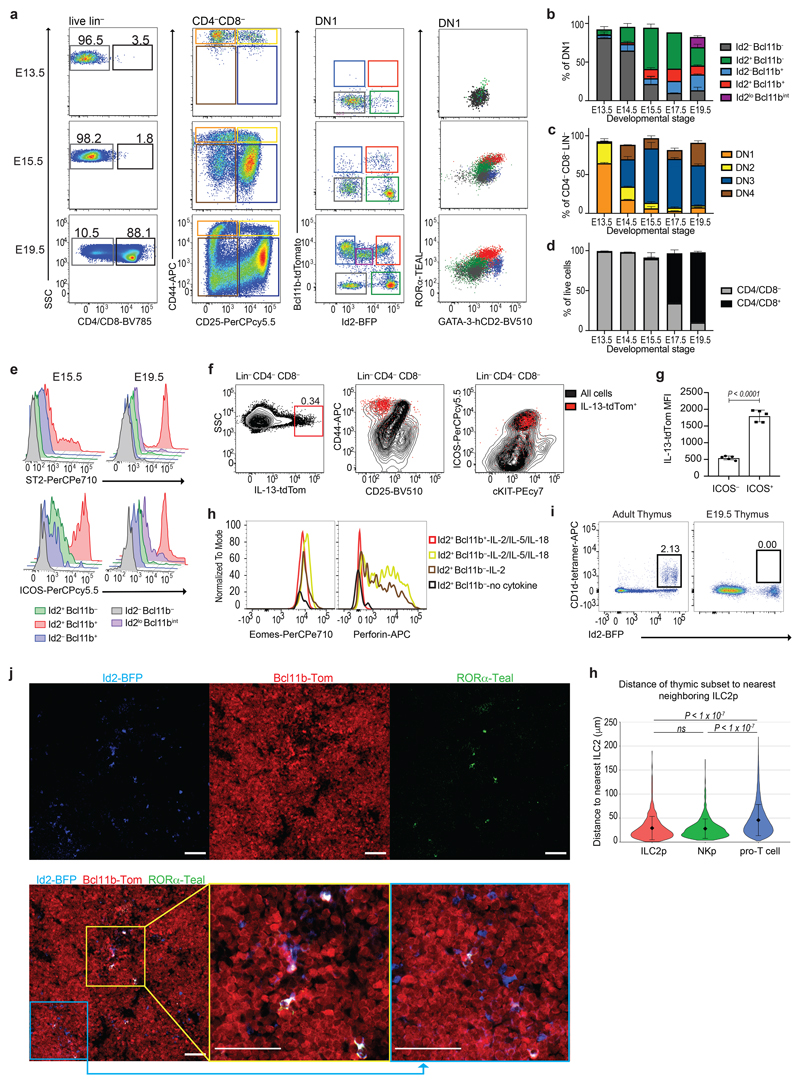
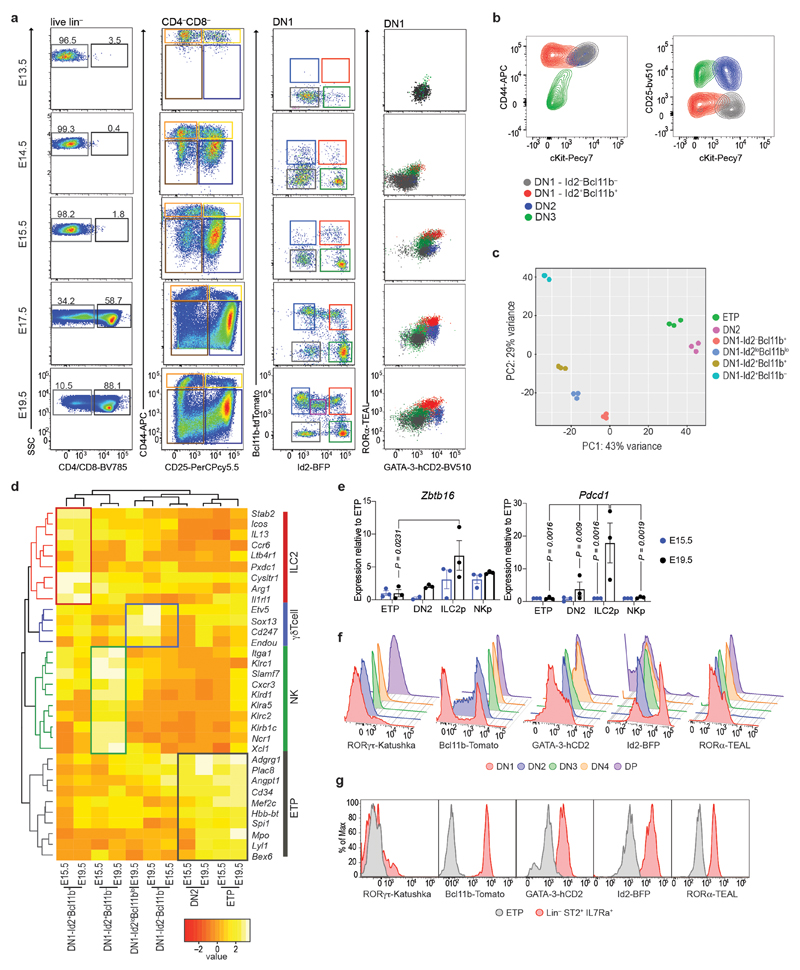
Using five-color (5x) polychromILC TF reporter mice23 we analyzed ILC transcription factors (Id2, Bcl11b, GATA-3, RORα and RORγt), and cell surface markers during embryonic thymus development from E13.5 to E19.5 to assess the genesis of pro-T cells and ILC subsets (Fig. 2a). At E13.5, Id2−Bcl11b−cKit+ ETPs correlated with cluster C1 (Fig. 2a and Extended Data Fig. 1a,b). We also detected a subpopulation of Id2+Bcl11b− NK progenitor-like cells, similar to cluster C3 (Fig. 2a and Extended Data Fig. 1a). By E15.5, these NK-like cells had increased in frequency, and were accompanied by two additional populations expressing Bcl11b that were maintained through to E19.5. An extra population, Id2loBcl11blo, appeared at E19.5 (Fig. 2a,b and Extended Data Fig. 1a). Bulk RNA-seq analysis of the purified subpopulations (and DN2 cells) harvested at E15.5 and E19.5 established that Id2−Bcl11b− cells correlated with cell-cluster C1, Id2+Bcl11b+ with C2 (ILC2p), and Id2+Bcl11b− with cluster C3 (NK/ILC1p) (Fig. 2a and Extended Data Fig. 1c,d). The coincidence of RORα and GATA-3 within the Id2+Bcl11b+ ILC2p DN1 population (Fig. 2a and Extended Data Fig. 1a), reflected the known importance of these TFs in ILC2 development. These cells also expressed Plzf and Pcdc1 (Extended Data Fig. 1e). By E19.5 we also detected the appearance of a fifth DN1 subpopulation characterized as Id2loBcl11bint corresponding to γδ T cells as described previously24,25 (Fig. 2a,b and Extended Data Fig. 1d). Alongside ILC development the differentiation of DN2 cells was observed at E13.5, but very few CD4 and CD8 positive RORγt+Bcl11b+GATA-3+Id2− cells were observed before E15.5, though they then expanded to represent the majority of thymocytes (Fig. 2a–d and Extended Data Fig. 1f).
Figure 2. ILCs precede CD4/CD8+ T cells in the embryonic thymus.
(a) Flow–cytometry analysis of the indicated cell surface markers or transcription factors in the E13.5, E15.5 and E19.5 embryonic thymus of 5xpolychromILC mice.
(b) Flow-cytometry comparison of the DN1 populations in different developmental stages of the embryonic thymus. Data are representative of 2 independent experiments; mean ± SEM.
(c) Flow-cytometry comparison of the DN populations in different developmental stages of the embryonic thymus. Data are representative of 2 independent experiments; mean ± SEM.
(d) Flow-cytometry comparison of the CD4/CD8+ and CD4/CD8− cells in different developmental stages of the embryonic thymus. Data are representative of 2 independent experiments; mean ± SEM.
(e) Flow-cytometry analysis of ST2 and ICOS expression in the DN1 subsets at E15.5 and E19.5 embryonic thymus.
(f) Flow-cytometric analysis of CD44, CD25, ICOS and cKIT expression in Lin−CD4/CD8− cells in the E16.5 embryonic thymus of Il13 tdTom/+ mice. IL-13-tdTomato+ are in red, and black represents Lin−CD4/CD8− cells.
(g) Flow-cytometric analysis of IL-13 MFI in ICOS+ and ICOS-cells in E16.5 thymus of Il13 tdTom/+ mice. Data are representative of 2 experiments; mean ± SEM, Unpaired two-sided t test.
(h) Flow cytometry analysis of Eomes and Perforin expression in thymic ILC2p and NKp after 72 hours in culture with IL-2, or IL-2, IL-15 and IL-18 or without cytokine. Data are representative of 2 experiments.
(i) Flow cytometry analysis of CD1d-tetramer and Id2-BFP in adult and E19.5 embryonic thymus.
(j) Confocal microscopy of cryosections taken from E17.5 embryonic thymus from Id2-BFP (blue), Bcl11b-Tom (red) and RORα-Teal (green) reporter mice. White colour marks co-localisation of all three fluorescent reporters. All scale bars represent 50 μm. Image is representative of three biological replicates.
(h) Violin plots with nearest neighbour analysis. The distance from each ILC2p, NKp or pro-T cell to the nearest ILC2p was quantified using 6 images per sample (n = 3 biologically independent samples). Data are presented as mean values ±SD. One-way ANOVA with Tukey Post-Hoc Analysis.
Furthermore, ST2 (the IL-33 receptor encoded by Il1rl1) and ICOS preferentially expressed by the Id2+Bcl11b+ DN1 thymocytes at E15.5, and by E19.5 all these cells were positive (Fig. 2e). Il13 +/Tom reporter mice, also demonstrated that a proportion of ICOS+ DN1 cells already expressed the type-2 cytokine IL-13 (Fig. 2f,g). Thus, ILC2p in the embryonic thymus are GATA-3hiRORα+Bcl11b+Id2+RORγt−ICOS+ and can upregulate ST2 and IL-13 during their development (Fig. 2 and Extended Data Fig. 1g). We purified Id2+Bcl11b− DN1 cells to determine if they were NK or ILC1 progenitors. Culture in the presence of IL-2, IL-15 and IL-18 upregulated Eomes and perforin expression confirming them as NKp (Fig. 2h). We confirmed that these cells were not NKT cells by demonstrating the absence of Id2+CD1d-tetramer+ cells at E19.5 (Fig. 2i).
Imaging of E17.5 embryonic thymus from compound heterozygous Id2-blue fluorescent protein (BFP), Bcl11b-tdTomato (Tom), RORα-Teal reporter mice revealed clusters of Id2-BFP+Bcl11b-Tom−RORα-Teal− NKp (blue), a small proportion of which also contained Id2-BFP+Bcl11b-Tom+RORα-Teal+ ILC2p (white) among the predominant Id2-BFP−Bcl11b-Tom+RORα-Teal− pro-T cells (red) (Fig. 2j). Distance quantification data indicated that ILC2p are located closer to NKp than to pro-T cells (Fig. 2h). Taken together these data indicate the presence of ILC2p and NKp in the embryonic thymus from E14.5 and E13.5, respectively, preceding the emergence of DP T cells.
Innate and T lymphocytes develop from a common ETP
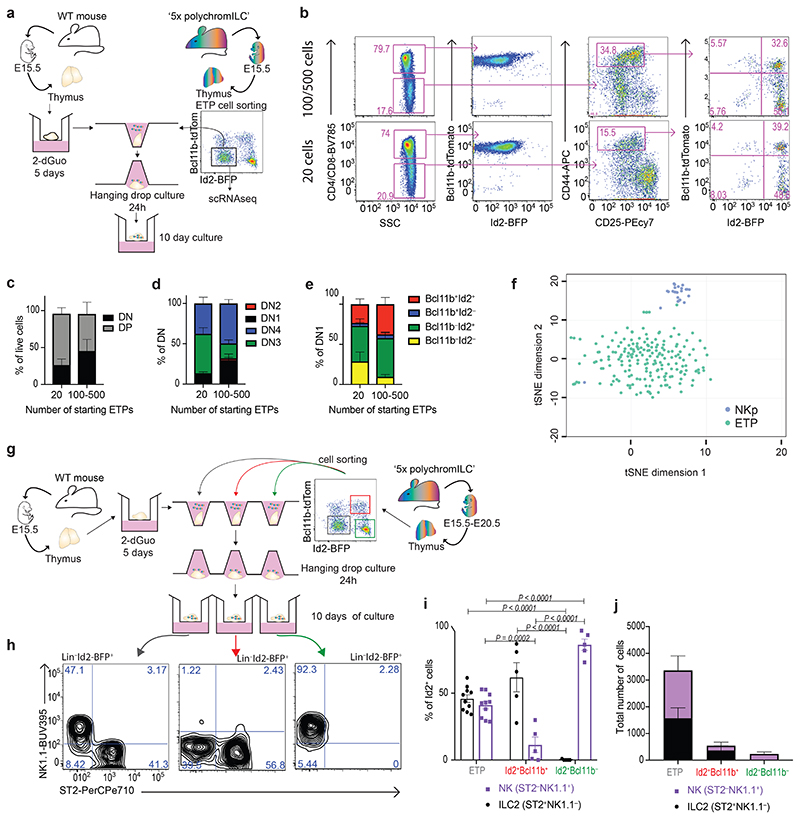
Having detected ILC2p and NKp in the embryonic thymus, we wished to determine if these cells arrive as committed progenitors or if they, like T lymphocytes, differentiate from ETP. To investigate if ILC2p, NKp and T lymphocytes all differentiate from ETP, we performed fetal thymus organ culture (FTOC) using ETP purified from E15.5 5xpolychromILC mice to reconstitute wild-type E15.5 deoxyguanosine (dGuo)-treated fetal thymus lobes in vitro, without the addition of cytokine (Fig. 3a). As few as 20 donor ETP produced ILC2p, NKp cells and DP T cells (Fig. 3b,e). Furthermore, scRNA-seq analysis of purified E15.5 Id2−Bcl11b−cKit+DN1 ETP (with Id2+Bcl11b− cells for comparison) failed to detect discretely separated clusters (Fig. 3f).
Figure 3. Innate and T lymphocytes develop from a common ETP.
(a) Schematic representation of FTOC experimental protocol.
(b) Flow-cytometry analysis of the indicated surface marker or TF in FTOC repopulated with 20 or 100/500 ETPs purified from 5xpolychromILC mice.
(c) Flow-cytometric comparison of the proportions of DP and DN cells generated in FTOC repopulated with 20 or 100/500 ETP cells purified from 5xpolychromILC mice. Data are representative of 2 independent experiments; mean ± SEM.
(d) Flow cytometric comparison of the proportions of DN subsets generated in FTOC repopulated with 20 or 100/500 ETP cells purified from 5xpolychromILC mice. Data are representative of 2 independent experiments; mean ± SEM.
(e) Flow cytometric comparison of the proportions of DN1 subsets generated in FTOC repopulated with 20 or 100/500 ETP cells purified from 5xpolychromILC mice. Data are representative of 2 independent experiments; mean ± SEM.
(f) tSNE plot of single cell gene expression analysis from ETPs and NKps (200 individual cells) purified from the E15.5 embryonic thymus of 5xpolychromILC mice.
(g) Schematic representation of experimental protocol. 500 cells were used for each FTOC.
(h) Representative flow-cytometry gating strategy for the characterisation of ILC2p and NKp cells after FTOC.
(i) Flow cytometry analysis of the proportion of ILC2p and NKp cells generated in FTOC repopulated with ETP, Id2+Bcl11b+ or Id2+Bcl11b− cells. Data are representative of 2 independent experiments; mean ± SEM; two-way ANOVA with Tukey’s post-hoc test.
(j) Flow cytometry analysis of ILC2p and NKp cells generated in FTOC repopulated with ETP, Id2+Bcl11b+ or Id2+Bcl11b− cells. Data are representative of 2 independent experiments; mean ± SEM.
The developmental potential of the putative ILC2p and NKp was evaluated using in vitro FTOC (Fig. 3g). While ETP gave rise to equivalent proportions of Lin−Id2+NK1.1+ST2− NK cells and Lin−Id2+NK1.1−ST2+ ILC2, the ILC2p produced predominantly Lin−Id2+NK1.1−ST2+ ILC2, and the NKp almost exclusively generated Lin−Id2+NK1.1+ST2− NK cells (Fig. 3h,i). The total number of cells retrieved from the FTOCs indicated the higher proliferation capacity of the precursor ETPs (Fig. 3j). These results indicate that a discrete homogeneous pool of ETP gives rise to T cells, ILC2 and NK cells in the embryonic thymus at the initiation of thymic colonization.
Thymic stromal cells produce IL-33
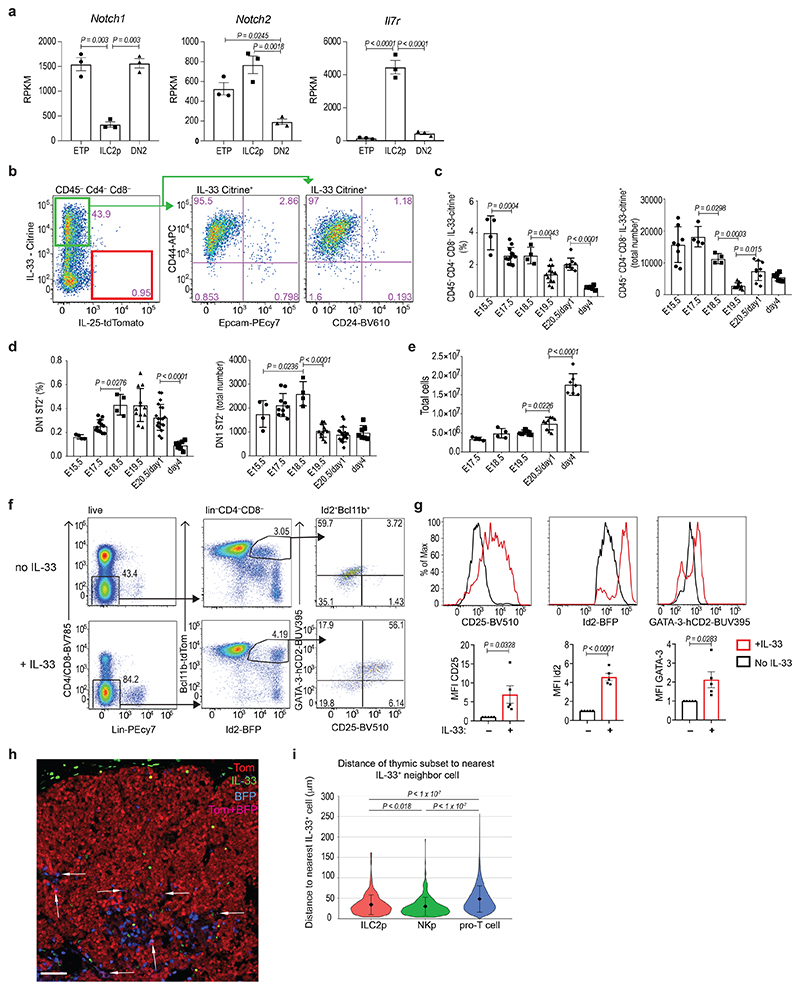
Cortex thymic epithelial cells (cTECs) express IL-7 and Delta ligand and are essential for T cell development26. Bulk RNA-seq analysis showed that Notch and IL-7Rα are differentially expressed by ETP, DN2 and ILC2p, enabling them to respond to these thymic microenvironmental signals (Fig. 4a). To understand how ILC2p can differentiate in the predominantly pro-T lymphocyte embryonic thymic microenvironment we investigated the expression of ILC2-supporting cytokines IL-25 and IL-33 by thymic stromal cells19,27. Using Il33 cit/+ and Il25 tom/+ reporter mice, we detected Il33-citrine expression principally in CD45−CD44+CD24−Epcam− stromal cells at E15.5, but not Il25-tdtomato (Fig. 4b). The relative frequency and number of Il33-citrine+ cells gradually decreased with time (Fig. 4c), while the proportion and number of ILC2p increased from E15.5 to E18.5 and then also decreased (Fig. 4d and Extended Data Fig. 2a). The reduction in frequency of ILC2p coincided with the rapid expansion of T lymphocytes (Fig. 4c–e). To investigate whether thymic ILC2p respond to IL-33, E15.5 thymi were cultured with or without IL-33. After 5 days, there was an increase in the frequency of activated ILC2p in the thymi cultured with IL-33 with an increase in their expression of CD25, Id2 and GATA-3 (Fig. 4f,g). Confocal imaging of E17.5 embryonic thymus, from Id2-BFP × Bcl11b-Tom mice, showed IL-33+ cells around and within the thymic lobe (Fig. 4h) localized more closely with ILC2p and NKp cells, than to pro-T cells (Fig. 4i). However, although IL-33 can act on developing ILC2p in the embryonic thymus it is not essential for their differentiation, as ILC2p are present in IL-33-deficient thymi (Extended Data Fig. 2b).
Figure 4. Thymic stromal cells produce IL-33.
(a) Gene expression (RPKM from bulk RNA-seq analysis) showing Notch1, Notch2 and Il7r, in different embryonic thymus populations (n=3); one-way ANOVA with Tukey’s post-hoc test.
(b) Flow-cytometry analysis of Il33-Citrine and Il25-tdTomato in E18.5 embryonic thymus of Il33 cit/+ Il25 tdTom/+ mice, and CD44, CD24 and Epcam expression in Il33-citrine+ cells.
(c) Flow-cytometry comparison of the proportions and total numbers of Il33-Citrine+ cells in different stages of the thymus development in Il33 cit/+ mice. Data are representative of 2 independent experiments; mean ± SEM; one-way ANOVA with Tukey’s post-hoc test.
(d) Flow-cytometry comparison of the proportions and total number of ST2+ cells in different stages of thymus development. Data are representative of 2 independent experiments; mean ± SEM; one-way ANOVA with Tukey’s post-hoc test.
(e) Flow-cytometry analysis of total cell numbers at different stages of thymus development. Data are representative of 2 independent experiments; mean ± SE; one-way ANOVA with Tukey’s post-hoc test.
(f) Flow-cytometry analysis of the indicated cell surface markers or transcription factors in E15.5 thymus after 10 days in culture in the presence or absence of IL-33.
(g) Flow cytometry analysis of Id2-BFP, CD25 and GATA-3-hCD2 expression in thymic ILC2p after 10 days in culture in the presence (red) or absence (black) of IL-33. Data are representative of 2 independent experiments; mean ± SEM; Unpaired two-sided t test.
(h) Confocal microscopy of cryosections taken from E17.5 embryonic thymus from Id2-BFP (blue - NKp cells), Bcl11b-Tom (red - pro-T cells) reporter mice and stained with anti-IL-33 antibody (green). Pink colour marks co-localisation of BFP and Tom and represents the ILC2p (arrows). Scale bars represent 50 μm. Image is representative of three biological replicates.
(i) Violin plots with nearest neighbour analysis. The distance from each ILC2p, NKp or pro-T cell to the nearest IL-33+ cell was quantified using 6 images per sample (n= 3 biologically independent samples). Data are presented as mean values ±SD; one-way ANOVA with Tukey Post-Hoc Analysis.
Embryonic thymus-derived ILC2 populate the intestine
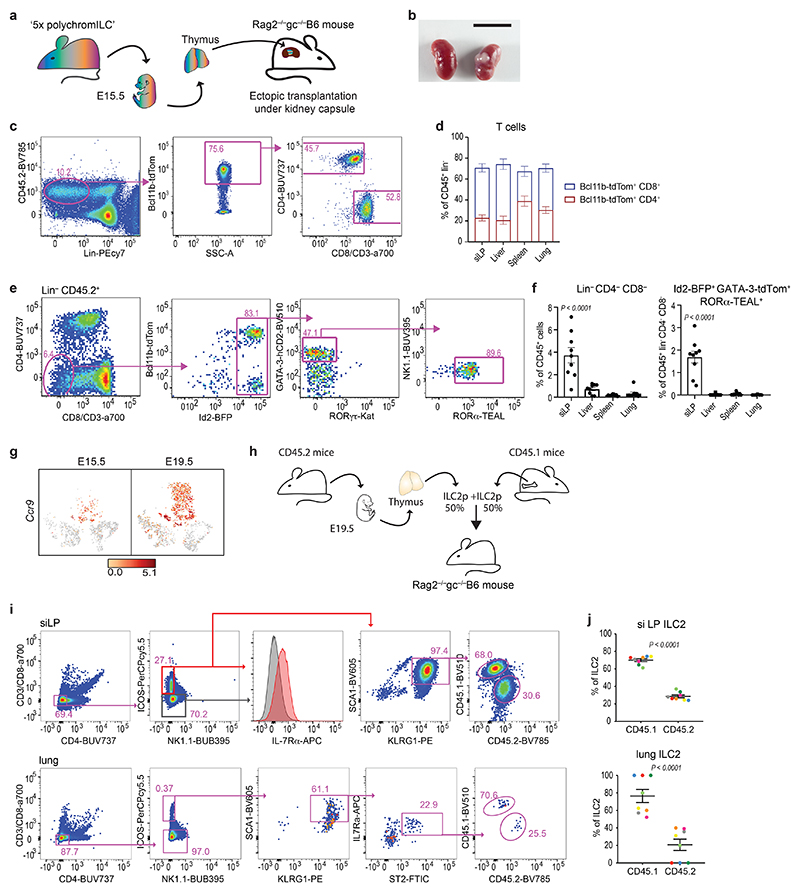
We next assessed ILC2 capacity to leave the embryonic thymus and seed peripheral tissues. Following ectopic transplantation of E15.5 thymi from CD45.2+ 5xpolychromILC mice under the kidney capsules of sublethally irradiated CD45.1+ Rag2 −/− Il2rgc −/− mice (Fig. 5a,b) we analyzed the CD45.2+ cells in the tissues of recipient mice. CD45.2+CD4+ and CD8+ cells were present in all analyzed tissues (Fig. 5c,d), while CD45.2+Lin−Id2+GATA-3+RORα+ positive ILC2 reconstitution was restricted to the siLP (Fig. 5e,f), consistent with the expression of Ccr9 by thymic ILC2p (Fig. 5g).
Figure 5. Embryonic thymus-derived ILC2 populate the intestine.
(a) Schematic representation of ectopic transplantation of E15.5 thymus from 5xpolychromILC mice under the kidney capsule of Rag2 –/– gc –/– mice.
(b) Kidney with and without thymic lobes after six weeks of ectopic transplantation. Scale bar, 1 cm.
(c) Representative flow cytometry gating strategy for the characterisation of T cells derived from ectopic transplantation of E15.5 thymus from 5xpolychromILC mice under the kidney capsule of Rag2 –/– gc –/– mice.
(d) Flow cytometry analysis of the proportion of Bcl11b-tdTom+CD4+ and Bcl11b-tdTom+CD8+ cells progeny derived from ectopic transplantation of E15.5 thymus from 5x polychromILC mice under the kidney capsule of Rag2 –/– gc –/– mice. Data represent mean ± SEM of 9 mice.
(e) Representative flow cytometry gating strategy for the characterisation of ILC2 derived from ectopic transplantation of E15.5 thymus from 5xpolychromILC mice under the kidney capsule of Rag2 –/– gc –/– mice.
(f) Flow cytometry analysis of the proportion of Lin− and Lin−Id2+GATA-3+RORα+cells progeny derived from ectopic transplantation of E15.5 thymus from 5xpolychromILC mice under the kidney capsule of Rag2 –/– gc –/– mice. Data represent mean ± SEM of 9 mice; ***p< 0.001 one-way ANOVA with Tukey’s post-hoc test.
(g) tSNE plots from single cell analysis (Fig. 1) showing Ccr9 expression (log2 expression), in different embryonic thymus populations.
(h) Schematic representation of adoptive transfer of bone marrow and thymic ILC2p into sublethally irradiated Rag2 –/– gc –/– recipients.
(i) Representative flow cytometry gating strategy of ILC2 subsets derived from adoptive transfer of bone marrow and thymus ILC2p into sublethally irradiated Rag2 –/– gc –/– recipients.
(j) Flow cytometry analysis of the proportion of ILC2 originating from thymus (CD45.2) or bone marrow (CD45.1) ILC2p after adoptive transfer into sublethally irradiated Rag2 –/– gc –/– recipients. Data represent mean ± SEM of 8 mice; Unpaired two-sided t test.
To directly compare the capacity of thymus-derived ILC2p (T-ILC2p) and bone marrow-derived ILC2p (BM-ILC2p) to generate ILC2 in the lungs or siLP, CD45.2+ T-ILC2p and CD45.1+ BM-ILC2p were purified, mixed in a 1:1 ratio, and injected into sublethally irradiated CD45.1+ Rag2 −/− Il2rgc −/− mice (Fig. 5h). Both T-ILC2p and BM-ILC2p reproducibly generated ILC2 that populated the siLP. However, BM-ILC2p were consistently more efficient than T-ILC2p (Fig. 5i,j). BM-ILC2p also more effectively gave rise to ILC2 in the lungs (Fig. 5i,j). These results indicate that embryonic thymus-derived ILC2p can depart the thymus and generate ILC2 in peripheral tissues.
RORα represses T cell fate promoting thymus-derived ILC2
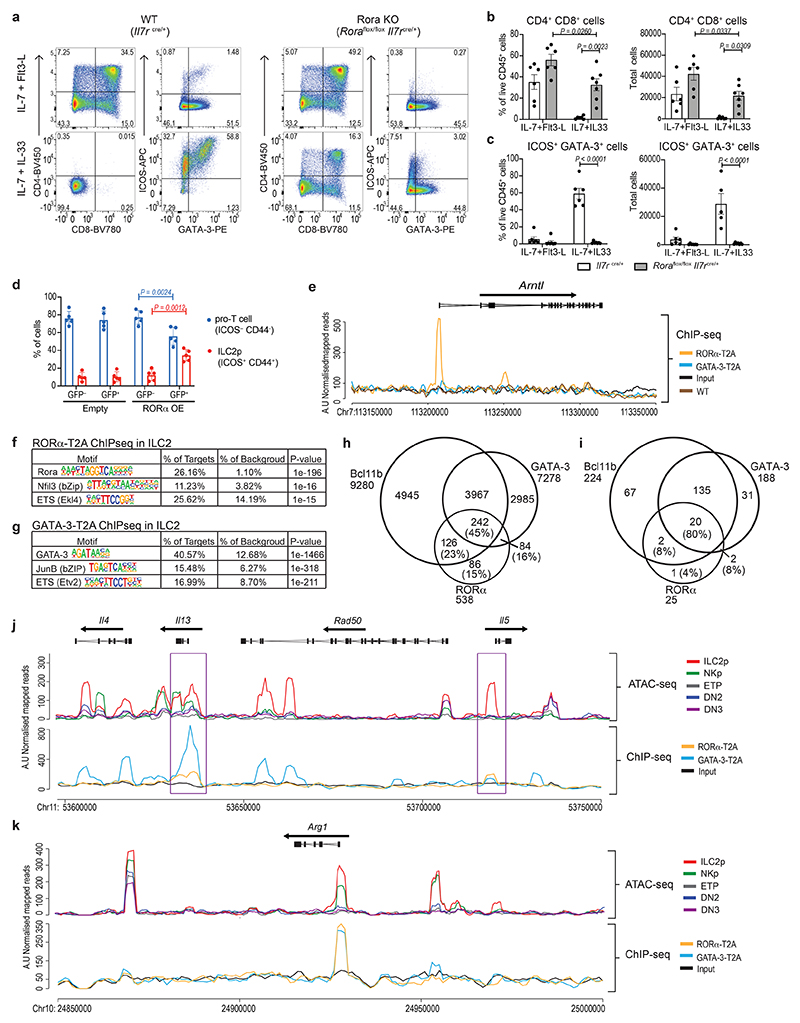
The co-development of ILC2p and T cells from ETPs in the embryonic thymus raises the intriguing question of what mechanisms govern this differential commitment. RORα is a transcription factor that can be used to discriminate thymic ILC2p from T cell progenitors7,28, but its function in ILC2 lineage restriction is not fully understood. To address the significance of RORα in ILC2 and T cell development we assessed thymocyte production in mice lacking RORα in lymphoid cells (Il7r Cre Rora fl/fl). ETPs from wild-type and RORα-deficient thymic ETPs produced DP T cells, but not ILC2, when cultured with OP9-DL1 stromal cells under T cell developmental conditions (IL-7 and Flt3-L)29 (Fig. 6a–c and Extended Data Fig. 3a). Wild-type thymic ETP also generated ILC2, but not DP T cells, when grown in the presence of IL-7 and IL-33 to promote ILC2 outgrowth (Fig. 6a–c and Extended Data Fig. 3a). By contrast, in the absence of RORα, ETPs from Il7r Cre Rora fl/fl mice, cultured under ILC2 developmental conditions gave rise solely to DP T cells instead of ILC2 (Fig. 6a–c and Extended Data Fig. 3a). Furthermore, overexpressing RORα in ETPs reduced the capacity of ETPs to differentiate along the T cell lineage and shifted them to ILC2 commitment, even under T cell development conditions (Fig. 6d and Extended Data Fig. 3b). Additionally, using 5xpolychromILC mice we confirmed that the ICOS+CD44+ cells were GATA-3hiRORα+Bcl11b+Id2+ ILC2s, and the ICOS−CD44− cells were GATA-3lowRORα−Bcl11b−Id2− pro-T cells (Extended Data Fig. 3c). These results demonstrate that RORα is required to maintain ILC2 development and repress T cell commitment.
Figure 6. RORα represses T cell fate and binds ILC2-associated genes.
(a) Flow-cytometry analysis of CD4, CD8, ICOS and Gata3 expression in cells generated in vitro after co-culture of ETPs, purified from Rora flox/flox Il7ra cre/+ or Il7ra cre/+, with OP9-DL1 stromal cells in the presence of growth factors.
(b) Flow-cytometry analysis of the frequency and numbers of CD4/CD8+ cells generated in vitro after co-culture of ETPs, purified from Rora flox/flox Il7ra cre/+ (grey) or Il7ra cre/+ (white), with OP9-DL1 stromal cells in the presence of growth factors. Data are representative of 3 independent experiments; mean ± SEM; two-way ANOVA with Bonferroni post-hoc test.
(c) Flow-cytometry analysis of the frequency and numbers of ICOS+GATA-3+ cells generated in vitro after co-culture of ETPs, purified from Rora flox/flox Il7ra cre/+ or Il7ra cre/+, with OP9-DL1 stromal cells in the presence of growth factors. Data are representative of 3 independent experiments; mean ± SEM; two-way ANOVA with Bonferroni post-hoc test.
(d) Flow-cytometry analysis of the frequency of pro-T cells (ICOS−CD44−) and ILC2p (ICOS+CD44+) cells generated in vitro after co-culture of ETPs, transduced with empty or RORα overexpressing vector, with OP9-DL1 stromal cells in the presence of growth factors (IL-7 and Flt3-L). GFP+ cells represent the positively transduced cells. Data are representative of 2 independent experiments (n=5 biologically independent samples); mean ± SEM; two-way ANOVA with Bonferroni post-hoc test.
(e) Representative binding profiles of RORα-T2A and GATA-3-T2A in ILC2 in the Arntl locus. RORα-T2A and GATA-3-T2A ChIP-seq analyses were performed using anti-T2A antibody and ILC2 purified from lymph nodes of Rora teal/teal, Gata3hCD2TR /+ or wild type mice, and expanded in vitro with IL-7 and IL-33. Tracks shown are representative of three independent experiments.
(f) The top three enriched sequence motifs of RORα-T2A peaks in ILC2. Enrichment was assessed using a one-sided cumulative binomial distribution in HOMER. P-value, final enrichment P-value; % of targets, number of target sequences with motif as percent of total targets; % of background, number of background sequences with motif as percent of total background.
(g) The top three enriched sequence motifs of GATA-3-T2A peaks in ILC2. Enrichment was assessed using a one-sided cumulative binomial distribution in HOMER. P-value, final enrichment P-value; % of targets, number of target sequences with motif as percent of total targets; % of background, number of background sequences with motif as percent of total background.
(h) Venn diagram showing the number of genes associated with RORα-T2A, GATA-3-T2A and Bcl11b22 peaks.
(i) Venn diagram showing the number of genes differentially expressed between ETP and ILC2p in E15.5 thymus (bulk RNA-seq data) that are associated with RORα-T2A, GATA-3-T2A and Bcl11b22 peaks.
(j) Representative analysis of the type-2 cytokine loci showing ATAC-seq tracks for thymic ETP, DN2, DN3, NKp and ILC2p, and binding profiles of RORα-T2A and GATA-3-T2A in ILC2 purified from lymph nodes from Rora teal/teal or Gata3hCD2TR /+ mice, and expanded in vitro with IL-7 and IL-33. Purple rectangles show RORα-T2A binding sites at Il13 and Il5 promoters. Tracks shown are representative of three independent experiments.
(k) Representative analysis of the Arg1 locus showing ATAC-seq tracks for thymic ETP, DN2, DN3, NKp and ILC2p, and binding profiles of RORα-T2A and GATA-3-T2A in ILC2 purified from lymph nodes as in (j).
RORα binds to genes associated with ILC2 function
To elucidate the transcriptional regulatory capacity of RORα we performed chromatin immunoprecipitation followed by sequencing (ChIP-seq) on ILC2 expanded in the presence of IL-7 and IL-33. In our hands commercially available anti-RORα antibodies were unsuitable for ChIP-seq. Therefore we generated rabbit polyclonal antibodies against the T2A self-cleaving peptide (Extended Data Fig. 3d) that remains associated with RORα (referred to as RORα-T2A) and GATA-3 (referred to as GATA-3-T2A) proteins following their expression in Rora Teal/Teal and Gata3 hCD2TR/hCD2TR mice23. This approach identified previously known gene targets of RORα, including Arntl (encoding Bmal) and Clock, in ILC2 (Fig. 6e and Extended Data Fig. 4a). We also confirmed GATA-3-binding to previously reported GATA-3-target genes including Il1rl1, Il2ra and Rora 30 (Extended Data Fig. 4b), but not Arntl or Clock (Fig. 6e and Extended Data Fig. 4a). Furthermore, the main DNA-binding motifs enriched from the RORα-T2A and GATA-3-T2A-derived peaks were the consensus RORα-binding site and GATA-3-binding site, respectively (Fig. 6f,g). The next most enriched transcription factor binding sites within the RORα-T2A and GATA-3-T2A peaks, were members of the bZIP and ETS families (Fig. 6f,g), factors previously associated with Bcl11b-binding sites in an ILC2 cell line22. GATA-3-T2A and Bcl11b22 binding-sites also coincided with 45% of all RORα target genes in ILC2, with only 15% of RORα-T2A-binding genes not shared with Bcl11b and/or GATA-3 (Fig. 6h). Furthermore, comparison of genes upregulated during the ETP to ILC2p transition revealed an 80% intersection of RORα-T2A with GATA-3-T2A and Bcl11b-bound genes (Fig. 6i). Assay for transposase-accessible chromatin sequencing (ATAC-seq) analysis indicated that the Il13, Arg1, and Il1rl1 loci become accessible in embryonic thymocytes between the ETP and ILC2p transition (Fig. 6j,k and Extended Data Fig. 4b, 5a,b). Notably, we also observed RORα-T2A binding to the promoters of Il13 and Il5, but not Il4 (genes bound by GATA-3 in the cytokine gene cluster31) (Fig. 6j and Extended Data Fig. 5b). Similarly, Arg1 another characteristic marker of type-2 cells is bound by both RORα-T2A and GATA-3-T2A (Fig. 6k and Extended Data Fig. 5b). These data support a potential involvement of RORα in ILC2 function, in addition to its defined role in ILC2 development.
RORα binds Id2 and Nfil3 regulatory elements
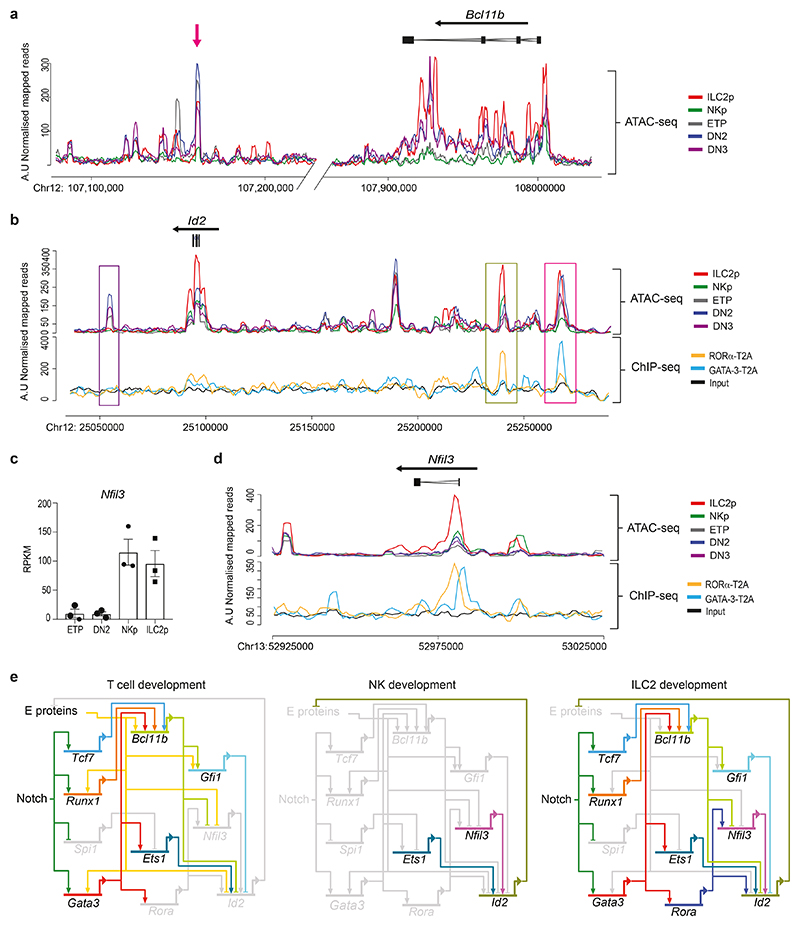
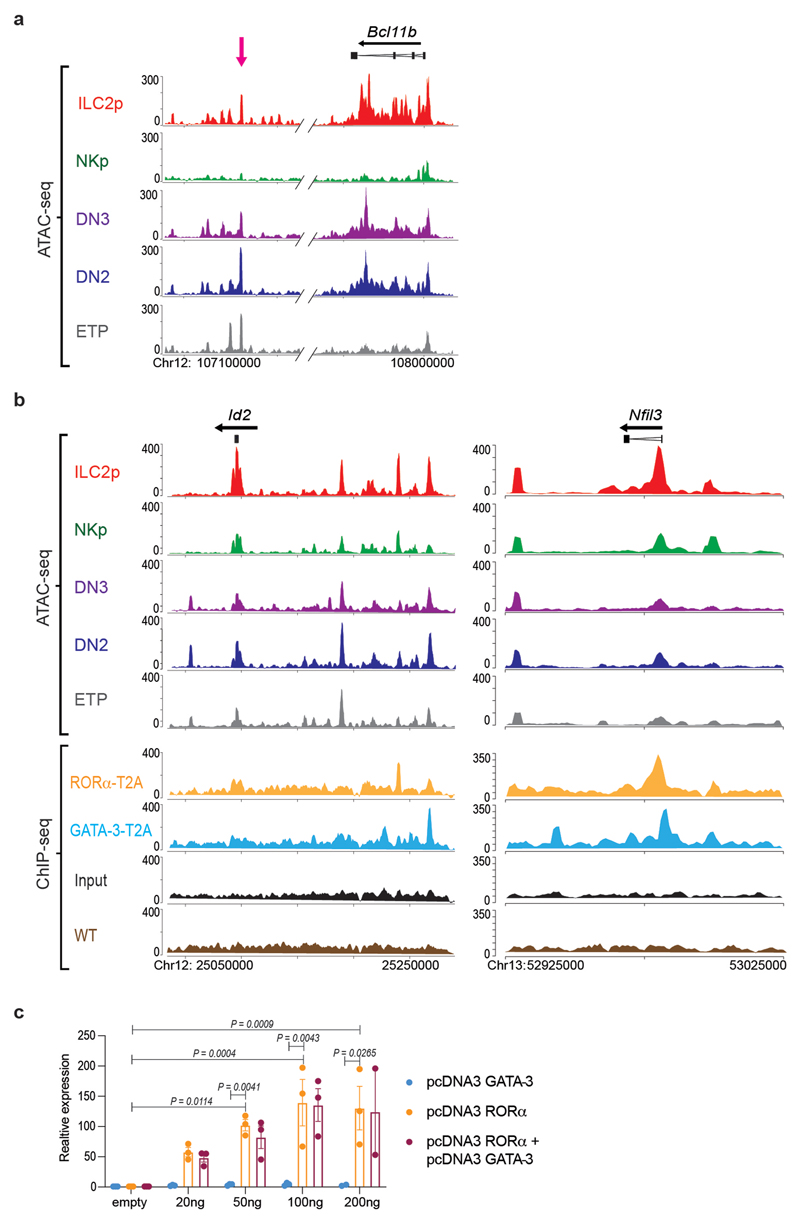
Does RORα interact with Id2 and Nfil3? The developmental circuit in which Bcl11b blocks Id2, thereby ensuring E2A function, works well to explain the T cell – NK lineage bifurcation, where the expression of Bcl11b and Id2, respectively, are mutually exclusive16,17,18. However, in developing ILC2p, Bcl11b and Id2 are co-expressed, and both play essential functional roles in ILC2 commitment19,21. Thus, a new transcriptional model is required to explain co-development of T cells and ILC2 in the thymus. By investigating open chromatin accessibility we found that the Bcl11b distal enhancer located +850 kb downstream of the Bcl11b locus32, is accessible in E19.5 thymic ILC2p, ETPs and DN2/DN3 cells (Fig. 7a and Extended Data Fig. 6a), in common with the Bcl11b activation mechanism reported previously for pro-T cells32. However, the +850 regulatory region is not accessible in NKp cells and consequently Bcl11b is not expressed, thereby allowing NK cell development.
Figure 7. RORα binds Id2 and Nfil3 regulatory elements.
(a) Representative ATAC-seq tracks for thymic ETP, DN2, DN3, NKp and ILC2p showing regions around the major Bcl11b enhancer (magenta arrow) and Bcl11b locus. Tracks shown are representative of three independent experiments.
(b) Representative ATAC-seq tracks for thymic ETP, DN2, DN3, NKp and ILC2p and binding profiles of RORα-T2A and GATA-3-T2A in ILC2 (as in Fig 6j) around the Id2 locus. Purple rectangle shows regulatory region 40 kb downstream of the Id2 transcription start site. Green rectangle shows RORα-T2A binding site and magenta rectangle shows GATA-3-T2A binding site.
(c) Gene expression (RPKM from bulk RNA-seq analysis) showing Nfil3, in different embryonic thymus populations. Data represent mean ± SEM (n=3 biologically independent samples).
(d) Representative ATAC-seq tracks for thymic ETP, DN2, DN3, NKp and ILC2p and binding profiles of RORα-T2A and GATA-3-T2A in ILC2 (as in Fig 6j) around the Nfil3 locus.
(e) Model of transcriptional circuits for T cell, NK cells and ILC2 development from ETP in the thymus using BioTapestry format48. T cell development: Bcl11b expression promotes Id2 and Nfil3 repression that allows E protein activity. NK development: without Bcl11b expression, Id2 and Nfil3 are expressed, thereby repressing E proteins. ILC2 development: RORα expression allows co-expression of Bcl11b and Id2/Nfil3.
In developing pro-T cells Bcl11b represses Id2 through multiple binding sites within, and around, the Id2 locus, with the major repressive element located +40 kb downstream of the Id2 transcription start site (TSS)16. ATAC-seq data showed that at E19.5, this regulatory region was accessible in ETP and DN2/DN3 cells, but not ILC2p or NKp (Fig. 7b and Extended Data Fig. 6b). The Id2 locus was enriched with RORα-T2A binding sites, as indicated by the broad peak in this location. A RORα-T2A binding site was also present approximately –143 kb from the Id2 TSS, a region shown by ATAC-seq to be accessible in thymic ILC2p. GATA-3-T2A also bound in this regulatory domain, in a region shown previously to bind Bcl11b22. We found that a 1886 bp fragment flanking the -143 kb RORα binding site (chr12:25239740-25241575) was capable of inducing dose-dependent luciferase expression upon co-transfection of the reporter construct with increasing concentrations of a RORα-expressing vector, as compared to control (Extended Data Fig. 6c). No synergistic activation (or antagonism) was observed following the co-transfection of RORα and GATA-3 expressing vectors (Extended Data Fig. 6c). These data indicate the potential for RORα to drive transcription when bound to this Id2-associated regulatory region.
Nfil3-deficient mice have normal T cell development33, but Nfil3 is necessary for all ILC production20. Similar to Id2, repression of Nfil3 is required for T cell development, a role attributed to Bcl11b15, and is essential for promoting ILC lineage restriction20. Thymic ILC2p and NKp, but not ETPs or DN2 cells, expressed Nfil3 (Fig. 7c). In agreement, ATAC-seq data indicated that in E19.5 thymic ILC2p the promoter region of Nfil3 is accessible (Fig. 7d and Extended Data Fig. 6b). Notably, we detected RORα-T2A binding to this regulatory region, and again this was in close apposition to GATA-3-T2A binding. Taking these data together, and combining them with our gene expression data for specific TFs that are known to regulate lymphocyte differentiation, we propose a revised transcriptional circuit to explain the co-development of T cells, ILC2 and NK cells from ETP in the thymus (Fig. 7e).
Discussion
The similarity between pro-T cells and ILC2 make it extremely challenging to discriminate between them, especially in the thymus, where pro-T cells predominate and where single TF reporter analysis in combination with cell surface markers may lead to mis-assignment of lineage relationships10. The recent development of a multi-TF-driven reporter polychromILC mouse model23 allowed us to clearly identify ILC2 in the developing embryonic thymus using the characteristic TF expression combination (Id2, GATA-3, Bcl11b and RORα – as predicted by our scRNA-seq analysis), before the expression of distinctive cell surface markers. ILC2p development initiated at ~E14.5 in the embryonic thymus in parallel with pro-T cell differentiation and preceded the appearance of DP T cells. Our data also confirmed the presence of NKp as early as E13.5 (ref.34). We further demonstrated that in vivo, ILC2p and T cells differentiated in the embryonic thymus from a common progenitor, and established that thymic ILC2p/ILC2 have the ability to leave the thymus and repopulate peripheral tissues. Indeed, in keeping with their expression of the chemokine receptor CCR9 the ILC2p appeared to preferentially seed the siLP, mirroring the importance of CCR9 for T cell migration, where deletion of CCR9 in CD4+ OTII or CD8+ OTI T cells impaired their ability to localize to the siLP35. In the intestine ILC2 contribute to the protective responses to helminth infections27, responding to IL-25 derived from Tuft cells36.
The co-development of pro-T cells and ILC2p in the embryonic thymus raises the question of what determines the divergence of these two closely related cell fate pathways. Indeed, ILC2 and T cells require IL-7 and Notch signaling for their differentiation, but the strength and duration of the signal required is not equivalent13,37. We found distinct expression of Il7ra and Notch receptors between DN2 and ILC2p. ILC2p upregulated Il7ra and downregulated Notch1, whereas DN2 down-regulated Notch2 and did not alter their Il7ra expression. These early modifications may modulate how these cells respond to thymic microenvironmental stimuli. In the thymus, IL-7 and Delta ligands are expressed by cTEC26 which develop from E12 (ref.38), and requires crosstalk with the developing thymocytes for full maturation39. Thus, the presence of developing thymocytes and cTECs in the fetal thymus may create distinct heterogeneous microenvironments in which immature cTEC and mature cTEC differentially express IL-7 and DLL4 to favor T cell or ILC2p fate. We observed clusters of NKp and ILC2p amidst the predominant pro-T cells in the embryonic thymus, suggesting that localized foci of ILC2p development exist. Although we identified IL-33 positive cells inside the thymus located near to NKp-ILC2 niches, IL-33 was not essential for ILC2p development. Furthermore, since T cell development was not perturbed in the absence of ILC2 in the thymus it is unlikely that ILC2 contribute to the IL-4 and IL-13-modified thymic microenvironment that has been reported to promote thymus emigration40. Further studies are required to determine the nature of these restricted regions of ILC2p development within the thymus.
It is noteworthy that in the thymic microenvironment the developmental path of ILC2 differs from that observed in the bone marrow23. Our data suggest that thymic-ILC2 development bypasses or progresses rapidly through intermediate stages, such as ILCP or Trans-ILCP, and there was no evidence of ILC3p. Indeed, we observed that Bcl11b, RORα and Id2 expression occurs in parallel, and future studies will be required to tease out the microenvironmental cues and transcription factors that differentially regulate Rora induction in ILC2, but not T cells, thereby restricting T cell commitment and promoting ILC2 development.
Downstream of the thymic signals that preferentially stimulate ILC2 or T cell differentiation the regulatory circuit controlling the divergence of gene expression at the T cell:ILC2 differentiation checkpoint, has remained obscure. Bcl11b expression marks T cell lineage commitment15,41, and prevents NK cell differentiation17,18,32 by blocking Id2 expression that would otherwise inhibit E2A. However, in developing ILC2p, Bcl11b and Id2 are co-expressed, and both play essential functional roles in ILC2 commitment21. However, Rora expression is differentially expressed by ILC2p, but not pro-T cells. Notably, we found that in the absence of RORα ETP differentiated into T cells, even in the presence of high IL-7 and IL-33 concentrations that normally induce ILC2, showing that RORα not only promotes ILC2 development, but also represses T cell fate. This was confirmed by the overexpression of RORα which favored ILC2 development even under T cell differentiation conditions.
Consequently, following RNA-seq, ATAC-seq and RORα-ChIP-seq analyses we propose a new developmental circuit for ILC2:T cell development from ETP incorporating RORα into the existing network reported for T cell development15. In the absence of Notch signaling, Bcl11b is not expressed, and consequently Id2/Nfil3 dominate to drive NK cell production. However, when Notch signaling is present, Bcl11b is switched on (with other TFs) and dampens Nfil3/Id2 expression, resulting in reinforcement of the T cell pathway by E proteins. By contrast, if RORα is also switched on it serves to override the Nfil3/Id2 repression, thereby creating balanced expression of Bcl11b and Id2. The balanced state permits ILC2 differentiation while simultaneously preventing the E proteins from inducing T cell development.
Our data also show that in ILC2 RORα binds to type-2 response genes, including Il13, Il5 and Arg1 (refs.42,43,44), often in the vicinity of GATA-3 binding regions. We also found that GATA-3 binds the Rora locus in ILC2, but that these regions were not accessible in pro-T cells, correlating with the absence of RORα in early T cell development. Similar data have shown that whilst GATA-3 binds to the Rora locus in DP T cells, it fails to do so in DN1 or DN2 cells41. However, the mechanisms controlling these differences remain to be elucidated and appear complex. Indeed, high GATA-3 expression alone is unlikely to explain RORα induction in ILC2p, since increased expression of GATA-3 in ETPs is reported to result in misdirected mast cell production45,46. The balance of E proteins may also regulate RORα, for example, the introduction of E47 protein expression into E2A-deficient lymphoma cells lines promoted the repression of Rora expression47.
In summary, we demonstrate that functional ILC2 can arise from the thymus and contribute to the innate type-2 response at mucosal tissues. They originate in the embryonic thymus from ETP, in parallel with pro-T cells due to the expression of RORα at a critical checkpoint in innate versus adaptive lymphocyte development.
Methods
Mice
Il7ra Cre 49, Rora fl/fl 4, Il33 cit/cit 50, Il25 tom/+ (manuscript in preparation A.N.J.M.), Il13 tdTom/+ 42, 5xpolychromILC mice, Rora Teal/Teal, Bcl11b TdTom/+, Id2 BFP/+ 23 were on a C57BL/6 background. CD45.1 Rag2 −/− Il2rgc −/− mice were a gift from J. Di Santo (Pasteur Institute) and C57BL/6 Jax controls were bred in-house. Male and female mice were maintained in the Medical Research Council ARES animal facility under specific pathogen–free conditions, at 19 - 23°C with 12 hours light dark cycle. All animal experiments undertaken in this study were done with the approval of the LMB Animal Welfare and Ethical Review Body (AWERB) and of the UK Home Office.
Generation of Gata3 hCD2TR gene-targeted mice
The Gata3 hCD2TR mouse line was generated as for the Gata3 hCD2 mouse line23, using CRISPR-mediated gene targeting to insert a T2A-truncated human CD2 sequence51.
Tissue preparation
Cell suspensions of spleen, MLN, liver and thymus were obtained by passing the tissues through a 70-μm strainer. Lung tissue was pre-digested with 750 U/mL collagenase I (GIBCO) and 0.3 mg/mL DNaseI (Sigma-Aldrich) prior to obtaining a single-cell suspension. Bone marrow was removed from femurs and tibiae by flushing with PBS + 2% FCS, or by centrifuging briefly at 6000 × g. For bone marrow, lung, liver and spleen cell suspensions, red blood cells were removed by incubation with RBC lysis solution (140 mM NH4Cl, 17 mM Tris; pH 7.2). Lung lymphocytes were further enriched by centrifugation in 30% Percoll at 800 × g (GE Healthcare) while liver lymphocytes were enriched in 40% Percoll at 690 × g.
For preparation of siLP lymphocytes, intestinal contents were removed by the application of gentle pressure along the length of the intestine. Intestines were opened longitudinally, cut into 3-cm-long pieces and washed briefly by vortexing in PBS + 10 mM HEPES pH 7.4 (PBS/HEPES). Epithelial cells were removed by incubation with RPMI supplemented with 2% FCS, 1 mM dithiothreitol and 5 mM EDTA for 2 × 20 min at 37°C with shaking (200 rpm). Intestinal pieces were washed with PBS/HEPES and incubated, with shaking, at 37°C with RPMI + 2% FCS, 0.125 KU/mL DNaseI (Sigma-Aldrich) and 62.5 μg/mL Liberase TL (Roche) until no large pieces of intestine remained. Cells were then passed through a 70-μm strainer, pelleted and separated over a 40%:80% gradient of Percoll at 600 × g for 20 min. siLP lymphocytes were isolated from the interface and prepared for flow cytometric analysis.
Flow cytometry
Single-cell suspensions were incubated with fluorochrome-, or biotin-, conjugated antibodies in the presence of anti-CD16/CD32 antibody (Fc block, clone 2.4G2), as indicated. Antibodies were from BioLegend (CD3e (PEcy7, 145-2C11, 1:500 dilution), CD8 (BV785, 53-6.7, 1:500 dilution; and AlexaFluor700, 53-6.7, 1:500 dilution), CD11b (PEcy7, M1/70, 1:500 dilution), CD19 (AlexaFluor700, 6D5, 1:500 dilution), IL-7Rα (Biotin, SB/199, 1:500 dilution; and BV605, A7R34, 1:200 dilution), CD24 (BV605, M1/69, 1:1000 dilution), CD25 (BV510, PC61, 1:500 dilution), CD4 (BV785, RM4-5, 1:500 dilution; BUV737, HK1.4, 1:500 dilution; and BV450, GK1.5, 1:500 dilution), CD45 (bv785, 30-F11, 1:500 dilution), CD45.1 (BV510, A20, 1:500 dilution), CD45.2 (BV785, 104, 1:500 dilution), FcεRI (AlexaFluor700, MAR-1, 1:500 dilution), Flt3 (PE, A2F10, 1:500 dilution), Gr-1 (AlexaFluor700, RB6-8C5, 1:500 dilution), hCD2 (BV510, RPA-2.10, 1:500 dilution), ICOS (PerCP-Cy5.5, C398.4A, 1:500 dilution), perforin (PerCP-eF710, S16009B, 1:300 dilution), Sca-1 (BV605, D7, 1:1000 dilution), Ter-119 (AlexaFluor700, TER-119, 1:500 dilution)); eBioscience (CD3e (AlexaFluor700, 17A2, 1:500 dilution), CD5 (PEcy7, 53-7.3, 1:500 dilution), CD19 (PEcy7, eBio1D3, 1:500 dilution), CD11c (AlexaFluor700 and PEcy, N418, 1:500 dilution), CD11b (AlexaFluor700, M1/70, 1:500 dilution), cKit (P2B8), Gr-1 (PEcy7, RB6-8C5, 1:500 dilution), FcεRI (PEcy7, MAR-1, 1:500 dilution), Ter-119 (PEcy7, TER-119, 1:500 dilution), KLRG1 (PE, 2F1, 1:500 dilution), CD44 (APC, IM7, 1:1000 dilution), CD25 (PerCP-Cy5.5 and PEcy7, PC61.5, 1:500 dilution), Eomes (APC, Dan11mag, 1:300 dilution), ICOS (APC, 7E.17G9, 1:500 dilution), EpCAM (Pecy7, G8.8, 1:500 dilution), GATA-3 (PE, TWAJ, 1:300 dilution), ST2 (PerCP-eF710, RMST2-2, 1:300 dilution), Streptavidin (APC, 1:500 dilution)); NIH Tetramer Facility (CD1d-tetramer loaded with the glycolipid PBS-57, APC, 1:1000 dilution); BD Biosciences (NK1.1 (BUV395, PK136, 1:300 dilution), hCD2 (BUV395, RPA-2.10, 1:300 dilution)); and MD Bioproducts (ST2 (FITC, DJ8, 1:300 dilution)). ‘Lineage’ staining included antibodies specific for CD11b, CD11c, CD19, FcεRI, Gr-1 and Ter-119. All samples were co-stained with a cell viability dye (Fixable dye eFluor780, Invitrogen) and analysis was performed on an LSRFortessa system (BD Biosciences) with FACSDiva Software (V6.2, BD Biosciences). For cell sorting an iCyt Synergy (70-μm nozzle, Sony Biotechnology) was used. Intracellular transcription factor staining was performed by fixation with 2% PFA for 45 min, followed by incubation with fluorochrome antibodies diluted in perm wash buffer (Foxp3 staining kit, eBioscience). Data were analyzed with FlowJo software (version 10).
Confocal fluorescence microscopy
Embryonic thymus was dissected and fixed in 4% PFA at 22°C for 30 min before soaking overnight at 4°C in 30% sucrose PBS solution. Samples were embedded in gelatine, flash-frozen and sectioned to 20 μm on Superfrost Plus slides (Thermo Fisher Scientific). For IL-33 staining, sections were permeabilized, stained overnight at 4°C with anti-IL-33 (AF3626, R&D Systems), then for 1 h at 22°C with donkey anti-goat IgG AF647 antibody (ab150131, Abcam). Sections were mounted using Prolong Gold (Thermo Fisher Scientific). Images were obtained with a 20x objective lens using a Zeiss 780 inverted confocal microscope with Zen software (version 14.0.19.201, configuration 6.00.00). Sequential laser scanning was used to minimize spillover between fluorescent proteins.
Image Quantification
Cells were identified by manual picking of Bcl11b+, Id2+, Bcl11b+ Id2+ and IL-33+ cells on ImageJ (version 2.0.0-rc—69/1.52p) using Cell Counter FIJU plug-in (Kurt De Vos; https://imagej.nih.gov/ij/plugins/cell-counter.html). Cartesian coordinates of picked cells from each image were imported into R, then nearest neighbor analysis was performed for each cell to the nearest cell of specified type using R package spatstat v1.17.052,53.
Fetal thymus organ culture
E15.5 thymus lobes from WT mice were cultured for 7 days in 1.35 mM dGuo and reconstituted, in hanging drop cultures, with FACS purified cells from 5xpolychromILC mice, as described previously54.
Transplantation under the kidney capsule
Recipient Rag2 −/− Il2rgc −/− mice were anesthetized (3% Isoflurane) and received subcutaneous analgesic (10% Vetergesic). The animal was placed on its side, and the location of the kidney identified through the body wall. A small incision was made in the body wall over the kidney just slightly longer than the long axis of the kidney. The kidney was then extruded. Using a needle (30 gauge), a small incision was made in the kidney capsule, and, using a fine pair of forceps, four freshly isolated E15.5 thymus lobes from 5 polychromILC mouse embryos were inserted under the kidney capsule. The kidney was replaced into the peritoneum and the incision closed using vet-bond tissue glue. Analysis of donor cell progeny was performed 6 weeks after surgery.
Adoptive transfers
ILC2p, as defined by lineage-negative (Lin−, a combination of CD3, CD4, CD8a, CD19, CD11c, CD11b, Gr1, FcεR1, NK1.1, and TER119) Flt3− IL7Rα+ ST2+ SCA1+, were FACS purified from E19.5 embryonic thymus (CD45.2) and from BM of adult mice (CD45.1). ILC2p from both sources were mixed at a ratio of 1:1 and implanted via tail vein injection into sublethally-irradiated (450rad) Rag2 −/− Il2rgc −/− recipients. Analysis of donor cell progeny was performed 6 weeks after cell transfer.
In Vitro Cell Cultures
For the expansion of ILC2s in vitro, ILC2s from MLN of IL-25 and IL-2/anti–IL-2 complex (rmIL-2; 0.5 μg/mouse; BioLegend and anti–IL-2; 0.25 μg/mouse; JES6-1A12, 2BScientific) treated mice55 were FACS purified, as defined by LIN−ICOS+ KLRG1+. Cultures were maintained for 7 days in RPMI-1640, 10% FCS plus penicillin/streptomycin and 2-mercaptoethanol, supplemented with IL-7 (10 ng/ml) and IL-33 (10 ng/ml)27.
For analysis of perforin and EOMES expression, cell subsets were cultured in complete RPMI, and stimulated with IL-2, IL-15 and IL-18 (all at 50 ng/mL) for 48 h before flow-cytometric analysis.
OP9-DL1 stromal cell co-cultures
OP9-DL1 cells were maintained in complete IMDM (IMDM, supplemented with 20% FCS, 1% penicillin, 1% streptomycin, 0.1% 2-mercaptoethanol and non-essential amino acids (GIBCO)). OP9-DL1 cells were incubated with 4 μg/mL mitomycin C for 2 h, washed, seeded at a density of 1 × 10⁶ cells per 96-well plate and allowed time to adhere. Sorted cell populations were seeded onto OP9-DL1 monolayers and cultured in complete IMDM, supplemented with 5 ng/mL rmIL-7 (BioLegend) and 10 ng/mL Flt3-L (BioLegend), or 10 ng/mL rmIL-7 (BioLegend) and IL-33 (BioLegend), for 10 days before flow cytometric analysis of progeny.
RORα overexpression
pMIGII-Flag-RORα was generated by inserting Rora cDNA (isoform 2) into pMIGII (Addgene #52107) linearized with EcoRI and BamHI, using Gibson assembly. To generate retroviruses, empty control vectors or pMIGII-Flag-RORα vector were co-transfected with pCL-Eco into PlatE cells (Cell BioLabs #RV-101). Retroviral supernatants were collected at 72 h post-transfection and used fresh. For transduction, retroviral supernatants were mixed with lymphocytes and centrifuged at 1,000 g at 37 °C for 1 h on RetroNectin-coated plates. Following transduction, lymphocytes were cultured on OP9-DL cells as described.
Luciferase assay
Expression vectors consisted of the plasmid pcDNA3 containing the coding sequences for either GATA-3 or RORα isoform 2. Id2 fragment (genomic location: 12:25239740-25241575) was cloned into Photinus luciferase reporter plasmid PGL4.23 (Promega). 3T3 cells were cultured in DMEM supplemented with 10% FBS. For luciferase assays, 3T3 cells were plated in 48-well plates at a density of 3.1 × 10⁴ cells per well. Cells were transfected with 20, 50, 100 or 200 ng of the gene containing vector (as specified) or empty control plasmid together with 80 ng PGL4.23 and 20 ng of the TK-pRL Renilla vector (Promega). At 48 h after transfection, both Photinus and Renilla luciferase activity were measured with the Dual Luciferase Assay system (Promega).
RNA-seq
Cells were flow sorted into PBS 50% FCS and RNA was extracted using RNeasy Plus micro kit (Qiagen). After assessment using a Bioanalyser (Agilent), RNA was processed for RNA-sequencing using an Ovation RNA-seq System V2 (Nugen), fragmented using the Covaris M220, and bar-coded using Ovation Ultralow Library Systems (Nugen). Samples were sequenced using an Illumina Hiseq4000 running a single-read 50bp protocol (Cancer Research UK Cambridge Institute). Sequence data were trimmed to remove adaptors and sequences with a quality score below 30 using Trim Galore (v0.50, Babraham Bioinformatics), then aligned to the mouse genome (GRCm38) using STAR (v2.6.0a, Spliced Transcripts Alignment to a Reference, Alexander Dobin) and differential expression calculated using DEseq2 (v1.18.1)56.
Single-cell RNA-seq
Smart-seq2Single cell RNA-seq libraries were prepared essentially as described previously57, with modifications as described below. Individual cells were flow cytometrically purified on a 96-well format into 0.2% Triton X-100 containing RNase inhibitor, dNTPs and oligo-dT primers and stored at −80°C. On thawing, lysates were heated to 72 °C for 3 min and subject to reverse transcription, PCR preamplification (26 cycles) and PCR purification. cDNA library quality was assessed for all samples by qualitative PCR using primers for 18 s RNA with an additional check by Bioanalyzer using an Agilent high sensitivity DNA chip on a small subset of libraries. A subset of libraries was quantified using the Qubit dsDNA HS assay kit and an average value used to calculate library dilution to 100-150 pg/μl.
cDNA library tagmentation and amplification was performed using the Illumina Nextera XT DNA Library Preparation Kit according to manufacturer’s instructions (except that all volumes were reduced to 25% of recommended volumes) and tagmentation performed at 55 °C for 20 min. Nextera index and Illumina adaptor sequences were incorporated at the amplification stage (N7xx and S5xx). Amplified and indexed libraries were pooled and purified using Agencourt AMPure XP beads at a ratio of 1:0.9 library to beads and washed with 70% ethanol. Two rounds of purification were performed before a final elution in 1.25× total library volume of Nextera Resuspension buffer. Pooled indexed libraries were quantified using the Qubit dsDNA HS assay kit and this was confirmed by qPCR with adaptor specific primers. Quality was assessed by Bioanalyzer using an Agilent high sensitivity DNA chip. Libraries were sequenced at the CRUK Cambridge NGS facility. Reads were aligned to a modified mouse transcriptome (GRCm38 with the genetically modified mice reporter sequences) using Salmon (v0.12.0)58. The resulting pseudocounts were then analyzed using R (v3.4.1) (https://www.R-project.org/) and the scater library (v1.6.3)59, scran library (v3.8)60, and sva library (sva: Surrogate Variable Analysis. R package v3.26.0). Cells with pseudocounts below 3 median-absolute-deviations away from the median were removed. The same threshold was applied to number of genes detected, percentage of counts mapping to mitochondrial genes and percentage of counts mapping to spike-ins. Genes with an average count across all remaining cells of less than 1 were removed. Size factors were then calculated using the scran library (based on the gene counts) and the data normalized by them, as described previously60. Finally, the batch effects caused by the use of different sequencing facilities were removed using the ComBat empirical Bayes framework from the sva library.
10X Single cell library preparation was performed using the 10X Genomics technology platform. The 10X Genomics Chromium Single Cell 3′ v3 protocol was followed to obtain 3′ libraries for subsequent sequencing. The reads were aligned to the mouse transcriptome (GRCm38) and expression calculated using the 10X Cellranger (v3.0.2) wrapper for the STAR aligner (Spliced Transcripts Alignment to a Reference, Alexander Dobin, v2.60a). Separate libraries were generated using cells from E15.5 (7,700 DN1 cells plus 300 DN2 cells) and E19.5 (7,700 DN1 cells plus 300 DN2 cells), then combined using Cellranger.
Generation of anti-T2A antibody
Polyclonal anti-T2A antibodies were generated in rabbit against the epitope GSGEGRGSLLTSGDVEENPG and eluted with glycine (Cambridge Research Biochemicals). For antibody validation, we performed immunoprecipitation analysis using lysates from HEK cells transiently transfected (TurboFect, ThermoFisher) with overexpression constructs (pcDNA3) for FLAG and T2A-tagged RORα; FLAG-tagged RORα; or HA and T2A-tagged GATA-3. The presence of the FLAG tag in our RORα expression construct allowed us to confirm the specificity of the T2A antibody.
ChIP-seq using ChIPmentation
Chromatin extracts from in vitro expanded ILC2 (1.0 × 10⁷) were prepared using truChIP Chromatin Shearing kit (Covaris), with 5 min of crosslink and optimized shearing conditions (peak power 75, duty factor 10.0, cycles/burst 200, duration 300 sec) to obtain fragments of ~500 bp. Extracts were exposed to 1% SDS and diluted 10 times with dilution buffer (5.5 mM EDTA, 55 mM Tris-HCl pH 8, 200 mM NaCl, 0.5% NP-40). Chromatin extract was incubated overnight at 4°C with 2 μg anti-T2A antibody. In addition, 25 μl of protein A Dynabeads (Thermo Fisher Scientific) per IP were blocked in PBS containing 0.1% BSA (Sigma) by incubation overnight at 4°C. The next day, beads were added to the chromatin extracts followed by 1 h incubation at 4°C. Beads were collected and washed 2 times with Low Salt buffer (0.1% SDS, 1% Triton X-100, 1 mM EDTA, 10 mM Tris-HCl pH 8, 140 mM NaCl, 0.1% Na-deoxycholate), 2 times with High Salt buffer (0.1% SDS, 1% Triton X-100, 1 mM EDTA, 10 mM Tris-HCl pH 8, 500 mM NaCl, 0.1% Na-deoxycholate), 2 times with LiCl buffer (10 mM Tris-HCl pH 8, 1 mM EDTA, 250 mM LiCl, 0.5% NP-40, 0.5% Na-deoxycholate) and 1 time with 10 mM Tris-HCl pH 8. Chromatin-antibody-bead complexes were then subjected to tagmentation, followed by DNA elution, and libraries amplification and purification, as described previously61. Pooled libraries were sequenced using an Illumina Hiseq4000 running a single-read 50bp protocol (Cancer Research UK Cambridge Institute). Sequenced reads were aligned to the mouse genome (GRCm38) using Bowtie2 (v2.3.5.1) with default parameters, and reads that could not be uniquely mapped were removed from further analysis. HOMER (v4.10.4) software was used for motif find analysis62. Peak calling analysis was performed using Macs2 (v2.1.2) and the target genes were defined by the closest gene from each peak (bedtools closest). Only target genes identified in two independent experiments were used in further analysis. To address the reproducibility among the replicates we used a statistical approach that generates a z-score, which reflects the number of standard deviations by which the measured similarity of any pair of datasets differs from the similarity expected by chance, as described previously63. We obtained p-values < 1e-16 indicating that the datasets are highly concordant.
ATAC-seq
ATAC-seq was performed as previously described64. 20,000 to 50,000 FACS purified cells were lysed using cold lysis buffer (10 mM Tris-HCl, pH 7.4, 10 mM NaCl, 3 mM MgCl2 and 0.1% NP-40) to obtain nuclei extract. Nuclei were immediately used in the transposase reaction (25 μl 2× TD buffer, 2.5 μl transposase (Illumina) and 22.5 μl nuclease-free water) for 30 min at 37 °C, followed by sample purification (Qiagen MinElute kit). Then, we amplified library fragments using Kappa HiFi HotStart Ready mix and 1.25 M of custom Nextera PCR primers as previously described65. Libraries were purified using dual (0.5x-0.7x) SPRI Ampure XP beads (Beckman Coulter), pooled and were subjected to high-throughput sequencing. ATAC-seq data was aligned to the genome using the same pipeline as the ChIP-seq data. The reproducibility of replicates was confirmed using the same approach described for the ChIP-seq data63.
Statistical analysis
Statistical analysis was performed using GraphPad Prism v8.0 software.
Reporting Summary
Further information on research design is available in the Nature Research Reporting Summary linked to this article.
Extended Data
Extended Data Fig. 1. Characterization of DN1 embryonic thymus populations using 5xpolychromILC mice.
(a) Flow-cytometry analysis of the indicated cell surface markers or transcription factors in the E13.5, E14.5, E15.5, E17.5 and E19.5 embryonic thymus of 5xpolychromILC mice.
(b) Flow-cytometric analysis of cKit and CD44 expression in DN1-Id2−Bcl11b−, DN1-Id2+Bcl11b+, DN2 and DN3 cells in the E15.5 embryonic thymus of 5xpolychromILC mice.
(c) Principal component analysis (PCA) of RNA-seq data from indicated thymic cell populations (Figure 2A) at E19.5 (n = 3).
(d) Heatmap of genes from bulk RNA-seq analysis selected from single-cell gene expression analysis data (Fig. 1c).
(e) Relative gene expression (from bulk RNA-seq analysis) of Zbtb16 and Pdcd1, in different embryonic thymus populations at E15.5 and E19.5 (n=3). Mean ± SEM; two-way ANOVA with Tukey post-hoc test.
(f) Flow-cytometry analysis of RORγt-Katushka, Bcl11b-tdtomato, GATA-3-hCD2, RORα-Teal and Id2-BFP expression in the double negative (DN) and double positive (DP) cell subsets from E17.5 embryonic thymus.
(g) Flow-cytometry analysis of RORγt-Katushka, Bcl11b-tdtomato, GATA-3-hCD2, RORα-Teal and Id2-BFP expression in ETP and ILC2p (lin−ST2+IL7Ra+) from E17.5 embryonic thymus.
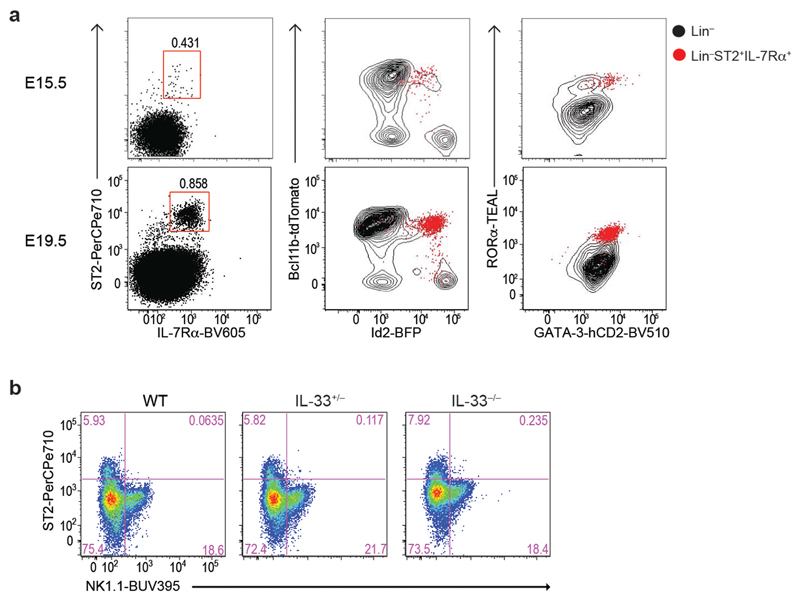
Extended Data Fig. 2. Thymic ILC2p express ST2 and IL-7Rα and are present in IL-33-deficient mice.
(a) Flow-cytometry analysis of Bcl11b-tdtomato, GATA-3-hCD2, RORα-Teal and Id2-BFP in IL-7Rα+ST2+ ILC2p during embryonic thymus development.
(b) Flow-cytometry analysis of ST2 and NK1.1 expression in the DN1 population in E16.6 embryonic thymus from wildtype (WT), Il33 +/- or Il33 −/- mice.
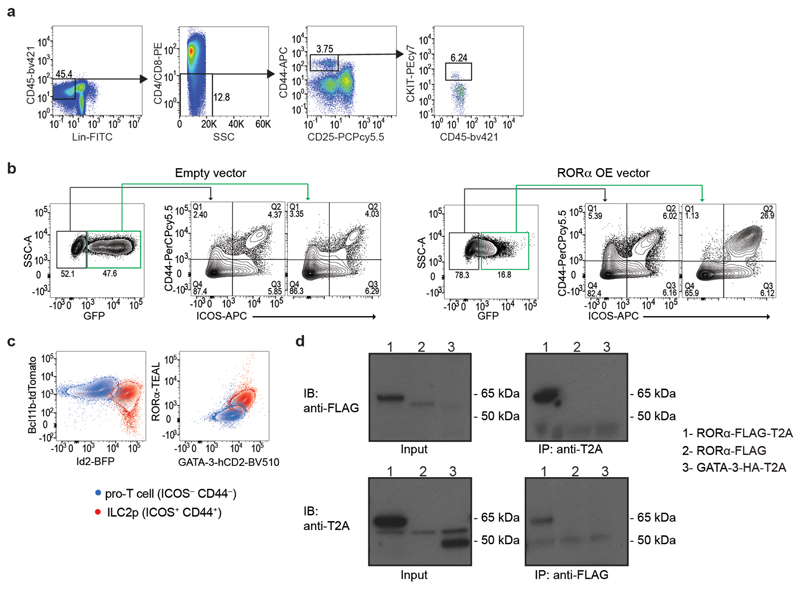
Extended Data Fig. 3. In vitro differentiation of ETP can be modulated by RORα expression.
(a) Representative flow-cytometry gating strategy for the purification of ETP cells.
(b) Representative flow-cytometry analysis of GFP, CD44 and ICOS expression by cells generated in vitro after co-culture of ETPs, transduced with empty or RORα overexpressing vector, with OP9-DL1 stromal cells in the presence of growth factors (IL-7 and Flt3). GFP+ cells represent the positively transduced cells.
(c) Flow-cytometric analysis of Bcl11b-Tom, Id2-BFP, RORα-TEAL and GATA-3-hCD2 expression in pro-T cells (ICOS−CD44−) and ILC2p (ICOS+CD44+) generated in vitro after co-culture of ETPs purified from 5xpolychromILC mice with OP9-DL1 stromal cells in the presence of growth factors (IL-7 and Flt3).
(d) Western blot analysis from HEK cells transiently transfected with overexpressing constructs (pcDNA3) for RORα-FLAG-T2A (62 kD), RORα-FLAG (58 kD) or GATA-3-HA-T2A (48 kD), immunoprecipitated with anti-T2A or anti-FLAG antibody and detected using anti-FLAG or anti-T2A antibody, respectively. Data are representative of 2 independent experiments.
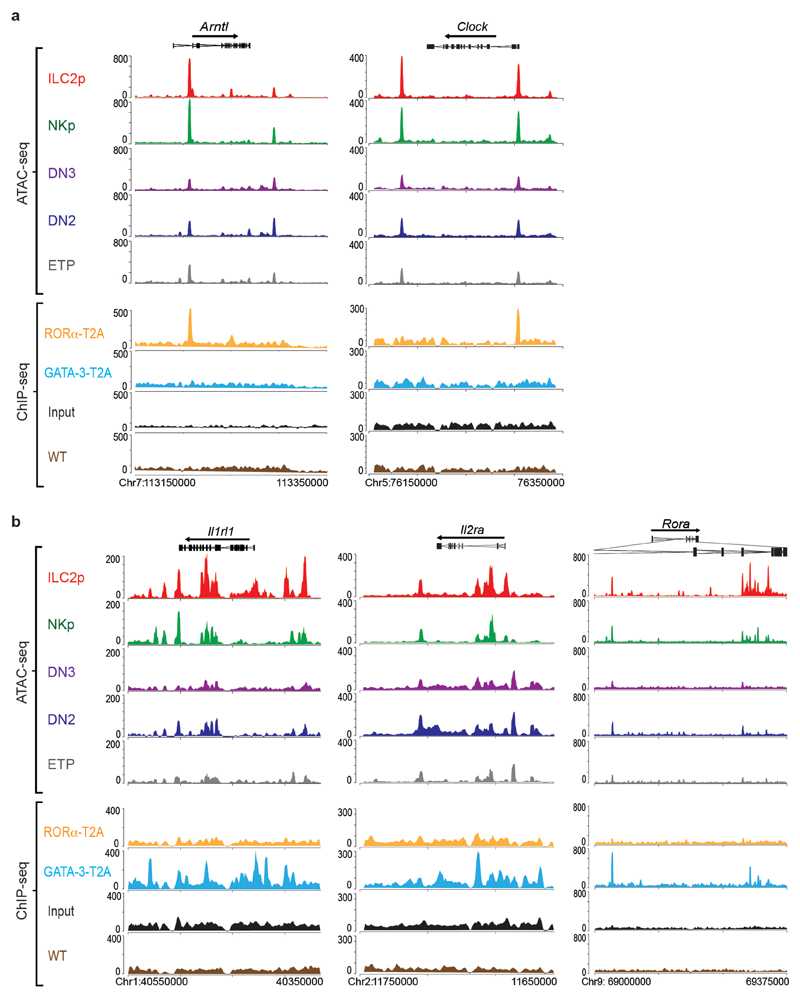
Extended Data Fig. 4. RORα binds to circadian rhythm associated genes in ILC2.
(a) Representative ATAC-seq tracks for thymic ETP, DN2, DN3, NKp and ILC2p, and binding profiles of RORα-T2A and GATA-3-T2A in ILC2 purified from lymph nodes of Rora teal/teal, Gata3hCD2TR/+ or wild type mice, and expanded in vitro with IL-7 and IL-33, around the Arntl and Clock loci. Tracks shown are representative of three independent experiments.
(b) Representative ATAC-seq tracks for thymic ETP, DN2, DN3, NKp and ILC2p, and binding profiles of RORα-T2A and GATA-3-T2A in ILC2 (as in Fig. S4a) around the Il1rl1, Il2ra and Rora loci.
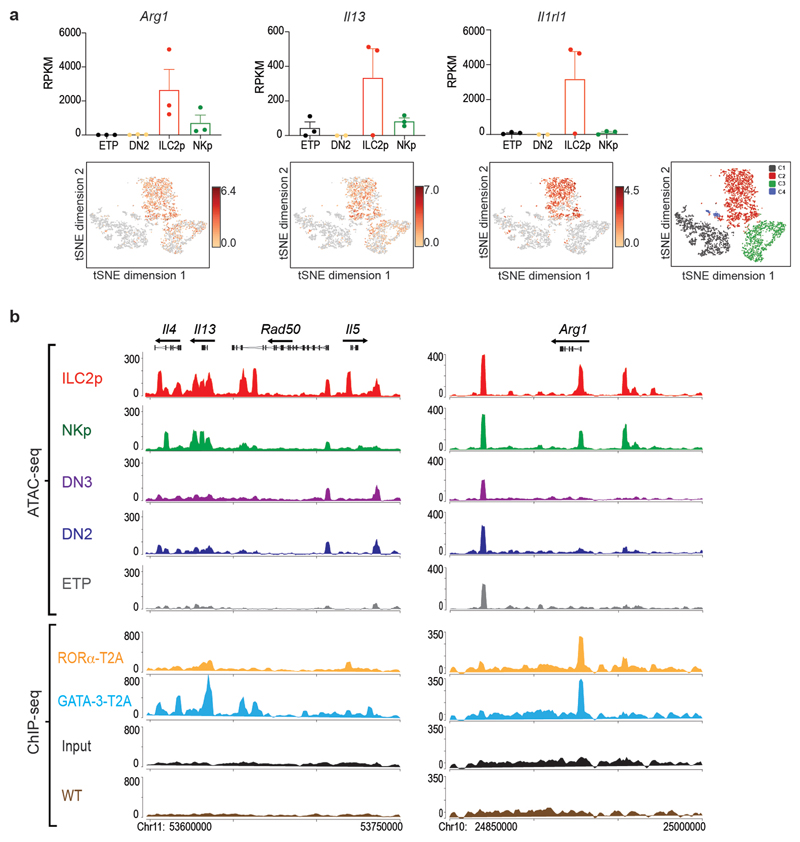
Extended Data Fig. 5. Genes associated with ILC2 function are among RORα target genes.
a) Gene expression (RPKM from bulk RNA-seq analysis) (top panel) and tSNE plots (log2 expression from single cell analysis) (lower panel) showing Arg1, Il13, Icos and Il1rl1, in different embryonic thymus populations. Data represent mean ± SEM (n=3 biologically independent samples).
(b) Representative ATAC-seq tracks for thymic ETP, DN2, DN3, NKp and ILC2p, and binding profiles of RORα-T2A and GATA-3-T2A in ILC2 purified from lymph nodes of Rora teal/teal, Gata3hCD2TR/+ or wild type mice, and expanded in vitro with IL-7 and IL-33, around the type-2 cytokine locus. Tracks shown are representative of three independent experiments.
Extended Data Fig. 6. RORα binds Id2 and Nfil3 regulatory elements.
(a) Representative ATAC-seq tracks for thymic ETP, DN2, DN3, NKp and ILC2p around the Bcl11b locus. Tracks shown are representative of three independent experiments.
(b) Representative ATAC-seq tracks for thymic ETP, DN2, DN3, NKp and ILC2p and binding profiles of RORα-T2A and GATA-3-T2A in ILC2 in ILC2 purified from lymph nodes of Rora teal/teal, Gata3hCD2TR/+ or wild type mice, and expanded in vitro with IL-7 and IL-33 around the Id2 and Nfil3 locus. Tracks shown are representative of three independent experiments.
(c) A luciferase assay shows the activity (relative to empty vector) of a DNA fragment containing the RORα-binding site from the Id2-associated -143 kb regulatory region, in the presence of increasing concentrations (as indicated) of RORα, GATA-3 or both. Data are representative of three independent experiments; mean ± SEM; two-way ANOVA with Tukey post-hoc test.
Supplementary Material
Acknowledgements
We are grateful to the Ares staff, genotyping facility and flow cytometry core for their technical assistance. This study was supported by grants from the UK Medical Research Council U105178805 (to J.L.B, M.W.D.H., M.G., H.E.J., M.D., R.B., A.C.) and Wellcome Trust 100963/Z/13/Z (to A.C.F.F., J.A.W., P.A.C., S.K., A.L.). A.C.H.S was supported by Croucher Cambridge International Scholarship.
Footnotes
Author contributions
A.C.F.F designed and performed experiments and wrote the paper. J.A.W., P.A.C., A.C., J.L.B., M.W.D.H., S.K., A.L., M.G., A.C.H.S., R.B., M.D., H.E.J. performed experiments, provided advice on experimental design and interpretation, and commented on the manuscript. A.N.J.M. supervised the project, designed the experiments and wrote the paper.
Competing interests
The authors declare no competing interests.
Data availability
All high-throughput data in this study were deposited at the Gene Expression Omnibus (GEO) under series GSE146745.
References
- 1.Walker JA, McKenzie AN. Development and function of group 2 innate lymphoid cells. Curr Opin Immunol. 2013;25:148–155. doi: 10.1016/j.coi.2013.02.010. [DOI] [PMC free article] [PubMed] [Google Scholar]
- 2.Vivier E, et al. Innate Lymphoid Cells: 10 Years On. Cell. 2018;174:1054–1066. doi: 10.1016/j.cell.2018.07.017. [DOI] [PubMed] [Google Scholar]
- 3.Halim TY, et al. Group 2 innate lymphoid cells license dendritic cells to potentiate memory TH2 cell responses. Nat Immunol. 2016;17:57–64. doi: 10.1038/ni.3294. [DOI] [PMC free article] [PubMed] [Google Scholar]
- 4.Oliphant CJ, et al. MHCII-mediated dialog between group 2 innate lymphoid cells and CD4(+) T cells potentiates type 2 immunity and promotes parasitic helminth expulsion. Immunity. 2014;41:283–295. doi: 10.1016/j.immuni.2014.06.016. [DOI] [PMC free article] [PubMed] [Google Scholar]
- 5.Petrie HT, Zuniga-Pflucker JC. Zoned out: functional mapping of stromal signaling microenvironments in the thymus. Annu Rev Immunol. 2007;25:649–679. doi: 10.1146/annurev.immunol.23.021704.115715. [DOI] [PubMed] [Google Scholar]
- 6.Porritt HE, et al. Heterogeneity among DN1 prothymocytes reveals multiple progenitors with different capacities to generate T cell and non-T cell lineages. Immunity. 2004;20:735–745. doi: 10.1016/j.immuni.2004.05.004. [DOI] [PubMed] [Google Scholar]
- 7.Wong SH, et al. Transcription factor RORalpha is critical for nuocyte development. Nat Immunol. 2012;13:229–236. doi: 10.1038/ni.2208. [DOI] [PMC free article] [PubMed] [Google Scholar]
- 8.Lu M, et al. The earliest thymic progenitors in adults are restricted to T, NK, and dendritic cell lineage and have a potential to form more diverse TCRbeta chains than fetal progenitors. J Immunol. 2005;175:5848–5856. doi: 10.4049/jimmunol.175.9.5848. [DOI] [PubMed] [Google Scholar]
- 9.Kernfeld EM, et al. A Single-Cell Transcriptomic Atlas of Thymus Organogenesis Resolves Cell Types and Developmental Maturation. Immunity. 2018;48:1258–1270. doi: 10.1016/j.immuni.2018.04.015. e1256. [DOI] [PMC free article] [PubMed] [Google Scholar]
- 10.Jones R, et al. Dynamic changes in intrathymic ILC populations during murine neonatal development. Eur J Immunol. 2018;48:1481–1491. doi: 10.1002/eji.201847511. [DOI] [PMC free article] [PubMed] [Google Scholar]
- 11.Schmitt TM, Ciofani M, Petrie HT, Zuniga-Pflucker JC. Maintenance of T cell specification and differentiation requires recurrent notch receptor-ligand interactions. J Exp Med. 2004;200:469–479. doi: 10.1084/jem.20040394. [DOI] [PMC free article] [PubMed] [Google Scholar]
- 12.Hosokawa H, Rothenberg EV. Cytokines, Transcription Factors, and the Initiation of T-Cell Development. Cold Spring Harb Perspect Biol. 2018;10:a028621. doi: 10.1101/cshperspect.a028621. [DOI] [PMC free article] [PubMed] [Google Scholar]
- 13.Koga S, et al. Peripheral PDGFRalpha(+)gp38(+) mesenchymal cells support the differentiation of fetal liver-derived ILC2. J Exp Med. 2018;215:1609–1626. doi: 10.1084/jem.20172310. [DOI] [PMC free article] [PubMed] [Google Scholar]
- 14.Miyazaki M, et al. The E-Id Protein Axis Specifies Adaptive Lymphoid Cell Identity and Suppresses Thymic Innate Lymphoid Cell Development. Immunity. 2017;46:818–834. doi: 10.1016/j.immuni.2017.04.022. e814. [DOI] [PMC free article] [PubMed] [Google Scholar]
- 15.Longabaugh WJR, et al. Bcl11b and combinatorial resolution of cell fate in the T-cell gene regulatory network. Proc Natl Acad Sci U S A. 2017;114:5800–5807. doi: 10.1073/pnas.1610617114. [DOI] [PMC free article] [PubMed] [Google Scholar]
- 16.Hosokawa H, et al. Bcl11b sets pro-T cell fate by site-specific cofactor recruitment and by repressing Id2 and Zbtb16. Nat Immunol. 2018;19:1427–1440. doi: 10.1038/s41590-018-0238-4. [DOI] [PMC free article] [PubMed] [Google Scholar]
- 17.Li L, Leid M, Rothenberg EV. An early T cell lineage commitment checkpoint dependent on the transcription factor Bcl11b. Science. 2010;329:89–93. doi: 10.1126/science.1188989. [DOI] [PMC free article] [PubMed] [Google Scholar]
- 18.Li P, et al. Reprogramming of T cells to natural killer-like cells upon Bcl11b deletion. Science. 2010;329:85–89. doi: 10.1126/science.1188063. [DOI] [PMC free article] [PubMed] [Google Scholar]
- 19.Moro K, et al. Innate production of T(H)2 cytokines by adipose tissue-associated c-Kit(+)Sca-1(+) lymphoid cells. Nature. 2010;463:540–544. doi: 10.1038/nature08636. [DOI] [PubMed] [Google Scholar]
- 20.Seillet C, et al. Nfil3 is required for the development of all innate lymphoid cell subsets. J Exp Med. 2014;211:1733–1740. doi: 10.1084/jem.20140145. [DOI] [PMC free article] [PubMed] [Google Scholar]
- 21.Walker JA, et al. Bcl11b is essential for group 2 innate lymphoid cell development. J Exp Med. 2015;212:875–882. doi: 10.1084/jem.20142224. [DOI] [PMC free article] [PubMed] [Google Scholar]
- 22.Hosokawa H, et al. Cell type-specific actions of Bcl11b in early T-lineage and group 2 innate lymphoid cells. J Exp Med. 2019;217:e20190972. doi: 10.1084/jem.20190972. [DOI] [PMC free article] [PubMed] [Google Scholar]
- 23.Walker JA, et al. Polychromic Reporter Mice Reveal Unappreciated Innate Lymphoid Cell Progenitor Heterogeneity and Elusive ILC3 Progenitors in Bone Marrow. Immunity. 2019;51:104–118. doi: 10.1016/j.immuni.2019.05.002. e107. [DOI] [PMC free article] [PubMed] [Google Scholar]
- 24.Sagar, et al. Deciphering the regulatory landscape of fetal and adult gammadelta T-cell development at single-cell resolution. EMBO J. 2020;39:e104159. doi: 10.15252/embj.2019104159. [DOI] [PMC free article] [PubMed] [Google Scholar]
- 25.Spidale NA, et al. Interleukin-17-Producing gammadelta T Cells Originate from SOX13(+) Progenitors that Are Independent of gammadeltaTCR Signaling. Immunity. 2018;49:857–872. doi: 10.1016/j.immuni.2018.09.010. e855. [DOI] [PMC free article] [PubMed] [Google Scholar]
- 26.Fiorini E, et al. Cutting edge: thymic crosstalk regulates delta-like 4 expression on cortical epithelial cells. J Immunol. 2008;181:8199–8203. doi: 10.4049/jimmunol.181.12.8199. [DOI] [PubMed] [Google Scholar]
- 27.Neill DR, et al. Nuocytes represent a new innate effector leukocyte that mediates type-2 immunity. Nature. 2010;464:1367–1370. doi: 10.1038/nature08900. [DOI] [PMC free article] [PubMed] [Google Scholar]
- 28.Halim TY, et al. Retinoic-acid-receptor-related orphan nuclear receptor alpha is required for natural helper cell development and allergic inflammation. Immunity. 2012;37:463–474. doi: 10.1016/j.immuni.2012.06.012. [DOI] [PubMed] [Google Scholar]
- 29.Schmitt TM, Zuniga-Pflucker JC. Induction of T cell development from hematopoietic progenitor cells by delta-like-1 in vitro. Immunity. 2002;17:749–756. doi: 10.1016/s1074-7613(02)00474-0. [DOI] [PubMed] [Google Scholar]
- 30.Yagi R, et al. The transcription factor GATA3 is critical for the development of all IL-7Ralpha-expressing innate lymphoid cells. Immunity. 2014;40:378–388. doi: 10.1016/j.immuni.2014.01.012. [DOI] [PMC free article] [PubMed] [Google Scholar]
- 31.Zhu J. T helper 2 (Th2) cell differentiation, type 2 innate lymphoid cell (ILC2) development and regulation of interleukin-4 (IL-4) and IL-13 production. Cytokine. 2015;75:14–24. doi: 10.1016/j.cyto.2015.05.010. [DOI] [PMC free article] [PubMed] [Google Scholar]
- 32.Li L, et al. A far downstream enhancer for murine Bcl11b controls its T-cell specific expression. Blood. 2013;122:902–911. doi: 10.1182/blood-2012-08-447839. [DOI] [PMC free article] [PubMed] [Google Scholar]
- 33.Gascoyne DM, et al. The basic leucine zipper transcription factor E4BP4 is essential for natural killer cell development. Nat Immunol. 2009;10:1118–1124. doi: 10.1038/ni.1787. [DOI] [PubMed] [Google Scholar]
- 34.Tang Y, et al. Emergence of NK-cell progenitors and functionally competent NK-cell lineage subsets in the early mouse embryo. Blood. 2012;120:63–75. doi: 10.1182/blood-2011-02-337980. [DOI] [PubMed] [Google Scholar]
- 35.Stenstad H, et al. Gut-associated lymphoid tissue-primed CD4+ T cells display CCR9-dependent and -independent homing to the small intestine. Blood. 2006;107:3447–3454. doi: 10.1182/blood-2005-07-2860. [DOI] [PubMed] [Google Scholar]
- 36.von Moltke J, Ji M, Liang HE, Locksley RM. Tuft-cell-derived IL-25 regulates an intestinal ILC2-epithelial response circuit. Nature. 2016;529:221–225. doi: 10.1038/nature16161. [DOI] [PMC free article] [PubMed] [Google Scholar]
- 37.Ikawa T, et al. An essential developmental checkpoint for production of the T cell lineage. Science. 2010;329:93–96. doi: 10.1126/science.1188995. [DOI] [PubMed] [Google Scholar]
- 38.Blackburn CC, Manley NR. Developing a new paradigm for thymus organogenesis. Nat Rev Immunol. 2004;4:278–289. doi: 10.1038/nri1331. [DOI] [PubMed] [Google Scholar]
- 39.Masuda K, et al. Notch activation in thymic epithelial cells induces development of thymic microenvironments. Mol Immunol. 2009;46:1756–1767. doi: 10.1016/j.molimm.2009.01.015. [DOI] [PubMed] [Google Scholar]
- 40.White AJ, et al. A type 2 cytokine axis for thymus emigration. J Exp Med. 2017;214:2205–2216. doi: 10.1084/jem.20170271. [DOI] [PMC free article] [PubMed] [Google Scholar]
- 41.Zhang JA, Mortazavi A, Williams BA, Wold BJ, Rothenberg EV. Dynamic transformations of genome-wide epigenetic marking and transcriptional control establish T cell identity. Cell. 2012;149:467–482. doi: 10.1016/j.cell.2012.01.056. [DOI] [PMC free article] [PubMed] [Google Scholar]
- 42.Barlow JL, et al. Innate IL-13-producing nuocytes arise during allergic lung inflammation and contribute to airways hyperreactivity. J Allergy Clin Immunol. 2012;129:191–198. doi: 10.1016/j.jaci.2011.09.041. e191-194. [DOI] [PubMed] [Google Scholar]
- 43.Fallon PG, et al. IL-4 induces characteristic Th2 responses even in the combined absence of IL-5, IL-9, and IL-13. Immunity. 2002;17:7–17. doi: 10.1016/s1074-7613(02)00332-1. [DOI] [PubMed] [Google Scholar]
- 44.Monticelli LA, et al. Arginase 1 is an innate lymphoid-cell-intrinsic metabolic checkpoint controlling type 2 inflammation. Nat Immunol. 2016;17:656–665. doi: 10.1038/ni.3421. [DOI] [PMC free article] [PubMed] [Google Scholar]
- 45.Taghon T, Yui MA, Rothenberg EV. Mast cell lineage diversion of T lineage precursors by the essential T cell transcription factor GATA-3. Nat Immunol. 2007;8:845–855. doi: 10.1038/ni1486. [DOI] [PMC free article] [PubMed] [Google Scholar]
- 46.Xu W, et al. E2A transcription factors limit expression of Gata3 to facilitate T lymphocyte lineage commitment. Blood. 2013;121:1534–1542. doi: 10.1182/blood-2012-08-449447. [DOI] [PMC free article] [PubMed] [Google Scholar]
- 47.Schwartz R, Engel I, Fallahi-Sichani M, Petrie HT, Murre C. Gene expression patterns define novel roles for E47 in cell cycle progression, cytokine-mediated signaling, and T lineage development. Proc Natl Acad Sci U S A. 2006;103:9976–9981. doi: 10.1073/pnas.0603728103. [DOI] [PMC free article] [PubMed] [Google Scholar]
- 48.Longabaugh WJ, Davidson EH, Bolouri H. Computational representation of developmental genetic regulatory networks. Dev Biol. 2005;283:1–16. doi: 10.1016/j.ydbio.2005.04.023. [DOI] [PubMed] [Google Scholar]
- 49.Schlenner SM, et al. Fate mapping reveals separate origins of T cells and myeloid lineages in the thymus. Immunity. 2010;32:426–436. doi: 10.1016/j.immuni.2010.03.005. [DOI] [PubMed] [Google Scholar]
- 50.Hardman CS, Panova V, McKenzie AN. IL-33 citrine reporter mice reveal the temporal and spatial expression of IL-33 during allergic lung inflammation. Eur J Immunol. 2013;43:488–498. doi: 10.1002/eji.201242863. [DOI] [PMC free article] [PubMed] [Google Scholar]
- 51.Chang HC, et al. Dissection of the human CD2 intracellular domain. Identification of a segment required for signal transduction and interleukin 2 production. J Exp Med. 1989;169:2073–2083. doi: 10.1084/jem.169.6.2073. [DOI] [PMC free article] [PubMed] [Google Scholar]
- 52.Baddeley A, Rubak E, Turner R. Spatial point patterns : methodology and applications with R. CRC Press, Taylor & Francis Group: Boca Raton; London ; New York: 2016. [Google Scholar]
- 53.Baddeley A, Turner R. spatstat: An R package for analyzing spatial point patterns. Journal of Statistical Software. 2005;12:1–42. [Google Scholar]
- 54.Anderson G, Jenkinson EJ. Fetal thymus organ culture. CSH Protoc. 2007;2007 doi: 10.1101/pdb.prot4808. pdb prot4808. [DOI] [PubMed] [Google Scholar]
- 55.Rana BMJ, et al. A stromal cell niche sustains ILC2-mediated type-2 conditioning in adipose tissue. J Exp Med. 2019;216:1999–2009. doi: 10.1084/jem.20190689. [DOI] [PMC free article] [PubMed] [Google Scholar]
- 56.Love MI, Huber W, Anders S. Moderated estimation of fold change and dispersion for RNA-seq data with DESeq2. Genome Biol. 2014;15:550. doi: 10.1186/s13059-014-0550-8. [DOI] [PMC free article] [PubMed] [Google Scholar]
- 57.Picelli S, et al. Full-length RNA-seq from single cells using Smart-seq2. Nat Protoc. 2014;9:171–181. doi: 10.1038/nprot.2014.006. [DOI] [PubMed] [Google Scholar]
- 58.Patro R, Duggal G, Love MI, Irizarry RA, Kingsford C. Salmon provides fast and bias-aware quantification of transcript expression. Nat Methods. 2017;14:417–419. doi: 10.1038/nmeth.4197. [DOI] [PMC free article] [PubMed] [Google Scholar]
- 59.McCarthy DJ, Campbell KR, Lun AT, Wills QF. Scater: pre-processing, quality control, normalization and visualization of single-cell RNA-seq data in R. Bioinformatics. 2017;33:1179–1186. doi: 10.1093/bioinformatics/btw777. [DOI] [PMC free article] [PubMed] [Google Scholar]
- 60.Lun AT, McCarthy DJ, Marioni JC. A step-by-step workflow for low-level analysis of single-cell RNA-seq data with Bioconductor. F1000Res. 2016;5:2122. doi: 10.12688/f1000research.9501.1. [DOI] [PMC free article] [PubMed] [Google Scholar]
- 61.Schmidl C, Rendeiro AF, Sheffield NC, Bock C. ChIPmentation: fast, robust, low-input ChIP-seq for histones and transcription factors. Nat Methods. 2015;12:963–965. doi: 10.1038/nmeth.3542. [DOI] [PMC free article] [PubMed] [Google Scholar]
- 62.Heinz S, et al. Simple combinations of lineage-determining transcription factors prime cis-regulatory elements required for macrophage and B cell identities. Mol Cell. 2010;38:576–589. doi: 10.1016/j.molcel.2010.05.004. [DOI] [PMC free article] [PubMed] [Google Scholar]
- 63.Sultana T, et al. The Landscape of L1 Retrotransposons in the Human Genome Is Shaped by Pre-insertion Sequence Biases and Postinsertion Selection. Mol Cell. 2019;74:555–570. doi: 10.1016/j.molcel.2019.02.036. e557. [DOI] [PubMed] [Google Scholar]
- 64.Buenrostro JD, Wu B, Chang HY, Greenleaf WJ. ATAC-seq: A Method for Assaying Chromatin Accessibility Genome-Wide. Curr Protoc Mol Biol. 2015;109 doi: 10.1002/0471142727.mb2129s109. 21 29 21-21 29 29. [DOI] [PMC free article] [PubMed] [Google Scholar]
- 65.Buenrostro JD, Giresi PG, Zaba LC, Chang HY, Greenleaf WJ. Transposition of native chromatin for fast and sensitive epigenomic profiling of open chromatin, DNA-binding proteins and nucleosome position. Nat Methods. 2013;10:1213–1218. doi: 10.1038/nmeth.2688. [DOI] [PMC free article] [PubMed] [Google Scholar]
Associated Data
This section collects any data citations, data availability statements, or supplementary materials included in this article.
Supplementary Materials
Data Availability Statement
All high-throughput data in this study were deposited at the Gene Expression Omnibus (GEO) under series GSE146745.


