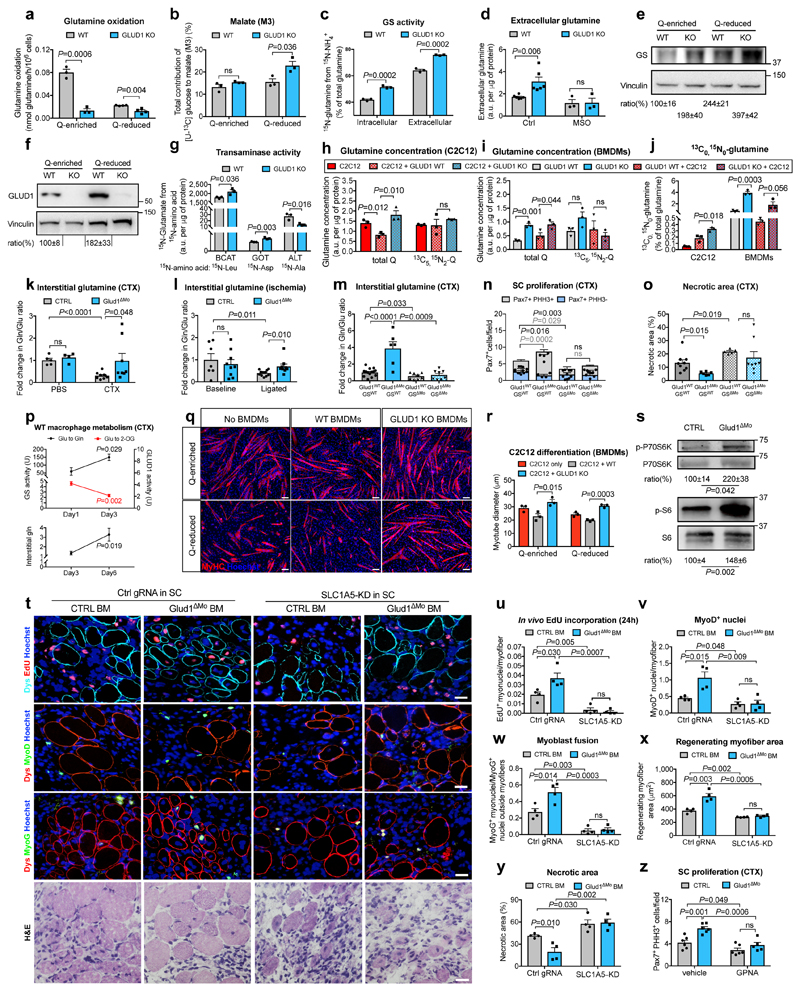
Figure 2. Uptake of macrophage-derived glutamine by SC boosts muscle regeneration.
a,b, Glutamine oxidation (n=3,4 WT,KO, respectively) (a), pyruvate-carboxylase activity (n=3) (b) in BMDMs under glutamine (Q)-enriched and Q-reduced conditions (n=4,3). c,d, Intra- and extracellular glutamine production (n=3) (c) and glutamine release under MSO-mediated GS inhibition (n=3) (d) in Q-starved BMDMs. e,f, WB and densitometry for GS (e) and GLUD1 (f) in BMDMs. g, BCAT, GOT, ALT activities in Q-starved BMDMs (n=3). h-j, Total glutamine, [13C5 15N2]-glutamine, [13C0 15N0]-glutamine in C2C12 cells (h,j) and BMDMs (i,j), seeded alone or co-cultured in [13C5,15N2]-glutamine-containing medium (n=3). k,l, Interstitial glutamine 1 day post-CTX (Baseline,B. n=5,4 CTRL,Glud1ΔMo, respectively; CTX n=9,8) (k) or 3 days post-ligation (B. n=7,9; ischemia n=12) (I), m-o, Interstitial glutamine and SC proliferation 1 day post-CTX (m,n), necrosis 6 days post-CTX (o) upon macrophagic GS deletion (Glud1WTGSWT n=14,6,9 in m, n, o, respectively; Glud1ΔMoGSWT n=6,4,6; Glud1WTGSΔMo n=8,5,5; Glud1ΔMoGSΔMo n=8,5,8). p, Glutamate-to-2-OG (GLUD1 activity) and glutamate-to-glutamine (GS activity) conversion in muscle-infiltrating WT macrophages (upper panel) and interstitial glutamine in WT muscles (lower panel) (n=4). q,r, C2C12 myotubes in co-culture with BMDMs (n=3). s, WB and densitometry for phospho-P70S6K (1 day post-CTX) and phospho-S6 (3 days post-CTX) in isolated SC. t-y, Micrographs (t) and quantifications (n=4) of EdU+ myonuclei (u), MyoD+ nuclei (v), myoblast fusion (w), regenerating myofiber area (x), necrosis (y) 6-day post-CTX in mice reconstituted with GLUD1-WT (CTRL BM) or GLUD1-KO (Glud1ΔMo) bone marrows (BM), and knocked-down (KD) or not (Ctrl gRNA) for SLC1A5 in SC. z, PHH3+ SC 1 day post-CTX after GPNA-mediated SLC1A5 inhibition (n=6,6,6,5 from right to left). A representative (a-d,g-j,p-r,t-z) or a pool (e,f,k-o,s) of at least two independent experiments is shown. Unpaired two-tailed t-test everywhere applied; ns, not significant; a.u., arbitrary units. Bars: 20 μm (t), 50 μm (q). Graphs: mean ± SEM.

