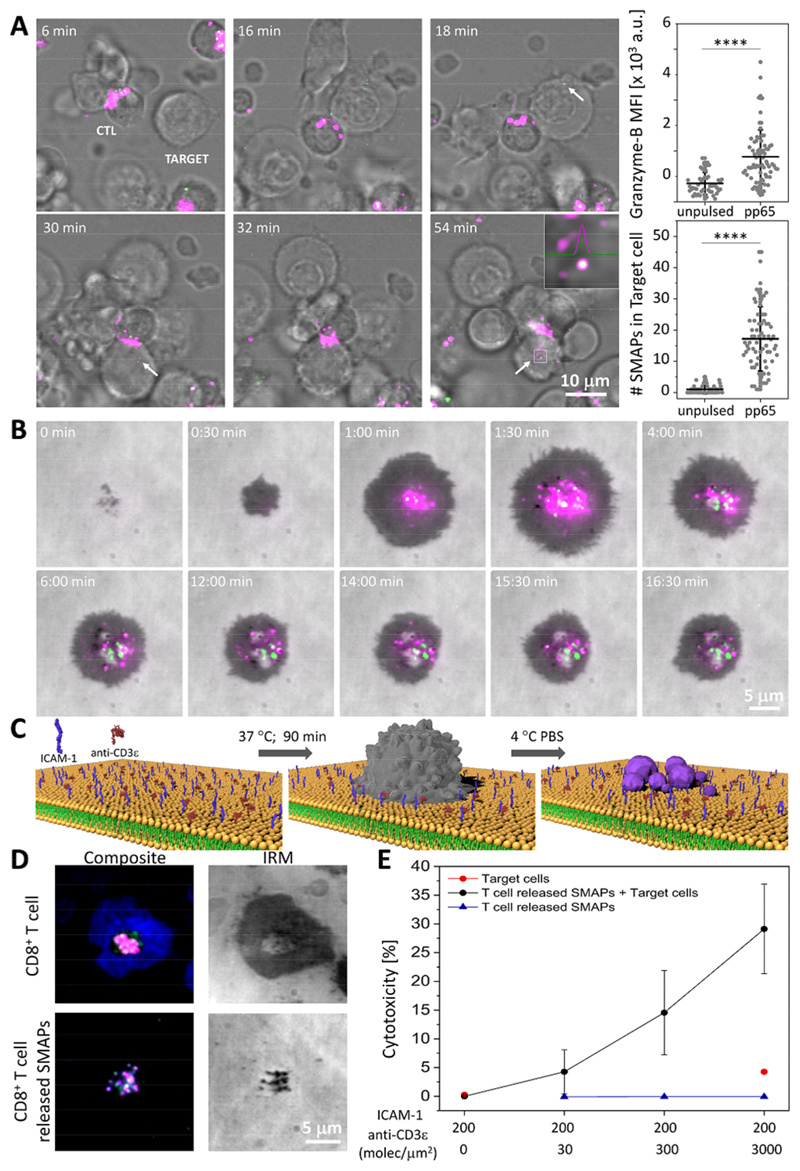
Fig. 1. SMAPs were released at the IS and displayed autonomous cytotoxicity.
(A) Time-lapse confocal images depicting the transfer of Gzmb-mCherry+ (green) and WGA (magenta) labeled SMAPs from an antigen-specific CTL clone into pp65-pulsed JY target cells (Target). Arrows and inset indicate the presence of SMAPs inside the target. Scale bar, 10 μm. Quantification of Gzmb mean fluorescence intensity (MFI) and number of double-positive particles inside the target cell in CTL conjugates with unpulsed or pulsed target cells. Each dot represents one target cell (< 50 cells). Horizontal lines and error bars represent mean ± SD from 2 independent experiments. ****, p < 0.0001 (B) Live cell imaging of SMAPs release by CD8+ T-cells transfected with Gzmb-mCherry-SEpHluorin (magenta/green) on activating SLB. IRM, interference reflection microscopy. Scale bar, 5 μm. (C) Schematic of the working model for capturing SMAPs released by activated CD8+ T-cells. CD8+ T-cells (grey) were incubated on SLB presenting activating ligands for the indicated time. Cells were removed with cold PBS leaving the released SMAPs (purple) on the SLB. Elements are not drawn to scale. (D) TIRFM images of CD8+ T-cells incubated on activating SLB in the presence of anti-Prf1 (green) and anti-Gzmb (magenta) antibodies (top panels). After cell removal, Prf1+ and Gzmb+ SMAPs remained on the SLB (bottom panels). The formation of a mature IS is indicated by an ICAM-1 ring (blue). IRM, interference reflection microscopy. Scale bar, 5 μm. (E) Target cell cytotoxicity induced by density-dependent release of SMAPs captured on SLB measured by LDH release assay. Data points and error bars represent mean ± SEM from 3 independent experiments.

