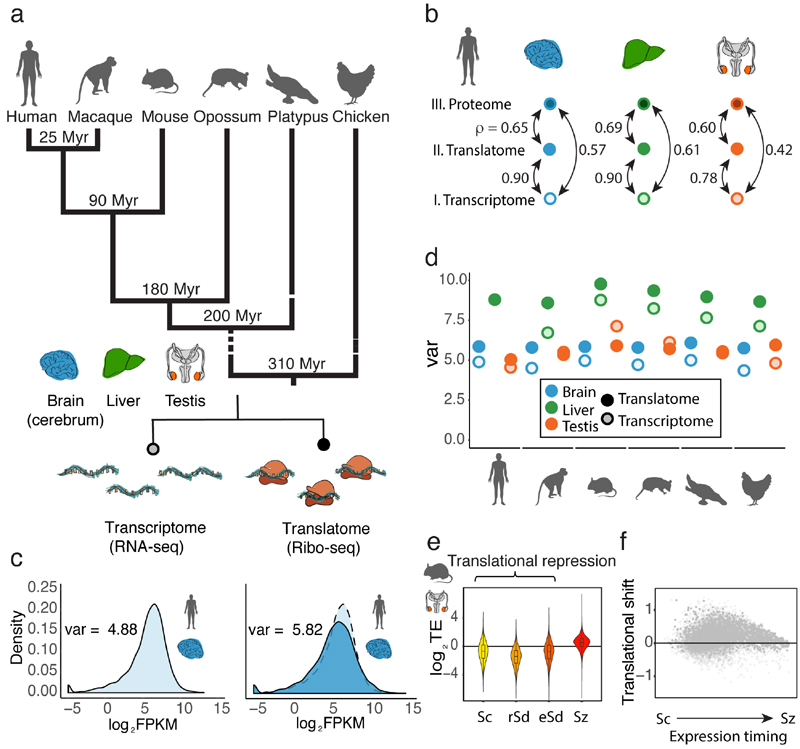
Fig. 1. Regulatory dynamics across expression layers.
a, Overview of data produced. b, Pairwise correlations (Spearman’s ρ) between transcriptomes, translatomes, and proteomes (data from ref. 22) were calculated for 9,642 genes, detected at all three expression layers in human brain, liver, and testis. c, Distribution of expression levels at the translatome layer (dark blue, measured based on Ribo-seq), compared to the transcriptome layer (light blue, measured based on RNA-seq). d, The expression variation, quantified as the variance (var) across genes of log2(FPKM+1)-transformed expression values, is calculated for expression levels at the translatome (dark colors) and transcriptome (light colors) layers. e, TE (normalized log2-transformed values) along mouse spermatogenesis was calculated for 14,979 genes detected (FPKM > 0) across all 4 stages (Sc, spermatocytes, rSd, round spermatids, eSd, elongating/elongated spermatids, Sz, spermatozoa). The zero line corresponds to the median TE of genes inferred to be expressed predominantly in somatic cells. f, Translational shift (delay) for each gene, calculated as the difference between the centers of mass for the transcriptome and translatome layers along spermatogenesis. Organ and species icons were previously used in ref. 25.

