Abstract
Mammalian brains feature exceptionally high levels of non-CpG DNA methylation alongside the canonical form of CpG methylation. Non-CpG methylation plays a critical regulatory role in cognitive function, which is mediated by the binding of MeCP2, the transcriptional regulator that when mutated causes Rett Syndrome. However, it is unclear if the non-CpG neural methylation system is restricted to mammalian species with complex cognitive abilities or has deeper evolutionary origins. To test this, we investigated brain DNA methylation across 12 distant animal lineages, revealing that non-CpG methylation is restricted to vertebrates. We discovered that in vertebrates, non-CpG methylation is enriched within a highly conserved set of developmental genes transcriptionally repressed in adult brains, indicating that it demarcates a deeply conserved regulatory program. Concomitantly, we found that the writer of non-CpG methylation, DNMT3A, and the reader, MeCP2, originated at the onset of vertebrates as a result of the ancestral vertebrate whole genome duplication. Together, we demonstrate how this novel layer of epigenetic information assembled at the root of vertebrates and gained new regulatory roles independent of the ancestral form of the canonical CpG methylation. This suggests the emergence of non-CpG methylation may have fostered the evolution of sophisticated cognitive abilities found in the vertebrate lineage.
Introduction
Cytosine DNA methylation (mC) is the most abundant base modification in animal genomes1,2. In vertebrates, most of the CpG dinucleotides (> 80%) in the genome are methylated3. In contrast, most invertebrates show sparse methylation, where most CpG methylation accumulates on transcribed gene bodies4,5. However, cytosine methylation can also occur in the CpH (where H is C, A, or T) dinucleotide context. In mammals, CpH methylation is mostly restricted to a few tissues and cell types6, such as embryonic stem cells, neurons, and muscle. Embryonic stem cells display CpH methylation enriched on transcribed gene bodies, while neural tissues accumulate high levels of CpH methylation on transcriptionally silent genes7–12. CpH methylation is deposited de novo by the DNMT3A or DNMT3B methyltransferases, and unlike CpG methylation, is not maintained after genome replication by the DNA methyltransferase DNMT111. Thus, post-mitotic neurons can accumulate CpH methylation since they do not undergo genome replication. In contrast to CpG methylation, CpH methylation is accumulated in the brain after birth, coinciding with synaptogenesis and synaptic pruning7,13. Furthermore, CpH methylation shows cell-type specific patterns in distinct neurons and glia7,8,14, and is the most abundant form of DNA methylation in neurons. Most importantly, CpH methylation is bound by MeCP2, a highly expressed transcriptional regulator that can cause Rett syndrome, a strong autistic phenotype, when mutated15,16. Similarly, mutations in DNMT3A and abnormal cytosine methylation are also linked to neurological diseases17. Therefore, the role of DNA methylation and CpH methylation in neural maturation and cognitive functions is well established in mammals. To date, CpH methylation has been observed in the brain of human, mouse, and a songbird7,18,19, thus the roles of this unique epigenomic feature could potentially be linked to complex brain functions. However, neither the evolutionary origin of CpH methylation nor the molecular basis that allowed the emergence of this new methylation context to appear has so far been unraveled.
The morphology of the vertebrate brain is highly conserved, with a tripartite organization that is found from lampreys to mammals20. However, the homology between the vertebrate brain and that of distantly related invertebrates remains uncertain21,22. Notwithstanding this, all animal brains are mainly composed of neurons and glia, ectodermal-derived neural cell types that have deep evolutionary roots23. Thus, to understand the evolution of neural CpG and CpH methylation and its relationship to cognitive complexity, here we study the evolution of neural methylation within and outside the vertebrate lineage.
Results
Brain CpG methylation recapitulates differences between vertebrates and invertebrates
To investigate the evolution of neural DNA methylation, we gathered forebrain samples from representative species of major vertebrate lineages. We generated whole genome bisulfite sequencing (WGBS) data from adult forebrain regions for six vertebrate species (Fig. 1a), including opossum, platypus, chicken, zebrafish, elephant shark and arctic lamprey, and we reanalysed previously published datasets from another four7,18,24. For invertebrates, we generated new data for two lineages with highly complex brains and behaviours. As representatives of insects, we generated WGBS data for honeybee whole brains from a queen. As a cephalopod representative, we obtained material from the California two-spot octopus, for which we sampled and performed WGBS for both the supraesophageal and the subesophageal brains. As an out-group to vertebrates, we generated new data for neural tube material from the European amphioxus. The anterior neural tube is homologous to and shares many epigenomic similarities with the vertebrate brain25,26. Therefore, this dataset comprises the broadest assessment of adult neural DNA methylation to date, encompassing major animal phyla with highly complex brains.
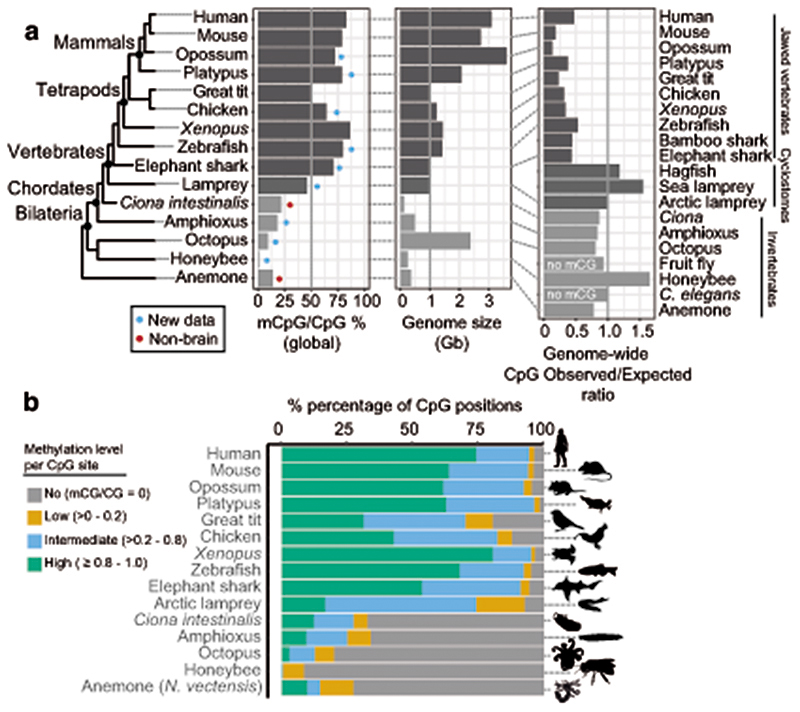
Fig. 1. Brain methylomes reflect the vertebrate-invertebrate CG methylation boundary.
a, Global brain CpG methylation, genome size, and CpG genome content across animal species. Schematic representation of established animal phylogeny on the left-hand side. Newly generated WGBS datasets marked with a blue circle, WGBS samples from non-neural tissue marked with a red circle. The Ciona intestinalis sample corresponds to muscle tissue73, and sea anemone Nematostella vectensis sample corresponds to a gastrula sample64. Genome size represents the genome assembly size. b, Proportion of CpG sites classified according to methylation levels (mC/C). Only sites with coverage ≥ 10x were considered. Silhouettes of human, platypus, octopus and honeybee obtained from phylopic.org.
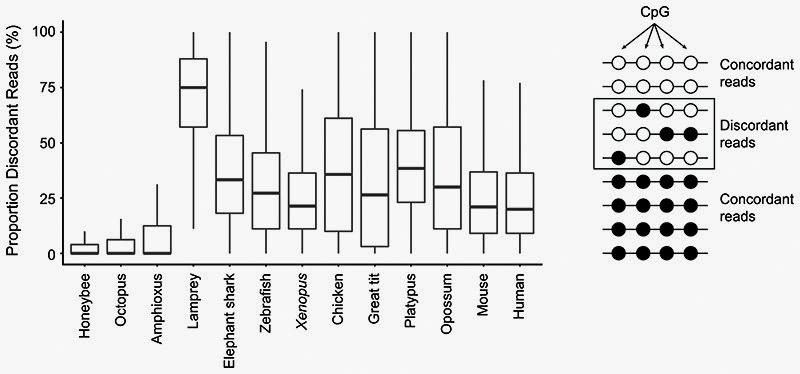
To understand major differences in methylation across species, we first analysed CpG methylation, since it is the preferred context for animal DNA methyltransferases27. As previously reported, vertebrates show higher CpG methylation levels than invertebrates (Fig. 1a)1,4. The high global levels of CpG methylation in vertebrate genomes have been proposed to correlate with the size of the genome or its high level of repetitive content4,28. However, the octopus genome is larger and has comparable repeat content to some vertebrate species29. Still, the octopus genome shows typical invertebrate global methylation levels (~10% mCpG/CpG) and most CpGs in the genome are unmethylated (Fig. 1a,b), thus contradicting previous hypotheses regarding the evolutionary origin of hypermethylation in vertebrates. Additionally, hypermethylation (global mCpG/CpG > 70%) is not found in all vertebrate samples. The arctic lamprey and both bird species show lower levels of global methylation than other vertebrate species (Fig. 1a). These vertebrate lower global methylation levels are explained by an overwhelming majority of intermediately methylated CpG positions (Fig. 1b). Intermediate methylation observed in the arctic lamprey brain coincides with previous observations from sperm, muscle and heart methylation levels in another species of lamprey30. Interestingly, intermediate methylation levels correspond to very heterogeneous methylation at the read level, suggesting noisy inheritance of methylation after cell division (Extended Data 1). Given the phylogenetic position of lampreys, the intermediate methylation levels in this lineage might represent a middle step in the transition between the mosaic methylomes of invertebrates to the fully methylated genomes of jawed vertebrates30. However, avian intermediate methylomes represent a secondary reduction since all earlier splitting lineages show hypermethylation. The evolutionary causes of such reduction in methylation are unclear, since genome size does not explain methylation levels, even within vertebrates, given that elephant shark has higher methylation and a smaller genome than birds (Fig. 1a). Surprisingly, lampreys and other cyclostomes have genomes enriched in CpG dinucleotides, unlike any other vertebrate (Fig. 1a, Extended Data 2). In sum, the CpG methylation landscape in the brain reflects known differences between vertebrate and invertebrate genomes, yet challenges prior assumptions about the evolution of hypermethylation in vertebrates.
Lamprey genomes are not affected by methyl-CpG hypermutability
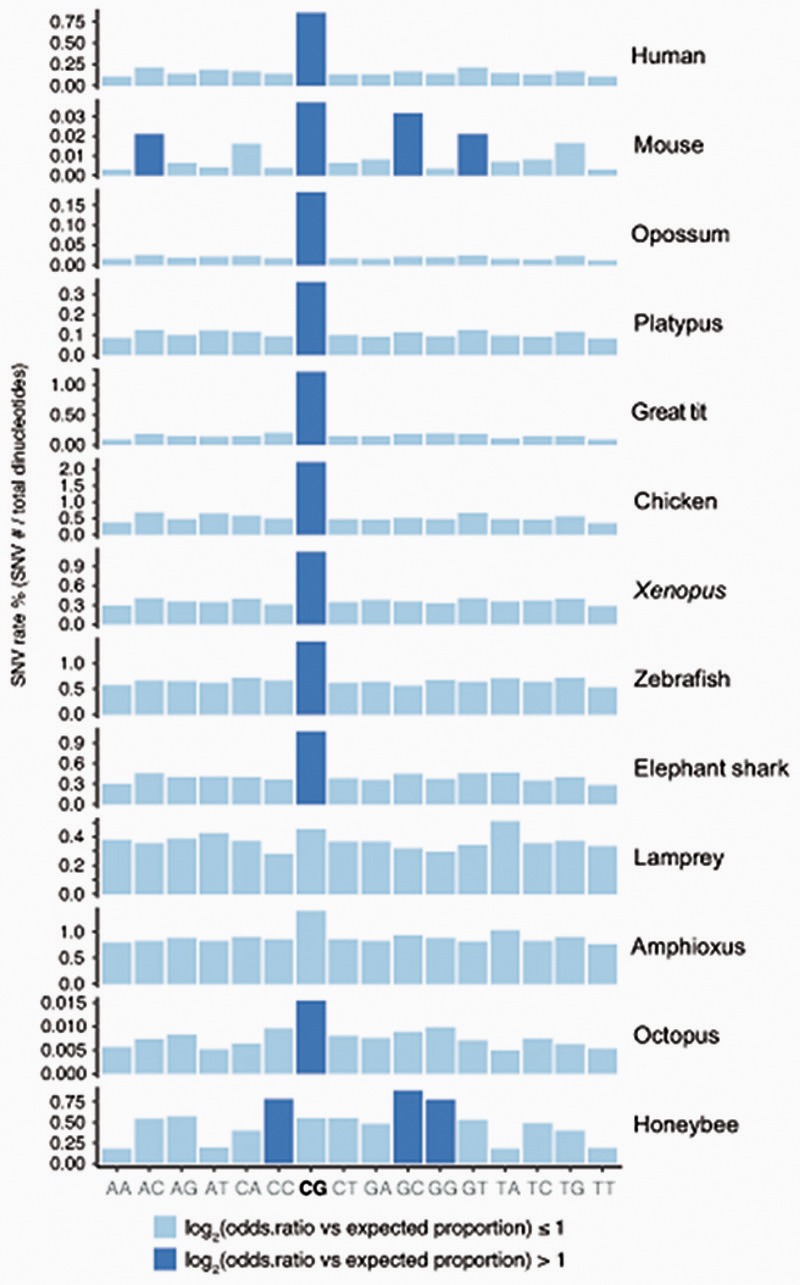
Methylated cytosines are known to be prone to deaminate into thymines31. This tendency towards deamination makes CpG sites hotspots of mutability and genetic variation32. Furthermore, methylated CpG mutability is believed to be responsible for the global depletion of CpG sites in vertebrate genomes1,4. To explore these observations, we first gathered global CpG dinucleotide content in the sampled species (Figure 1a). Whereas all jawed vertebrates show strong depletions of CpG dinucleotides, lampreys and other cyclostomes do not show such depletions. In fact, the ratio of CpG dinucleotides in lamprey genomes is similar to that of species that lack cytosine DNA methylation (Figure 1a). To further investigate this anomaly, we used WGBS data to identify Single Nucleotide Variants (SNV) in all sampled species (Extended Data 2). All jawed vertebrates showed a higher frequency of variants at CpG dinucleotides with respect to other dinucleotides. However, the arctic lamprey did not show such an enrichment. The intermediate methylation levels found in lamprey genomes could explain why CpG dinucleotides are not disproportionately affected by mutagenesis and depleted as seen in other vertebrate lineages. However, avian genomes also have intermediate methylation levels and still show archetypal global CpG depletion and disproportionate variants on CpG sites. Therefore, how lampreys avoid or compensate for methylation-derived mutagenesis remains unclear, yet could be linked to somatic DNA elimination in this lineage33.
Brain CpH methylation is restricted to vertebrates
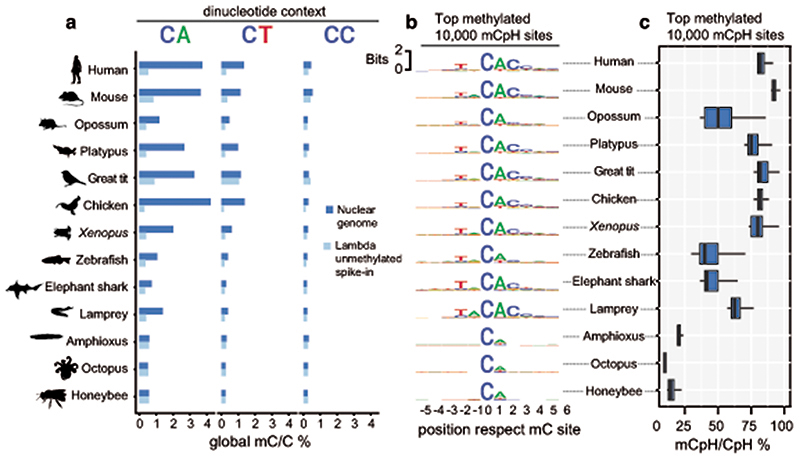
To avoid methylation mutability confounding our measurements of CpH methylation, we first discarded all CpH positions that showed evidence of being CpG dinucleotide variants in the sequenced WGBS reads. We then measured global genomic methylation levels at CpA, CpT and CpC dinucleotides for each species and compared these to the bisulfite non-conversion rates in the unmethylated lambda DNA spike in control for each WGBS experiment (Fig. 2a). All vertebrates showed CpA and CpT global methylation above non-conversion levels, whereas invertebrates did not. As previously reported in mammals, CpA is the preferred context for non-CpG methylation in all vertebrates, while CpC is rarely methylated7,34. We next interrogated whether there is a wider sequence context in which CpH methylation gets preferentially deposited, as it occurs in mammals7,35. We gathered the neighbouring positions from the 10,000 most highly methylated CpH sites in each species, finding that the trinucleotide CAC and additional bases conform to an overrepresented motif conserved across vertebrates (Fig. 2b). The flanking bases surrounding the CpH sites coincide with the flanking sequence preference reported for DNMT3A36. This CpH flanking motif was not detectable in non-neural samples for elephant shark, zebrafish or Xenopus, confirming that mCpH is not a bisulfite sequencing bias and mCpH neural specificity extends beyond mammals (Extended Data 3). Similarly, the CpH flanking motif was not detectable in invertebrates (Fig. 2b). Furthermore, methylation levels on the highest methylated CpH sites were lower in amphioxus, honeybee, and octopus (mC/C < 20%) compared to any vertebrate brain (Fig. 2c). Thus, invertebrate CpH methylation is likely to be a rare off-target consequence of DNMT activity. In contrast, the robust mammalian neural CpH methylation levels are conserved across the vertebrate lineage.
Fig. 2. Neural CpH methylation is restricted to vertebrate brains.
a, Global methylation levels in brain samples classified per dinucleotide context. Dark blue represents the global methylation level on the nuclear chromosomes (excluding mitochondrial genome) and pale blue represents the bisulfite reaction non-conversion rate for each library, calculated as the methylation levels on an unmethylated lambda phage DNA spike-in. b, Sequence motifs found surrounding the most highly methylated CpH positions in each brain sample. Only CpH positions with coverage ≥ 10x were considered. c, Methylation level (mC/C) for the top mCpH positions depicted in panel b. Boxplot centre lines are medians, box limits are quartiles 1 (Q1) and 3 (Q3), whiskers are 1.5 × interquartile range (IQR). Silhouettes of human, platypus, octopus and honeybee obtained from phylopic.org.
CpH methylation is functionally decoupled from CpG methylation across vertebrates
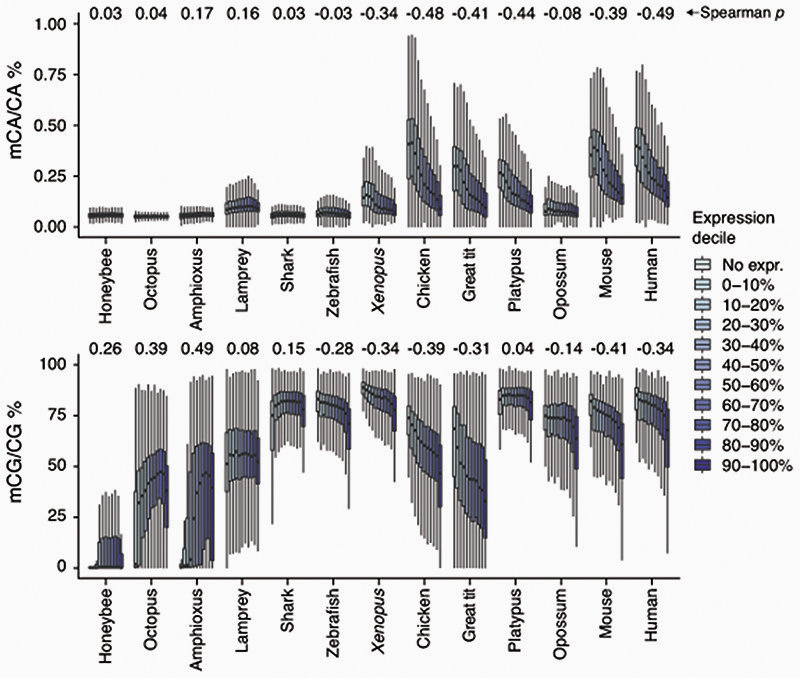
In mammalian brains, CpH methylation deposition does not fully recapitulate CpG methylation6,7. While CpG methylation is found on transcribed and silent gene bodies alike, CpH methylation is depleted on transcriptionally active gene bodies in neurons. To test whether brain CpH methylation anti-correlates with transcription, we classified genes in deciles of expression for each species and assessed the corresponding gene body CpG and CpA methylation levels (Extended Data 4). A clear anti-correlation pattern between transcription and CpA methylation was observed for mammals, birds and the frog (Spearman’s r). However, this anti-correlation was not evident in opossum, zebrafish, elephant shark and lamprey. This lack of anti-correlation in these species might respond to different cell-type compositions biasing the measurements. The proportion of neurons versus glia depends on the exact brain region and varies in a species-specific manner37, and species with smaller brains might display higher cell-type heterogeneity in similarly sized samples, as for instance birds have higher neuron densities than mammals38. In fact, all four species not showing CpA methylation anti-correlation with transcription show lower levels of CpH methylation on the highest methylated CpH sites (Fig. 2C), which suggests a lower ratio of neurons to glia. Another possible explanation is that the anti-correlation with transcription evolved in tetrapods, and was secondarily lost in opossum. In contrast, CpG methylation also shows some degree of anti-correlation with expression levels in most vertebrate brain samples, whereas invertebrates show the typical positive correlation between CpG methylation and transcription.
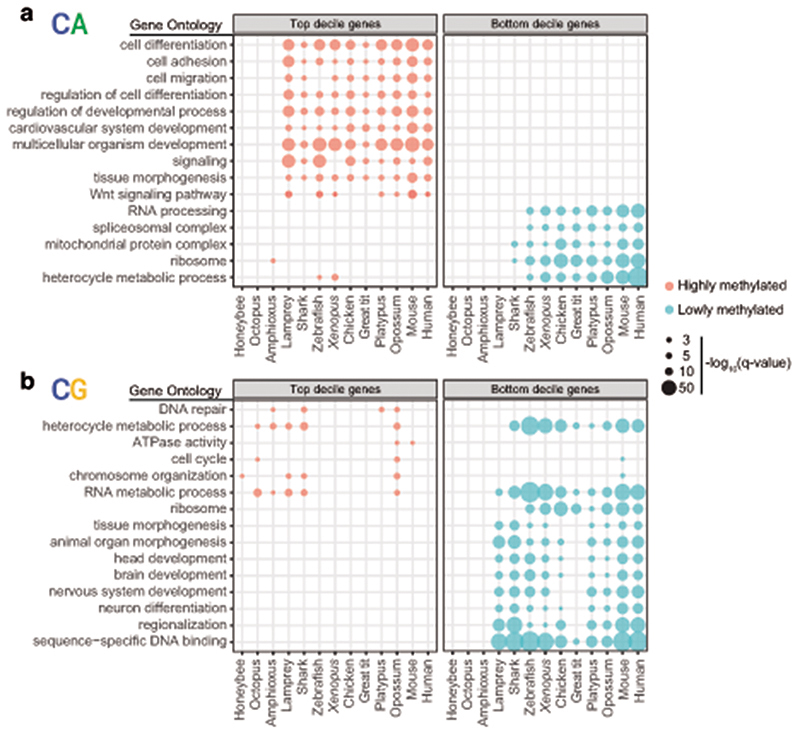
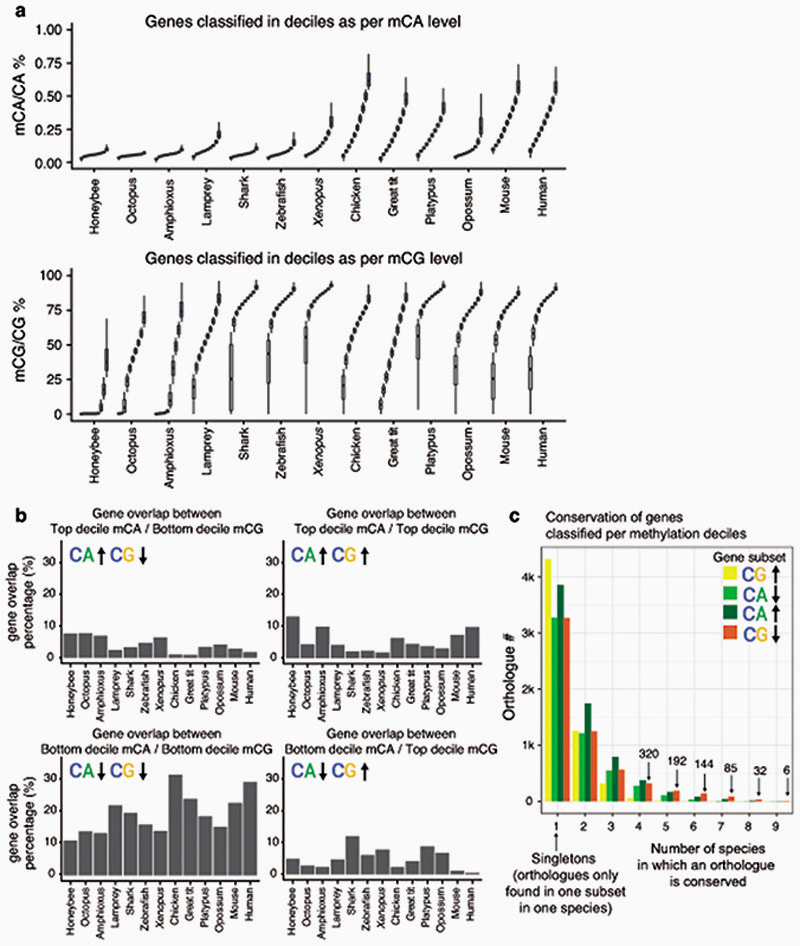
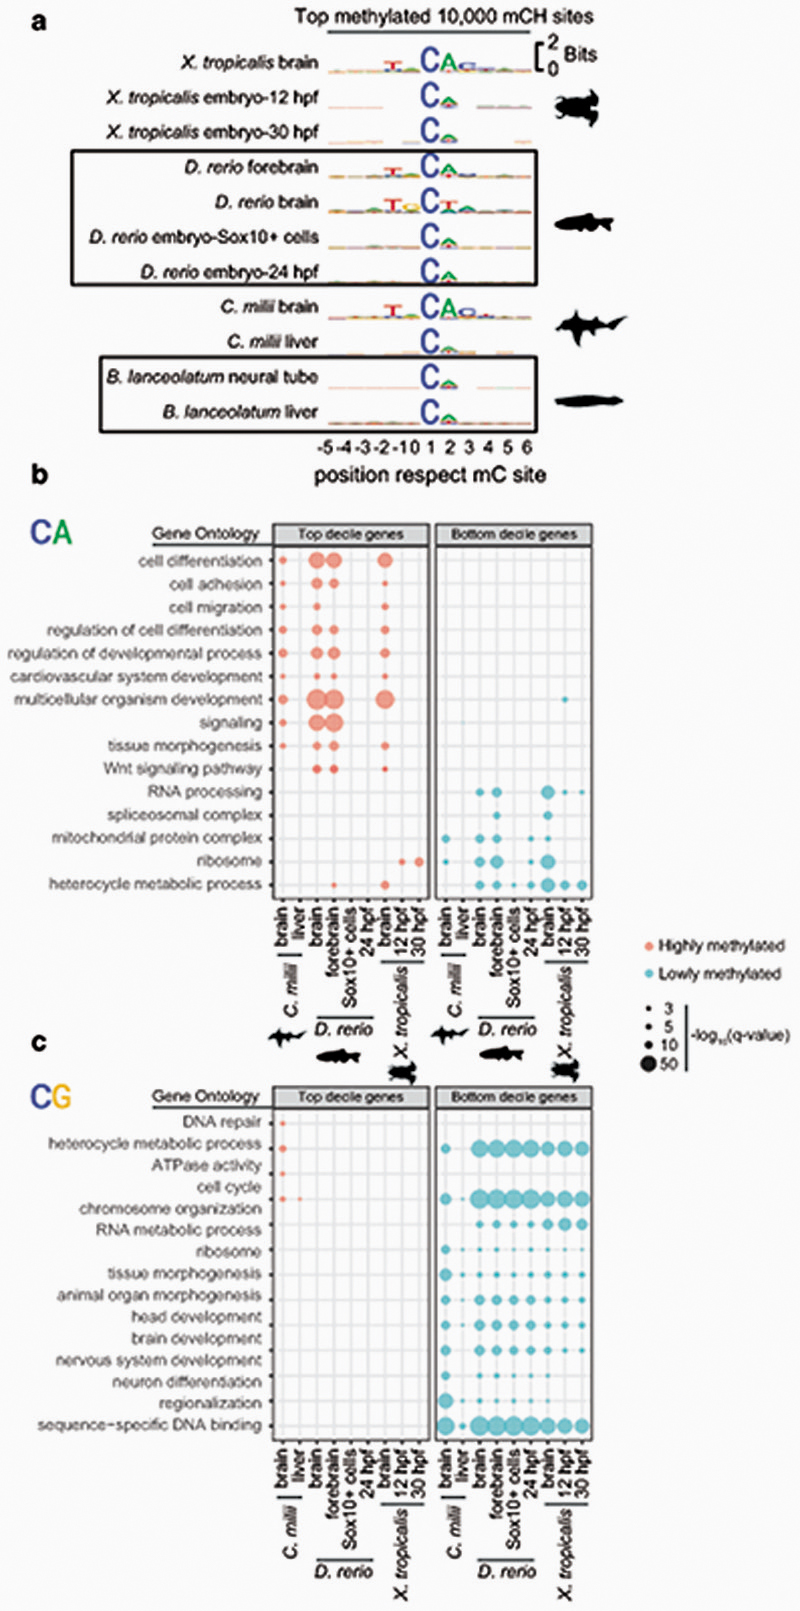
Despite the existence of differences in cell type composition across the brains of different species, we reasoned that common methylation patterns should be observable across species if similar pathways are regulated in a similar manner across most neural cells. In fact, distinct brain regions show similar CpH methylation patterns in mammals39. Consistently, transcriptional and enhancer landscapes at the organ and tissue level are conserved across vertebrates40,41. To test if methylation patterns are conserved, we classified all genes in each species into 10 deciles based on the weighted average of CpG and CpA methylation along the gene body (Extended Data 5). For each hypermethylated and hypomethylated gene subset (top and bottom decile), we obtained Gene Ontology (GO) enrichments (Fig. 3, Supplementary Table 1). Hypomethylated genes in the CpG context largely represent developmental genes, predominantly transcription factors. Such genes are found in methylation canyons or valleys, where lack of methylation in the gene body and surrounding regions is mediated by histone modifications such as H3K27me3 and H3K4me342,43. These same GOs appear enriched in non-brain samples, suggesting that CpG methylation valleys are shared across tissues (Extended Data 3). In contrast, highly methylated genes in the CpG context did not show deeply conserved GO patterns, and the few GOs that appear in more than one species have housekeeping functions. On the contrary, hypermethylated genes in the CpA context belong to developmental functions across all vertebrates (Fig. 3), and many are related to signaling pathways, cell adhesion, or cell differentiation. On the other hand, genes with the lowest levels of CpA methylation have housekeeping functions. Unlike with CpG methylation, non-brain samples do not recapitulate any of these CpA enrichments (Extended Data 3). However, CpA and CpG methylation patterns are not completely unlinked, since there is a high degree of overlap between genes found in both the lowly methylated categories (Extended Data 5), which suggests that methylation protection on hypomethylated genes occurs through restricting access of DNA methyltransferases44,45. However, the developmental genes that are CpG hypomethylated and CpA hypermethylated show very little overlap, which is indicative of differential removal or deposition of methylated cytosines occurring in these regions. Invertebrates do not exhibit conservation of these patterns. Surprisingly, birds show higher conservation of GOs for genes methylated in the CpA context than for the CpG context (Fig. 3), suggesting that CpG methylation state is not maintained yet CpA methylation is deposited in a conserved set of genes.
Fig. 3. Conserved non-overlapping programs are associated with CpH and CpG methylation.
a, Gene Ontology enrichments for genes showing the highest and lowest gene body methylation levels in the CpA context, as defined by belonging to the top and bottom deciles in each species. b, Gene Ontology enrichments for genes showing the highest and lowest methylated levels in the CpG context. Q-values were obtained using the g:SCS algorithm implemented in the gProfiler2 R package.
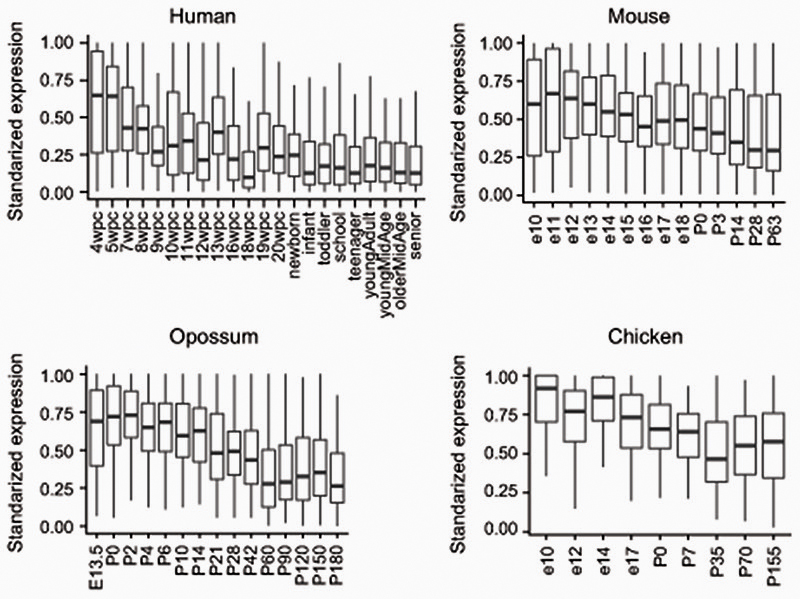
To corroborate the functional patterns gathered by GO analysis, we measured the CpG and CpA methylation levels of genes classified by gene family or function. Methylation levels on transcription factors, signaling molecules, synaptic genes and ribosomal proteins (Supplementary Fig. 1), showed overall consistent patterns with the GO analysis approach. Among the orthologues found in the highly methylated CpA category across species (≥7 species, Supplementary Table 2) there are signaling molecules (WNT16, BMP7) and transcription factors (FOXP2, EOMES/TBR2, GLI3, PROX1, SOX6, SALL1) that have been previously shown to be involved in neural progenitor cell maintenance and differentiation. Furthermore, these sets of conserved CpA methylated genes show declining gene expression in adult stages in the brains of mammals and birds compared to earlier developmental stages (Extended Data 6). Therefore, CpA methylation accumulates on a conserved subset of developmental genes across the vertebrate lineage, likely marking and contributing to silencing genes no longer required in the fully developed adult brain.
DNMT3A is the ancestral writer of neural CpH methylation in vertebrates
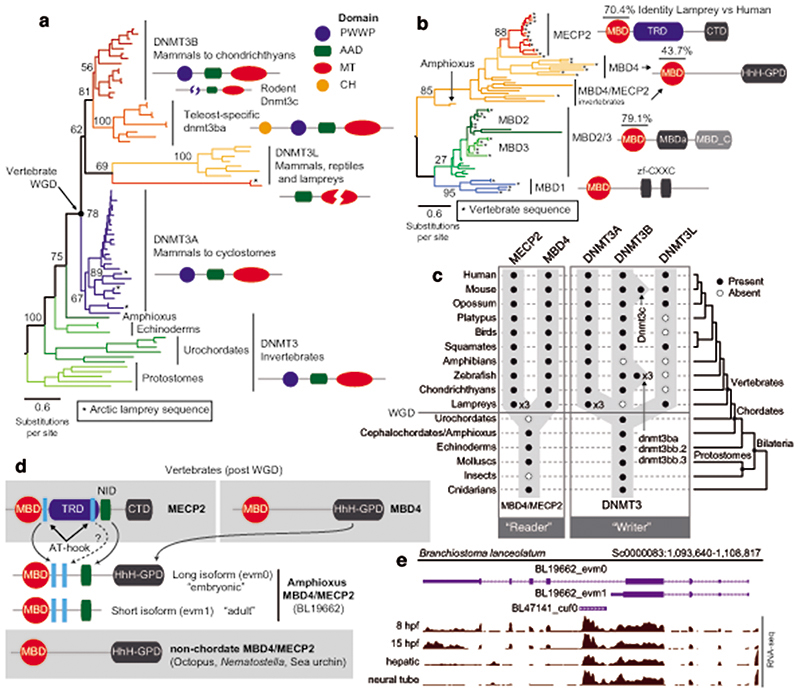
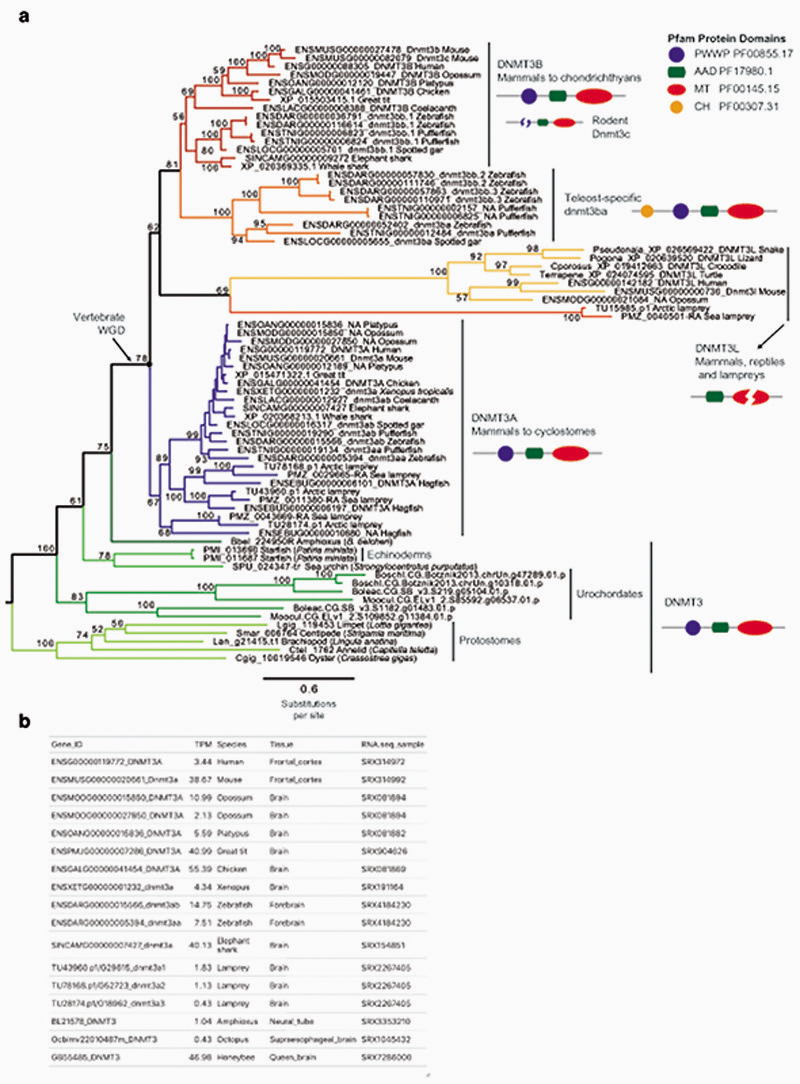
Given that the establishment of CpH methylation coincided with the origin of vertebrates, a new “writer” able to deposit CpH methylation should have also evolved concomitantly. In mammals DNMT3A is responsible for neural CpH methylation10,13, whereas CpH methylation in stem cells is mediated by DNMT3B46. To gain an evolutionary perspective on the distribution and origin of these genes, we performed a phylogenetic analysis of DNMT3 enzymes in animals (Fig. 4a, Extended Data 7). While invertebrate genomes typically contain a single DNMT3 gene, DNMT3A and DNMT3B evolved at the root of vertebrates. DNMT3A and DNMT3B are located in syntenic regions (Supplementary Fig. 2), confirming that they represent ohnologues: the paralogues product of the ancestral two rounds of whole genome duplication (WGD) in vertebrates, as previously reported47,48. More unexpectedly, we found that DNMT3L, a degenerate paralogue with non-catalytic methyltransferase domain49, is present in two lamprey genomes and non-avian reptiles, suggesting it might be the third ohnologue derived from the WGD (Fig. 4a, Extended Data 7). However, not all DNMT3 ohnologues are widely retained across vertebrates; lampreys and amphibians do not encode a DNMT3B copy (Fig. 4c). Given that both species have neural CpH methylation, only DNMT3A orthologues can have a role as writers of CpH methylation in these species. This, in turn, would support an ancestral role of DNMT3A in neural CpH methylation. Consistently, zebrafish DNMT3A orthologues have been shown to be expressed in brain tissues50, and we detect DNMT3A transcripts in all vertebrate brain samples (Extended Data 7). Furthermore, the differential deposition patterns of CpH methylation in neural and stem cells seems to have been mediated by changes in the PWWP domain in DNMT3A and DNMT3B ohnologues after gene duplication (Supplementary Fig. 3). In summary, phylogeny and distribution of DNMT3 paralogues suggests that DNMT3A was the ancestral “writer” of neural CpH methylation in vertebrates.
Fig. 4. Vertebrate origins of MECP2 and DNMT3A.
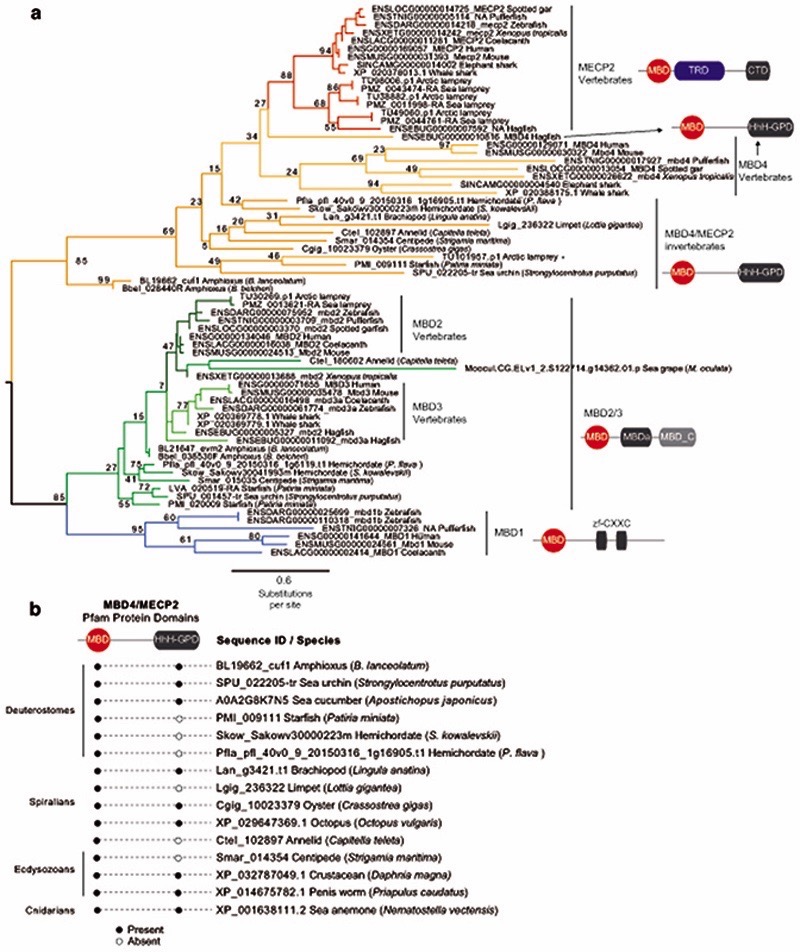
a, Maximum likelihood phylogenetic tree of DNMT3 genes in animals. Nodal supports represent 100 bootstrap nonparametric replications. Schematic protein domain configurations shown for each clade. PWWP, Pro-Trp-Trp-Pro motif domain (PF00855). AAD ATRX, DNMT3, DNMT3L domain. MT, cytosine Methyltransferase domain (PF00145). CH, Calponin Homology domain (PF00307). Asterisk highlights arctic lamprey sequences. Broken domains indicate that the domain has large deletions in the given clade. b, Maximum likelihood phylogenetic tree of the Methyl-CpG Binding Domain family in animals. Nodal supports represent 100 bootstrap nonparametric replications. On the right, protein domain structure of each clade, as defined by Pfam domains. MBD, Methyl Binding Domain (PF01429). HhH-GPD, Thymine glycosylase (PF00730). MBDa, p55-binding region of MBD2/3 (PF16564). MBD_C, MBD2/3 C-terminal domain (PF14048). zf-CXXC, zinc finger (PF02008). CTD, MECP2 C-Terminal Domain. TRD, MECP2 Transcriptional Repression Domain. Asterisks highlight vertebrate sequences, percentages are shown for amino acid MBD identity between lamprey and human orthologues. c, Distribution of MECP2/MBD4 and DNMT3 genes across animal lineages. Absence of a dot indicates gene absence. Numbers indicate those species/lineages that have multiple copies of a given gene. Dnmt3c in rodents and dnmt3ba/bb.1/bb.2 are lineage-specific duplications of DNMT3B that have diverged in their function or domain architecture. “x3” indicates lineage-specific duplications. On the right, the phylogenetic relationships among animal lineages. d, Stepwise evolution of the MeCP2 and MBD4 protein domains in vertebrates, amphioxus, and non-chordates. NID stands for the N-CoR/SMRT interacting amino acids. e, Genome browser snapshot of amphioxus MBD4 locus. The longer isoform with the capacity to repair DNA has higher expression in embryonic samples, see further detail in Extended Data 10.
MeCP2 evolved as CpH reader from an ancestral DNA repair protein
In mammals, the silencing capacity of CpH methylation has been attributed to the methylation “reader” MeCP234. MeCP2 is a Methyl-CpG Binding Domain (MBD) containing protein, capable of binding both methylated CpG and CpA dinucleotides34,51. Furthermore, MeCP2 has been shown to bind methylated CAC in vitro and in vivo, the most common context of CA methylation in the brain51,52. To better understand if CpH methylation co-evolved with MeCP2, we performed a phylogenetic analysis of MBD proteins in animals (Fig. 4b, Extended Data 8). We found that MeCP2 is deeply conserved in all vertebrates, including lampreys and chondrichthyans. MeCP2 branches as a sister group to the MBD4 family, as reported previously53. MBD4 is conserved across vertebrates, however, it is associated with DNA repair and not gene regulation54 implying that MeCP2 evolved as a duplication of an ancestral MBD4-like gene.
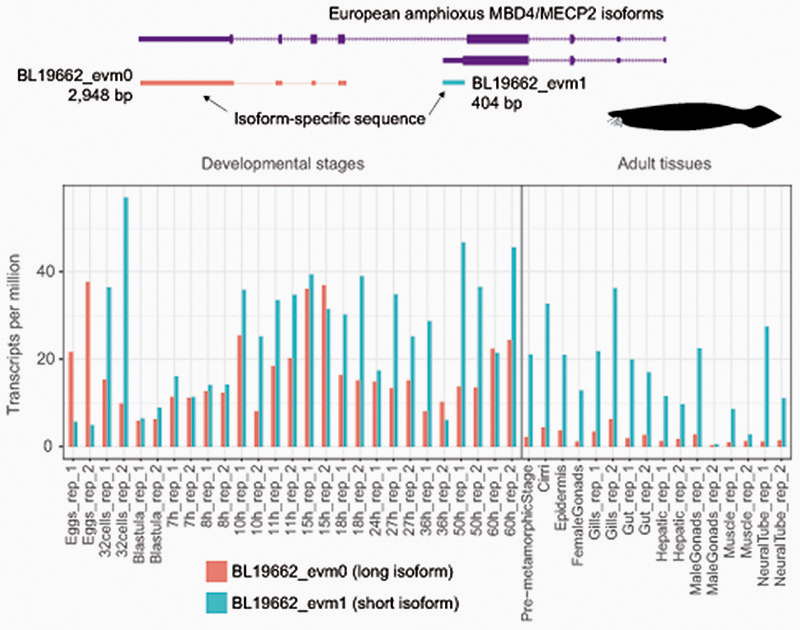
Besides the conserved MBD domain, MeCP2 has vastly diverged from the ancestral invertebrate MBD4-like family. Whereas MBD4 contains a C-terminal glycosylase domain, involved in mismatch repair of CpG dinucleotides, MeCP2 harbors a transcriptional repression domain (TRD) and a C-terminal domain. The TRD domain is known to interact with multiple histone modifying complexes associated with transcriptional silencing, such as Sin3, CoREST and N-CoR55–57. Most surprisingly, we found that many parts of the TRD are conserved beyond vertebrates, being found in amphioxus MBD4/MECP2 orthologue (Fig. 4d, Extended Data 9), which represents an intermediate step between MBD4 and MeCP2. Moreover, we found that amphioxus transcribes a longer MBD4/MECP2 isoform that includes the glycosylase domain involved in DNA repair and a shorter isoform lacking this domain. When assessing the isoform usage across developmental stages and tissues in amphioxus, we found that the longer MBD4/MECP2 isoform is preferentially expressed in developmental samples, whereas the short version is predominant in adult tissues (Fig. 4e, Extended Data 10). This suggests that MBD4/MECP2 in amphioxus has DNA repair functions predominantly during development, and gene regulatory activities in adult tissues, and thus a dual function achieved using alternative isoforms. In vertebrates, MeCP2 could have evolved and specialised as a consequence of gene duplication linked to WGD, in which one of the MBD4-like duplicated loci lost the glycosylase domain and gained a new C-terminal domain restricting it to gene regulation, whereas the other copy lost the TRD domain and maintained the glycosylase domain, reverting to the pre-chordate MBD4 domain architecture specialised in DNA repair.
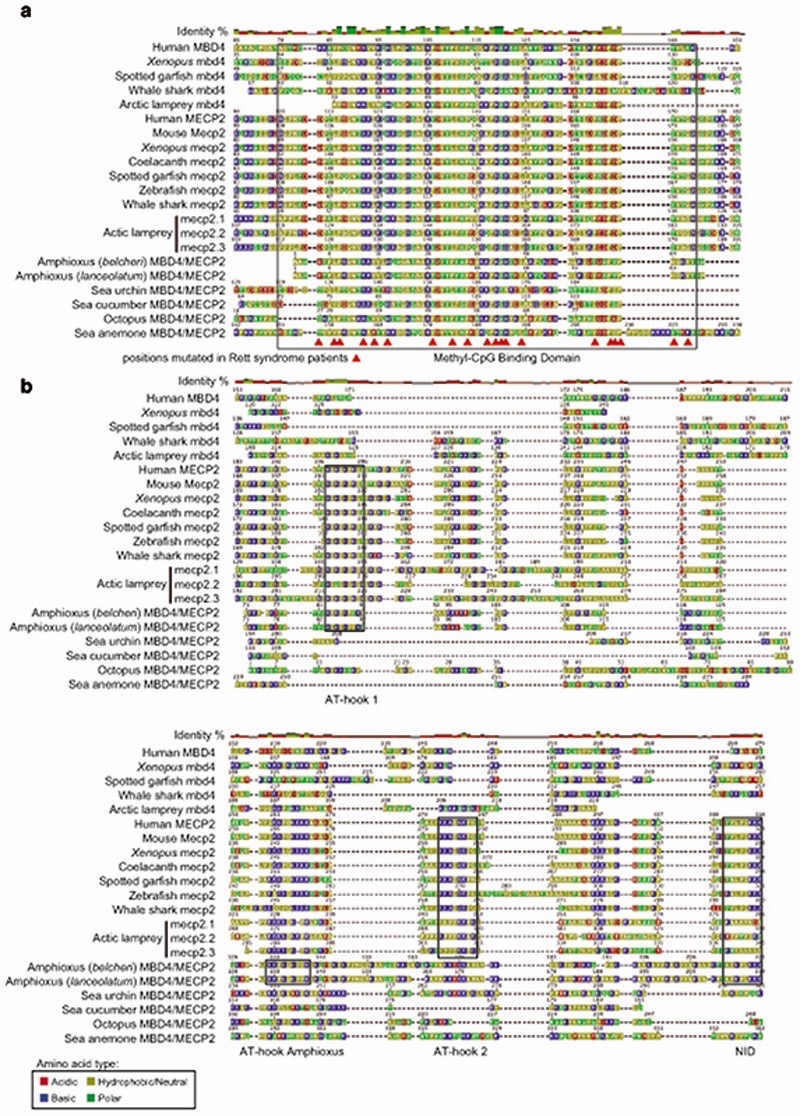
These changes in protein structure and function must have imposed new functional constraints on MeCP2. Since MeCP2 protein is expressed at histone levels and proposed to partially substitute H1 in neurons58, high levels of conservation in MeCP2 would be expected. Consistently, we found that the MBD had 70% identity between lamprey and human MeCP2 orthologues, but only ~40% identity between MBD4 orthologues (Fig. 4b). In contrast, the MBD domain in amphioxus MBD4/MECP2 is quite divergent from both MBD4 and MeCP2 (Extended Data 9), suggesting that it does not have the capacity to bind CpH methylation like MeCP2, which is consistent with the lack of CpH methylation in amphioxus neural tube (Fig. 2). Also influencing DNA binding specificity, MeCP2 harbours two AT-hook motifs51,59, which are conserved across vertebrates and amphioxus MBD4/MECP2 (Extended Data 9). Thus, the binding specificities of MeCP2 evolved in a stepwise manner, first gaining the AT-Hooks in the MBD4-like chordate ancestor, and then acquiring the vertebrate MBD CpH methylation binding capacity that became fixed after the subfunctionalization of MeCP2.
Discussion
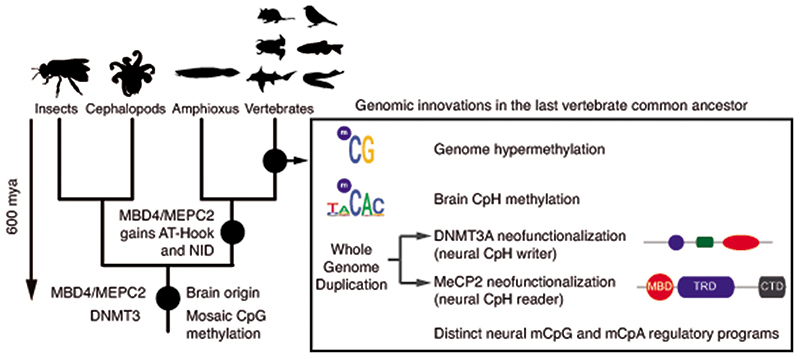
Here we show how a functionally conserved new layer of epigenomic regulation was assembled at the origin of the vertebrate lineage (Fig. 5). Neural CpH methylation evolved from gene machinery ancestrally involved in CpG methylation. Despite CpH methylation having non-overlapping distribution patterns with CpG methylation, CpH methylation is not fully independent of CpG methylation, as it is deposited by DNMT3 enzymes able to methylate both sequence contexts. Furthermore, CpH methylation is read by MeCP2, which also binds CpG methylation. This scenario contrasts with that of plants, in which the different contexts of cytosine methylation are fully uncoupled. Specialised DNMTs are responsible for CpG and CpH methylation deposition and maintenance, and CpH methylation is largely restricted to transposable elements60. Nevertheless, there is extensive cross-talk between CpH and CpG methylation in plants, since CpG gene body methylation is lost in species that have lost CMT3, a DNMT that methylates the CHG context61. Instead, such a dual readout of CpG and CpH methylation seems to be absent from invertebrate genomes, as CpH methylation is very scarce. Here we show how brain DNA methylation in amphioxus, honeybee, and octopus are depleted of CpH methylation, as the low levels of CpH methylation cannot be distinguished from non-conversion rates. Furthermore, invertebrates lack a functionally consistent pattern of deposition of CpH on gene bodies as observed in vertebrates. Therefore, it is likely that previous reports of CpH methylation in invertebrate genomes are due to off-target activity of DNMT362,63, suggestive of CpH methylation in invertebrates not being fully constituted into an autonomous epigenomic layer.
Fig. 5. The assembly of neural-CpH methylation.
Cladogram representing the evolutionary scenario of neural CpH methylation acquisition in vertebrates. Silhouettes of octopus and honeybee obtained from phylopic.org.
We hypothesize that the evolution of MeCP2 was instrumental in the fixation of CpH methylation as a regulatory mark in the brain. CpH methylation could have originally accumulated in neurons simply as a by-product of the lack of DNA replication. However, the capacity of MeCP2 to specifically read CpH methylation could have enabled and reinforced the silencing roles of CpH methylation as a hub for chromatin silencing in a pathway partially independent of CpG methylation. In fact, mice that preserve neural CpG methylation patterns but lack CpH methylation recapitulate the transcriptional deregulation caused by MeCP2 loss39, suggesting that CpH methylation is what drives the specific roles of MeCP2 in the brain. Furthermore, mice encoding a modified MeCP2 version lacking the ability to bind to methylated CpA (while still preserving the capacity to bind to methylated CpGs) show Rett syndrome-like phenotypes52. Our finding that CpH methylation and MeCP2 evolved concomitantly argues in favour of a key role of this epigenomic layer in neural functions across the whole vertebrate lineage. Despite the fact that we do not know at which developmental time point CpH methylation is deposited in most vertebrate lineages, or the MeCP2 binding patterns in most species, we speculate that the CpH roles in neural maturation and memory formation described in mammals could extend to all vertebrates.
Recent evidence suggests that the ancestral whole genome duplication may not have had an impact on the evolution of CpG hypermethylation in vertebrates64, however, it allowed the emergence of neural CpH methylation. DNMT3 paralogues that are specialised in different functions emerged after duplication, as exemplified by DNMT3A methylating CAC trinucleotides in neural tissues whereas DNMT3B methylates CAG trinucleotides in stem cells46. In the case of MeCP2 and MBD4, the duplication allowed the specialisation of both copies to perform unique functions, which was only partially attained in amphioxus through differential usage of isoforms, as previously observed for a vertebrate neural-specific splicing factor65. Therefore, our work unveils the stepwise assembly of a critical regulatory novelty in vertebrate brains. This novelty likely had an impact on the complexity of behaviours and cognitive processes found across the vertebrate lineage.
Methods
Brain DNA collection
Arctic lamprey (Lethenteron camtschaticum) and elephant shark (Callorhinchus milii) forebrains were collected from frozen samples, belonging to adult animals collected in Hokkaido, Japan and Queenscliff, Victoria, Australia respectively. Chicken (Gallus gallus) and zebrafish (Danio rerio) forebrains were collected from adult individuals reared in the CABD, Spain, approved by the Ethical Committees from the University Pablo de Olavide, CSIC and the Andalucían government. The platypus (Ornithorhynchus anatinus) frontal lobe cortex and the gray short-tailed opossum (Monodelphis domestica) brain samples were obtained from adult male frozen samples according to the University of Adelaide biosafety and ethics committee regulations (Institutional Biosafety Committee, Dealing ID 12713, permits ID1111998.2, NPWS A193 and ID1814535.1). Mediterranean amphioxus (Branchiostoma lanceolatum) neural tubes were dissected from 6 adults collected in Argeles-sur-Mer, France with special permission provided by the Prefect of Region Provence Alpes Côte d’Azur. For the honeybee (Apis mellifera), a whole brain from an adult egg laying queen was collected at the University of Western Australia. California two-spot octopus (Octopus bimaculoides) samples were obtained from a single adult female octopus in compliance with the EU Directive 2010/63/EU guidelines on cephalopod use and the University of Chicago Animal Care and Use Committee. Both the supraesophageal and subesophageal brains from the octopus were dissected as previously described29. To purify genomic DNA, DNeasy Blood and tissue Kit (Qiagen) and phenol-chloroform DNA extraction methods were used.
Whole Genome Bisulfite Sequencing
We followed the MethylC-seq protocol for library preparation66. In brief, for each species, 500 ng to 1 μg of brain genomic DNA was mixed with 0.1% to 0.5% (w/w) of unmethylated lambda phage genomic DNA. The mixed DNA was sheared into 200 bp fragments using a Covaris Sonicator S220. Then methylated Illumina adaptors (Nextflex Bisulfite-seq adaptors, BIOO scientific) were ligated to sheared DNA, and bisulfite conversion was performed using EZ DNA Methylation-Gold kit (Zymo Research) following the manufacturer’s instructions. After bisulfite treatment, DNA was purified and amplified using universal Illumina primers and KAPA HiFi HotStart Uracil+ DNA polymerase (Kapa Biosystems). The honeybee library was obtained using the same protocol with minor modifications, MethylCode Bisulfite Conversion Kit (Thermo Fisher) was used for bisulfite conversion and the PfuTurbo Cx Hotstart DNA Polymerase (Agilent) was used for library amplification. All libraries but the honeybee and amphioxus samples were sequenced in a Illumina HiSeq 1500 instrument in single-end mode, with reads spanning 100 bp. The honeybee samples were sequenced with an Illumina Genome Analyzer IIx in single-end mode, with reads spanning 84 bp, and amphioxus were sequenced in a NovaSeq 6000 in a paired-end 28-87 bp format.
Methylation analysis
The newly generated WGBS datasets were complemented with available data from previous studies7,18,24,67, corresponding to the NCBI Sequence Read Archive (SRA) accessions SRX314948 for 6 week old mouse frontal cortex, SRX306585 for 25 year old human frontal cortex, SRX1002603 for zebrafish (Danio rerio) adult brain, SRX1162705 for Xenopus tropicalis adult brain, SRX2645741 for elephant shark liver and SRX1064224 for great tit (Parus major) adult whole brain. All WGBS reads were trimmed using fastp68 with default parameters and mapped to the reference genomes using BS-Seeker269 specifying Bowtie 270 as the aligner in end-to-end mode. Duplicated reads were discarded using Sambamba71, unconverted reads were filtered out using the XS:i:1 sam flag from BS-Seeker2, and methylation calls were obtained using CGmapTools72. Previously processed WGBS datasets for Ciona intestinalis and the sea anemone Nematostella vectensis were obtained from Gene Expression Omnibus (GEO) GSE1982473 and GSE12401664.
Since methylated CpG sites are prone to deamination, after the deamination of a symmetric CpG site it becomes a non-symmetric CpA site. Therefore, some CpA positions in the reference genomes are likely to represent genetic variants in which individuals might have CpG dinucleotides. Distinguishing those sites is crucial to accurately measure CpH methylation, to avoid confounding variant hypermethylated CpG sites for CpA positions. Therefore, the ATCGmap file resulting from CGmapTools was parsed with AWK to identify CpH sites with ≥20% of reads supporting a guanine in the downstream position of a methylated cytosine. Those positions were discarded from the final CGmap file.
Single Nucleotide Variants were obtained using CGmapTools ‘snv’ function (-m bayes --bayes-dynamicP parameters) from the WGBS ATCGmap file. For each SNV position, the upstream and downstream dinucleotides based on the reference genome were obtained using BEDTools74.
To estimate methylation heterogeneity in each sample, we followed the Proportion of Discordant Reads (PDR) measure previously proposed for heterogeneous tumour samples75. We first selected CpG positions for which coverage was ≥10, and filtered for those that had at least 3 CpG ± 40 bp around them. Then we selected 100,000 of these CpGs randomly in every genome (sample function in R) and obtained the per read methylation levels on the reads that overlapped these positions. We only retained CpGs that had at least 5 reads covering ≥4 CpGs. Fully methylated and unmethylated reads were counted as concordant, whereas intermediate methylation was counted as discordant.
CGmap files were imported into R using the bsseq package76, and all methylation calculations were performed using in-built functions getCoverage and getMeth. CpH methylation was initially calculated for each dinucleotide context to obtain the global levels (mC/C), however, gene body level calculations were restricted to CpA dinucleotides since it is the predominant context.
For each species, CpH positions were sorted by methylation level (mC/C), and the top 10,000 were selected to have a comparable number across species. The neighbouring regions were obtained using BEDTools in a strand-specific manner, and collapsed into sequence motifs with ggseqlogo in R77.
Protein-coding genes were classified into 10 deciles according to CpA and CpG methylation levels along the gene body. Gene body methylation level measurements were obtained from the weighted average of all cytosine calls in a given region divided by the total amount of coverage in the C positions. Genes without enough covered CpG positions (≥30) and mean coverage (≥4x) were discarded.
Gene Ontology enrichments
Gene Ontology (GO) enrichments were obtained using g:Profiler78 gProfileR R package, using ensembl gene ids. For the arctic lamprey and the elephant shark, which were not present on the g:Profiler database, OrthoFinder279 was used to obtain orthology relationships with human genes. Then, gene ids from both species and each decile were converted to human gene ids, which were used to obtain GO enrichments using g:Profiler with ‘hsapiens’, limiting the background to all the human genes detected in each orthology search. Significance was corrected with the g:Profiler inbuilt g:SCS algorithm. The final set of GOs shown in Fig. 3 represent GOs that are enriched in the maximum number of species and are not non-redundant. The full list of GOs and KEGG pathways for each species and comparison are found in Supplementary Table 1.
RNA-seq analysis
Brain RNA-seq reads from previous publications7,18,25,29,40,65,80,81 were downloaded from SRA. SRX314972 was used for human adult frontal cortex, SRX314992 was used for mouse adult prefrontal cortex, SRX081894 for opossum brain, SRX081882 for the platypus brain, SRX081869 for the chicken brain, SRX904626 for the great tit brain, SRX191164 for Xenopus tropicalis brain, SRX4184230 for zebrafish adult forebrain, SRX154851 for elephant shark brain, SRX2267405 for the Arctic lamprey brain, SRX1045432 for the octopus supraesophageal brain, and PRJNA416866 for all amphioxus tissues. For the honeybee brain, we extracted matched DNA and RNA samples from workers and queens, using a Trizol extraction protocol and prepared Illumina stranded TruSeq RNA-seq libraries, which were sequenced on an Illumina Genome Analyzer IIx.
Kallisto82 was then used to quantify gene expression, based on the canonical isoform for each gene as per ENSEMBL annotations. For genomes without ENSEMBL annotation, we used the isoform that encoded the longest open reading frame.
Developmental time-series from human, mouse, opossum and chicken were downloaded from https://apps.kaessmannlab.org/evodevoapp/ 83, gene expression was standardized for each gene dividing the RPKM value against the maximum level of expression of that given gene.
To determine isoform usage in amphioxus MBD4 locus, we gathered the non-overlapping regions between the short and the long MBD4 isoforms, added 100 padding N bases (to allow paired-end sequencing mapping) and made a transcriptome index using Kallisto82, which was also used to quantify isoform abundance without using reads from the common sequence between isoforms.
Gene search and phylogeny
MBD family genes were searched using HMMER384 with the PFAM PF01429 model against the proteomes of a representative subset of animal genomes (Supplementary Table 3). Hits were extracted and aligned with MAFFT85 in LINS-I mode, and an initial pruning of the alignment was performed to avoid members of the SETDB1/2 and BAZ2A/B families, since the MBD domain in these family is derived and accumulates an excess of mutations. The resulting alignment was then trimmed manually, to maximize the number of positions on the MBD domain and avoiding spurious aligned regions. The resulting alignment was then used in IQ-TREE86 to obtain maximum likelihood phylogenetic reconstruction, letting the software to choose the best fitting substitution model (-m TEST) and obtaining 100 non-parametric bootstrap replications to compute nodal supports. Protein domain architectures for each sequence were obtained using HMMER3 with the PFAM A database using the “hmmscan” program. MECP2 domains not defined in PFAM were obtained from previous publications describing the TRD and CTD domains15,55. TRD and CTD alignments spanning all vertebrate major lineages were used to generate HMM models with HMMER3 hmmbuild program, and were searched using hmmsearch against the selected animal proteomes.
For obtaining DNMT3 sequences, we used BLASTP search using human DNMT3A as query against the proteomes of all species, selecting the best hits for each species. For species where we could not find a specific ohnologue, we searched in NCBI against the whole clade using BLASTP (e.g. DNMT3B in amphibians) to certify that absence is not due to genome assembly incompleteness. Similarly, DNMT3L was searched using BLASTP in NCBI against all lineages except mammals, to detect ohnologues in all reptilian lineages (turtles, crocodilians and squamates) except birds. The resulting sequences were aligned with MAFFT in EINS-I mode and trimmed using TrimAL (-automated1). The phylogenetic tree was computed as for MBDs.
PWWP alignments were obtained from a subset of full length DNMT3 sequences, using one representative species for each lineage. The sequences were aligned using MAFFT LINS-I mode and the sequence logos were obtained using ggseqlogo in R. The alignments were visualised using Geneious software.
Extended Data
Extended Data Fig. 1. Locally disordered methylation characterises the lamprey epigenome.
Proportion of Discordant Reads (PDR) values for a subset of CpGs (100,000) of each species (See Methods). Boxplot centre lines are medians, box limits are quartiles 1 (Q1) and 3 (Q3), whiskers are 1.5 × interquartile range (IQR).
Extended Data Fig. 2. CpG hypermutability is widespread in vertebrates except the lamprey.
Percentage of Single Nucleotide Variants identified from the WGBS libraries from the total number of dinucleotides in the reference genome. In pale blue are those proportions that are equal or lower than the expected (total number of SNVs / total number of dinucleotides), and in dark blue are those that are overrepresented. Note that the mouse has very few SNVs as it is a laboratory isogenic line, however it still shows a slightly higher enrichment for SNVs in CpG dinucleotides, whereas birds have very high SNV rates on CpG dinucleotides despite having intermediate levels of CpG methylation.
Extended Data Fig. 3. CpH methylation is specific to brain tissues across vertebrates.
Sequence motifs found surrounding the highest methylated CpH positions in each sample. CpH positions were required to have a coverage ≥ 10x. hpf = embryo hours post fertilization. Sox10+ cells correspond to developmental neural crest cells in zebrafish. (b) Gene Ontology enrichments for genes showing the highest and lowest gene body methylation levels in the CpA context, as defined by belonging to the top and bottom deciles in each species and tissue. (c) Gene Ontology enrichments for genes showing the highest and lowest methylated levels in the CpG context.
Extended Data Fig. 4. Anticorrelation between CpG and CpA methylation and transcription is restricted to a subset of vertebrate samples.
Distribution of gene body methylation levels on genes separated by expression level on brain tissue. “No expression” category includes all genes with TPM < 1, whereas the rest of genes were classified in 10 deciles of expression (lower expression left, higher expression right). Positive correlation between expression and CpG methylation is restricted to invertebrate brain samples. Boxplot centre lines are medians, box limits are quartiles 1 (Q1) and 3 (Q3), whiskers are 1.5 × interquartile range (IQR).
Extended Data Fig. 5. Gene classification by CpA and CpG methylation levels.
(a) Distribution of gene body methylation levels on genes classified in deciles from lower to higher methylation levels. Few genes are CpG methylated in the honeybee (only 3 top deciles). The dynamic range of CpG gene body methylation of lampreys and birds differs from the rest of vertebrates, in which a vast majority of genes are highly methylated (>50%). Boxplot centre lines are medians, box limits are quartiles 1 (Q1) and 3 (Q3), whiskers are 1.5 × interquartile range (IQR). (b) Overlap between top and bottom decile genes classified by CpA and CpG gene body methylation levels. All deciles have the same size, thus overlap % captures the relative differences between categories in a comparable manner. (c) Level of conservation of gene sets classified by CpA and CpG gene body methylation levels. If a given orthologue is present in one subset of genes in only one species it is classified as a Singleton (1), whereas if it is found in the nine vertebrate species analyzed it is classified as 9. Each orthologue is counted once per species (e.g. if lamprey has 2 species-specific paralogues of one gene, it is only counted as 1).
Extended Data Fig. 6. Expression level of highly conserved CpA methylated genes.
Standardized expression level for genes conserved in at least 7 vertebrate species as belonging to the top decile of CpA methylated genes. Boxplot centre lines are medians, box limits are quartiles 1 (Q1) and 3 (Q3), whiskers are 1.5 × interquartile range (IQR).
Extended Data Fig. 7. Phylogeny and expression of DNMT3 enzymes.
(a) Maximum likelihood phylogenetic tree of DNMT3 orthologues across animals, representing the full version of that presented in Figure 4a. Nodal supports represent 100 bootstrap nonparametric replications. Schematic protein domain configurations shown for each clade. PWWP, Pro-Trp-Trp-Pro motif domain (PF00855). AAD ATRX, DNMT3, DNMT3L domain. MT, cytosine Methyltransferase domain (PF00145). CH, Calponin Homology domain (PF00307). Asterisk highlights arctic lamprey sequences. Broken domains indicate that the domain has large deletions in the given clade. (b) Table with the steady-state transcriptional level of DNMT3A in vertebrate samples, and DNMT3 in invertebrate samples. Compared to previous analysis of the DNMT3 family, here we describe for the first time the presence of DNMT3L in non-mammalian genomes. These include non-avian reptiles (turtles, crocodiles and squamates) and two lamprey genomes. This indicates that DNMT3L was one of the ancestral onhologues product of the vertebrate ancestral WGD. Interestingly, both lampreys and tetrapod sequences show a truncated cytosine methyltransferase domain, which might indicate that the DNMT3L has been conserved despite its lack of catalytic activity.
Extended Data Fig. 8. Phylogeny and conservation of MBD4/MECP2.
(a) Maximum likelihood phylogenetic tree of the Methyl-CpG Binding Domain family in animals, representing the full-version of Figure 4b. Nodal supports represent 100 bootstrap nonparametric replications. On the right, protein domain structure of each clade, as defined by Pfam domains. MBD, Methyl Binding Domain (PF01429). HhH-GPD, Thymine glycosylase (PF00730). MBDa, p55-binding region of MBD2/3 (PF16564). MBD_C, MBD2/3 C-terminal domain (PF14048). zf-CXXC, zinc finger (PF02008). CTD, MECP2 C-Terminal Domain. TRD, MECP2 Transcriptional Repression Domain. (b) Domain presence in MBD4/MECP2 orthologues in several invertebrate genomes. Lack of the Thymine glycosylase domain is likely due to incomplete gene annotation or genome assembly gaps.
Extended Data Fig. 9. Conservation of the MeCP2 protein domains.
(a) Amino acid multi-sequence alignment (MAFFT E-INS-i mode) of the Methyl-CpG Binding domain (MBD) from MeCP2, MBD4 and invertebrate MECP2/MBD4 sequences. The black square highlights the MBD domain as defined by Pfam. The red triangles indicate positions mutated in the human MECP2 gene that cause Rett Syndrome phenotypes52. (b) Amino acid multi-sequence alignment of the Transcriptional Repression Domain (TRD) from MeCP2, MBD4 and the homologous region (C-terminal of the MBD) of invertebrate MBD4/MECP2 proteins. NID stands for the N-CoR/SMRT interacting amino acids. Additional black squares highlight the AT-hook domains. Alignment visualised using Geneious software.
Extended Data Fig. 10. MBD4/MECP2 isoform expression in the european amphioxus.
Diagram representing the sequences used to uniquely map RNA-seq reads to each isoform across different tissues and developmental stages. Quantification of each isoform in each sample, normalised by gene length (TPM as per Kallisto quantification).
Supplementary Material
Acknowledgements
We would like to dedicate this paper to the memory of Jose Luis Gomez-Skarmeta, a dear friend and colleague who was instrumental in igniting this project and contributing to this work, but who sadly passed away during the revision process. We would also like to thank Nacho Maeso for critical reading of this manuscript and suggestions, and Manuel Irimia for advice on isoform quantification. We thank Professor Norman Saunders (University of Melbourne) for sharing opossum material. We would like to thank Juan Pascual-Anaya for granting access to the hagfish genome assembly. We thank to “Semilleria las Ganchozas” for providing advice about material required for this project. This work was supported by the Australian Research Council (ARC) Centre of Excellence program in Plant Energy Biology (CE140100008). RL was supported by a Sylvia and Charles Viertel Senior Medical Research Fellowship, ARC Future Fellowship (FT120100862), and Howard Hughes Medical Institute International Research Scholarship. AdM was funded by an EMBO long term fellowship (ALTF 144-2014). JLG-S was supported by the Spanish government (grant no. BFU2016-74961-P) and the institutional grant Unidad de Excelencia María de Maeztu (no. MDM-2016-0687). BV was supported by the Biomedical Research Council of the Agency for Science, Technology and Research of Singapore. FG is supported by an ARC Future Fellowship (FT160100267). CR is supported by a NSF grant (IOS-1354898).
Footnotes
Author contributions
OB, AdM and RL designed the study. AdM, OB, DP and RL prepared MethylC-seq libraries which were sequenced by JP, JRN and DP. The data were analysed by AdM with help from SBu. JLG-S, EdlCM, CA, CWR, FG, TD, BV, JRE, BB, SBe and HE provided the biological samples. The manuscript was written by AdM, OB and RL. All authors commented on the final manuscript.
Competing interests
The authors declare no competing interests.
Data and materials availability
Sequencing data have been deposited in the Gene Expression Omnibus (GEO) under the accession number GSE141609.
Code Availability
The analysis code is available on https://github.com/AlexdeMendoza/BrainZoo.
References
- 1.Schübeler D. Function and information content of DNA methylation. Nature. 2015;517:321–326. doi: 10.1038/nature14192. [DOI] [PubMed] [Google Scholar]
- 2.Luo C, Hajkova P, Ecker JR. Dynamic DNA methylation: In the right place at the right time. Science. 2018;361:1336–1340. doi: 10.1126/science.aat6806. [DOI] [PMC free article] [PubMed] [Google Scholar]
- 3.Bird A. DNA methylation patterns and epigenetic memory. Genes Dev. 2002;16:6–21. doi: 10.1101/gad.947102. [DOI] [PubMed] [Google Scholar]
- 4.Suzuki MM, Bird A. DNA methylation landscapes: provocative insights from epigenomics. Nat Rev Genet. 2008;9:465–476. doi: 10.1038/nrg2341. [DOI] [PubMed] [Google Scholar]
- 5.de Mendoza A, Lister R, Bogdanovic O. Evolution of DNA Methylome Diversity in Eukaryotes. J Mol Biol. 2019 doi: 10.1016/j.jmb.2019.11.003. [DOI] [PubMed] [Google Scholar]
- 6.He Y, Ecker JR. Non-CG Methylation in the Human Genome. Annu Rev Genomics Hum Genet. 2015;16:55–77. doi: 10.1146/annurev-genom-090413-025437. [DOI] [PMC free article] [PubMed] [Google Scholar]
- 7.Lister R, et al. Global epigenomic reconfiguration during mammalian brain development. Science. 2013;341:1237905–1237905. doi: 10.1126/science.1237905. [DOI] [PMC free article] [PubMed] [Google Scholar]
- 8.Mo A, et al. Epigenomic Signatures of Neuronal Diversity in the Mammalian Brain. Neuron. 2015;86:1369–1384. doi: 10.1016/j.neuron.2015.05.018. [DOI] [PMC free article] [PubMed] [Google Scholar]
- 9.Lister R, et al. Hotspots of aberrant epigenomic reprogramming in human induced pluripotent stem cells. Nature. 2011;471:68–73. doi: 10.1038/nature09798. [DOI] [PMC free article] [PubMed] [Google Scholar]
- 10.Guo JU, et al. Distribution, recognition and regulation of non-CpG methylation in the adult mammalian brain. Nat Neurosci. 2014;17:215–222. doi: 10.1038/nn.3607. [DOI] [PMC free article] [PubMed] [Google Scholar]
- 11.Ziller MJ, et al. Genomic distribution and inter-sample variation of non-CpG methylation across human cell types. PLoS Genet. 2011;7 doi: 10.1371/journal.pgen.1002389. e1002389. [DOI] [PMC free article] [PubMed] [Google Scholar]
- 12.Gabel HW, et al. Disruption of DNA-methylation-dependent long gene repression in Rett syndrome. Nature. 2015 doi: 10.1038/nature14319. [DOI] [PMC free article] [PubMed] [Google Scholar]
- 13.Stroud H, et al. Early-Life Gene Expression in Neurons Modulates Lasting Epigenetic States. Cell. 2017;171:1151–1164.e16. doi: 10.1016/j.cell.2017.09.047. [DOI] [PMC free article] [PubMed] [Google Scholar]
- 14.Luo C, et al. Single-cell methylomes identify neuronal subtypes and regulatory elements in mammalian cortex. Science. 2017;357:600–604. doi: 10.1126/science.aan3351. [DOI] [PMC free article] [PubMed] [Google Scholar]
- 15.Amir RE, et al. Rett syndrome is caused by mutations in X-linked MECP2, encoding methyl-CpG-binding protein 2. Nat Genet. 1999;23:185–188. doi: 10.1038/13810. [DOI] [PubMed] [Google Scholar]
- 16.Lyst MJ, Bird A. Rett syndrome: a complex disorder with simple roots. Nat Rev Genet. 2015;16:261–275. doi: 10.1038/nrg3897. [DOI] [PubMed] [Google Scholar]
- 17.Tatton-Brown K, et al. Mutations in the DNA methyltransferase gene DNMT3A cause an overgrowth syndrome with intellectual disability. Nat Genet. 2014;46:385–388. doi: 10.1038/ng.2917. [DOI] [PMC free article] [PubMed] [Google Scholar]
- 18.Laine VN, et al. Evolutionary signals of selection on cognition from the great tit genome and methylome. Nat Commun. 2016;7 doi: 10.1038/ncomms10474. 10474. [DOI] [PMC free article] [PubMed] [Google Scholar]
- 19.Derks MFL, et al. Gene and transposable element methylation in great tit (Parus major)brain and blood. BMC Genomics. 2016;17:332. doi: 10.1186/s12864-016-2653-y. [DOI] [PMC free article] [PubMed] [Google Scholar]
- 20.Sugahara F, et al. Evidence from cyclostomes for complex regionalization of the ancestral vertebrate brain. Nature. 2016 doi: 10.1038/nature16518. [DOI] [PubMed] [Google Scholar]
- 21.Roth G. Convergent evolution of complex brains and high intelligence. Philos Trans R Soc Lond B Biol Sci. 2015;371 doi: 10.1098/rstb.2015.0049. [DOI] [PMC free article] [PubMed] [Google Scholar]
- 22.Holland LZ, et al. Evolution of bilaterian central nervous systems: a single origin? Evodevo. 2013;4:27. doi: 10.1186/2041-9139-4-27. [DOI] [PMC free article] [PubMed] [Google Scholar]
- 23.Arendt D, Tosches MA, Marlow H. From nerve net to nerve ring, nerve cord and brain--evolution of the nervous system. Nat Rev Neurosci. 2016;17:61–72. doi: 10.1038/nrn.2015.15. [DOI] [PubMed] [Google Scholar]
- 24.Bogdanović O, et al. Active DNA demethylation at enhancers during the vertebrate phylotypic period. Nat Genet. 2016;48:417–426. doi: 10.1038/ng.3522. [DOI] [PMC free article] [PubMed] [Google Scholar]
- 25.Marlétaz F, et al. Amphioxus functional genomics and the origins of vertebrate gene regulation. Nature. 2018;564:64–70. doi: 10.1038/s41586-018-0734-6. [DOI] [PMC free article] [PubMed] [Google Scholar]
- 26.Albuixech-Crespo B, et al. Molecular regionalization of the developing amphioxus neural tube challenges major partitions of the vertebrate brain. PLoS Biol. 2017;15 doi: 10.1371/journal.pbio.2001573. e2001573. [DOI] [PMC free article] [PubMed] [Google Scholar]
- 27.Lyko F. The DNA methyltransferase family: a versatile toolkit for epigenetic regulation. Nat Rev Genet. 2018;19:81–92. doi: 10.1038/nrg.2017.80. [DOI] [PubMed] [Google Scholar]
- 28.Mugal CF, Arndt PF, Holm L, Ellegren H. Evolutionary consequences of DNA methylation on the GC content in vertebrate genomes. G3. 2015;5:441–447. doi: 10.1534/g3.114.015545. [DOI] [PMC free article] [PubMed] [Google Scholar]
- 29.Albertin CB, et al. The octopus genome and the evolution of cephalopod neural and morphological novelties. Nature. 2015 doi: 10.1038/nature14668. [DOI] [PMC free article] [PubMed] [Google Scholar]
- 30.Zhang Z, et al. Genome-wide and single-base resolution DNA methylomes of the Sea Lamprey (Petromyzon marinus) Reveal Gradual Transition of the Genomic Methylation Pattern in Early Vertebrates. bioRxiv. 2015 doi: 10.1101/033233. 033233. [DOI] [Google Scholar]
- 31.Shen JC, Rideout WM, 3rd, Jones PA. The rate of hydrolytic deamination of 5-methylcytosine in double-stranded DNA. Nucleic Acids Res. 1994;22:972–976. doi: 10.1093/nar/22.6.972. [DOI] [PMC free article] [PubMed] [Google Scholar]
- 32.Pfeifer GP. Mutagenesis at methylated CpG sequences. Curr Top Microbiol Immunol. 2006;301:259–281. doi: 10.1007/3-540-31390-7_10. [DOI] [PubMed] [Google Scholar]
- 33.Smith JJ, et al. The sea lamprey germline genome provides insights into programmed genome rearrangement and vertebrate evolution. Nat Genet. 2018 doi: 10.1038/s41588-017-0036-1. [DOI] [PMC free article] [PubMed] [Google Scholar]
- 34.Kinde B, Gabel HW, Gilbert CS, Griffith EC, Greenberg ME. Reading the unique DNA methylation landscape of the brain: Non-CpG methylation, hydroxymethylation, and MeCP2. Proc Natl Acad Sci U S A. 2015;112:6800–6806. doi: 10.1073/pnas.1411269112. [DOI] [PMC free article] [PubMed] [Google Scholar]
- 35.Xie W, et al. Base-resolution analyses of sequence and parent-of-origin dependent DNA methylation in the mouse genome. Cell. 2012;148:816–831. doi: 10.1016/j.cell.2011.12.035. [DOI] [PMC free article] [PubMed] [Google Scholar]
- 36.Wienholz BL, et al. DNMT3L modulates significant and distinct flanking sequence preference for DNA methylation by DNMT3A and DNMT3B in vivo. PLoS Genet. 2010;6 doi: 10.1371/journal.pgen.1001106. e1001106. [DOI] [PMC free article] [PubMed] [Google Scholar]
- 37.Herculano-Houzel S. The glia/neuron ratio: how it varies uniformly across brain structures and species and what that means for brain physiology and evolution. Glia. 2014;62:1377–1391. doi: 10.1002/glia.22683. [DOI] [PubMed] [Google Scholar]
- 38.Olkowicz S, et al. Birds have primate-like numbers of neurons in the forebrain. Proc Natl Acad Sci U S A. 2016;113:7255–7260. doi: 10.1073/pnas.1517131113. [DOI] [PMC free article] [PubMed] [Google Scholar]
- 39.Clemens AW, et al. MeCP2 Represses Enhancers through Chromosome Topology-Associated DNA Methylation. Mol Cell. 2020;77:279–293.e8. doi: 10.1016/j.molcel.2019.10.033. [DOI] [PMC free article] [PubMed] [Google Scholar]
- 40.Brawand D, et al. The evolution of gene expression levels in mammalian organs. Nature. 2011;478:343–348. doi: 10.1038/nature10532. [DOI] [PubMed] [Google Scholar]
- 41.Villar D, et al. Enhancer Evolution across 20 Mammalian Species. Cell. 2015;160:554–566. doi: 10.1016/j.cell.2015.01.006. [DOI] [PMC free article] [PubMed] [Google Scholar]
- 42.Jeong M, et al. Large conserved domains of low DNA methylation maintained by Dnmt3a. Nat Genet. 2014;46:17–23. doi: 10.1038/ng.2836. [DOI] [PMC free article] [PubMed] [Google Scholar]
- 43.Xie W, et al. Epigenomic analysis of multilineage differentiation of human embryonic stem cells. Cell. 2013;153:1134–1148. doi: 10.1016/j.cell.2013.04.022. [DOI] [PMC free article] [PubMed] [Google Scholar]
- 44.Sendžikaitė G, Hanna CW, Stewart-Morgan KR, Ivanova E, Kelsey G. A DNMT3A PWWP mutation leads to methylation of bivalent chromatin and growth retardation in mice. Nat Commun. 2019;10:1884. doi: 10.1038/s41467-019-09713-w. [DOI] [PMC free article] [PubMed] [Google Scholar]
- 45.Heyn P, et al. Gain-of-function DNMT3A mutations cause microcephalic dwarfism and hypermethylation of Polycomb-regulated regions. Nat Genet. 2019;51:96–105. doi: 10.1038/s41588-018-0274-x. [DOI] [PMC free article] [PubMed] [Google Scholar]
- 46.Lee J-H, Park S-J, Nakai K. Differential landscape of non-CpG methylation in embryonic stem cells and neurons caused by DNMT3s. Sci Rep. 2017;7:11295. doi: 10.1038/s41598-017-11800-1. [DOI] [PMC free article] [PubMed] [Google Scholar]
- 47.Albalat R, Martí-Solans J, Cañestro C. DNA methylation in amphioxus: from ancestral functions to new roles in vertebrates. Brief Funct Genomics. 2012;11:142–155. doi: 10.1093/bfgp/els009. [DOI] [PubMed] [Google Scholar]
- 48.Liu J, Hu H, Panserat S, Marandel L. Evolutionary history of DNA methylation related genes in chordates: new insights from multiple whole genome duplications. Sci Rep. 2020;10:970. doi: 10.1038/s41598-020-57753-w. [DOI] [PMC free article] [PubMed] [Google Scholar]
- 49.Greenberg MVC, Bourc’his D. The diverse roles of DNA methylation in mammalian development and disease. Nat Rev Mol Cell Biol. 2019;20:590–607. doi: 10.1038/s41580-019-0159-6. [DOI] [PubMed] [Google Scholar]
- 50.Smith THL, Collins TM, McGowan RA. Expression of the dnmt3 genes in zebrafish development: similarity to Dnmt3a and Dnmt3b. Dev Genes Evol. 2011;220:347–353. doi: 10.1007/s00427-010-0347-z. [DOI] [PubMed] [Google Scholar]
- 51.Lagger S, et al. MeCP2 recognizes cytosine methylated tri-nucleotide and di-nucleotide sequences to tune transcription in the mammalian brain. PLoS Genet. 2017;13 doi: 10.1371/journal.pgen.1006793. e1006793. [DOI] [PMC free article] [PubMed] [Google Scholar]
- 52.Tillotson R, et al. Neuronal non-CG methylation is an essential target for MeCP2 function. bioRxiv. 2020 doi: 10.1101/2020.07.02.184614. 2020.07.02.184614. [DOI] [PMC free article] [PubMed] [Google Scholar]
- 53.Albalat R. Evolution of DNA-methylation machinery: DNA methyltransferases and methyl-DNA binding proteins in the amphioxus Branchiostoma floridae. Dev Genes Evol. 2008;218:691–701. doi: 10.1007/s00427-008-0247-7. [DOI] [PubMed] [Google Scholar]
- 54.Millar CB, et al. Enhanced CpG mutability and tumorigenesis in MBD4-deficient mice. Science. 2002;297:403–405. doi: 10.1126/science.1073354. [DOI] [PubMed] [Google Scholar]
- 55.Lyst MJ, et al. Rett syndrome mutations abolish the interaction of MeCP2 with the NCoR/SMRT co-repressor. Nat Neurosci. 2013;16:898–902. doi: 10.1038/nn.3434. [DOI] [PMC free article] [PubMed] [Google Scholar]
- 56.Jones PL, et al. Methylated DNA and MeCP2 recruit histone deacetylase to repress transcription. Nat Genet. 1998;19:187–191. doi: 10.1038/561. [DOI] [PubMed] [Google Scholar]
- 57.Nan X, et al. Transcriptional repression by the methyl-CpG-binding protein MeCP2 involves a histone deacetylase complex. Nature. 1998;393:386–389. doi: 10.1038/30764. [DOI] [PubMed] [Google Scholar]
- 58.Skene PJ, et al. Neuronal MeCP2 is expressed at near histone-octamer levels and globally alters the chromatin state. Mol Cell. 2010;37:457–468. doi: 10.1016/j.molcel.2010.01.030. [DOI] [PMC free article] [PubMed] [Google Scholar]
- 59.Klose RJ, et al. DNA binding selectivity of MeCP2 due to a requirement for A/T sequences adjacent to methyl-CpG. Mol Cell. 2005;19:667–678. doi: 10.1016/j.molcel.2005.07.021. [DOI] [PubMed] [Google Scholar]
- 60.Law JA, Jacobsen SE. Establishing, maintaining and modifying DNA methylation patterns in plants and animals. Nat Rev Genet. 2010;11:204–220. doi: 10.1038/nrg2719. [DOI] [PMC free article] [PubMed] [Google Scholar]
- 61.Bewick AJ, et al. On the origin and evolutionary consequences of gene body DNA methylation. Proc Natl Acad Sci U S A. 2016;113:9111–9116. doi: 10.1073/pnas.1604666113. [DOI] [PMC free article] [PubMed] [Google Scholar]
- 62.Bonasio R, et al. Genome-wide and caste-specific DNA methylomes of the ants camponotus floridanus and harpegnathos saltator. Curr Biol. 2012;22:1755–1764. doi: 10.1016/j.cub.2012.07.042. [DOI] [PMC free article] [PubMed] [Google Scholar]
- 63.Harris KD, Lloyd JPB, Domb K, Zilberman D, Zemach A. DNA methylation is maintained with high fidelity in the honey bee germline and exhibits global non-functional fluctuations during somatic development. Epigenetics Chromatin. 2019;12:62. doi: 10.1186/s13072-019-0307-4. [DOI] [PMC free article] [PubMed] [Google Scholar]
- 64.de Mendoza A, et al. Convergent evolution of a vertebrate-like methylome in a marine sponge. Nat Ecol Evol. 2019;3:1464–1473. doi: 10.1038/s41559-019-0983-2. [DOI] [PMC free article] [PubMed] [Google Scholar]
- 65.Torres-Méndez A, et al. A novel protein domain in an ancestral splicing factor drove the evolution of neural microexons. Nat Ecol Evol. 2019;3:691–701. doi: 10.1038/s41559-019-0813-6. [DOI] [PubMed] [Google Scholar]
- 66.Urich MA, Nery JR, Lister R, Schmitz RJ, Ecker JR. MethylC-seq library preparation for base-resolution whole-genome bisulfite sequencing. Nat Protoc. 2015;10:475–483. doi: 10.1038/nprot.2014.114. [DOI] [PMC free article] [PubMed] [Google Scholar]
- 67.Peat JR, Ortega-Recalde O, Kardailsky O, Hore TA. The elephant shark methylome reveals conservation of epigenetic regulation across jawed vertebrates. F1000Res. 2017;6:526. doi: 10.12688/f1000research.11281.1. [DOI] [PMC free article] [PubMed] [Google Scholar]
- 68.Chen S, Zhou Y, Chen Y, Gu J. fastp: an ultra-fast all-in-one FASTQ preprocessor. Bioinformatics. 2018;34:i884–i890. doi: 10.1093/bioinformatics/bty560. [DOI] [PMC free article] [PubMed] [Google Scholar]
- 69.Guo W, et al. BS-Seeker2: a versatile aligning pipeline for bisulfite sequencing data. BMC Genomics. 2013;14:774–774. doi: 10.1186/1471-2164-14-774. [DOI] [PMC free article] [PubMed] [Google Scholar]
- 70.Langmead B, Salzberg SL. Fast gapped-read alignment with Bowtie 2. Nat Methods. 2012;9:357–359. doi: 10.1038/nmeth.1923. [DOI] [PMC free article] [PubMed] [Google Scholar]
- 71.Tarasov A, Vilella AJ, Cuppen E, Nijman IJ, Prins P. Sambamba: fast processing of NGS alignment formats. Bioinformatics. 2015;31:2032–2034. doi: 10.1093/bioinformatics/btv098. [DOI] [PMC free article] [PubMed] [Google Scholar]
- 72.Guo W, et al. CGmapTools improves the precision of heterozygous SNV calls and supports allele-specific methylation detection and visualization in bisulfite-sequencing data. Bioinformatics. 2018;34:381–387. doi: 10.1093/bioinformatics/btx595. [DOI] [PMC free article] [PubMed] [Google Scholar]
- 73.Zemach A, McDaniel IE, Silva P, Zilberman D. Genome-wide evolutionary analysis of eukaryotic DNA methylation. Science. 2010;328:916–919. doi: 10.1126/science.1186366. [DOI] [PubMed] [Google Scholar]
- 74.Quinlan AR, Hall IM. BEDTools: a flexible suite of utilities for comparing genomic features. Bioinformatics. 2010;26:841–842. doi: 10.1093/bioinformatics/btq033. [DOI] [PMC free article] [PubMed] [Google Scholar]
- 75.Landau DA, et al. Locally disordered methylation forms the basis of intratumor methylome variation in chronic lymphocytic leukemia. Cancer Cell. 2014;26:813–825. doi: 10.1016/j.ccell.2014.10.012. [DOI] [PMC free article] [PubMed] [Google Scholar]
- 76.Hansen KD, Langmead B, Irizarry RA. BSmooth: from whole genome bisulfite sequencing reads to differentially methylated regions. Genome Biol. 2012;13:R83. doi: 10.1186/gb-2012-13-10-r83. [DOI] [PMC free article] [PubMed] [Google Scholar]
- 77.Wagih O. ggseqlogo: a versatile R package for drawing sequence logos. Bioinformatics. 2017;33:3645–3647. doi: 10.1093/bioinformatics/btx469. [DOI] [PubMed] [Google Scholar]
- 78.Reimand J, Kull M, Peterson H, Hansen J, Vilo J. g:Profiler--a web-based toolset for functional profiling of gene lists from large-scale experiments. Nucleic Acids Res. 2007;35:W193–200. doi: 10.1093/nar/gkm226. [DOI] [PMC free article] [PubMed] [Google Scholar]
- 79.Emms DM, Kelly S. OrthoFinder: phylogenetic orthology inference for comparative genomics. Genome Biol. 2019;20:238. doi: 10.1186/s13059-019-1832-y. [DOI] [PMC free article] [PubMed] [Google Scholar]
- 80.Venkatesh B, et al. Elephant shark genome provides unique insights into gnathostome evolution. Nature. 2014;505:174–179. doi: 10.1038/nature12826. [DOI] [PMC free article] [PubMed] [Google Scholar]
- 81.Barbosa-Morais NL, et al. The evolutionary landscape of alternative splicing in vertebrate species. Science. 2012;338:1587–1593. doi: 10.1126/science.1230612. [DOI] [PubMed] [Google Scholar]
- 82.Bray NL, Pimentel H, Melsted P, Pachter L. Near-optimal probabilistic RNA-seq quantification. Nat Biotechnol. 2016;34:525–527. doi: 10.1038/nbt.3519. [DOI] [PubMed] [Google Scholar]
- 83.Cardoso-Moreira M, et al. Gene expression across mammalian organ development. Nature. 2019;571:505–509. doi: 10.1038/s41586-019-1338-5. [DOI] [PMC free article] [PubMed] [Google Scholar]
- 84.Eddy SR. Accelerated Profile HMM Searches. PLoS Comput Biol. 2011;7:e1002195–e1002195. doi: 10.1371/journal.pcbi.1002195. [DOI] [PMC free article] [PubMed] [Google Scholar]
- 85.Katoh K, Standley DM. MAFFT Multiple Sequence Alignment Software Version 7: Improvements in Performance and Usability. Mol Biol Evol. 2013;30:772–780. doi: 10.1093/molbev/mst010. [DOI] [PMC free article] [PubMed] [Google Scholar]
- 86.Nguyen LT, Schmidt HA, Von Haeseler A, Minh BQ. IQ-TREE: A fast and effective stochastic algorithm for estimating maximum-likelihood phylogenies. Mol Biol Evol. 2015;32:268–274. doi: 10.1093/molbev/msu300. [DOI] [PMC free article] [PubMed] [Google Scholar]
- 87.Ross SE, Angeloni A, Geng FS, de Mendoza A, Bogdanovic O. Developmental remodelling of non-CG methylation at satellite DNA repeats. Nucleic Acids Res. 2020 doi: 10.1093/nar/gkaa1135. In press. [DOI] [PMC free article] [PubMed] [Google Scholar]
- 88.Baubec T, et al. Genomic profiling of DNA methyltransferases reveals a role for DNMT3B in genic methylation. Nature. 2015;520:243–247. doi: 10.1038/nature14176. [DOI] [PubMed] [Google Scholar]
- 89.Dhayalan A, et al. The Dnmt3a PWWP domain reads histone 3 lysine 36 trimethylation and guides DNA methylation. J Biol Chem. 2010;285:26114–26120. doi: 10.1074/jbc.M109.089433. [DOI] [PMC free article] [PubMed] [Google Scholar]
- 90.Li Y, et al. DNA methylation regulates transcriptional homeostasis of algal endosymbiosis in the coral model Aiptasia. Sci Adv. 2018;4 doi: 10.1126/sciadv.aat2142. eaat2142. [DOI] [PMC free article] [PubMed] [Google Scholar]
- 91.Barau J, et al. The novel DNA methyltransferase DNMT3C protects male germ cells from transposon activity. Science. 2016;354:909–912. doi: 10.1126/science.aah5143. [DOI] [PubMed] [Google Scholar]
Associated Data
This section collects any data citations, data availability statements, or supplementary materials included in this article.
Supplementary Materials
Data Availability Statement
Sequencing data have been deposited in the Gene Expression Omnibus (GEO) under the accession number GSE141609.
The analysis code is available on https://github.com/AlexdeMendoza/BrainZoo.


