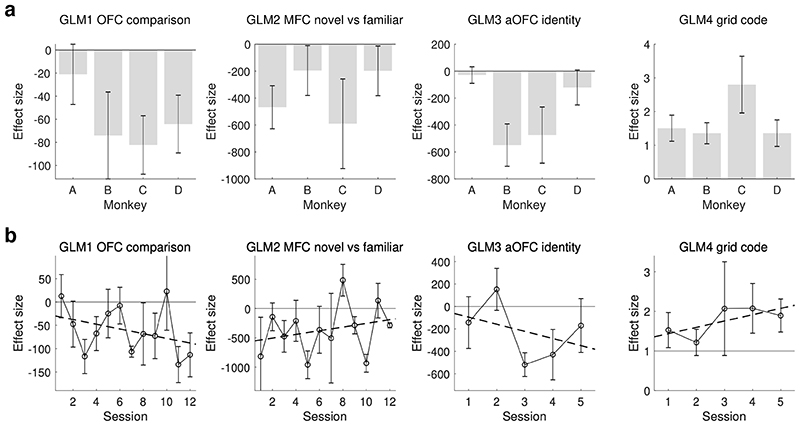
Extended Data Fig. 8. fMRI effects split by subject and session.
(a) Effect sizes for key analyses are shown separately for each subject and GLM. Error bars represent SEM. (b) Key effects plotted session by session. The continuous horizontal line represents the absence of an effect. The dotted line is a linear fit. Error bars represent SEM. No trend was statistically significant (GLM1: t 10 = -1.30, P = 0.22; GLM2: t 10 = 0.63, P = 0.54; GLM4: t 3 = 1.57, P = 0.21). Note that the selection of the aOFC ROI for GLM3 (third graph in panel b) was biased towards finding a temporal trend, because it was based on the effect of the last three sessions of each subject. It was merely included here for completeness.

