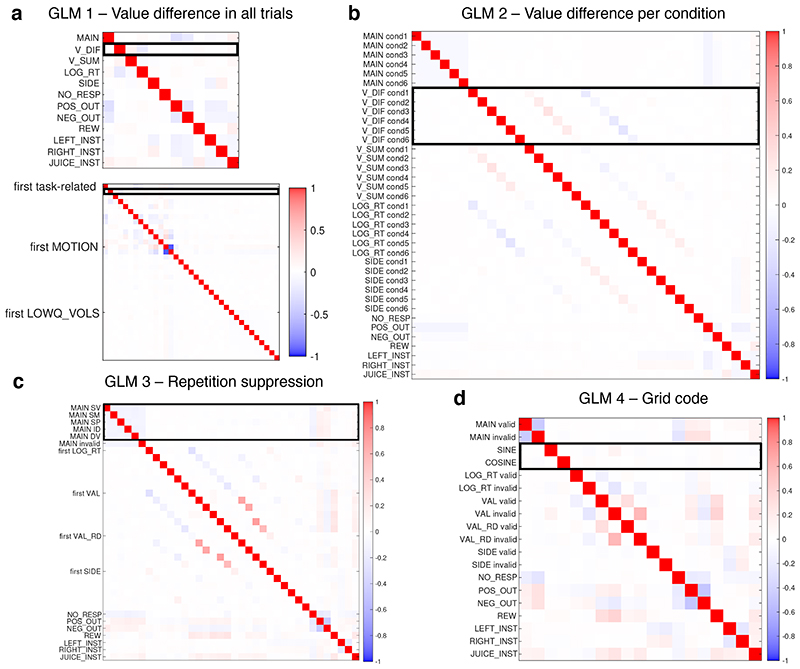
Extended Data Fig. 3. FMRI design matrices.
Correlations among task-related regressors (averaged across sessions) in all GLMs. Additionally, for GLM1 (a, bottom) the thirteen motion regressors and the first ten low-quality volume regressors are also illustrated. For all other GLMs, these regressors are not illustrated. Black line: regressors of interest. (a) GLM1: experiment 1 decision task, value comparison analysis, all trials. (b) GLM2: experiment 1 decision task, value comparison analysis, trials divided by condition depending on familiarity and dimensionality. There are six copies of each decision-related regressor. (c) GLM3: experiment 2 single-option task, repetition suppression analysis. There are six copies of each decision-related regressor, one per condition depending on the preceding stimulus. (d) GLM4: experiment 2 single-option task, grid-code analysis. There are two copies of each decision-related regressor: valid and invalid trials. Correlations here shown for 6-fold modulations of the BOLD signal; they were similar for other periodicities (4 to 8 fold), as well as for the two halves of the phase consistency design.

